Is Overgrazing Really Influencing Soil Erosion?


1
Interdisciplinary Research Department—Field Science, Alexandru Ioan Cuza University of Iași, St. Lascăr Catargi 54, 700107 Iași, Romania
2
College of Humanities, Arts and Social Sciences, Flinders University, GPO Box 2100, Adelaide, SA 5001, Australia
Water 2018, 10(8), 1077; https://doi.org/10.3390/w10081077
Submission received: 20 July 2018
/
Revised: 10 August 2018
/
Accepted: 10 August 2018
/
Published: 13 August 2018
(This article belongs to the Special Issue Soil Erosion by Water)
Abstract
:Soil erosion is a serious problem spread over a variety of climatic areas around the world. The main purpose of this paper is to produce gully erosion susceptibility maps using different statistical models, such as frequency ratio (FR) and information value (IV), in a catchment from the northeastern part of Romania, covering a surface of 550 km2. In order to do so, a total number of 677 gullies were identified and randomly divided into training (80%) and validation (20%) datasets. In total, 10 conditioning factors were used to assess the gully susceptibility index (GSI); namely, elevation, precipitations, slope angle, curvature, lithology, drainage density, topographic wetness index, landforms, aspect, and distance from rivers. As a novelty, overgrazing was added as a conditioning factor. The final GSI maps were classified into four susceptibility classes: low, medium, high, and very high. In order to evaluate the two models prediction rate, the AUC (area under the curve) method was used. It has been observed that adding overgrazing as a contributing factor in calculating GSI does not considerably change the final output. Better predictability (0.87) and success rate (0.89) curves were obtained with the IV method, which proved to be more robust, unlike FR method, with 0.79 value for both predictability and success rate curves. When using sheepfolds, the value decreases by 0.01 in the case of the FR method, and by 0.02 in the case of the success rate curve for the IV method. However, this does not prove the fact that overgrazing is not influencing or accelerating soil erosion. A multi-temporal analysis of soil erosion is needed; this represents a future working hypothesis.
1. Introduction
Soil erosion became a worldwide issue with regard to the material losses associated (reduction of soil fertility and cultivated areas) with this phenomenon [1]. Among the most common types of erosional processes, we can distinguish erosion by water [2], wind erosion [3], and harvest erosion [4]. At a European level, significant research is conducted to assess [5] and reduce [6] the negative effects of soil erosion. One of the most erosive processes acknowledged for water erosion is gullying [7].
In this study, we will refer to the gully erosion susceptibility mapping based on a GIS approach and using two statistical models in a catchment with an area of 550 km2 from the northeastern part of Romania; besides the normal conditioning factors, grazing was added as a conditioning factor. Gully erosion can be defined as an erosion process in which deep channels are generated by runoff water removing topsoil to a certain depth [8]. Once the gully channels are formed, the process of growing is very fast; this is also induced by the local environmental factors, climate, and land use changes [9].
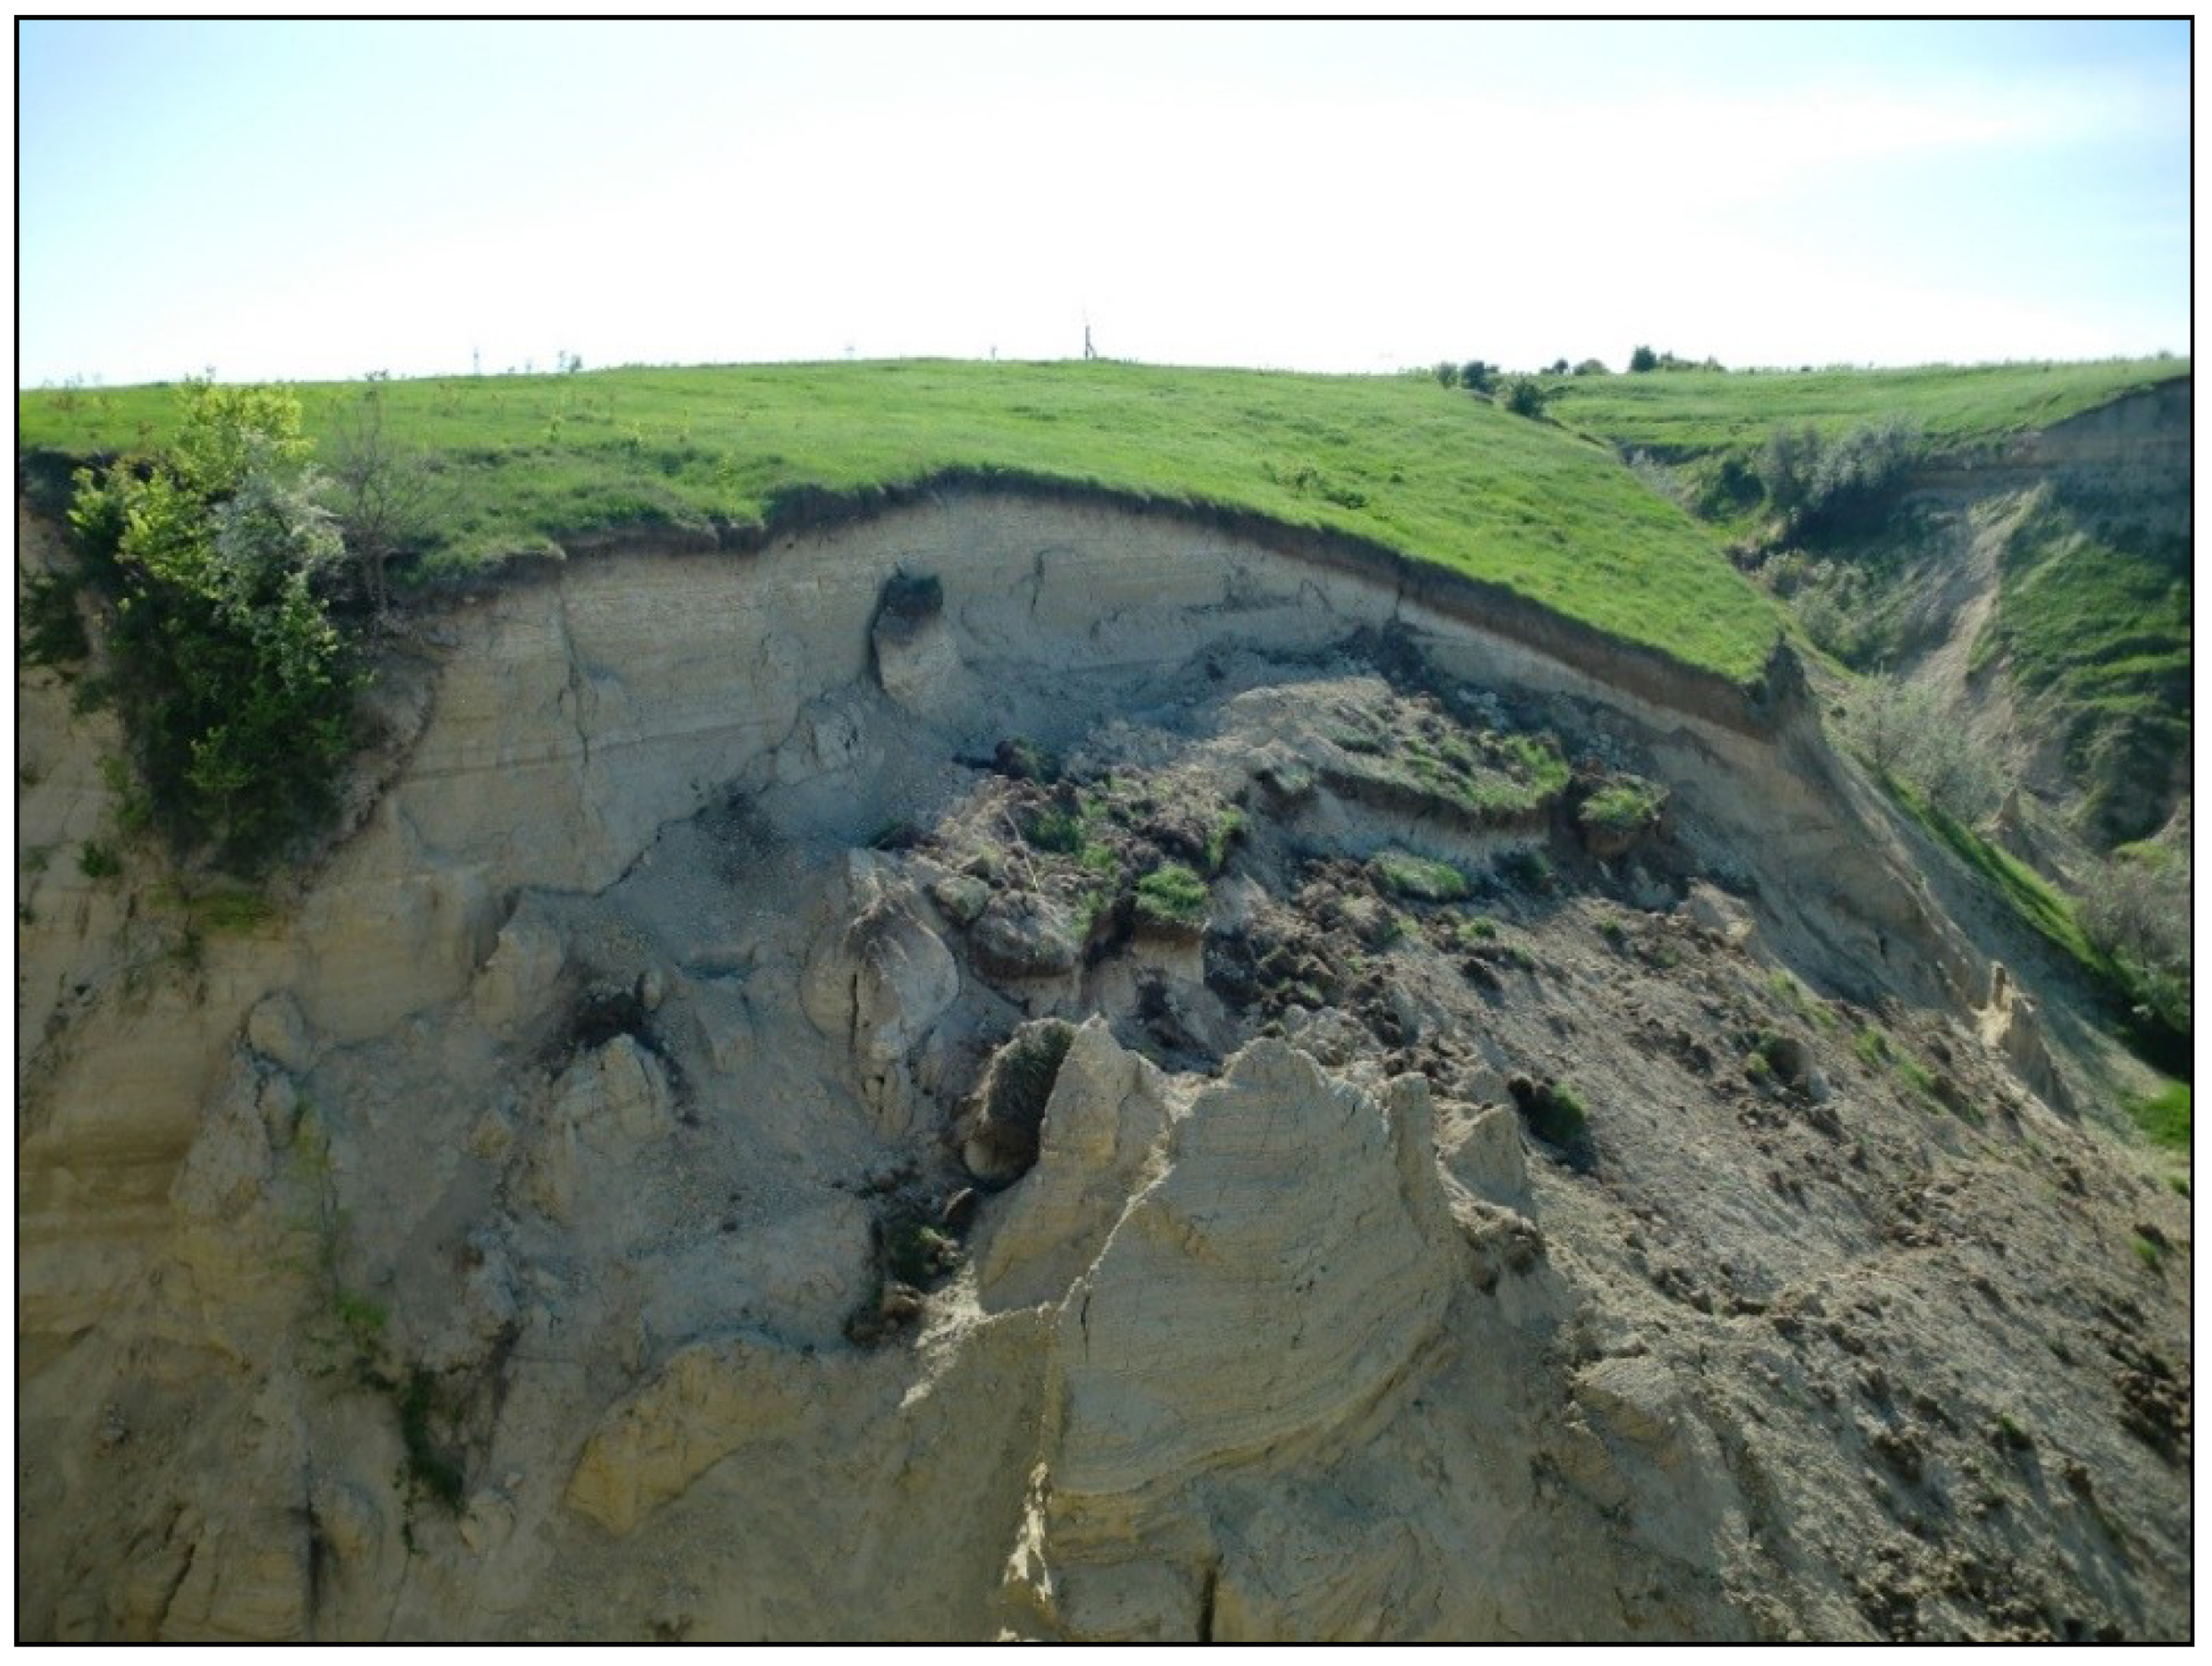
Gully erosion represents one of the most erosive processes worldwide and leads to significant land degradation for agricultural lands, sedimentation of adjacent rivers and lakes, loss of livelihoods, and property damage [10,11]. Many studies around the world from numerous climatic areas have approached this process of trying to understand the triggering factors [12,13] and future development: sub-tropical [14], semi-arid [15], arid [16], continental [17], temperate-continental [18,19], Mediterranean [20]; as the variability of climate has been acknowledged to have a significant control on gully erosion on a global scale [7]. Gullies have become such an important subject of study not only for scientists, but also for tourists; they are a significant part of the landscape in which they develop and evolve, in this way, they become geomorphosites [21]. Through their evolution, they can create temporal (Figure 1) or permanent spectacular landforms; in this way, the aesthetic value increases and they become more significant to be studied by geomorphologists.
Over the last few years, statistical modelling for gully erosion has encountered an upward trend; whether employing one or more statistical models to determine gully erosion susceptibility, many authors are evaluating gully erosion susceptibility based on some local environmental factors and the weights derived from each method: the information value (IV) method [22], logistic regression [23], multivariate adaptive regression splines (MARS) [24], weights of evidence (WOE); frequency ratio (FR) [25], and index of entropy (IOE) [8].
Located in the eastern part of Europe, Romania is well known for its degraded lands [26] and high gully erosion potential; a few studies refer to the conditions of gully initiation, development, and monitoring [27,28,29,30,31]. Gullying has been identified as the process with the highest sediment source, and summarises 26.4% of the total erosion processes in Romania [28]. In order to correlate gully erosion initiation, it is needed to envisage areas where further gully development will occur or new gullies might initiate [23], adding a factor that has been neglected until now; overgrazing, this being one of the main purposes of this paper.
However, there is only one study that employs statistical modelling to gully erosion in Romania; the study was made to predict gully erosion in the southern part of Romania [32]. Taking into consideration the high potential of gully erosion in the northeastern part of Romania, this study comes to fill the gap, by employing statistical modelling to gully erosion susceptibility. High and very high susceptible areas will be correlated to the negative effects on the cultural heritage of the area (107 Neolithic sites). At an international level, there is a limited number of studies that tackle this issue [31,33]. This study comes as a necessity in an area with a very high potential to soil erosion and with a tradition of sheep breeding; obtaining quantitative data and locating the precise areas that have a high and very high susceptibility to gully erosion will help local authorities and stakeholders in hazard mitigation, a proper management of soil and water resources, and mitigation towards the rich cultural heritage of the area. Therefore, the specific objectives of this study are (1) spatially predict the gully erosion in the Bahluieț river basin; (2) employing two statistical models, FR and IV; (3) to evaluate the final susceptibility maps performance by using ROC curves; (4) to analyse the final susceptibility maps with and without the overgrazing as a conditioning factor; (5) to determine the number of Neolithic sites located in areas with high and very high susceptibility to gully erosion; and (6) to investigate the final susceptibility maps in the framework of big infrastructure projects (A8 motorway).
Europe’s cultural heritage is in danger from natural hazards [34] and anthropic interventions [35]; the cultural heritage from the northeastern part of Romania is no exception [19,36,37,38,39]. However, significant efforts are made every year in order to highlight the importance of Neolithic sites in establishing the Romanian identity and to promote them from a tourism point of view [40]. Besides the approach towards cultural heritage, the final maps will be analysed as a possible working direction in order to reduce time and money for one of the biggest infrastructure projects from the northeastern part of Romania—the A8 motorway.
Two working scenarios will be made; in the first one, the final gully susceptibility index (GSI) will be assessed using all the conditioning factors, and the second scenario will involve realising the final GSI by adding the sheepfold density as a conditioning factor.
2. Materials and Methods
2.1. Study Area and Archaeological Background
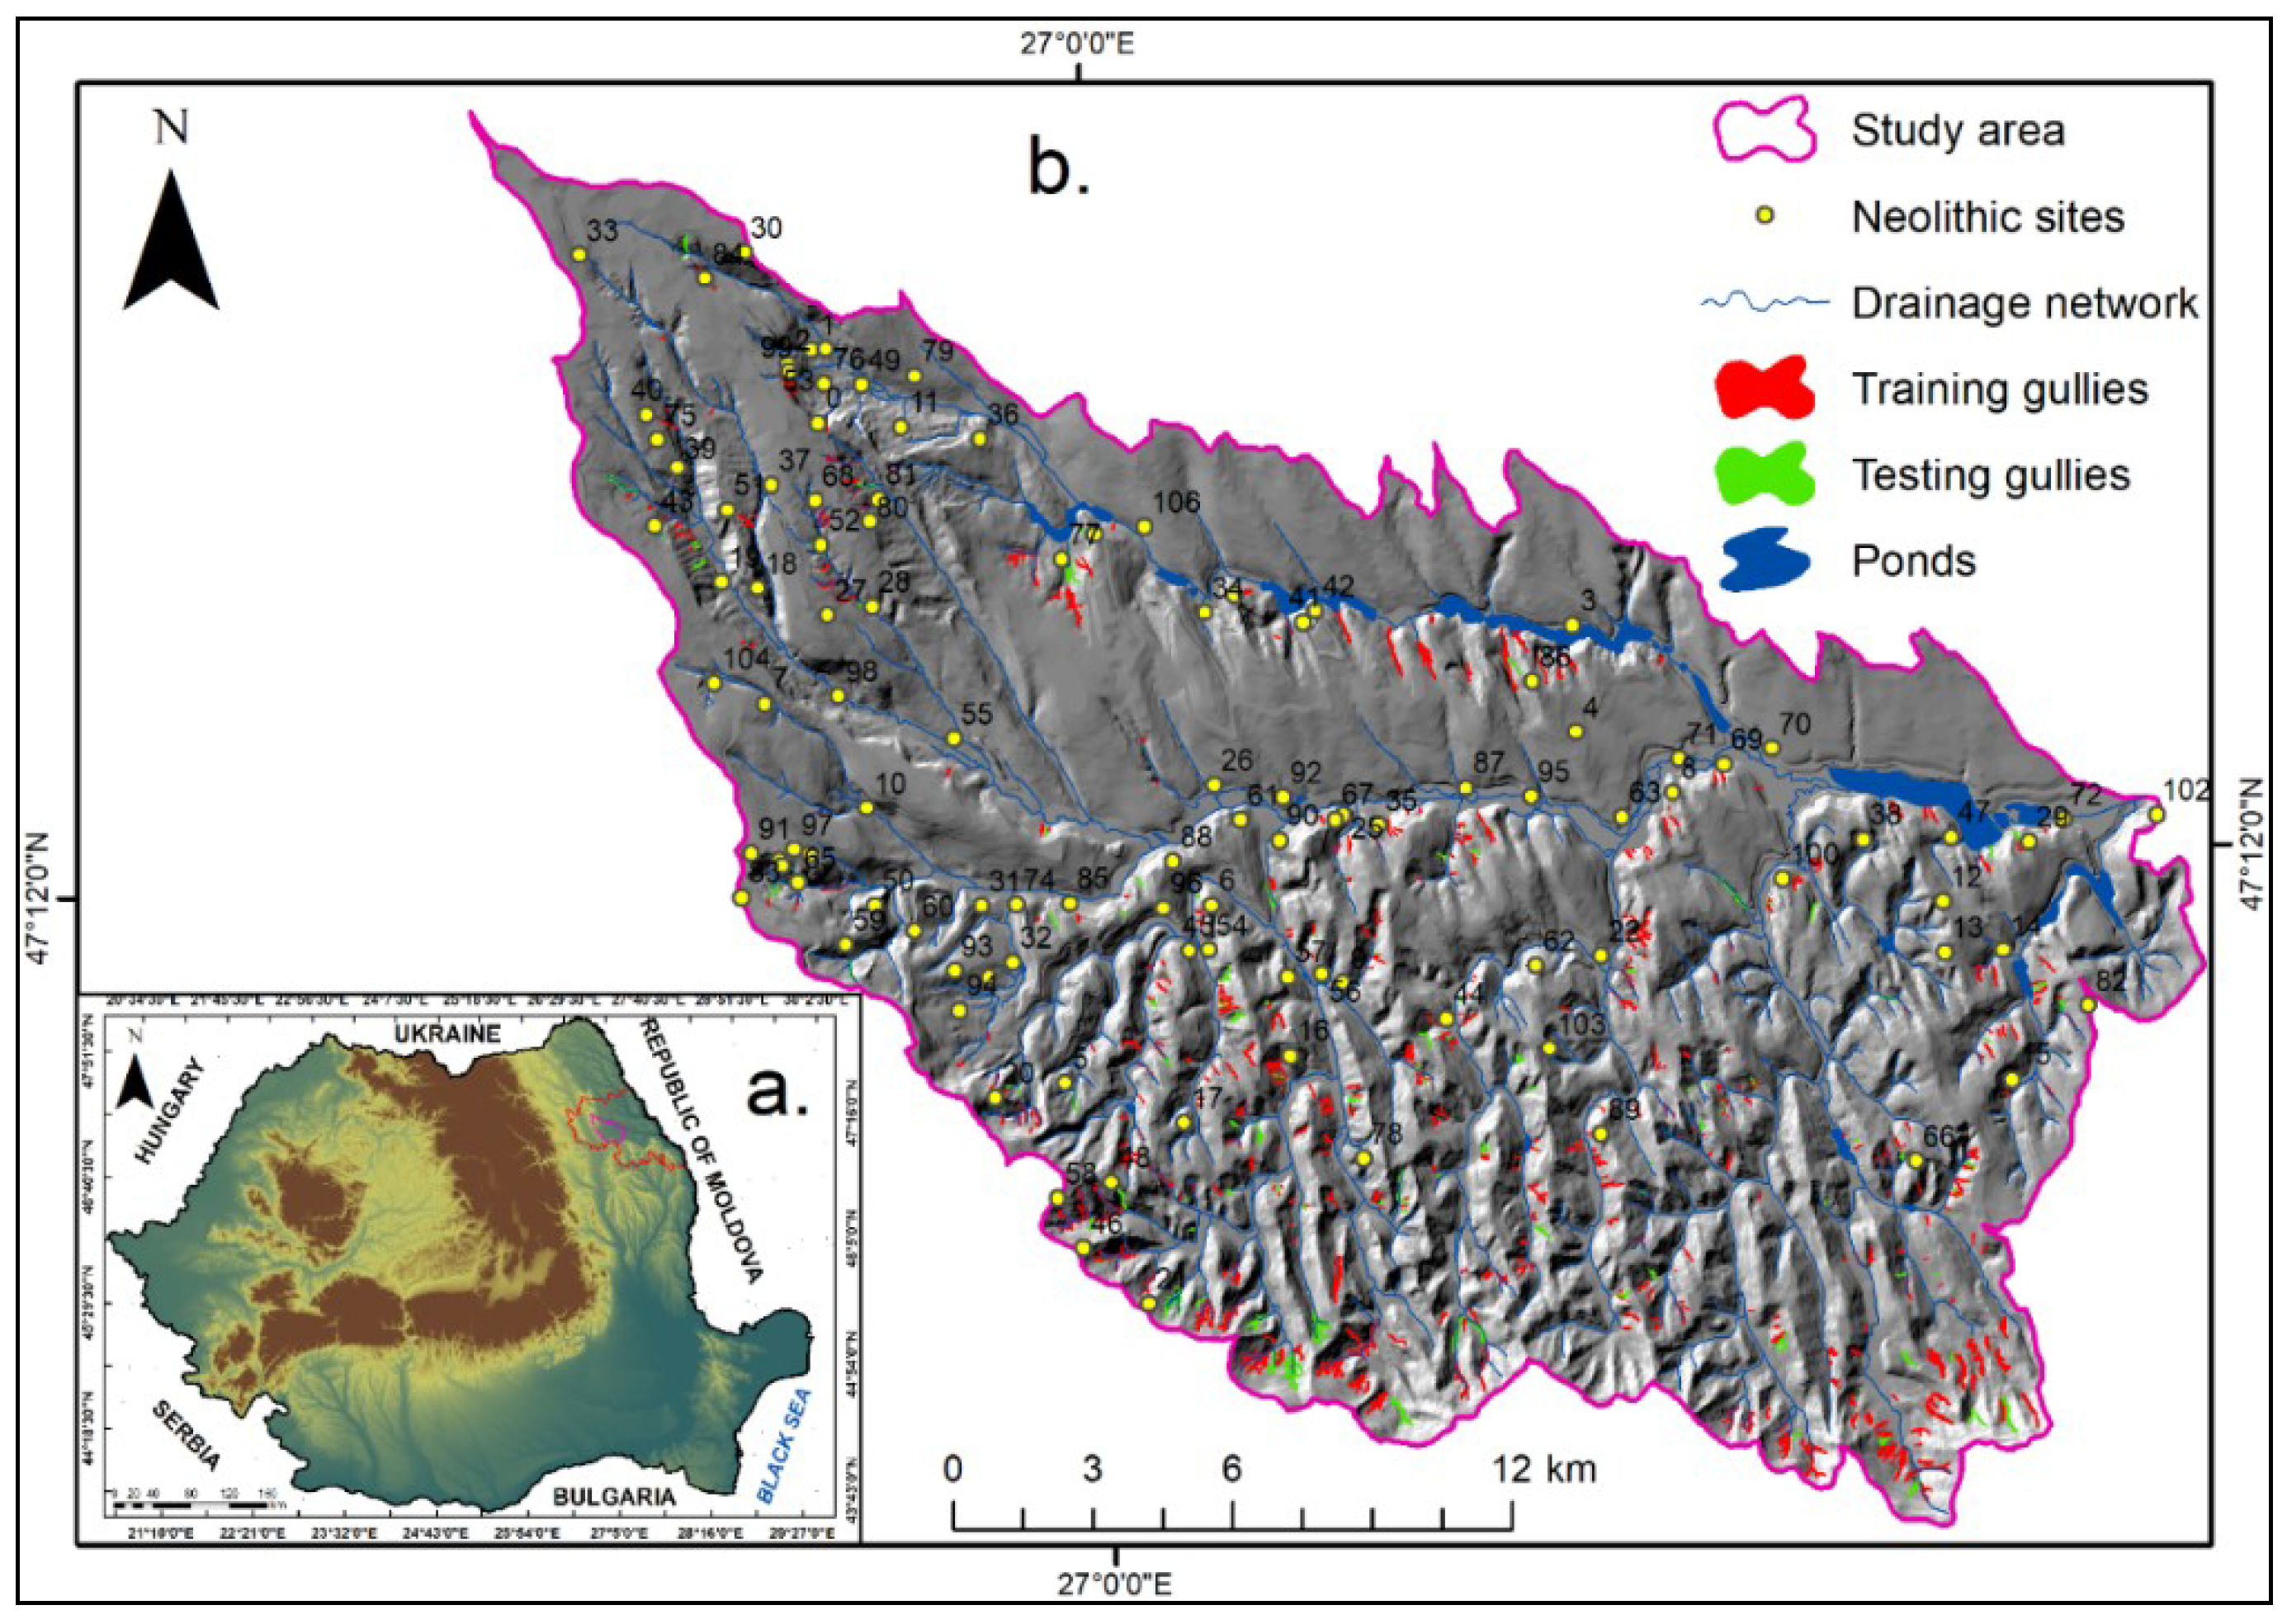
Bahluieț catchment is located in the northeastern part of Romania (Figure 2a) and has a surface of 550 km2. It is a right side tributary of Bahlui River (catchment surface 2023 km2), one of the most important rivers in this part of the country. Bahluieț River has a length of 50 km, a sinuosity coefficient of 1.23, an average slope of 13%, and average catchment altitude of 163 m a.s.l. [41].
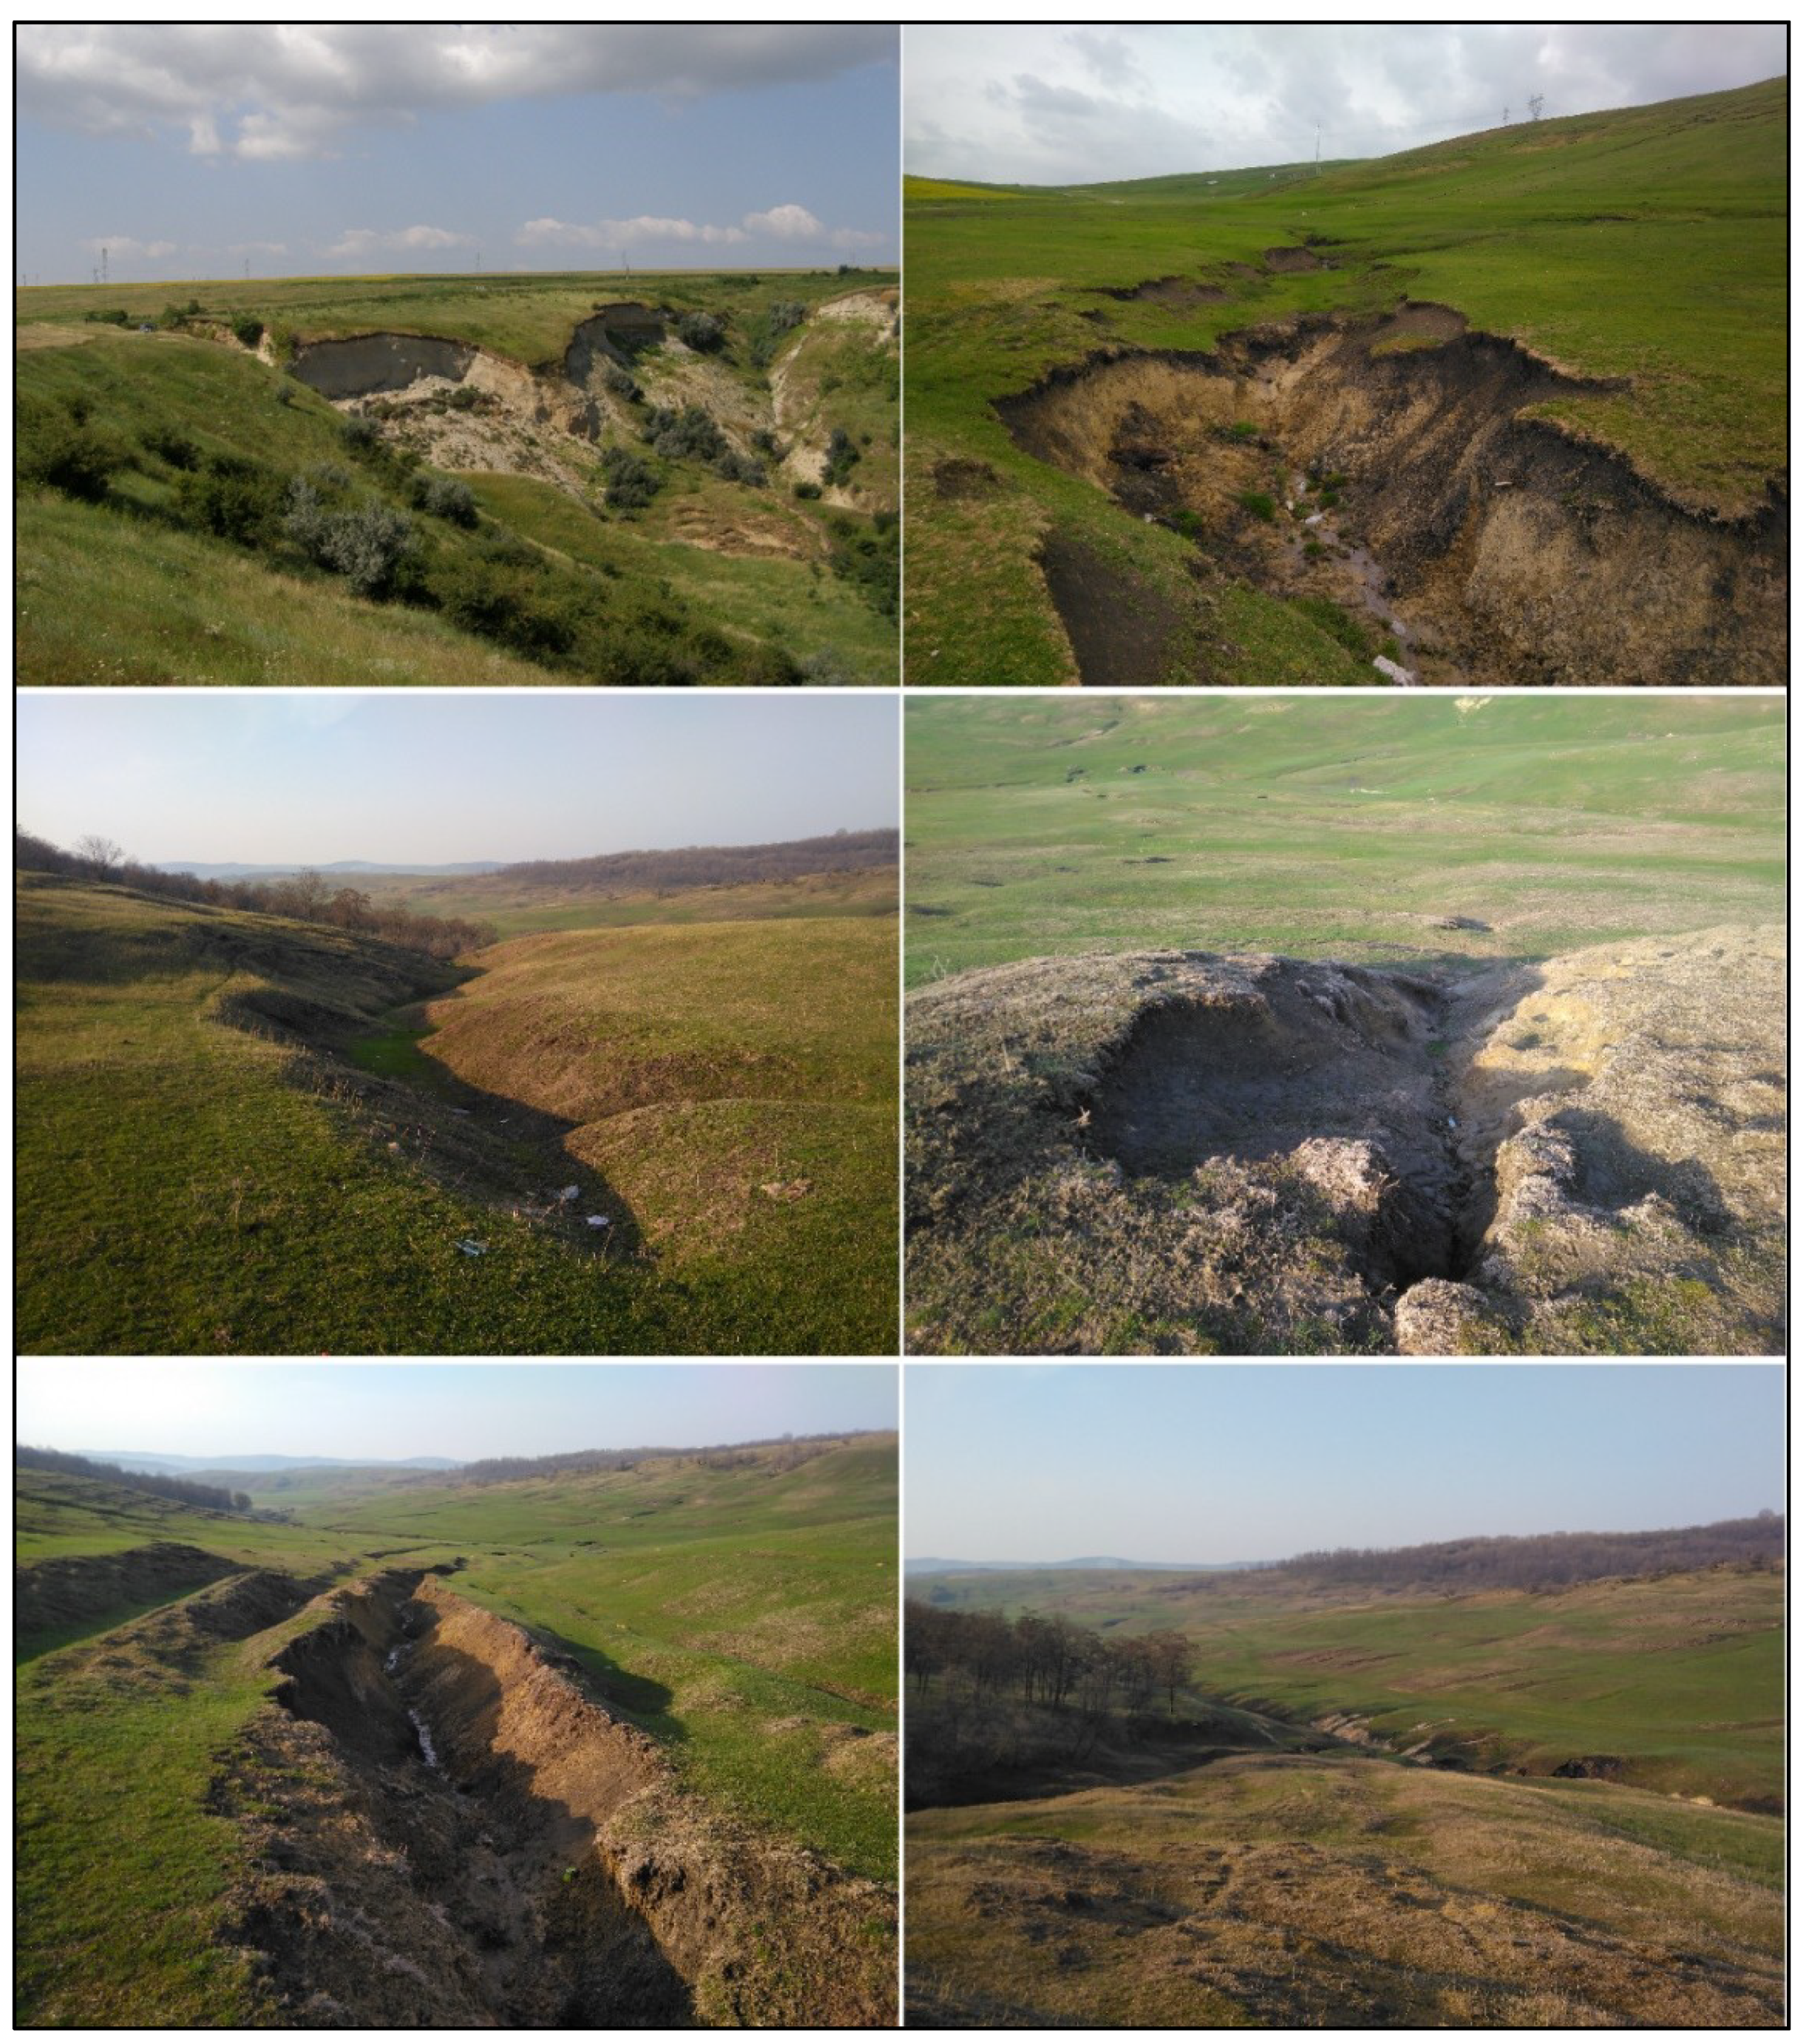
The lithological setting of the area is characterised by non-cohesive deposits of Bessarabian age (an alternation of marls, clays with intrusions of sand, and oolithic limestone); the fine granulation of these lithological deposits led to the triggering and developing of geomorphological processes, especially gullying (Figure 3). More details regarding the geomorphic characteristics of this area can be found in the literature [35,36,37,38,39].
Cucuteni culture is one of the most representative prehistoric cultures from Eastern Europe and is part of the well-known Cucuteni–Ariușd–Trypillia Cultural Complex (approximately 350,000 km2). Compelling all the Neolithic sites from the databases of the National Archaeological Registry (RAN), the National Heritage Institute (INP), the Institute of Cultural Memory (cIMEC), and field expeditions with archaeologists, resulted in a total number of 107 Neolithic sites (Figure 2b); our efforts were to index as many sites as possible in order to have a complete archaeological inventory. Neolithic sites from this part of the country have a high density and represent one of the most iconic archaeological assets from the northeastern part of Romania.
2.2. Methodology
2.2.1. FR Method
FR method represents a quantitative and recognised method to generate gully erosion susceptibility maps with high accuracy [25]. The main principle of this method is that future gullies will occur in places with the same geographical conditions as those in the past; the method is based on the observed relationship between the distribution of gullies and individual gully-induced factors. In order to determine the frequency ratio for each factor class (with the help of Equation (1)), the ratio between gully occurrence and non-occurrence was calculated.
where E is the number of pixels with the landslide for each factor, F is the total number of gullies, M is the number of pixels in the class area, and L is the total number of pixels [25]. The weights of each factor were obtained and by summarising their weights, the gully susceptibility index (GSI) was calculated with the following equation (Equation (2)):
where FRi represents the frequency ratio for each factor, and FR represents the area where the gullies occurred.
FR = (E/F)/(M/L)
GSI = ΣFRi
2.2.2. IV Method
IV method is a bivariate statistic approach that was introduced for the first time by van Westen [42]. It is widely used in studies to calculate gully erosion susceptibility; the method is recognised for its simplicity and robustness is recommended for large areas and where the spatial data is limited [43]. The basic principle of this method is the distribution of gullies in each factor class and is calculated with the help of the following equation:
where IV is the weight of a certain class i of factor j; Fij represents the gully density within class i of the factor j; F represents the total gully density in the area of interest; Lij is the number of gullies in a certain class i of the factor j; LT represents the total number of gullies; Pij is the number of pixels in a certain class i of factor j; and PL represents the total number of pixels in the study area. Each conditioning factor was combined with the gully map, in this way the weighting value (IV) was obtained for each parameter class (Table 1, column 7). Positive values show a high incidence of gully occurrence, while negative values are associated with a very low probability of gully occurrence.
IV = ln(Fij/F) = ln((Lij /LT)/(Pij/PL))
In order to follow the evolution of the Băiceni-Cucuteni gully, a series of old maps [35,36] were used, along with a Leica GPS 1200 System in RTK (Real-Time Kinematic) mode; the surveys were made to determine whether the mitigation measures had a positive effect on the gully evolution. The last surveys were conducted in May 2018.
2.3. Combining Spatial Data
Gully Inventory Map and Conditioning Factors
A complete and precise gully inventory map is the key to produce high-quality gully erosion susceptibility maps, as well as to calibrate and validate the final susceptibility models. As there are no gully inventories available in Romania, or for the study area, a complete inventory was made using topographic maps, Google Earth images, and field investigations. Gullies were manually digitised as polygons; it resulted that only 0.9% of the study area is affected by landslide processes. From the total number of 677 gullies, 542 gullies (80%) were randomly selected for model training, and the remaining 135 gullies (20%) were used to test the model’s performance (Figure 2b). The total number of 107 Neolithic sites was compiled from the available databases, and field trips with archaeologists.
During the digitisation process, it was observed that gully erosion is closely related to another process—landslides. Many gullies are initiated by the unconsolidated deposits of the landslides; therefore, there are higher chances of gully triggering around landslides. Out of the total number of 677 gullies, 457 gullies intersect with a landslide (there is a total of 764 landsides) [39]. In order to realize the final susceptibility maps, a set of ten environmental factors were used; namely, elevation, precipitations, slope angle, curvature, lithology, drainage density, topographic wetness index, landforms, aspect, and distance from rivers. To these ten conditioning factors, we have added sheepfolds as a conditioning factor. We try to figure out if overgrazing is influencing the final GSI and if better validation results are obtained in this way.
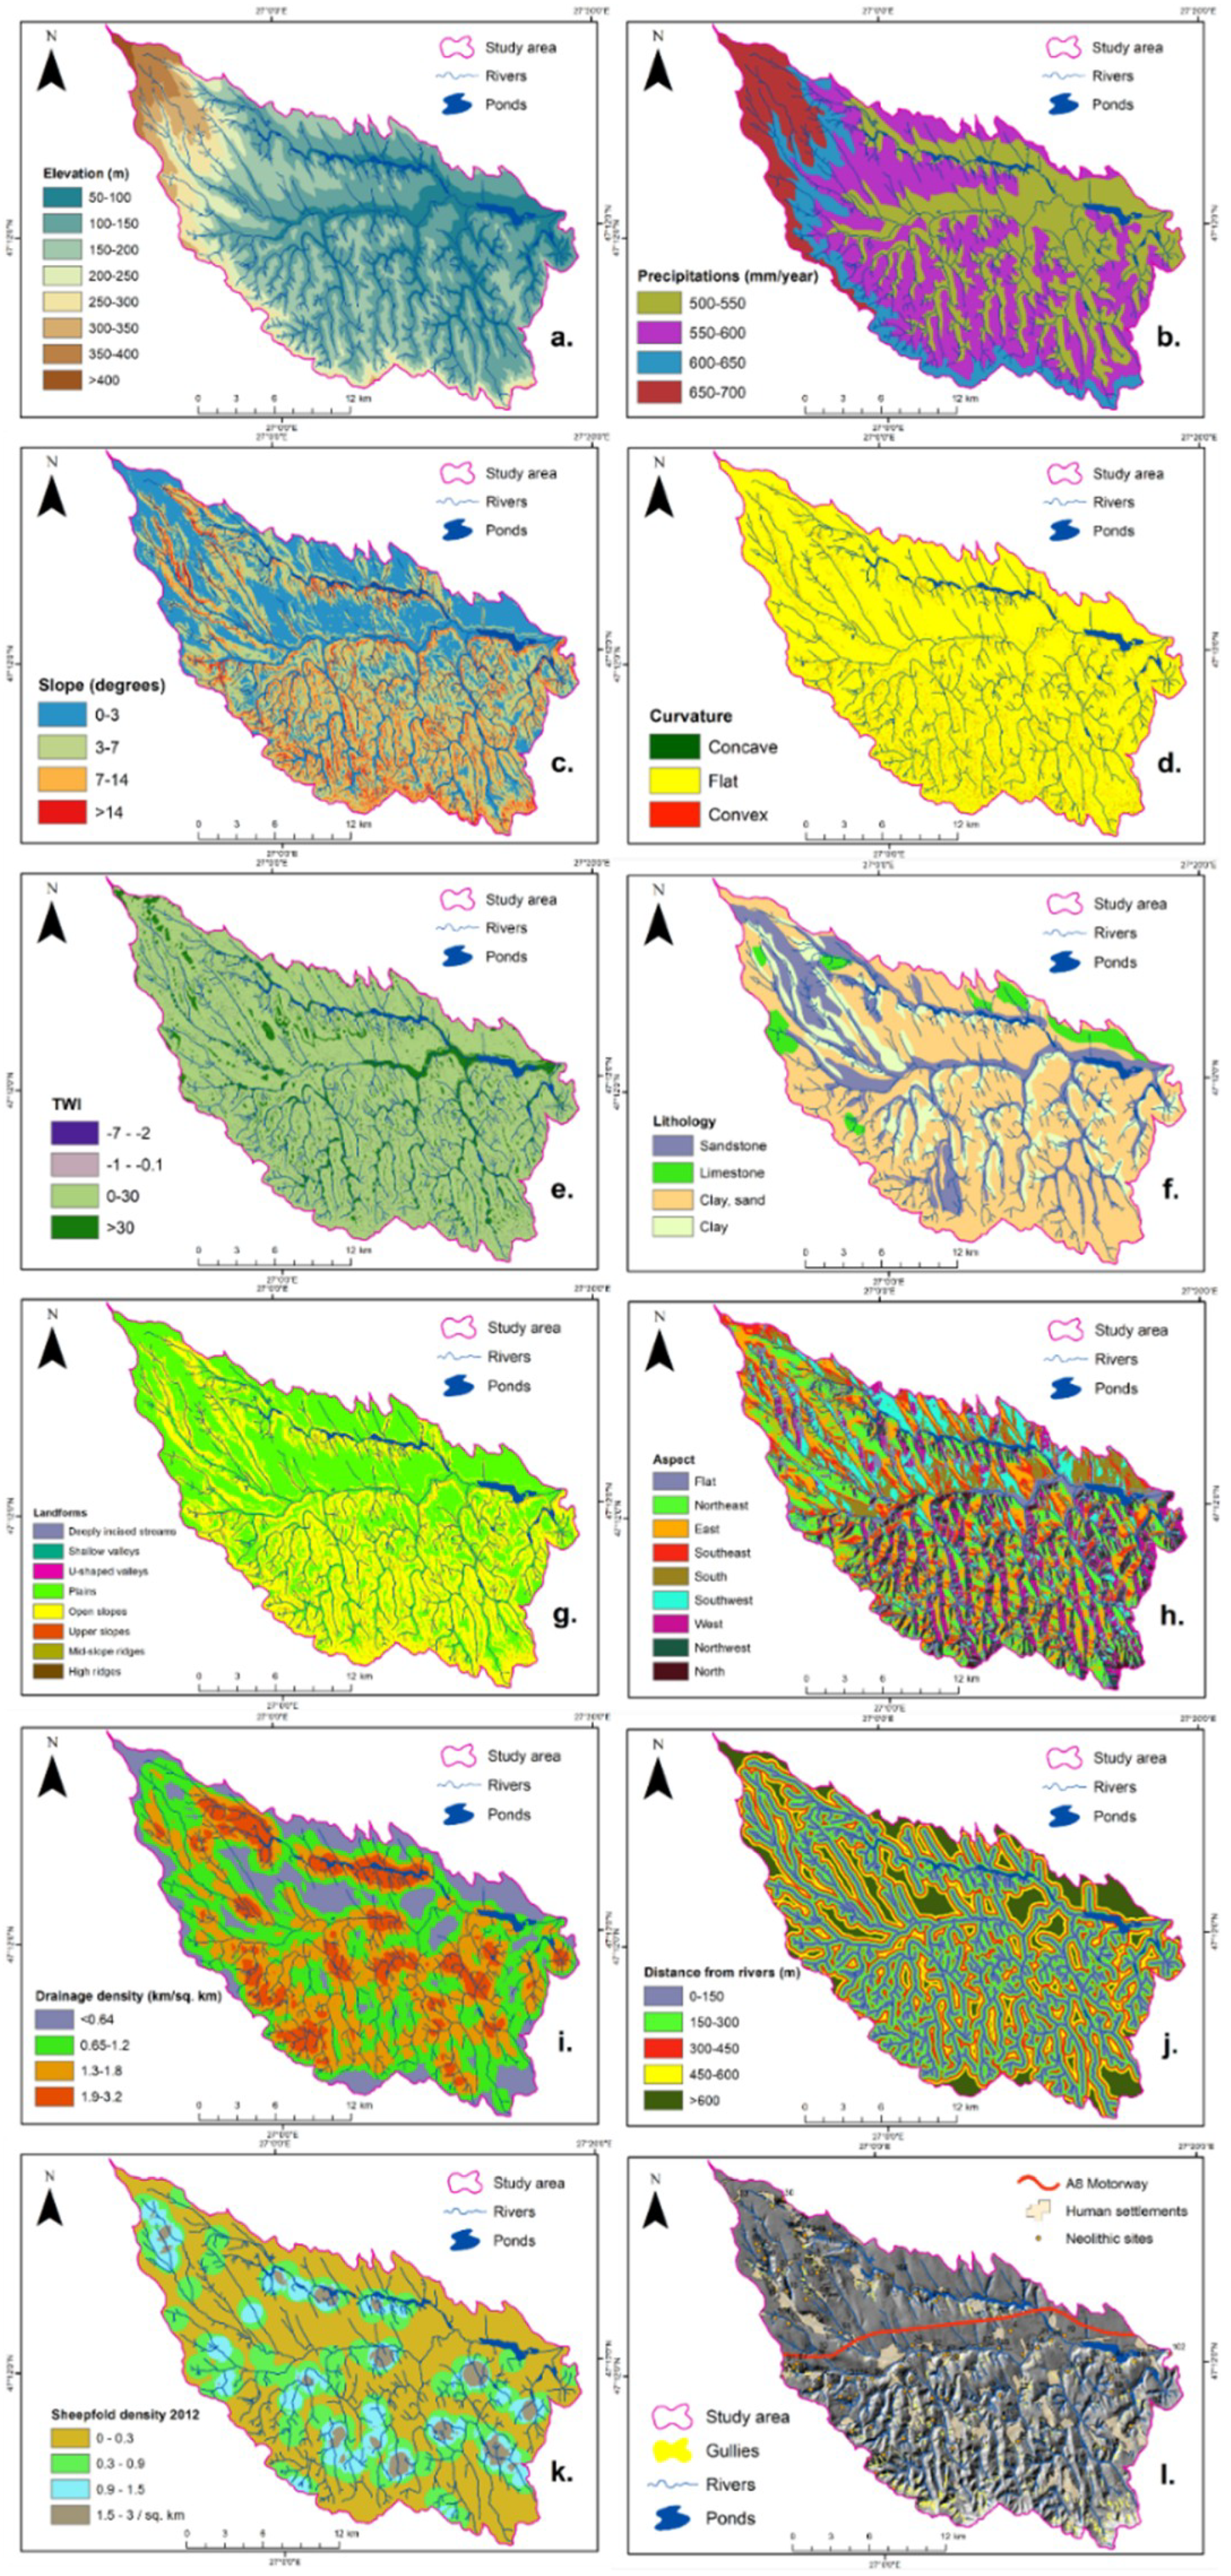
Elevation represents a widely used conditioning factor in gully susceptibility analysis [25,43]. Within the study area, this parameter was obtained from the digital elevation model (5 × 5 m/pixel) and reclassified into eight classes using natural breaks (Jenks), as follows: 50.2–100, 100–150, 150–200, 200–250, 250–300, 300–350, 350–400, and >400 m (Figure 4a). A high incidence of gullies is encountered in the elevation class 200–250 m.
Precipitations—the distribution of precipitation regulates the soil’s water content and is a significant factor in calculating gully erosion susceptibility. In the study area, the values of this parameter have been concluded according to [41], and distributed into four classes (mm/year) (Figure 4b); 500–550, 550–600, 600–650, and 650–700. The precipitation class with the highest probability of contributing to gully erosion is 600–650 mm/year.
Slope angle is considered to be one of the most important factors when it comes to slope stability, being frequently used in preparing gully erosion susceptibility maps [25]. This parameter is derived from DEM (Digital Elevation Model) with the help of ArcGIS Spatial Analyst Tools. In the study area, the slope was divided into four classes 0–3, 3–7, 7–14, and >14 (Figure 4c).
The curvature is defined as the rate of change of slope gradient in a particular direction; the values represent the morphology of the topography [44]. Negative curvature represents concave, zero curvature represents flat, and positive curvature represents convex areas; therefore, the map was classified into three classes (Figure 4d).
Topographic wetness index (TWI) represents the effect of topography on the size and location of saturated source areas of runoff triggering; this parameter was developed in a rainfall-runoff model named TOPMODEL [45]. The soil moisture affects the material on the slopes, thus diminishing soil stability. It is a common factor used in gully erosion susceptibility studies [8]. Within the study area, the topographic wetness index was calculated and classified into four classes −7–−2, −1–−0.1, 0–30, and >30 (Figure 4e).
The lithology factor is a significant variable in the analysis of natural hazards, but especially for gully erosion; the characteristics of lithological units have distinct gully erosion susceptibility values, and thus represent the base on which gullies are occurring [25]. The lithological units were extracted from the soil maps, scale 1:10.000, and comprises four main lithological classes: sandstone (20.42%), limestone (4.11%), clay and sand (60.06%), and clay (15.41%) (Figure 4f).
The landforms parameter was derived with the help of ArcGIS—Topography Tools [46]. The main landforms calculated with the help of ArcGIS are plains (52%), followed by open slopes (45%), U-shaped valleys (1.3%), upper slopes (1.2%), deeply incised streams (0.06%), high ridges (0.04%), shallow valleys, and mid-slope ridges (0.001%) (Figure 4g). The landforms with the highest probability of contributing to gully erosion are the U-shaped valleys, mid-slope ridges, deeply incised streams, and open slopes.
Slope aspect represents another important factor in estimating gully erosion susceptibility; the slope aspect has a direct influence on gully erosion because it controls the vegetation cover, sunlight exposition, moisture, and evapotranspiration [25,47]. Dominant in the area are north-facing slopes and flat areas (Figure 4h).
Drainage density is another important factor in assessing gully erosion susceptibility [8,25]; high values of this parameter are associated with large surface runoff ratio. This parameter was calculated using the line density tool in ArcGIS and reclassified into four classes as follows <0.64, 0.65–1.2, 1.3–1.8, and 1.9–3.2 km/km2 (Figure 4i).
Distance from rivers parameter is a significant conditioning factor because streams decrease slope stability by erosion of slopes and facilitate the evacuation of the eroded material from upslope areas [25,48]; in our study area, five different buffer classes were created as follows 0–150, 150–300, 300–450, 450–600, and >600 m (Figure 4j).
Another significant factor in triggering and acceleration of soil erosion processes is overgrazing [49]; there are many studies worldwide, from different geographic areas, highlighting the negative effects of overgrazing. One of the approaches is referring to the desertification [50,51], erosion of mountain pastures [52], degradation of forests [53], and so on. Many studies have discussed and documented the influence of overgrazing on the development of gully erosion [54], but none have managed to “quantify” it; an area with extensive studies is the southern part of Africa [55,56,57].
Transhumance is a very old habit of the Romanian sheep breeding community; many of them came from Transylvania during the autumn towards the rich area in grass of Moldavian Plain [58], especially within our study area. The area is known in the literature as <<Poarta Târgului Frumos>> (Târgul Frumos Gate) [59]. The number of sheepfolds has increased from 119 to 175 from 1984 until 2012. For this study, the sheepfolds were digitized as a point from the aerial images of 2012; the next step was to make a kernel point density analysis. The data were then reclassified into four classes of density as follows 0–0.3, 0.3–0.9, 0.9–1.5, and 1.5–3 sheepfolds per km2 (Figure 4k).
The A8 Motorway Târgu Mureș–Iași–Ungheni (Figure 4l) represents one of the biggest infrastructure projects aimed to connect Moldavia and Transylvania as part of the Pan-European Transport Corridors no. IV and IX; the motorway will have a length of approximately 310 km, according to the National Company for Road Infrastructure Administration (CNAIR). A significant part will transit our study area and this study may be of great importance; in Romania it is well known that many infrastructure projects are delayed because of the discovery of significant archaeological remains and of areas with a high potential of natural hazards (e.g., landslides and gully erosion).
3. Results and Discussion
FR and IV were used to calculate the GSI. The surface and distribution (%) of each susceptibility class were calculated for each method. The classes of the GSI are as follows: low, medium, high, and very high susceptibility. The method with the highest predictability rate, which is IV, was used to evaluate the number of Neolithic sites that are in danger, as well as how the future A8 motorway will further develop under the high and very high gully erosion susceptibility areas.
3.1. GSI Using FR
This method selected curvature, lithology, precipitations, landforms, and distance from rivers as being the most important when it comes to gully erosion initiation and development. In the case of curvature, high values of frequency ratio are connected to concave surfaces (0.64). When it comes to lithology, the second most important factor related to gully erosion, clay and sand are the most susceptible (0.41), followed by a clay lithology (0.29). Regarding the quantity of precipitation, high values of the frequency (0.47) are related to precipitations ranging between 600–650 mm/year class; higher values of precipitations are not necessarily related to a higher incidence of gully initiation because in this area, specifically torrential summer rains occur. Landform classes four and nine, which are U-shaped valleys and mid-slope ridges, respectively, have higher frequency ratio weights (0.33 and 0.24, respectively). The parameter distance from river shows that the highest number of gullies occur in class 0–150 m (0.40). These five factors are followed by aspect, TWI, elevation, slope angle, and drainage density. The factor sheepfold density has the same weight as the factor drainage density. High values of frequency (0.28) are in the class with 1.5–3 sheepfolds/km2.
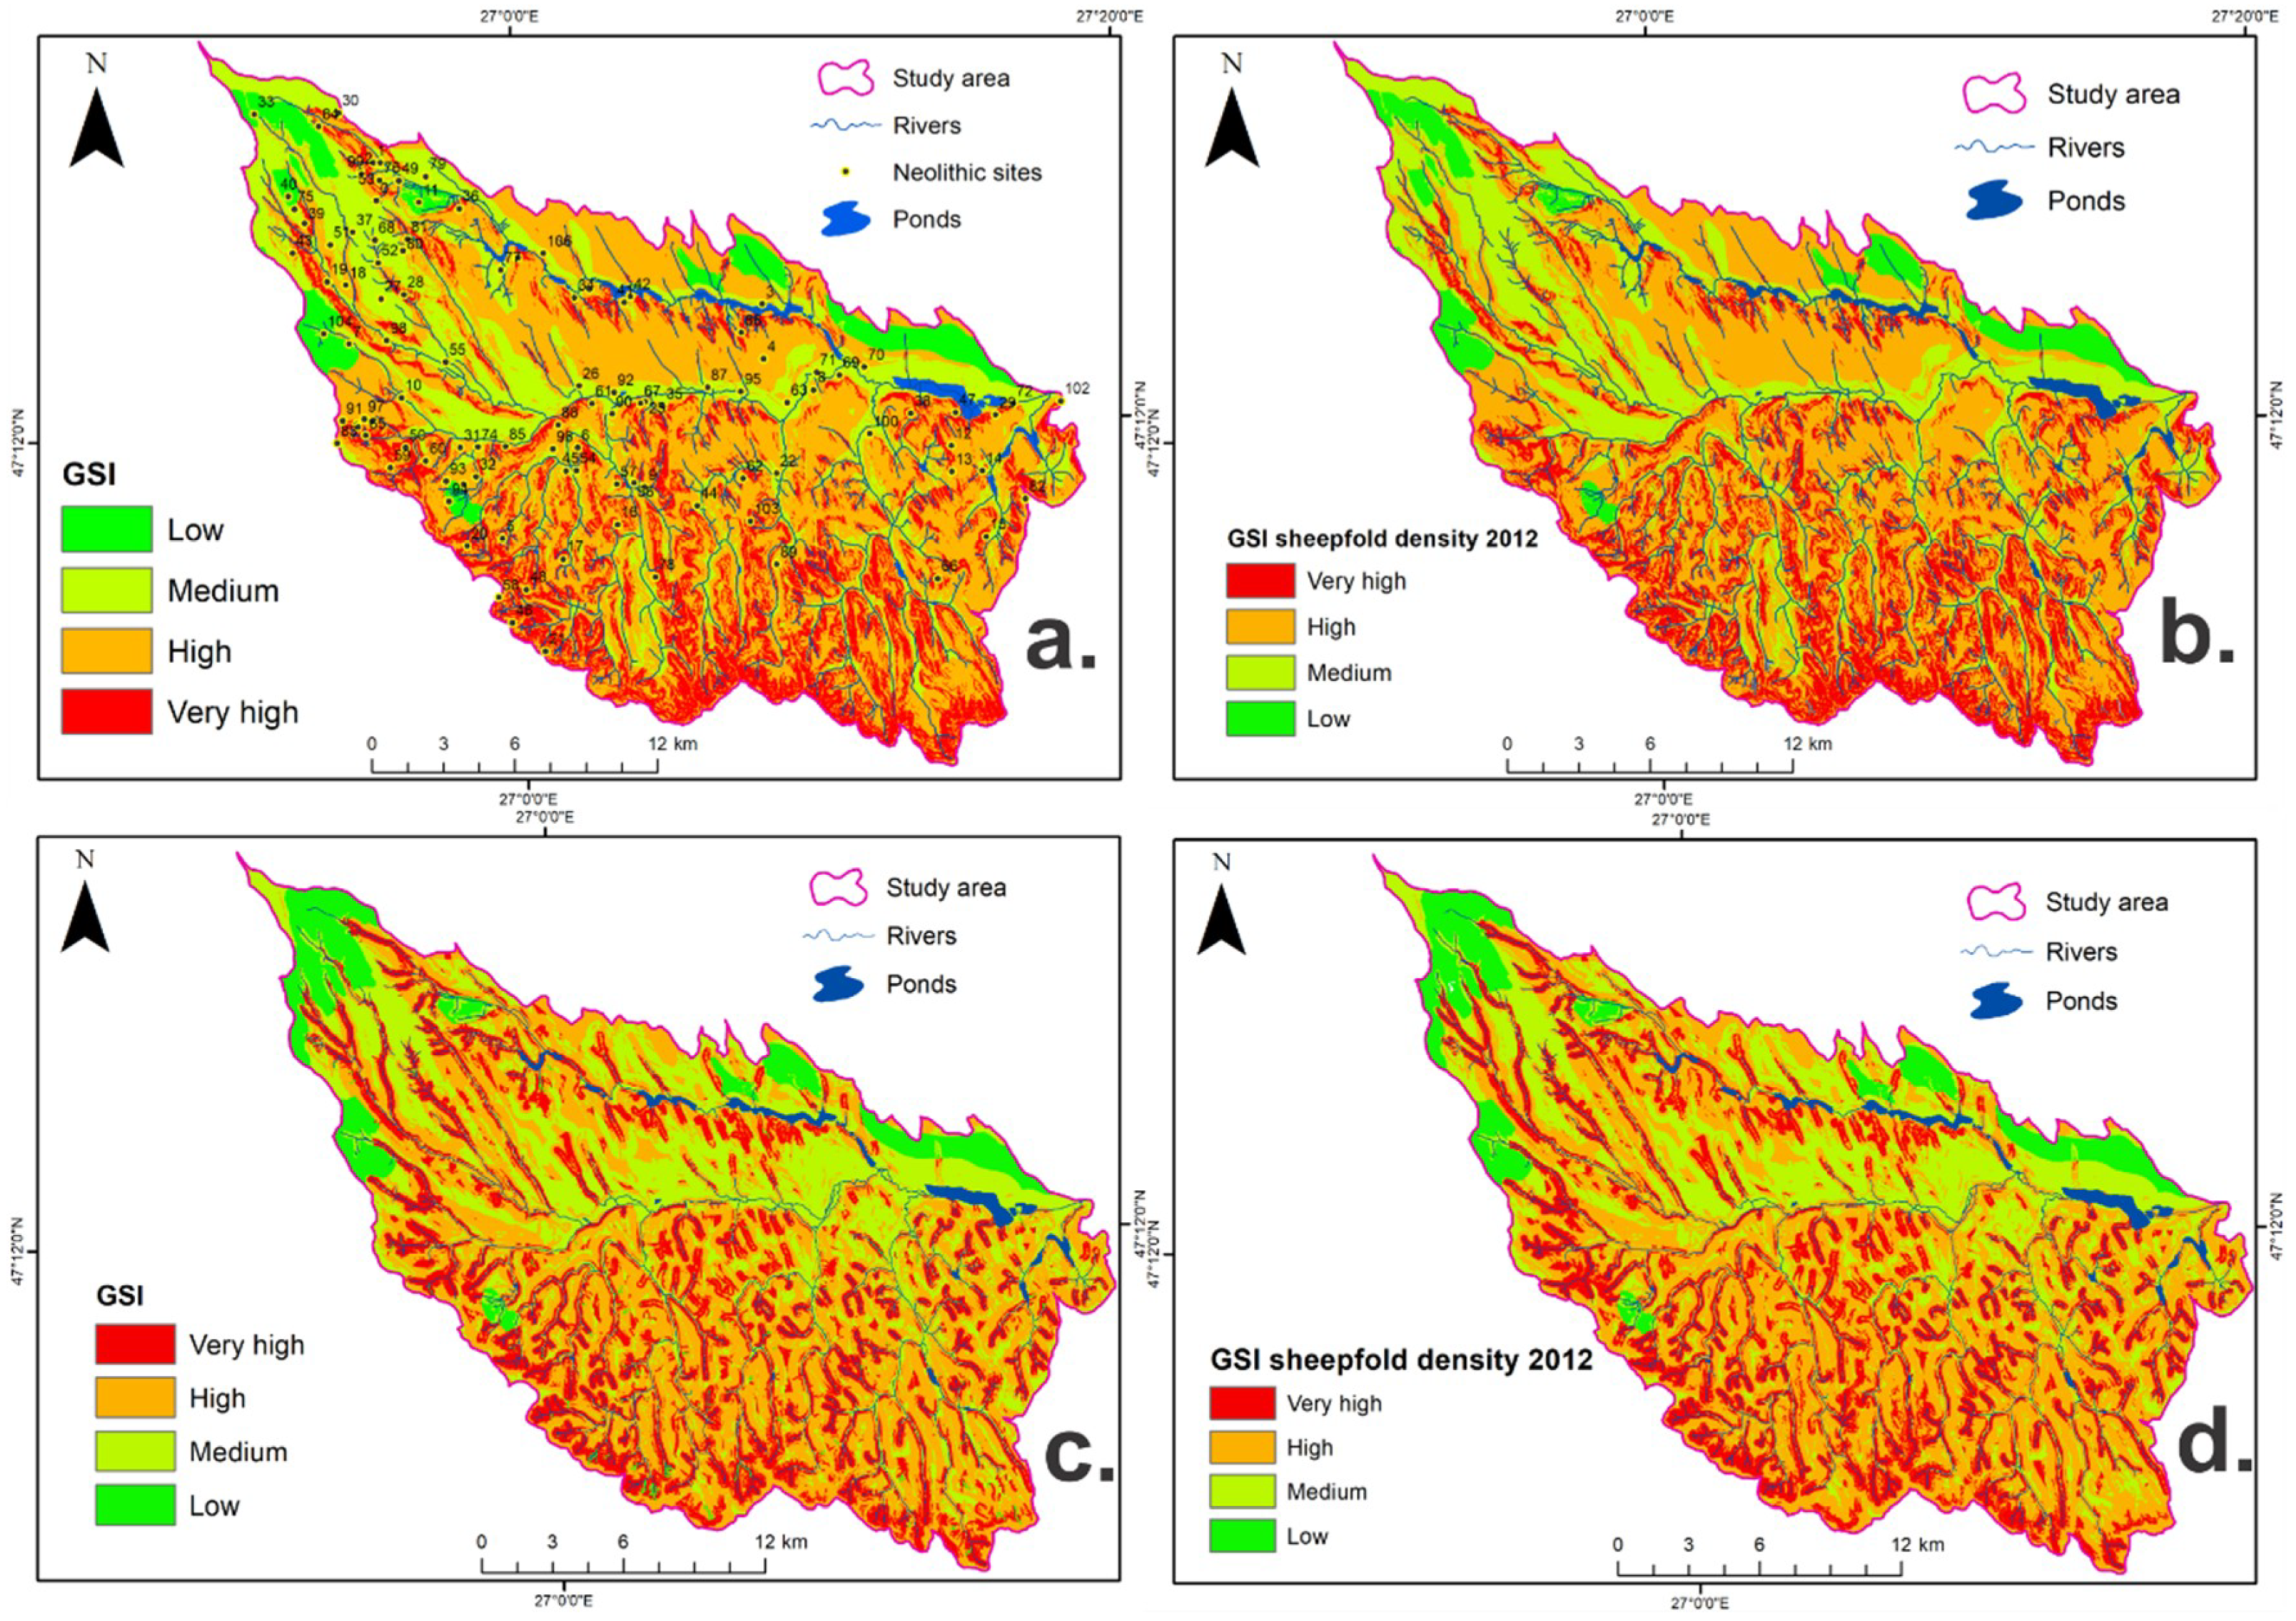
The final GSI is calculated and shown in Figure 5a. According to the gully susceptibility map developed with the help of the FR method, 18.71% (102.72 km2) of the total catchment is found under a very high susceptibility, 52.37% (287.56 km2) high susceptibility; medium and low susceptibility represent 24.03% (131.93 km2) and 4.89% (26.80 km2) from the total area, respectively. High and very high classes occupy more than half of the basin’s surface (over 70%), which is an alarming fact for the cultural heritage sites of the area. When calculating the GSI including the sheepfold density factor (Figure 5b), 19.81% (108.73 km2) of the total catchment is found under a very high susceptibility, 51.45% (282.5 km2) with high susceptibility; however, medium and low susceptible classes represent 23.87% (131.06 km2) and 4.87% (26.72 km2) from the total area, respectively. As can be observed, there are no significant differences between the maps and percentages when we added sheepfold density as a conditioning factor.
3.2. GSI Using IV
The relation of each gully erosion conditioning factor and its spatial relationship with gully triggering is shown in Table 1, column 7. A positive value indicates a high correlation between the class factor and gully erosion phenomena, while negative values highlight a very low correlation with gully erosion phenomena. High values are related to the following conditioning factors: landforms (U-shaped valleys—0.753, mid-slope ridges—0.573, canyons and deeply incised streams—0.516), curvature (concave—0.516), aspect (NW—0.511, W—0.288), distance from river (0–150 m class—0.255), and sheepfold density (class 1.54–3.01—0.078). The final GSI map is shown in Figure 5c. The four classes of susceptibility are distributed as follows: very high susceptibility class occupies 20.93% (45.97 km2) of the total area, high susceptibility with 46.50% (102.12 km2), medium susceptibility occupies 26.41% (58 km2), while low susceptibility areas occupy 6.16% (13.52 km2). High and very high classes occupy more than a half of the basin’s surface (70.93%). When it comes to the IV method, there are even less significant changes in the final GSI when including sheepfolds as a contributing factor (Figure 5d).
3.3. Validation and Comparison of the GSI Maps
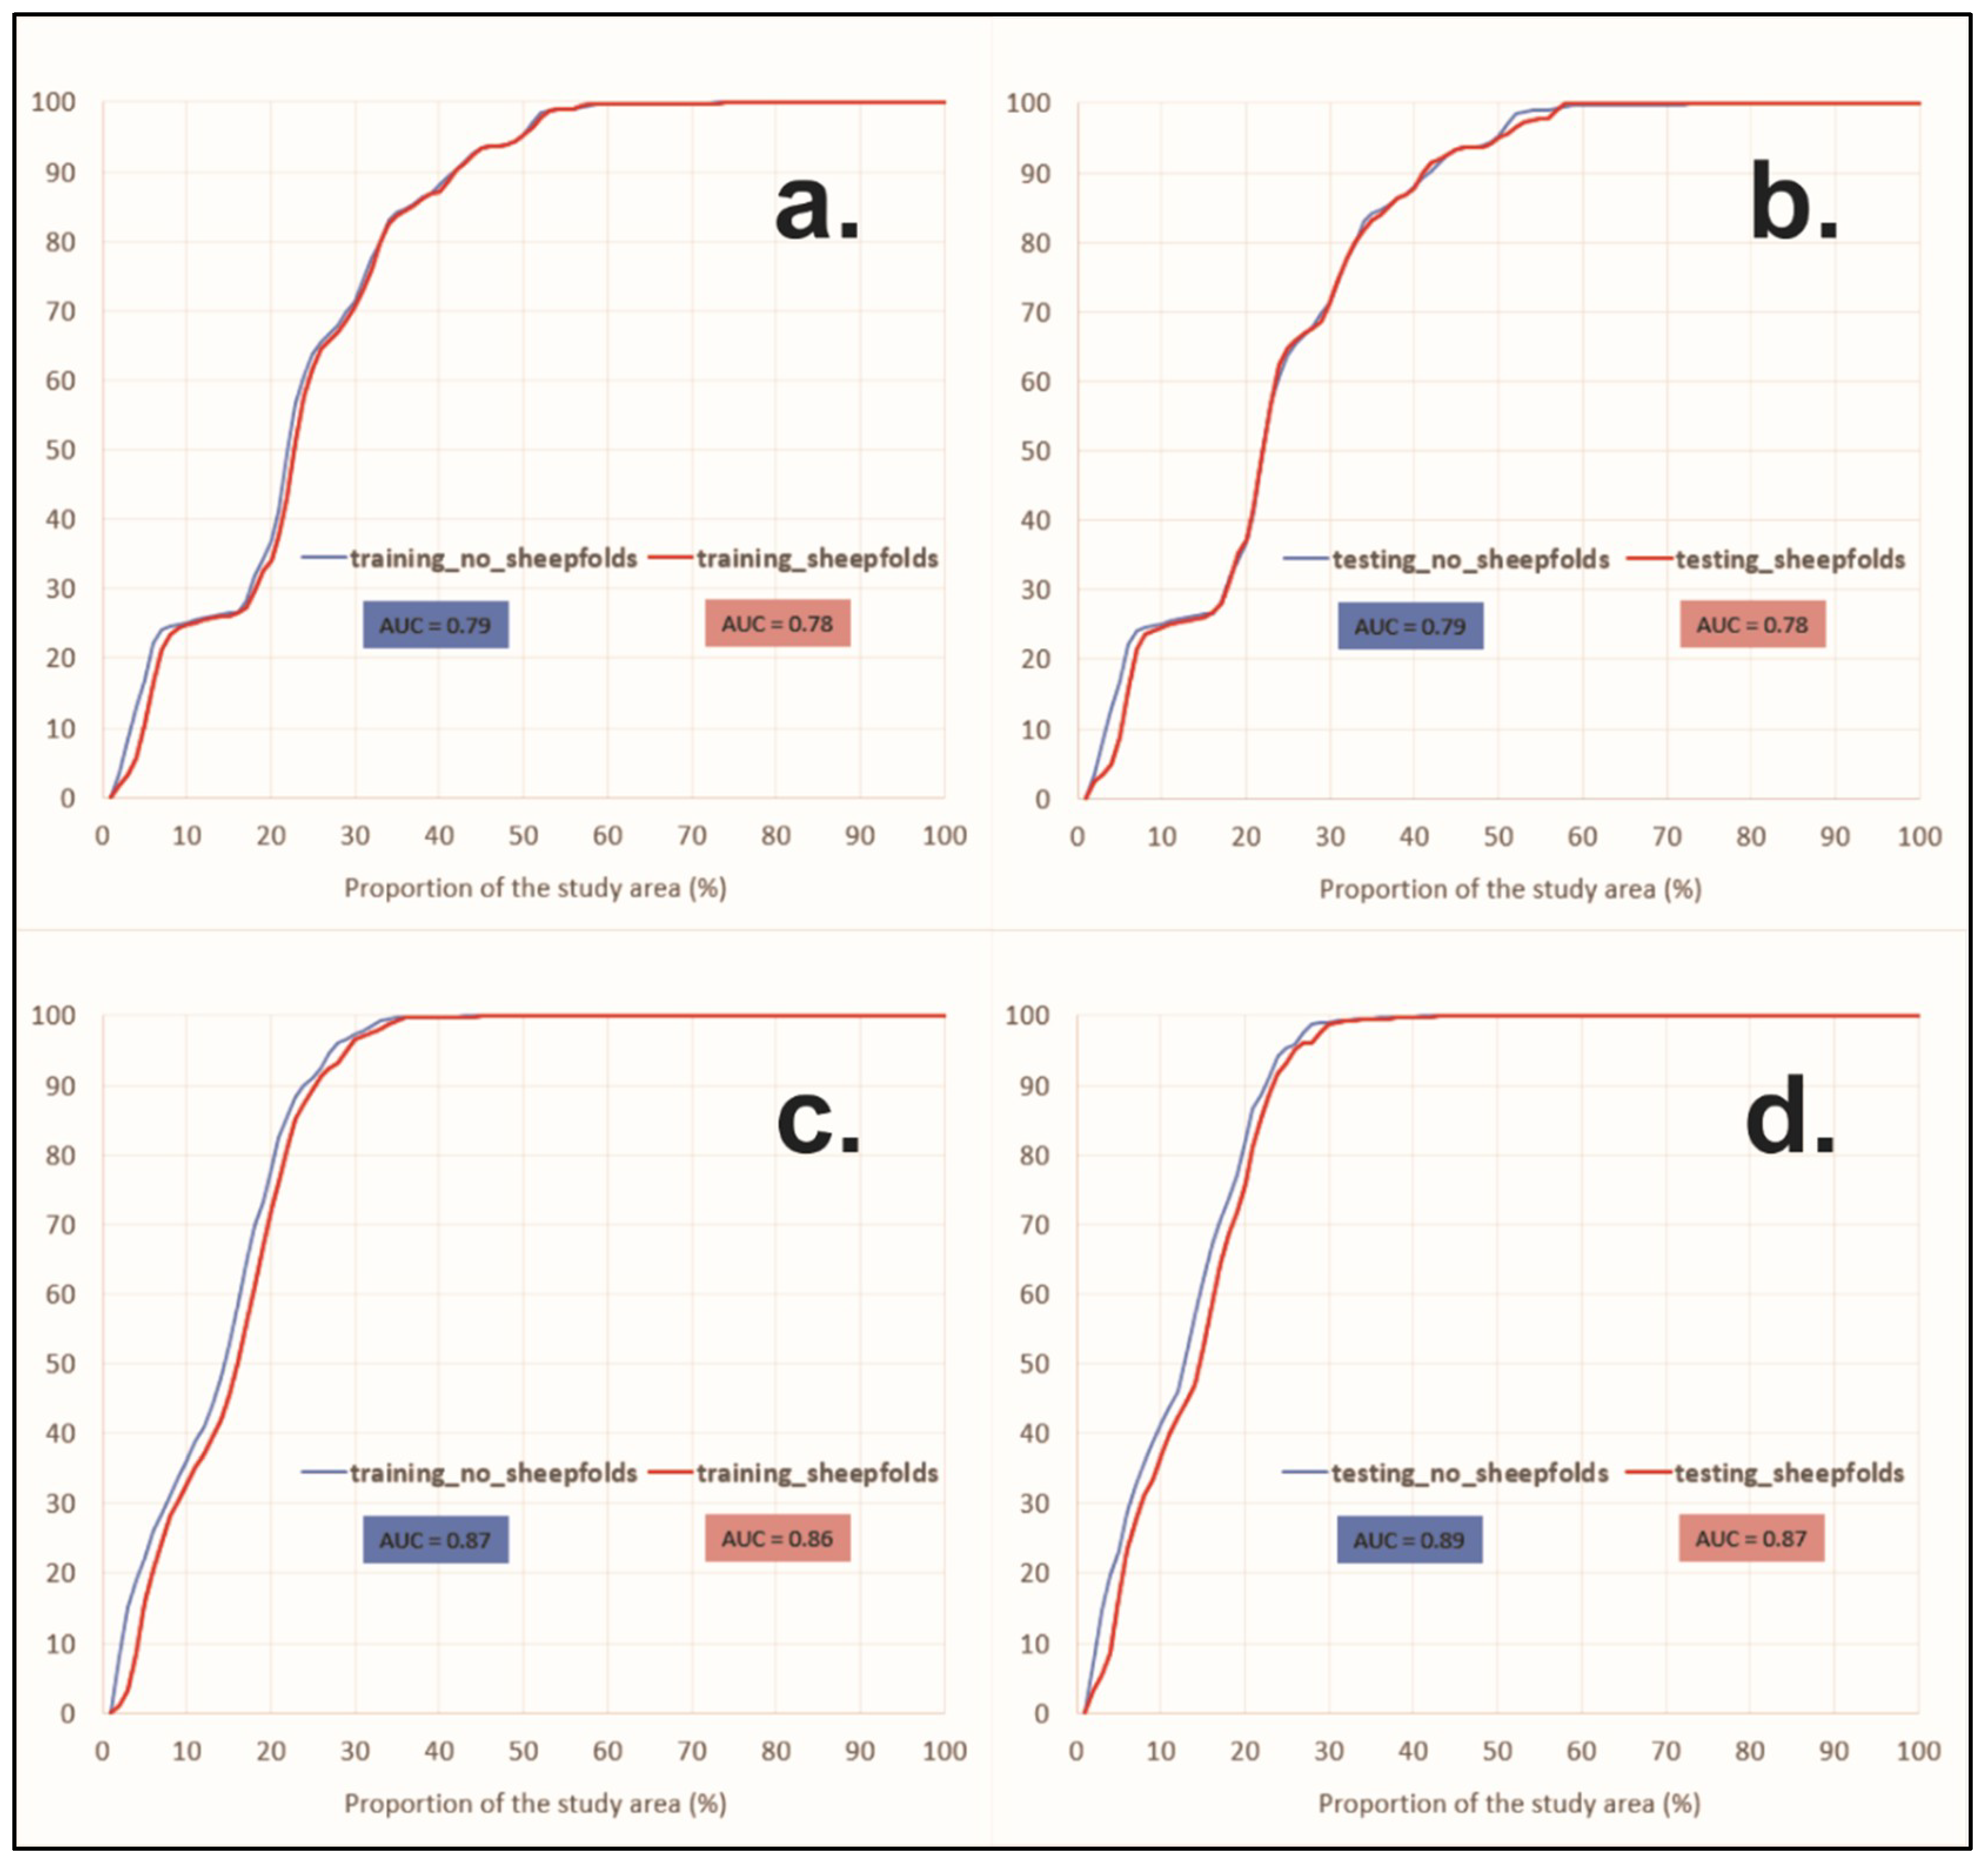
AUC method—for the study area, validation and comparison of the landslide susceptibility maps produced with FR and IV models were checked using the area under curvature (AUC). This method is widely used in studies dealing with gully susceptibility evaluation and creates success rate and prediction rate curves. The success rate curves for the two methods are shown as follows FR (Figure 6a) and IV (Figure 6c); it can be observed that the IV model has a higher area under the curve (AUC) value than FR, which shows the fact that this method is more robust. Regarding the prediction rate of the two models, the IV model has a higher value (AUC = 0.89) (Figure 6d) than the FR model (AUC = 0.87) (Figure 6c). The final GSI maps were classified into four classes: low, medium, high, and very high.
3.4. Cultural Heritage Affected by Gully Erosion
According to previous studies from the area [35], for the 107 Neolithic sites, a buffer zone of 100 m was performed; this was done in order to obtain the average surface of a Neolithic site—3 ha. Out of the total number of 107 Neolithic sites, 14 sites are found in areas with very high susceptibility, 58 sites in areas with high susceptibility, 28 sites in medium susceptibility areas, and 7 in low susceptibility areas; this indicates the fact that more than a half of the sites (67%) are located in areas with high and very high susceptibility to gully erosion. Therefore, they are in danger in the future. 12 Neolithic sites (Table 2) are part of the List of Historical Monuments (LMI) and National Archaeological Registry (RAN); this means that they have a significant historical value and systematic archaeological excavations have been undertaken. Following the excavations, not only very important data was discovered regarding the periodisation of Cucuteni culture; it offered many insights over the way the prehistoric people were building their settlements, what they were eating, how they were keeping the seeds, and so on.
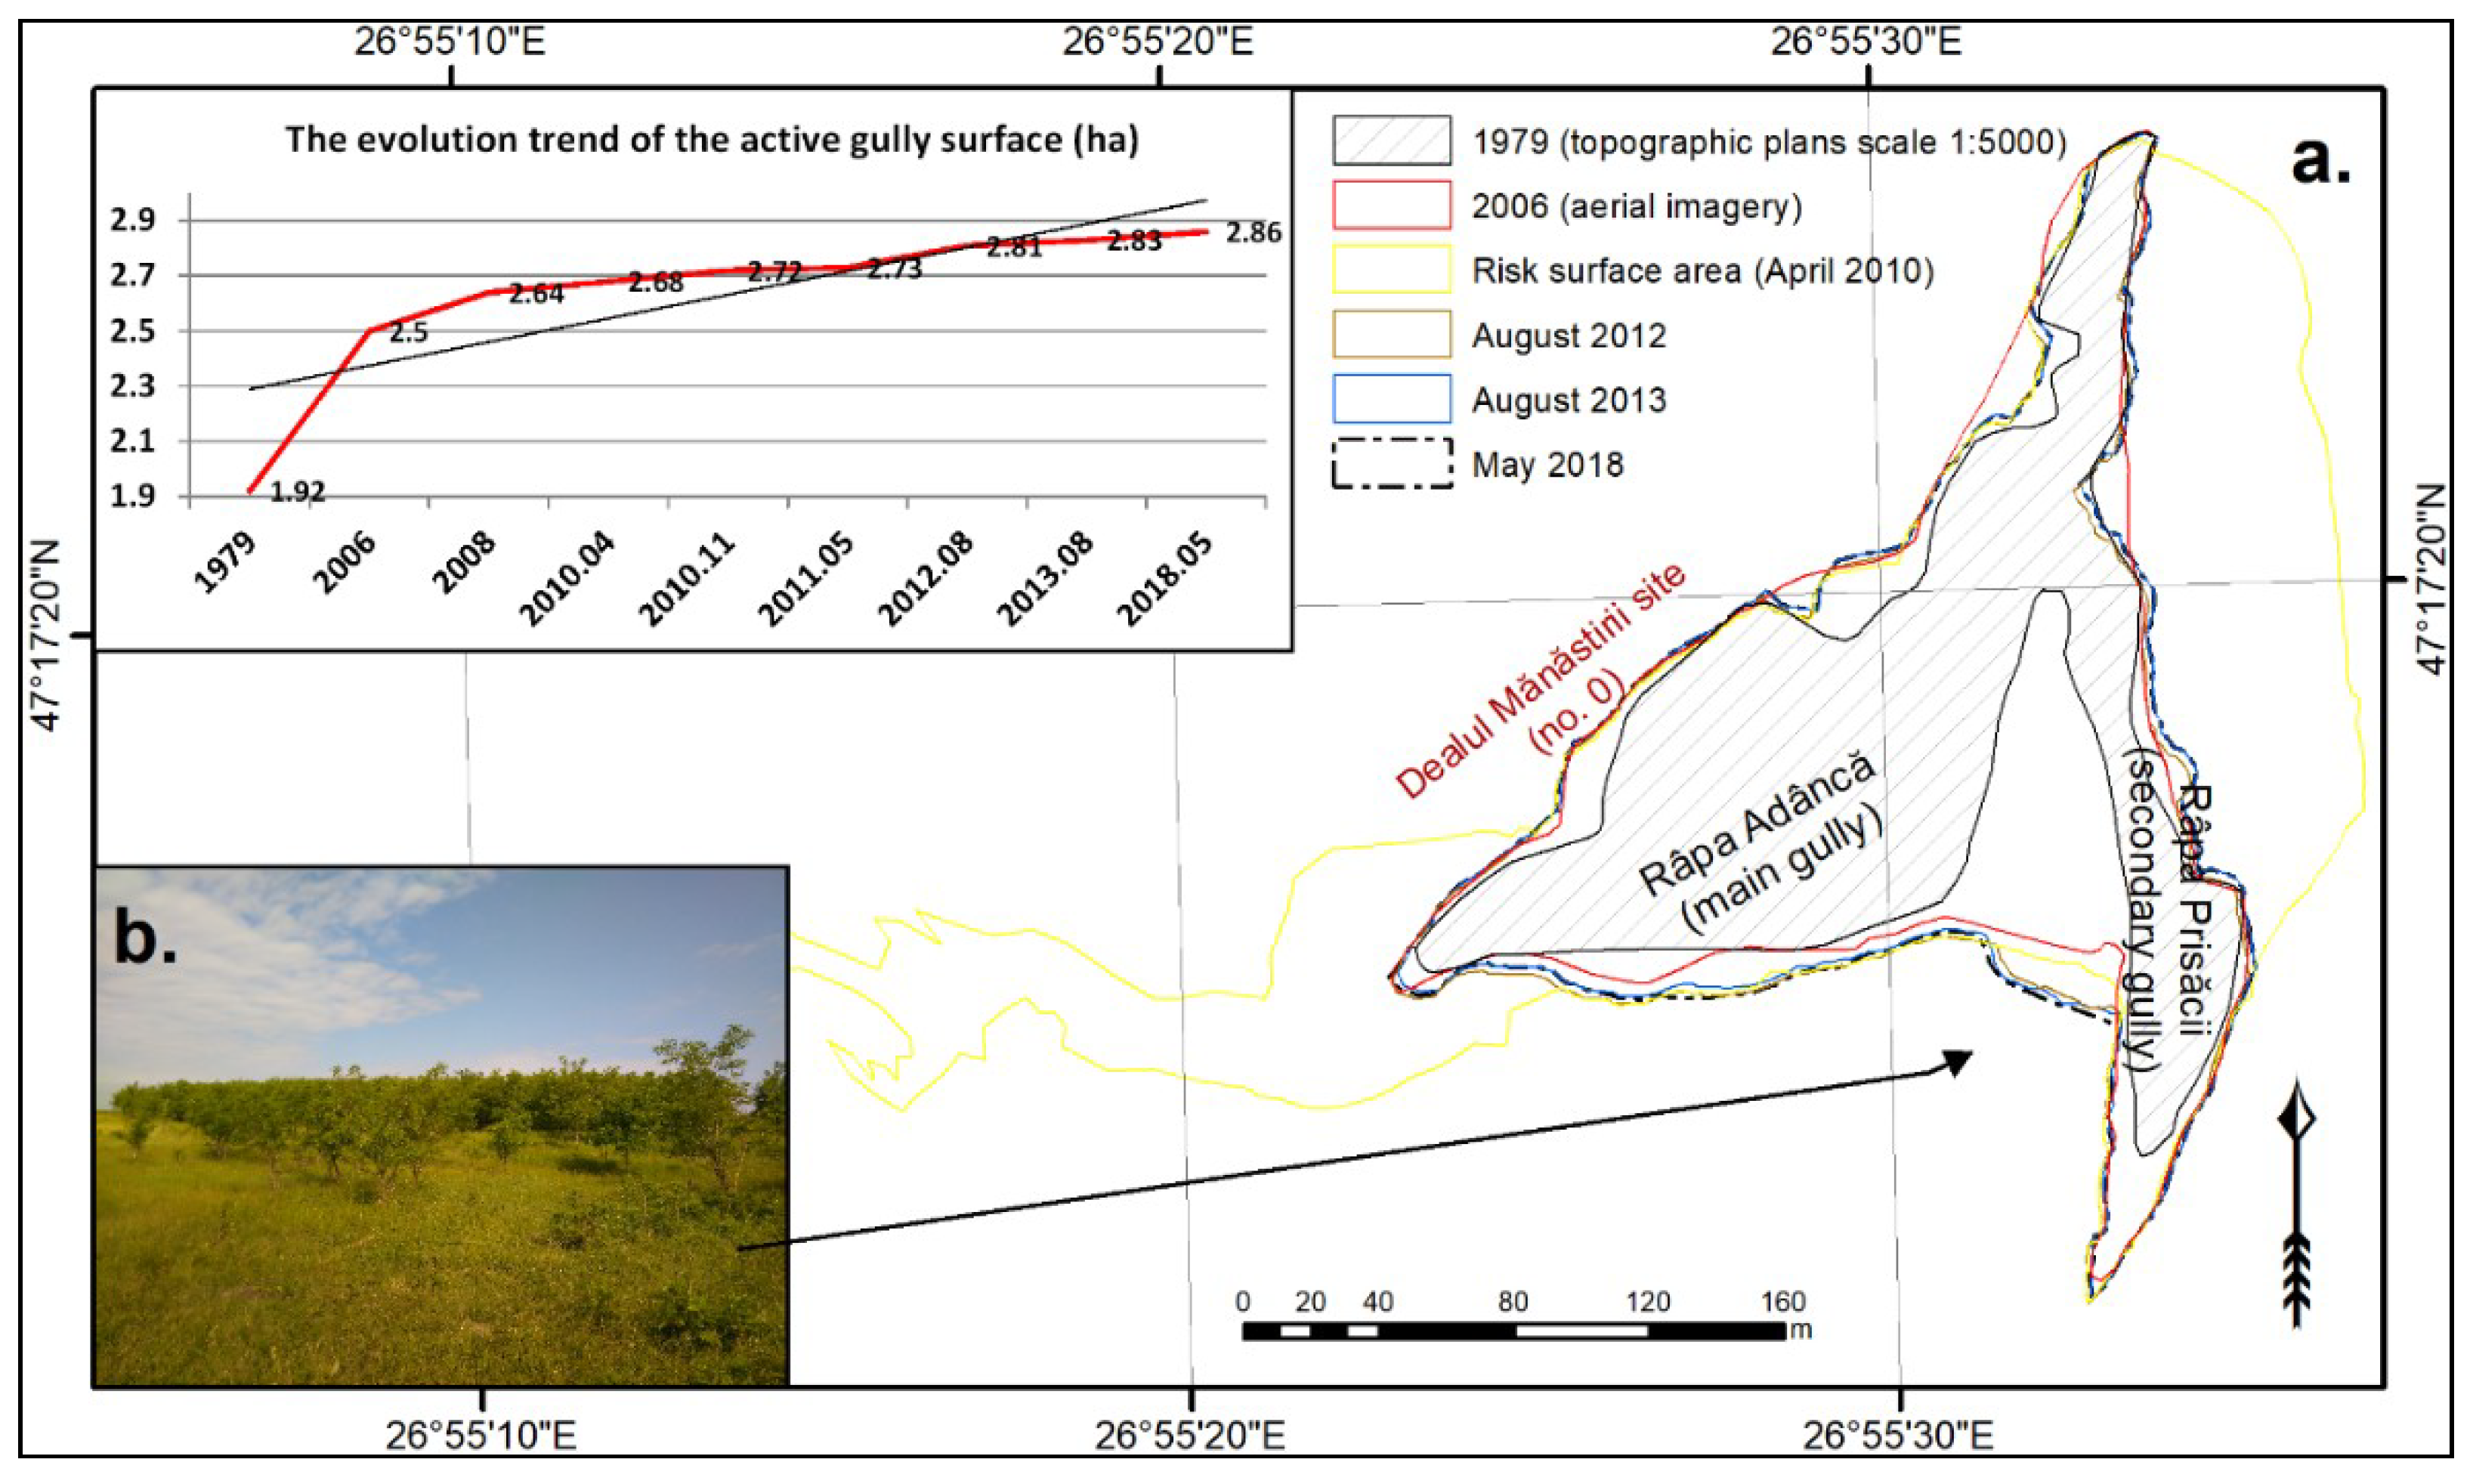
However, if no immediate mitigation measures are being taken, a very significant part of the Neolithic sites (some of them of European significance) from the northeastern part of Romania will disappear. Some mitigation measures have been undertaken [14] within our study area by installing concrete thresholds and planting trees in 2014. Following our last field surveys from May 2018, the gully head advance has been considerably reduced (Figure 7a), and presently, the trees formed a well-developed young forest (Figure 7b); all these measures, along with local authorities understanding of the erosion process, have improved and reduced the erosion process.
4. Discussion
When it comes to analysing the data with the sheepfolds included as a contributing factor, there is no big difference between the curves. Whether or not overgrazing is added as a contributing factor in a GSI calculation does not guarantee the fact that the results will be better. However, this does not prove the fact that overgrazing is not influencing or accelerating soil erosion. A multi-temporal analysis of soil erosion is needed; this represents a future working hypothesis. Besides this, in our study, we took into account only the sheepfolds, as they have more or less a permanent status. We could not evaluate the overgrazing from cows, for example, because cows are being taken each morning and brought back to their owner each afternoon during the grazing season (which stretches from April–May until October), which could vary depending on the meteorological conditions.
5. Conclusions
Soil erosion by water, especially gully erosion, is a serious geo-environmental problem at a global scale causing degradation and damages to agricultural lands, and sedimentation of water reservoirs; Romania makes no exception, particularly in the northeastern part of the country. In order to mitigate the effects of soil erosion on Neolithic cultural heritage sites from Bahluieț catchment, mapping gully erosion susceptibility is a crucial step. Two different statistical models (FR and IV) were employed to create GSI maps for Bahluieț river basin, from the northeastern part of Romania; the model was prepared using a total of ten conditioning factors and a complete gully inventory. The areas affected by gully erosion were randomly selected into training data (542 gullies) to build the model and testing data (135 gullies) in order to test the predictive model’s performance. The weight of each factor was calculated for the two selected statistical models and summed into the final GSI maps. The validation results by AUC method shows that the area under the curve for FR and IV models are 0.79 and 0.78 (without using sheepfolds and using sheepfolds, respectively) and 0.87 and 0.86 (without using sheepfolds and using sheepfolds, respectively), respectively, with a prediction accuracy of 0.79 and 0.78 (without using sheepfolds and using sheepfolds, respectively) and 0.89 and 0.87 (without using sheepfolds and using sheepfolds), respectively. Analysing the GSI maps, it can be observed that approximately 70% of the sites are located in areas with high and very high susceptibility to gully erosion; this means that the Neolithic sites from the study area are in real danger. Another use of the GSI maps is for local authorities and stakeholders to plan the economic activities (e.g., future infrastructure projects), minimise damages costs, environmental and cultural heritage protection, better management of water resources, and hazard mitigation.
Funding
This research received no external funding.
Acknowledgments
The two anonymous reviewers and the editor are kindly acknowledged for their constructive comments that helped in the improvement of the manuscript
Conflicts of Interest
The author declares no conflict of interest.
References
- Boardman, J.; Vandaele, K. Soil erosion, muddy floods and the need for institutional memory. Area 2010, 42, 502–513. [Google Scholar] [CrossRef]
- Xiong, M.; Sun, R.; Chen, L. Effects of soil conservation techniques on water erosion control: A global analysis. Sci. Total Environ. 2018, 645, 753–760. [Google Scholar] [CrossRef] [PubMed]
- Borelli, P.; Panagos, P.; Ballabio, C.; Lugato, E.; Weynants, M.; Montanarella, L. Towards a Pan-European assessment of land susceptibility to wind erosion. Land Degrad. Dev. 2016, 27, 1093–1105. [Google Scholar] [CrossRef]
- Poesen, J.W.; Verstraeten, G.; Soenens, R.; Seynaeve, L. Soil losses due to harvesting of chicory roots and sugar beet: An underrated geomorphic process? Catena 2001, 43, 35–47. [Google Scholar] [CrossRef]
- Karydas, C.G.; Panagos, P. The G2 erosion model: An algorithm for month-time step assessments. Environ. Res. 2018, 161, 256–267. [Google Scholar] [CrossRef] [PubMed]
- Frankl, A.; Prêtre, V.; Nyssen, J.; Salvador, P.-G. The success of recent land management efforts to reduce soil erosion in northern France. Geomorphology 2018, 303, 84–93. [Google Scholar] [CrossRef]
- Vanmaercke, M.; Poesen, J.; Van Mele, B.; Demuzere, M.; Bruynseels, A.; Golosov, V.; Rodrigues Bezerra, J.F.; Bolysov, S.; Dvinskih, A.; Frankl, A.; et al. How fast do gully headcuts retreat? Earth-Sci. Rev. 2016, 154, 336–355. [Google Scholar] [CrossRef]
- Zabihi, M.; Mirchooli, F.; Motevallli, A.; Darvishan, A.K.; Pourghasemi, H.R.; Zakeri, M.A.; Sadighi, F. Spatial modelling of gully erosion in Mazandaran Province, northern Iran. Catena 2018, 161, 1–13. [Google Scholar] [CrossRef]
- Poesen, J.; Nachtergaele, J.; Verstraeten, G.; Valentin, C. Gully erosion and environmental change: Importance and research needs. Catena 2003, 50, 91–133. [Google Scholar] [CrossRef]
- Valentin, C.; Poesen, J.; Li, I. Gully erosion: Impacts, factors and control. Catena 2005, 63, 132–153. [Google Scholar] [CrossRef]
- Poesen, J. Soil erosion in the Anthropocene: Research needs. Earth Surf. Proc. Landf. 2018, 43, 64–84. [Google Scholar] [CrossRef]
- Adejini, A.; Jeje, L.K.; Ibitoye, M.O. Urban development and informal drainage patterns: Gully dynamics in Southwestern Nigeria. Appl. Geogr. 2013, 40, 90–102. [Google Scholar] [CrossRef]
- Chaplot, V. Impact of terrain attributes, parent material and soil types on gully erosion. Geomorphology 2013, 186, 1–11. [Google Scholar] [CrossRef]
- Goodwin, N.R.; Armston, J.; Stiller, I.; Muir, J. Assessing the repeatability of terrestrial laser scanning for monitoring gully topography: A case study from Aratula, Queensland, Australia. Geomorphology 2016, 262, 24–36. [Google Scholar] [CrossRef]
- Mukai, S. Gully erosion rates and analysis of determining factors: A case study from the semi-arid main Ethiopian Rift Valley. Land Degrad. Dev. 2016, 28, 602–615. [Google Scholar] [CrossRef]
- Zakerinejad, R.; Maerker, M. An integrated assessment of soil erosion dynamics with special emphasis on gully erosion in the Mazayjan basin, southwestern Iran. Nat. Hazards 2015, 79, 25–50. [Google Scholar] [CrossRef]
- Archibold, O.W.; Lévesque, L.M.J.; de Boer, D.H.; Aitken, A.E.; Delanoy, L. Gully retreat in a semi-urban catchment in Saskatoon, Saskatchewan. Appl. Geogr. 2003, 23, 261–279. [Google Scholar] [CrossRef]
- Ioniță, I.; Niacșu, L.; Petrovici, G.; Blebea-Apostu, A.M. Gully development in eastern Romania: A case study from Falciu Hills. Nat. Hazards 2015, 79, 113–138. [Google Scholar] [CrossRef]
- Nicu, I.C. Natural risk assessment and mitigation of cultural heritage sites in North-eastern Romania (Valea Oii river basin). Area 2018. [Google Scholar] [CrossRef]
- Hayas, A.; Poesen, J.; Vanwalleghem, T. Rainfall and vegetation effects on temporal variation of topographic thresholds for gully initiation in Mediterranean cropland and olive groves. Land Degrad. Dev. 2017, 28, 2540–2552. [Google Scholar] [CrossRef]
- Zgłobicki, W.; Poesen, J.; Cohen, M.; Del Monte, M.; García-Ruiz, J.M.; Ioniță, I.; Niacșu, L.; Machová, Z.; Martín-Duque, J.F.; Nadal-Romero, E.; et al. The potential of permanent gullies in Europe as geomorphosites. Geoheritage 2017. [Google Scholar] [CrossRef]
- Conforti, M.; Aucelli, P.P.C.; Robustelli, G.; Scarciglia, F. Geomorphology and GIS analysis for mapping gully erosion susceptibility in the Turbolo stream catchment (Northern Calabria, Italy). Nat. Hazards 2011, 56, 881–898. [Google Scholar] [CrossRef]
- Dewitte, O.; Daoudi, M.; Bosco, C.; Van Den Eeckhaut, M. Predicting the susceptibility to gully initiation in data-poor regions. Geomorphology 2015, 228, 101–115. [Google Scholar] [CrossRef]
- Conoscenti, C.; Agnesi, V.; Cama, M.; Caraballo-Arias, N.A.; Rotigliano, E. Assessment of gully erosion susceptibility using multivariate adaptive regression splines and accounting for terrain connectivity. Land Degrad. Dev. 2017. [Google Scholar] [CrossRef]
- Rahmati, O.; Haghizadeh, A.; Pourghasemi, H.R.; Noormohamadi, F. Gully erosion susceptibility mapping: The role of GIS-based bivariate statistical models and their comparison. Nat. Hazards 2016, 82, 1231–1258. [Google Scholar] [CrossRef]
- Stringer, L.C.; Scrieciu, S.S.; Reed, M.S. Biodiversity, land degradation, and climate change: Participatory planning in Romania. Appl. Geogr. 2009, 29, 77–90. [Google Scholar] [CrossRef]
- Rădoane, M.; Ichim, I.; Rădoane, N. Gully distribution and development in Moldavia, Romania. Catena 1995, 24, 127–146. [Google Scholar] [CrossRef]
- Ioniță, I. Gully development in the Moldavian Plateau of Romania. Catena 2006, 68, 133–140. [Google Scholar] [CrossRef]
- Mărgineanu, R.; Popa, N.; Olteanu, C. 137Cs use in sedimentation rate assessment in gullies and reservoirs in Romania. J. Environ. Prot. Ecol. 2007, 8, 197–203. [Google Scholar]
- Boengiu, S.; Vlăduț, A.; Marinescu, E. Conditions of gully development within piedmont areas with examples from the western part of the Getic Piedmont, Romania. J. Environ. Biol. 2012, 33, 407–415. [Google Scholar] [PubMed]
- Romanescu, G.; Nicu, I.C. Risk maps for gully erosion processes affecting archaeological sites in Moldavia, Romania. Z. Geomorphol. 2014, 58, 509–523. [Google Scholar] [CrossRef]
- Jurchescu, M.; Grecu, F. Modelling the occurrence of gullies at two spatial scales in the Olteț Drainage Basin (Romania). Nat. Hazards 2015, 79, 255–289. [Google Scholar] [CrossRef]
- Pederson, J.L.; Petersen, P.A.; Dierker, J.L. Gullying and erosion control at archaeological sites in Grand Canyon, Arizona. Earth Surf. Proc. Landf. 2006, 31, 507–525. [Google Scholar] [CrossRef]
- Tapete, D.; Cigna, F. InSAR data for geohazard assessment in UNESCO World Heritage sites: State-of-the-art and perspectives in the Copernicus era. Int. J. Appl. Earth Obs. 2017, 63, 24–32. [Google Scholar] [CrossRef]
- Nicu, I.C. Tracking natural and anthropic risks from historical maps as a tool for cultural heritage assessment: A case study. Environ. Earth Sci. 2017, 76, 330. [Google Scholar] [CrossRef]
- Nicu, I.C. Cultural heritage assessment and vulnerability using Analytic Hierarchy Process and Geographic Information Systems (Valea Oii catchment, North-eastern Romania). An approach to historical maps. Int. J. Disaster Risk Reduct. 2016, 20, 103–111. [Google Scholar] [CrossRef]
- Nicu, I.C. Frequency ratio and GIS-based evaluation of landslide susceptibility applied to cultural heritage assessment. J. Cult. Herit. 2017, 28, 172–176. [Google Scholar] [CrossRef]
- Nicu, I.C. Application of analytic hierarchy process, frequency ratio, and statistical index to landslide susceptibility: An approach to endangered cultural heritage. Environ. Earth Sci. 2018, 77, 79. [Google Scholar] [CrossRef]
- Nicu, I.C.; Asăndulesei, A. GIS-based evaluation of diagnostic areas in landslide susceptibility analysis of Bahluieț River Basin (Moldavian Plateau, NE Romania). Are Neolithic sites in danger? Geomorphology 2018, 314, 27–41. [Google Scholar] [CrossRef]
- Niculiță, M.; Mărgărint, M.C. Landslides and fortified settlements as valuable cultural geomorphosites and geoheritage sites in the Moldavian Plateau, North-eastern Romania. Geoheritage 2017. [Google Scholar] [CrossRef]
- Minea, I. Bazinul Hidrografic Bahlui. Studiu Hidrologic; Editura Universității Alexandru Ioan Cuza: Iași, Romania, 2013; p. 334. ISBN 978-973-703-754-1. [Google Scholar]
- Van Westen, C.J. Statistical Landslide Hazard Analysis. ILWIS 2.1 for Windows Application Guide; ITC Publication: Endschede, The Netherlands, 1997; pp. 73–84.
- Mararakanye, N.; Sumner, P.D. Gully erosion: A comparison of contributing factors in two catchments in South Africa. Geomorphology 2017, 288, 99–110. [Google Scholar] [CrossRef]
- Kheir, R.B.; Wilson, J.; Deng, Y. Use of terrain variables for mapping gully erosion susceptibility in Lebanon. Earth Surf. Proc. Landf. 2007, 32, 1770–1782. [Google Scholar] [CrossRef]
- Beven, K.J.; Kirkby, M.J. A physically based, variable contributing area model of basin hydrology. Hydrol. Sci. B 1979, 24, 43–69. [Google Scholar] [CrossRef]
- Jenness, J. Topographic Position Index (tpi_jen.avx) Extension for ArcView 3.x, version 1.2; Jenness Enterprises: Flagstaff, AZ, USA, 2006. [Google Scholar]
- Lucà, F.; Conforti, M.; Robustelli, G. Comparison of GIS-based gullying susceptibility using bivariate and multivariate statistics: Northern Calabria, South Italy. Geomorphology 2011, 134, 297–308. [Google Scholar] [CrossRef]
- Conoscenti, C.; Angileri, S.; Cappadonia, C.; Rotigliano, E.; Agnesi, V.; Märker, M. Gully erosion susceptibility assessment by means of GIS-based logistic regression: A case of Sicily (Italy). Geomorphology 2014, 204, 399–411. [Google Scholar] [CrossRef] [Green Version]
- Castillo, C.; Gómez, J.A. A century of gully erosion research: Urgency, complexity and study approaches. Earth-Sci. Rev. 2016, 160, 300–319. [Google Scholar] [CrossRef] [Green Version]
- Liu, S.; Wang, T. Aeolian processes and landscape change under human disturbances on the Sonid grassland of inner Mongolian Plateau, northern China. Environ. Earth Sci. 2014, 71, 2399–2407. [Google Scholar] [CrossRef]
- Wang, X.; Pedram, S.; Liu, T.; Gao, R.; Li, F.; Luo, Y. Estimated grass grazing removal rate in a semiarid Eurasian steppe watershed as influenced by climate. Water 2016, 8, 339. [Google Scholar] [CrossRef]
- Strunk, H. Soil degradation and overland flow as causes of gully erosion on mountain pastures and in forests. Catena 2003, 50, 185–198. [Google Scholar] [CrossRef]
- Riva, M.J.; Daliakopoulos, I.N.; Eckert, S.; Hodel, E. Assessment of land degradation in Mediterranean forests and grazing lands using a landscape unit approach and the normalized difference vegetation index. Appl. Geogr. 2017, 86, 8–21. [Google Scholar] [CrossRef]
- Shahbazi, K.; Salajagheh, A.; Jafari, M.; Ahmadi, H.; Nazarisamani, A.; Khosroshahi, M. Comparative Assessment of Gully Erosion and Sediment Yield in Different Rangelands and Agricultural Areas in Ghasr-e-Shirin, Kermanshah, Iran. J. Rangel. Sci. 2017, 7, 296–306. [Google Scholar]
- Boardman, J.; Parsons, A.J.; Holland, R.; Holmes, P.J.; Washington, R. Development of badlands and gullies in the Sneeuberg, Great Karoo, South Africa. Catena 2003, 50, 165–184. [Google Scholar] [CrossRef]
- Rowntree, K.; Duma, M.; Kakembo, V.; Thornes, J. Debunking the myth of overgrazing and soil erosion. Land Degrad. Dev. 2004, 15, 203–214. [Google Scholar] [CrossRef]
- Boardman, J. How old are the gullies (dongas) of the Sneeuberg uplands, Eastern Karoo, South Africa? Catena 2014, 113, 79–85. [Google Scholar] [CrossRef]
- Popa, L.-F. Tradiția și normele europene în activitatea păstorească din România. Geogr. Napoc. 2010, 1, 61–74. [Google Scholar]
- Nicu, I.C. Hydrogeomorphic Risk Analysis Affecting Chalcolithic Archaeological Sites from Valea Oii (Bahlui) Watershed, Northeastern Romania. In An Interdisciplinary Approach, 1st ed.; Springer: Cham, The Netherlands, 2016. [Google Scholar]
Figure 1.
Sand columns created inside the Băiceni-Cucuteni gully (Romania), after the collapse from May 2013 (nowadays they do not exist anymore).
Figure 1.
Sand columns created inside the Băiceni-Cucuteni gully (Romania), after the collapse from May 2013 (nowadays they do not exist anymore).

Figure 2.
(a) Location of the study area in Romania; (b) Location of training and testing gully dataset and of Neolithic sites.
Figure 2.
(a) Location of the study area in Romania; (b) Location of training and testing gully dataset and of Neolithic sites.

Figure 3.
Examples of gully erosion from the study area.

Figure 4.
Gully erosion conditioning factors and classification. (a) Elevation, (b) precipitations, (c) slope angle, (d) curvature, (e) topographic wetness index (TWI), (f) lithology, (g) landforms, (h) aspect, (i) drainage density, (j) distance from rivers, (k) sheepfold density, (l) future location of the A8 Motorway.

Figure 5.
Gully susceptibility index produced using (a) frequency ratio (FR) method, (b) FR method including sheepfold density as a contributing factor, (c) information value (IV) method, and (d) IV method including sheepfold density as a contributing factor.
Figure 5.
Gully susceptibility index produced using (a) frequency ratio (FR) method, (b) FR method including sheepfold density as a contributing factor, (c) information value (IV) method, and (d) IV method including sheepfold density as a contributing factor.

Figure 6.
(a) Success rate curves produced with FR method, (b) prediction rate curves produced with FR method, (c) success rate curves produced with IV method, and (d) prediction rate curves produced with IV method. AUC—area under the curve.
Figure 6.
(a) Success rate curves produced with FR method, (b) prediction rate curves produced with FR method, (c) success rate curves produced with IV method, and (d) prediction rate curves produced with IV method. AUC—area under the curve.

Figure 7.
(a) Băiceni-Cucuteni gully evolution over the last 39 years, (b) the forest developed on the upper part of the gully.
Figure 7.
(a) Băiceni-Cucuteni gully evolution over the last 39 years, (b) the forest developed on the upper part of the gully.


Table 1.
Statistical index values for the conditioning factors.
| Conditioning Factor | Class | No. of Pixels in Domain | Pixels % | Gully Pixels | Gully Pixels % | Statistical Index (SI) |
|---|---|---|---|---|---|---|
| Altitude (m) | 50–100 | 3,363,707 | 15.32 | 19,805 | 9.95 | −0.187 |
| 100–150 | 9,271,203 | 42.21 | 84,561 | 42.50 | 0.002 | |
| 150–200 | 5,048,669 | 22.98 | 58,594 | 29.45 | 0.107 | |
| 200–250 | 1,511,671 | 6.88 | 20,188 | 10.14 | 0.168 | |
| 250–300 | 1,263,479 | 5.75 | 11,039 | 5.54 | −0.015 | |
| 300–350 | 811,297 | 3.69 | 4590 | 2.35 | −0.204 | |
| 350–400 | 601,494 | 2.75 | 157 | 0.07 | −1.540 | |
| 400–440 | 89,623 | 0.42 | - | - | - | |
| Slope angle (degrees) | 0–3 | 8,873,175 | 40.40 | 39,638 | 19.92 | −0.307 |
| 3–7 | 6,894,280 | 31.39 | 81,943 | 41.19 | 0.117 | |
| 7–14 | 4,984,204 | 22.70 | 65,243 | 32.80 | 0.159 | |
| >14 | 1,209,484 | 5.51 | 12,110 | 6.09 | 0.043 | |
| Curvature | Concave | 385,283 | 1.75 | 11,463 | 5.76 | 0.516 |
| Flat | 21,045,116 | 95.83 | 183,289 | 92.14 | −0.017 | |
| Convex | 530,744 | 2.42 | 4182 | 2.10 | −0.060 | |
| Lithology | Sandstone | 4,484,871 | 20.42 | 29,775 | 14.97 | −0.134 |
| Limestone | 904,658 | 4.12 | 279 | 0.14 | −1.467 | |
| Clay, sand | 13,191,520 | 60.07 | 142,345 | 71.56 | 0.075 | |
| Clay | 3,380,094 | 15.39 | 26,535 | 13.33 | −0.062 | |
| Precipitations (mm/year) | 500–550 | 8,512,022 | 38.76 | 45,741 | 23 | −0.226 |
| 550–600 | 8,869,166 | 40.39 | 91,094 | 45.80 | 0.054 | |
| 600–650 | 2,375,521 | 10.82 | 47,193 | 23.7 | 0.341 | |
| 650–700 | 2,204,434 | 10.04 | 14,906 | 7.5 | −0.126 | |
| Distance from rivers (m) | 0–150 | 7,245,110 | 25.92 | 118,149 | 59.39 | 0.255 |
| 150–300 | 5,933,280 | 22.59 | 31,837 | 16 | −0.227 | |
| 300–450 | 4,009,197 | 17.99 | 17,461 | 8.78 | −0.318 | |
| 450–600 | 2,227,077 | 12.39 | 10,944 | 5.5 | −0.265 | |
| >600 | 2,546,479 | 8.37 | 20,453 | 10.33 | −0.050 | |
| Landforms | 1 | 13,718 | 0.06 | 408 | 0.2 | 0.516 |
| 2 | 195 | 0 | 1 | 0 | −0.247 | |
| 4 | 281,045 | 1.28 | 14,441 | 7.26 | 0.753 | |
| 5 | 11,409,495 | 51.95 | 59,176 | 29.75 | −0.242 | |
| 6 | 9,985,547 | 45.47 | 124,059 | 62.37 | 0.137 | |
| 7 | 260,802 | 1.19 | 791 | 0.40 | −0.475 | |
| 9 | 177 | 0 | 6 | 0 | 0.573 | |
| 10 | 10,164 | 0.05 | 52 | 0.02 | −0.248 | |
| Topographic wetness index (TWI) | −7–−2 | 568,058 | 2.59 | 3394 | 1.71 | −0.180 |
| −1–−0.1 | 44,494 | 0.20 | 588 | 0.30 | 0.164 | |
| 0–30 | 18,542,604 | 84.43 | 180,291 | 90.63 | 0.030 | |
| >30 | 2,805,987 | 12.78 | 14,661 | 7.36 | −0.238 | |
| Aspect | Flat | 3,463,117 | 15.77 | 36,987 | 18.60 | 0.071 |
| N | 3,664,609 | 16.69 | 45,583 | 22.92 | 0.137 | |
| NE | 3,457,392 | 15.74 | 21,850 | 10.99 | −0.156 | |
| E | 2,211,100 | 10.07 | 9741 | 4.90 | −0.313 | |
| SE | 2,237,844 | 10.19 | 6315 | 3.17 | −0.506 | |
| S | 2,259,101 | 10.29 | 5046 | 2.53 | −0.608 | |
| SW | 2,359,786 | 10.75 | 19,734 | 9.91 | −0.034 | |
| W | 1,201,188 | 5.47 | 21,126 | 10.62 | 0.288 | |
| NW | 1,107,006 | 5.04 | 32,552 | 16.36 | 0.511 | |
| Sheepfold density (/km2) | 0–0.3 | 12,855,513 | 58.53 | 111,078 | 55.83 | −0.020 |
| 0.3–0.92 | 5,580,961 | 25.41 | 50,123 | 25.20 | −0.003 | |
| 0.92–1.54 | 2,596,265 | 11.83 | 27,646 | 13.90 | 0.070 | |
| 1.54–3.01 | 928,404 | 4.23 | 10,087 | 5.07 | 0.078 | |
| Drainage density (km/km2) | <0.64 | 3,987,872 | 18.16 | 27,111 | 13.63 | −0.124 |
| 0.65–1.2 | 7,528,130 | 34.28 | 69,345 | 34.86 | 0.007 | |
| 1.3–1.8 | 7,518,991 | 34.24 | 78,858 | 39.64 | 0.063 | |
| 1.9–3.2 | 2,926,150 | 13.32 | 23,620 | 11.87 | −0.050 |
Table 2.
Neolithic sites listed in the List of Historical Monuments (LMI) and National Archaeological Registry (RAN). GSI—gully susceptibility index; IV—information value.
Table 2.
Neolithic sites listed in the List of Historical Monuments (LMI) and National Archaeological Registry (RAN). GSI—gully susceptibility index; IV—information value.
| Site No. | Site Name | Location (WGS84 Coordinates) | LMI Code/RAN Code | Susceptibility Class According to GSI (IV) | |
|---|---|---|---|---|---|
| N | E | ||||
| 3 | Dealul Mândra/la Iaz/Iazul 3 | 47°14′43″ | 27°08′7″ | IS-I-s-B-03527/95809.01 | Medium |
| 95 | Cantonul CFR nr. 38-39 | 47°12′46″ | 27°07′23″ | IS-I-s-B-03529/95809.03 | High |
| 18 | Dealul Mănăstirii/Chetrosul/sub Pădure | 47°15′25″ | 26°54′20″ | -/95578.01 | High |
| 24 | Dealul Mare Filiași/Dealul Boghiu | 47°15′12″ | 27°02′25″ | -/95827.01 | Medium |
| 36 | Valea Părului II | 47°17′47″ | 26°57′54″23 | IS-I-s-B-03519/95505.01 | Medium |
| 98 | Costești Cier/lângă Școală | 47°14′8.4″ | 26°55′39″ | IS-I-s-B-03560/95541.01 | Medium |
| 7 | Pietrăria din Valea Hainei | 47°12′50″ | 26°56′5″ | IS-I-s-B-03561/95541.02 | Medium |
| 55 | Costești/Podiș | 47°13′58″ | 26°57ʹ14″ | -/95541.04 | Medium |
| 37 | Tarlaua Grajd | 47°16ʹ36″ | 26°54′36″ | IS-I-s-B-03530/96691.01 | Medium |
| 1 | Dâmbul lui Pletosu | 47°18′10″ | 26°55′20″ | IS-I-s-B-03522/96682.03 | Very high |
| 49 | Dâmbul Morii | 47°14′45″ | 26°56′10″ | IS-I-s-A-03523/96682.04 | Very high |
| 99 | Cetățuia | 47°17′55″ | 26°54′50″ | IS-I-s-A-03521/96682.02 | Very high |
© 2018 by the author. Licensee MDPI, Basel, Switzerland. This article is an open access article distributed under the terms and conditions of the Creative Commons Attribution (CC BY) license (http://creativecommons.org/licenses/by/4.0/).
Share and Cite
MDPI and ACS Style
Nicu, I.C. Is Overgrazing Really Influencing Soil Erosion? Water 2018, 10, 1077. https://doi.org/10.3390/w10081077
AMA Style
Nicu IC. Is Overgrazing Really Influencing Soil Erosion? Water. 2018; 10(8):1077. https://doi.org/10.3390/w10081077
Chicago/Turabian StyleNicu, Ionut Cristi. 2018. "Is Overgrazing Really Influencing Soil Erosion?" Water 10, no. 8: 1077. https://doi.org/10.3390/w10081077
Note that from the first issue of 2016, this journal uses article numbers instead of page numbers. See further details here.