Estimating Evapotranspiration of Processing Tomato under Plastic Mulch Using the SIMDualKc Model


1
Center for Agricultural Water Research, China Agricultural University, Beijing 100083, China
2
Chinese-Israeli International Center for Research and Training in Agriculture, China Agricultural University, Beijing 100083, China
*
Author to whom correspondence should be addressed.
Water 2018, 10(8), 1088; https://doi.org/10.3390/w10081088
Submission received: 22 April 2018
/
Revised: 8 August 2018
/
Accepted: 10 August 2018
/
Published: 16 August 2018
(This article belongs to the Special Issue Innovation Issues in Water, Agriculture and Food)
Abstract
:Accurate estimation of crop evapotranspiration (ET) is critical for agricultural water resource management and proper irrigation scheduling. The 2-year field experimental data of processing tomato under plastic-mulched drip and basin irrigation in the Hetao Irrigation District (Hetao), located in the upper reaches of the Yellow river, were used to calibrate and validate the SIMDualKc model. The model adopted the Food and Agriculture Organization (FAO) dual Kc method for partitioning ET into plant transpiration and soil evaporation. The results showed a good agreement between soil water observations and simulations throughout the growing seasons with a low error estimate and high model efficiency. The calibrated basal potential crop coefficients for the initial stage, mid-season stage, and late stage were 0.30, 0.92, and 0.60, respectively. ET during the two growing seasons was in the range of 284–331 mm for basin irrigation and 266–310 mm for drip irrigation. The average soil evaporation accounted for 5% of ET in 2015 and 14% of ET in 2016 for drip irrigation treatments, while it accounted for 4% and 13% of ET for basin irrigation treatments in the two experimental years, indicating that transpiration was the dominant component of ET of processing tomato under plastic mulch in Hetao. The highest water productivity was obtained from the drip irrigation treatment. The SIMDualKc model is an appropriate tool to estimate crop ET and may be further used to improve local irrigation scheduling for processing tomato in the upper reaches of the Yellow river.
1. Introduction
The Hetao Irrigation District (Hetao), located in the upper reaches of the Yellow river, is one of the major grain and cash crops production regions in China. This region is characterized by a typical arid continental climate. The mean annual precipitation is approximately 150 mm, most of which occurs during monsoon season. The mean pan evaporation is in the range of 2200–2400 mm, which is 10 times as large as the precipitation [1,2]. Low precipitation and high potential evaporation make irrigation essential to agriculture development. Hetao covers an area of 1.12 million ha, and about 0.57 million ha of farmland are under irrigation. The amount of annual irrigation water derived from the Yellow river to Hetao is approximately 4.8 billion m3 [3]. Ninety percent (90%) of the total basin water resource is used by agriculture. Ninety-six percent (96%) of the agricultural water is used for irrigation while domestic supply accounts for only 4% [4]. However, the amount of water diverted from the Yellow river has decreased with rapid social economic development since 1999 [5]. As a result, the allocation of water for agriculture has also decreased. Thus, estimating crop evapotranspiration (ET) accurately and improving crop water productivity (WP) are important to maintain sustainable agriculture development when the water resource is limited.
Processing tomato (Lycopersicon esculentum Mill.), mainly used for ketchup and tomato juice, is one of the most popular vegetable crops produced worldwide. As an important and long-term source of lycopene that is beneficial for human health, processing tomato accounts for approximately one third of the world’s tomato production [6]. Due to the favorable weather conditions, lower cost of production, and better benefits for farmers, Hetao has become one of the most important processing-tomato-producing areas in China. The local government has reported that the cultivated area for processing tomato has expanded to 2.47 × 10⁵ hm2 in 2016 and the total yield has already reached 1.85 × 10⁶ t. Processing tomato is a cash crop that consumes a large amount of water. A water shortage would affect the yield of processing tomato negatively, particularly during its sensitive growth stages [7,8]. Thus, irrigation is required throughout the growing season depending on the climatic conditions, especially in arid and semi-arid regions.
The traditional irrigation method used in Hetao is basin irrigation, which may result in low irrigation efficiencies and have negative impacts on crop growth and yield due to over-irrigation [1]. Basin irrigation is convenient for farmers to conduct; however, it also causes problems, such as a lower distribution uniformity and the alternation of soil wetting and drying between irrigation events with relatively long intervals, that may cause water stress to crops [9,10]. Optimizing irrigation strategies is thus important to reasonably utilize the limited water resources [11,12].
Efficient water saving irrigation technologies, such as drip irrigation, have played important roles when considering the improvement of WP. Drip irrigation can control the amount and position of soil moisture precisely to meet crop requirements and improve water management. Water and nutrients can be applied slowly and directly to the root zone or onto the soil surface [13]. Thus, crop yield can be maintained or improved and crop WP can be increased. Plants also suffer from less disease since water is not applied to the foliage directly. Drip irrigation is considered to be a water-saving technology, which can save 30–40% of water loss from deep percolation and water delivery compared with basin irrigation when appropriate irrigation management is applied. Soil evaporation is also decreased since the soil is only partially wetted by drip irrigation [14]. Presently, drip irrigation has been widely adopted in orchard, vegetable, and cereal crops around the world [15,16,17,18]. However, some studies have also demonstrated that the wide use of drip irrigation is still limited due to the high cost of installation and maintenance of drip irrigation systems, low economic returns, and poor technologies available to farmers [19,20,21]. Salt accumulation in the root zone is another concern for farmers using drip irrigation [22]. Plastic mulch is an agronomic technology widely used around the world [23,24,25]. Mulching has the advantages of increasing soil temperature, reducing weed pressure and certain insect pests, maintaining soil moisture, and improving nutrient use efficiency. Many studies in different soil types and climate conditions have indicated that mulching can effectively promote tomato yield and WP [26,27]. Plastic-mulched drip irrigation, an agronomic technology that combines drip irrigation and plastic mulch, is nowadays widely used and will be extended to 1.2 million ha around four provinces in northern China [28]. In recent years, local authorities in Hetao have encouraged farmers to convert from mulched basin irrigation to mulched drip irrigation through demonstration areas with financial support. Crop evapotranspiration depletes more than 90% of water in agricultural water consumption [29]. To better manage irrigation water inputs and improve crop WP, an accurate estimation of crop evapotranspiration is necessary for sustainable agricultural development and water management in arid and semi-arid areas.
Crop ET can be determined through direct measurement using experimental observations (e.g., a weighing lysimeter, the eddy covariance method, the Bowen ratio system) [30,31,32] or estimation with a model (e.g., Priestley-Taylor, Shuttleworth-Wallace, crop coefficient method) [33,34,35,36]. Due to the difficulties and cost of direct crop evapotranspiration measurement in field experiments, models provide an acceptable way of obtaining crop evapotranspiration values. The Food and Agriculture Organization 56 (FAO-56) crop coefficient method, which multiplies a reference crop evapotranspiration rate (ETo) by a crop coefficient (Kc), is one of the most widely used methods for estimating crop evapotranspiration worldwide [37,38,39]. ETo is the evapotranspiration rate of the reference crop with an assumed crop height of 0.12 m, a fixed surface resistance of 70 s/m, and an albedo of 0.23, while Kc, the ratio of ET and ETo, represents the effects of crop characteristics that distinguish specific field crops from the reference crop. Kc is deeply influenced by the soil and crop species and varieties. Kc is also adjusted to different meteorological elements (namely the minimum relative humidity (RHmin) and wind speed) as aerodynamic properties change due to various climatic conditions [40]. Different crops have different Kc. Even for the same crop, Kc varies throughout the growing season due to changes in growth stages and ground cover. Thus, local calibration of Kc is essential to facilitate sustainable water management, especially in arid and semi-arid environments with water-saving management practices. The FAO-56 crop coefficient method can be divided into the single Kc and dual Kc approaches [40]. In the dual Kc approach, Kc is segmented into two separate coefficients: the basal crop coefficient (Kcb) representing the crop transpiration, and the soil evaporation coefficient (Ke). Hence, the single coefficient Kc is replaced by the dual crop coefficients Kcb and Ke. Compared with the single Kc approach, the dual Kc approach makes it possible to better assess the impacts of soil wetting by rain or irrigation as well as the impacts of keeping part of the soil dry or using mulches for controlling soil evaporation [41], and has been widely applied for ET estimation with various technologies, such as drip irrigation, deficit irrigation, due to the simplicity and good performance of the approach [36,42,43,44,45].
The SIMDualKc model adopts the FAO dual Kc approach and computes ET with a daily time step. The model is easy to use and employs a helpful graphical user interface to assist users of various backgrounds [46]. Numerous studies have reported the successful application of the SIMDualKc model for various crops grown in different regions [12,40,47,48]. However, few studies have been conducted to assess the SIMDualKc model for estimating processing tomato ET, and the model should be properly calibrated and validated before use when water management options have not been previously tested. Not many investigations have been conducted on processing tomato ET partitioning under different plastic-mulched irrigation treatments in Hetao. Thus, the SIMDualKc model was selected for estimating processing tomato ET in Hetao. The purposes of this paper are: (1) to calibrate and validate the SIMDualKc model for processing tomato in Hetao; (2) to determine the Kcb, Ke, and variation trend of crop transpiration and soil evaporation during different crop growth stages for plastic-mulched basin and drip irrigation under various water stress conditions; and (3) to analyze the relationships between yield and crop ET (or T), the consumptive use water productivity (WPET), and the transpiration water productivity (WPT) of processing tomato under different irrigation treatments.
2. Materials and Methods
2.1. Experimental Site
Field experiments were conducted at the Jiuzhuang agro-ecological station in Hetao (latitude 40°41′, longitude 107°18′, elevation 1041.2 m above sea level (a.s.l.)) during the crop-growing seasons (from 20 May to 31 August) in 2015 and 2016. The experimental site is characterized by a typical arid continental climate, and it belongs to dry desert climate (BWk) according to the Köppen climate classification. The soil particle size distribution at the experimental station was determined using a laser particle size analyzer and the soil is classified as a homogeneous silt loam soil. The dry bulk density, water content at field capacity, and wilting point were measured on undisturbed soil samples collected in the different horizons of each observation site. Soil samples were collected every 10 cm in the top 0–20 cm layer, and at 20 cm increments below the top layer to a depth of 60 cm. Additionally, the measurements were replicated three times within each sampling depth. The average bulk density of the soil is 1.50 g/cm3. The average soil water content at field capacity and wilting point are 0.35 cm3/cm3 and 0.15 cm3/cm3 to a depth of 60 cm, respectively. Details of the properties of the soil at the experimental site are shown in Table 1.
2.2. Weather Conditions
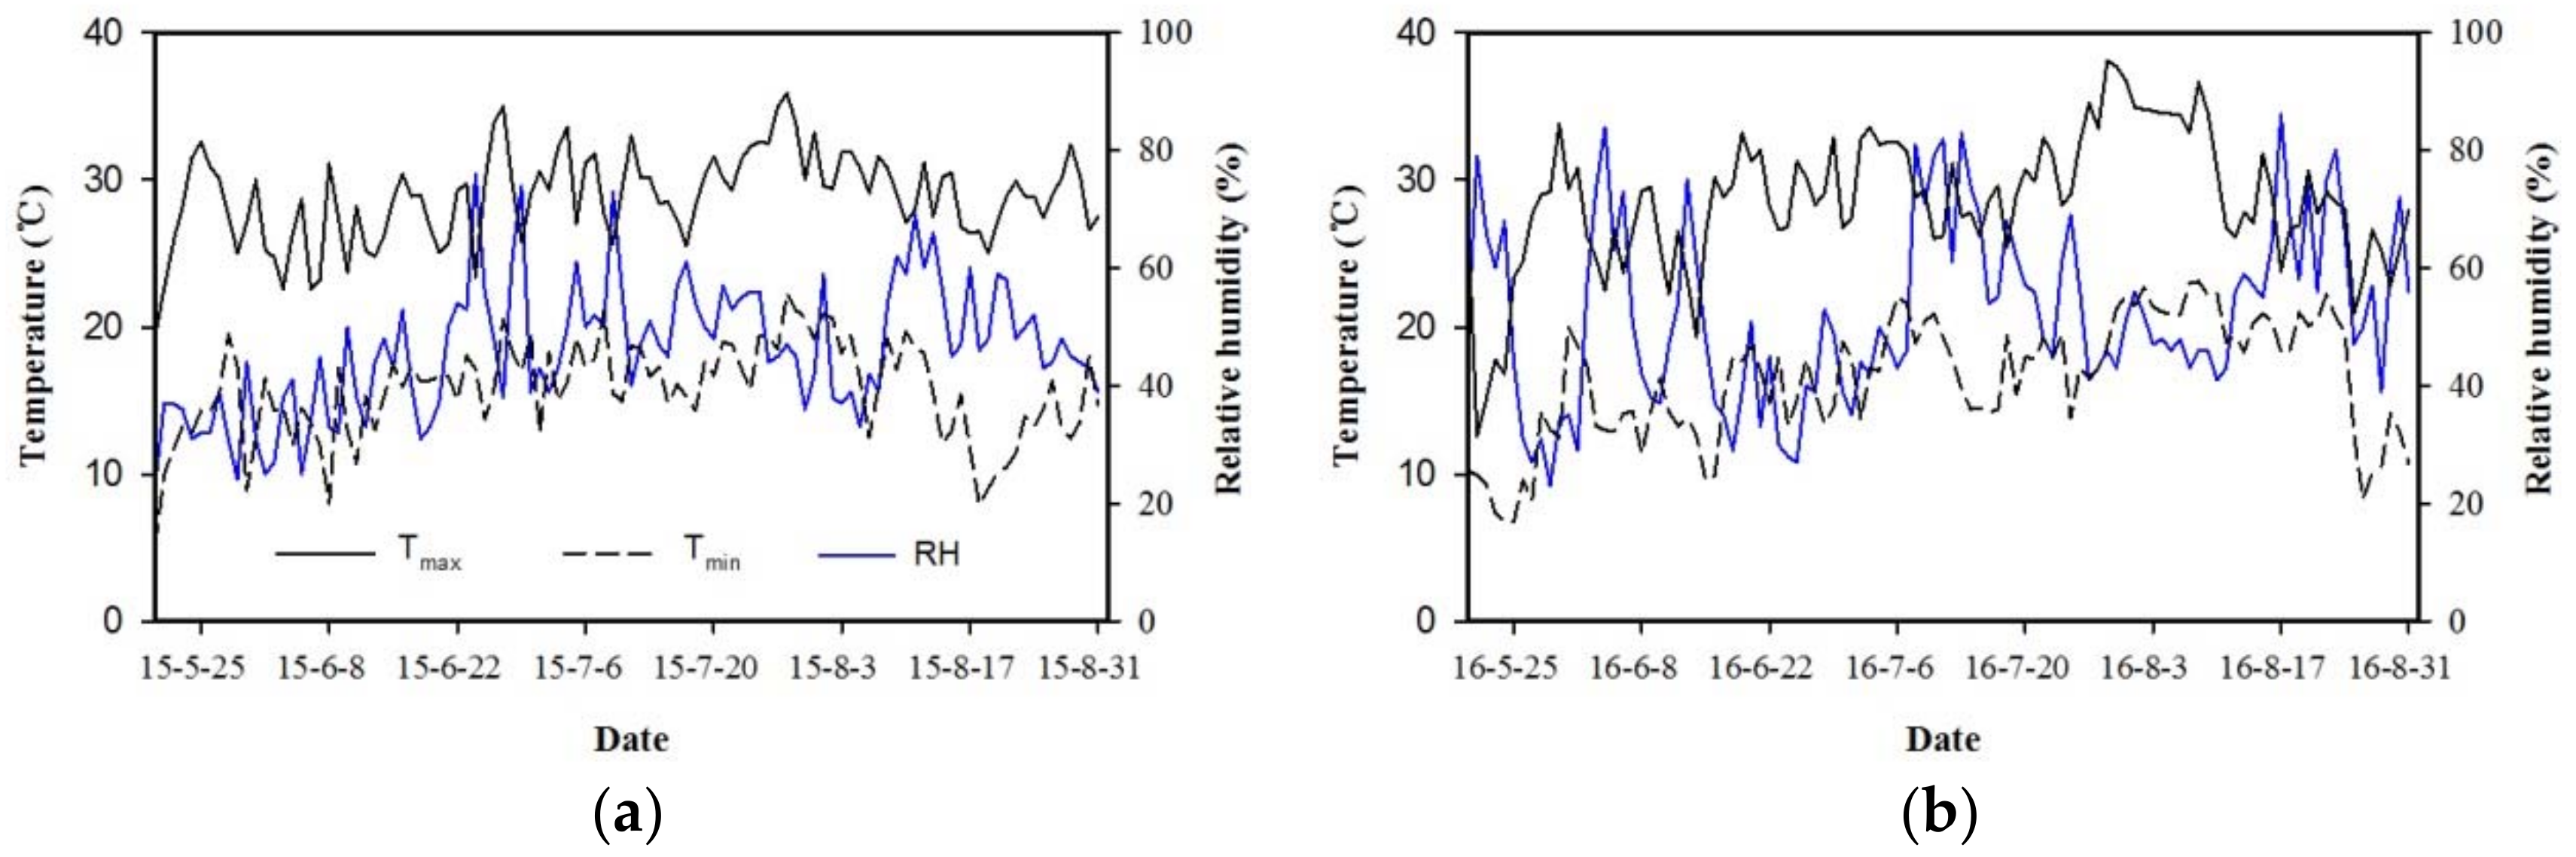
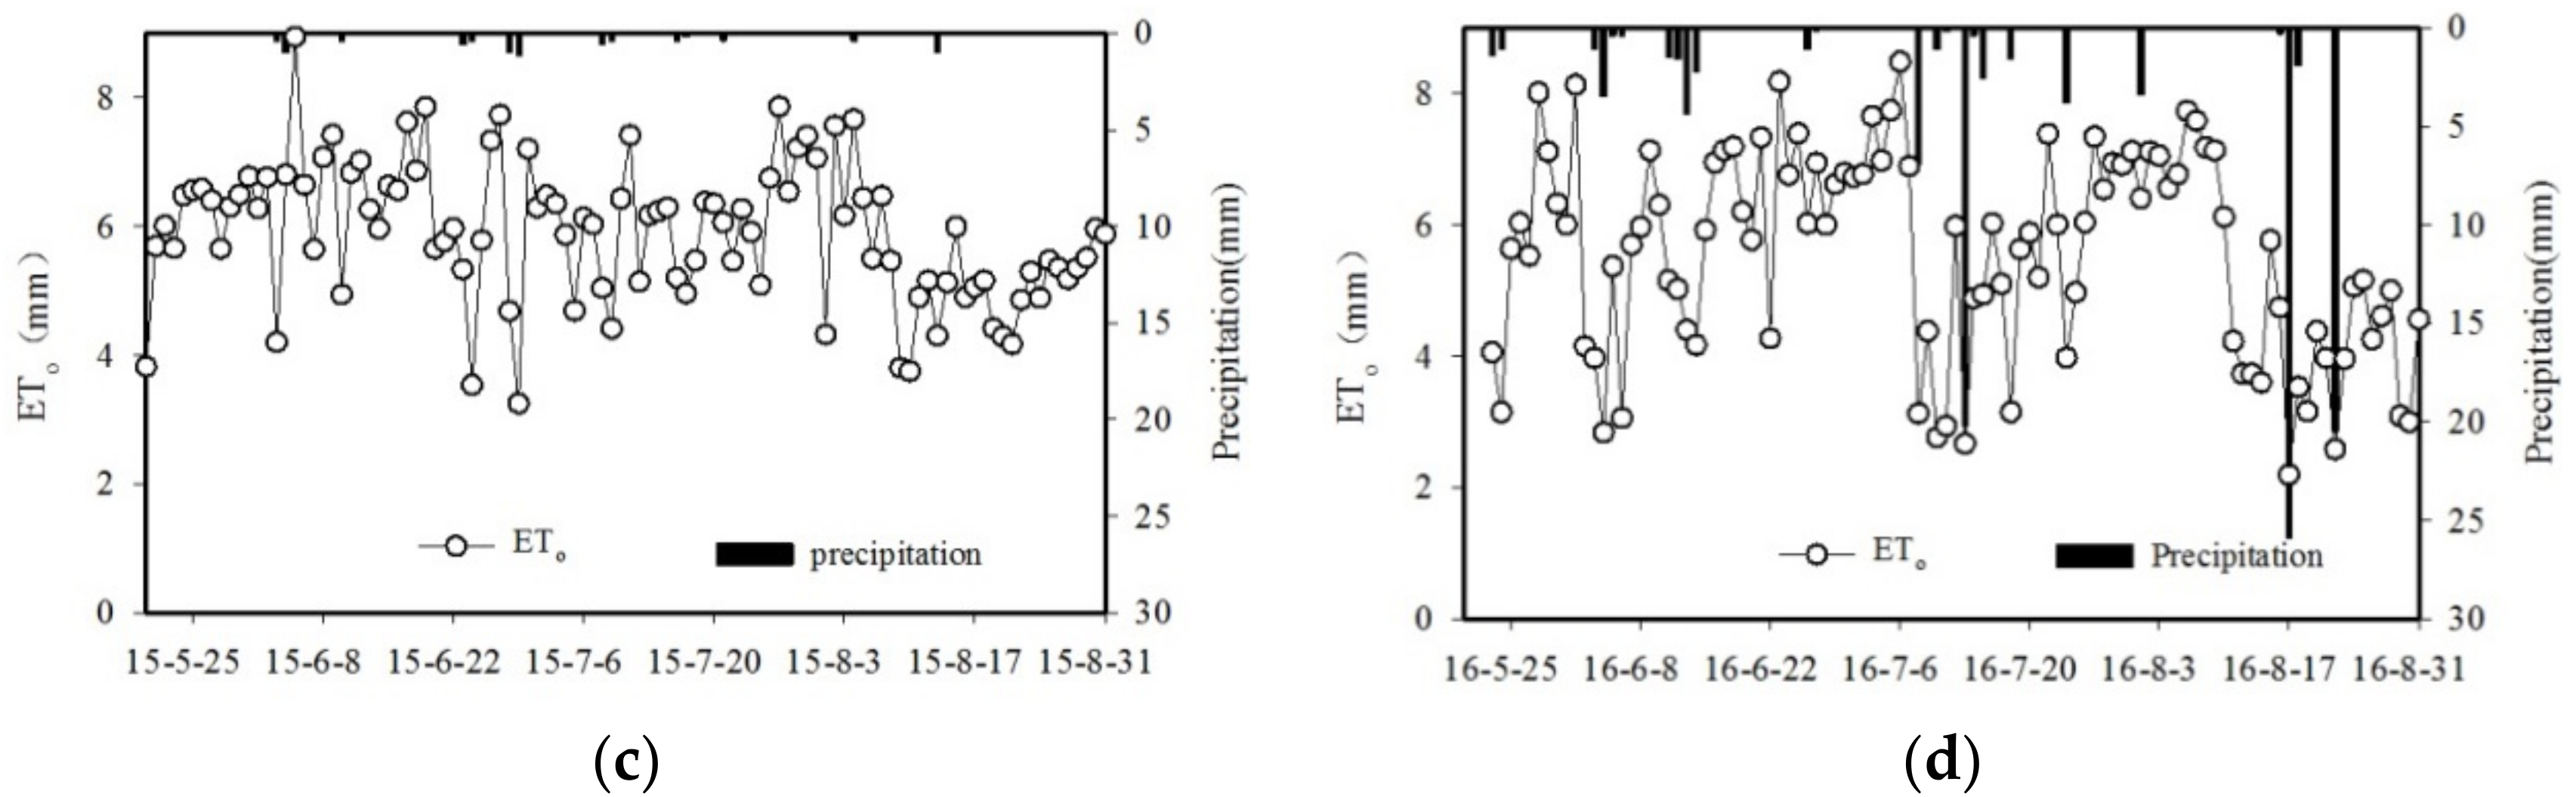
The meteorological variables, including maximum and minimum air temperature (°C), average relative humidity (%), and wind speed (m/s) and direction at 2 m above ground, were observed during the crop-growing seasons with an automatic weather station located close (1.0 km) by the experimental site. Data were sampled every 5 s, averaged over 30 min, and recorded by a data logger. Precipitation was measured by a tipping-bucket rain gauge. The meteorological conditions during the crop-growing seasons are shown in Figure 1. The average air temperature was 21.3, 24.1, and 22.8 °C in June, July, and August of the two years, respectively. The maximum air temperature during the growing season was 35.9 °C on 28 July 2015 (70 days after transplanting (DAT)) and 38.1 °C on 30 July 2016 (72 DAT) during the crop’s rapid growth stages. The minimum average air temperature was 5.1 °C on 20 May 2015 and 6.7 °C on 25 May 2016 when the crop was transplanted to the field. The daily air temperature increased by a small amount during the crop’s initial, development, and mid-season stages, but decreased gradually when the fruit was ripe. The average air relative humidity varied from 25% to 86% during the two years. The decline in relative humidity was usually accompanied by a rise in maximum temperature. Precipitation fluctuated significantly during the growing seasons. The total amount of precipitation during the growing season in 2016 was 107.9 mm. The maximum daily precipitation, with a value of 25.9 mm, occurred on 17 August when the fruit was ripe. However, the climate was very dry in 2015 with a precipitation of 8.4 mm.
The reference evapotranspiration (ETo) was calculated using the FAO Penman-Monteith method from daily meteorological variables [40]. The variation of daily ETo during the crop-growing seasons is shown in Figure 1. The ETo ranged between 3.25 and 8.94 mm/day in 2015 and between 2.19 and 8.48 mm/day in 2016, with an average value of 5.9 and 5.5 mm/day during the crop-growing seasons, respectively. In 2015, the maximum daily ETo occurred at 17 DAT during the initial stage, whereas in 2016, the maximum daily ETo occurred at 48 DAT during the mid-season stage. The cumulative ETo during the growing season was slightly different for the two years, with a value of 614.2 mm in 2015 and 571.9 mm in 2016.
2.3. Experimental Design and Measurements
Field experiments were conducted in 2015 and 2016. Processing tomato (Lycopersicon esculentum Mill.) variety Tunhe No. 3, a local widely used variety, was transplanted on 20 May in both experimental years. Plants were arranged in a wide-narrow rows pattern, with a space of 90 cm for the wide row and 60 cm for the narrow row. Two rows of tomato were transplanted on the wide rows. The planting density was 40,000 plants per ha. The root depths at each growth stage were sampled with the root auger. According to our previous study in this area [9], the root zone soil depth was set as 30 cm in the development stage and was increased to 60 cm in the mid-season and late stages.
Two irrigation methods, drip irrigation and basin irrigation, were used in the experiment. For the drip irrigation treatments, drip lines were placed in the middle of each wide row to irrigate two rows of tomato. The emitter spacing was 0.3 m, and the discharge of each emitter was 2.7 L/h. For the basin irrigation treatments, polyethylene (PE) tubes were used as water pipelines supplying water to the plants. A flow meter, a pressure gauge, and a switch-valve were placed at the upstream end of each plot to control water applications.
A transparent plastic film was placed on the soil surface of wide rows to reduce soil evaporation and increase the soil temperature for both basin and drip irrigation. The plastic film was installed on the soil surface on 25 May (5 days after plant transplanting) for all of the treatments in both experimental years. The width of the plastic film was 0.9 m, and two processing tomato rows were covered. Seventy percent (70%) of the soil surface was covered with the plastic film applied. Then, the film was damaged due to agronomic practices (e.g., spraying pesticide, weeding) and the fraction of film covering soil decreased to 60% after 10 July (52 days after plant transplanting) in both experimental years. The diameter of the holes for transplanting was 0.05 m. Base fertilization was performed according to local custom and consisted of 150 kg/ha of urea (CO(NH2)2), 180 kg/ha of diammonium phosphate ((NH4)2HPO4), and 150 kg/ha of monopotassium phosphate (KH2PO4) before transplanting. Urea (40 kg/ha) was applied as a top dressing during the development and mid-season stages. Pesticide application and weed control were performed uniformly for all treatments.
Following the FAO-56 approach [40], the date of each crop growth stage corresponded to the time that 80% of the plants attained the stage. The crop growth stages were divided into four stages considering canopy coverage: (i) the initial stage, from plant transplanting to 10% canopy coverage; (ii) the development stage, from 10% to effective full canopy coverage; (iii) the mid-season stage, from full coverage to the start of fruit maturity; and (iv) the late stage, from the start of maturity to harvest. The crop growth stages of processing tomato observed in 2015 and 2016 are shown in Table 2. The fruits subject to basin irrigation treatments matured later than those subject to drip irrigation treatments. Thus, the late stage for drip irrigation was observed earlier than that for basin irrigation.
The treatment plots were in complete random distribution with three replicates to minimize the effects of spatial heterogeneity. The size of each plot was 45 m2 (4.5 m × 10 m). During the initial stage, each treatment was irrigated with the same amount water (55 mm in 2015 and 45 mm in 2016) to assure plant establishment.
Irrigation water was pumped from groundwater. Groundwater depth fluctuated, and was about 1.8–3.0 m below the ground surface at the experimental site during the two growing seasons. The ground surface was flat and irrigation water was evenly distributed. Both the basin and drip irrigation systems were observed to provide a relatively uniform water application throughout the growing seasons.
The irrigation treatments were set up as the following:
- drip irrigation treatment (DI), where the irrigation schedule was based upon soil moisture measurements. The treatment plots were irrigated with the lower and upper limits of the soil water content at the root zone for irrigation, being 70% and 80–90% of field capacity, respectively. The irrigation treatments for 2015 and 2016 are shown in Table 3.
- basin irrigation treatment (BI), where the treatment plots were irrigated during the development stage and mid-season stage with about 80 mm of water based on the experience of local farmers, whereas in 2016 only 50 mm of water were applied in the mid-season stage due to the relatively large rainfall that occurred during that stage (see Table 3).
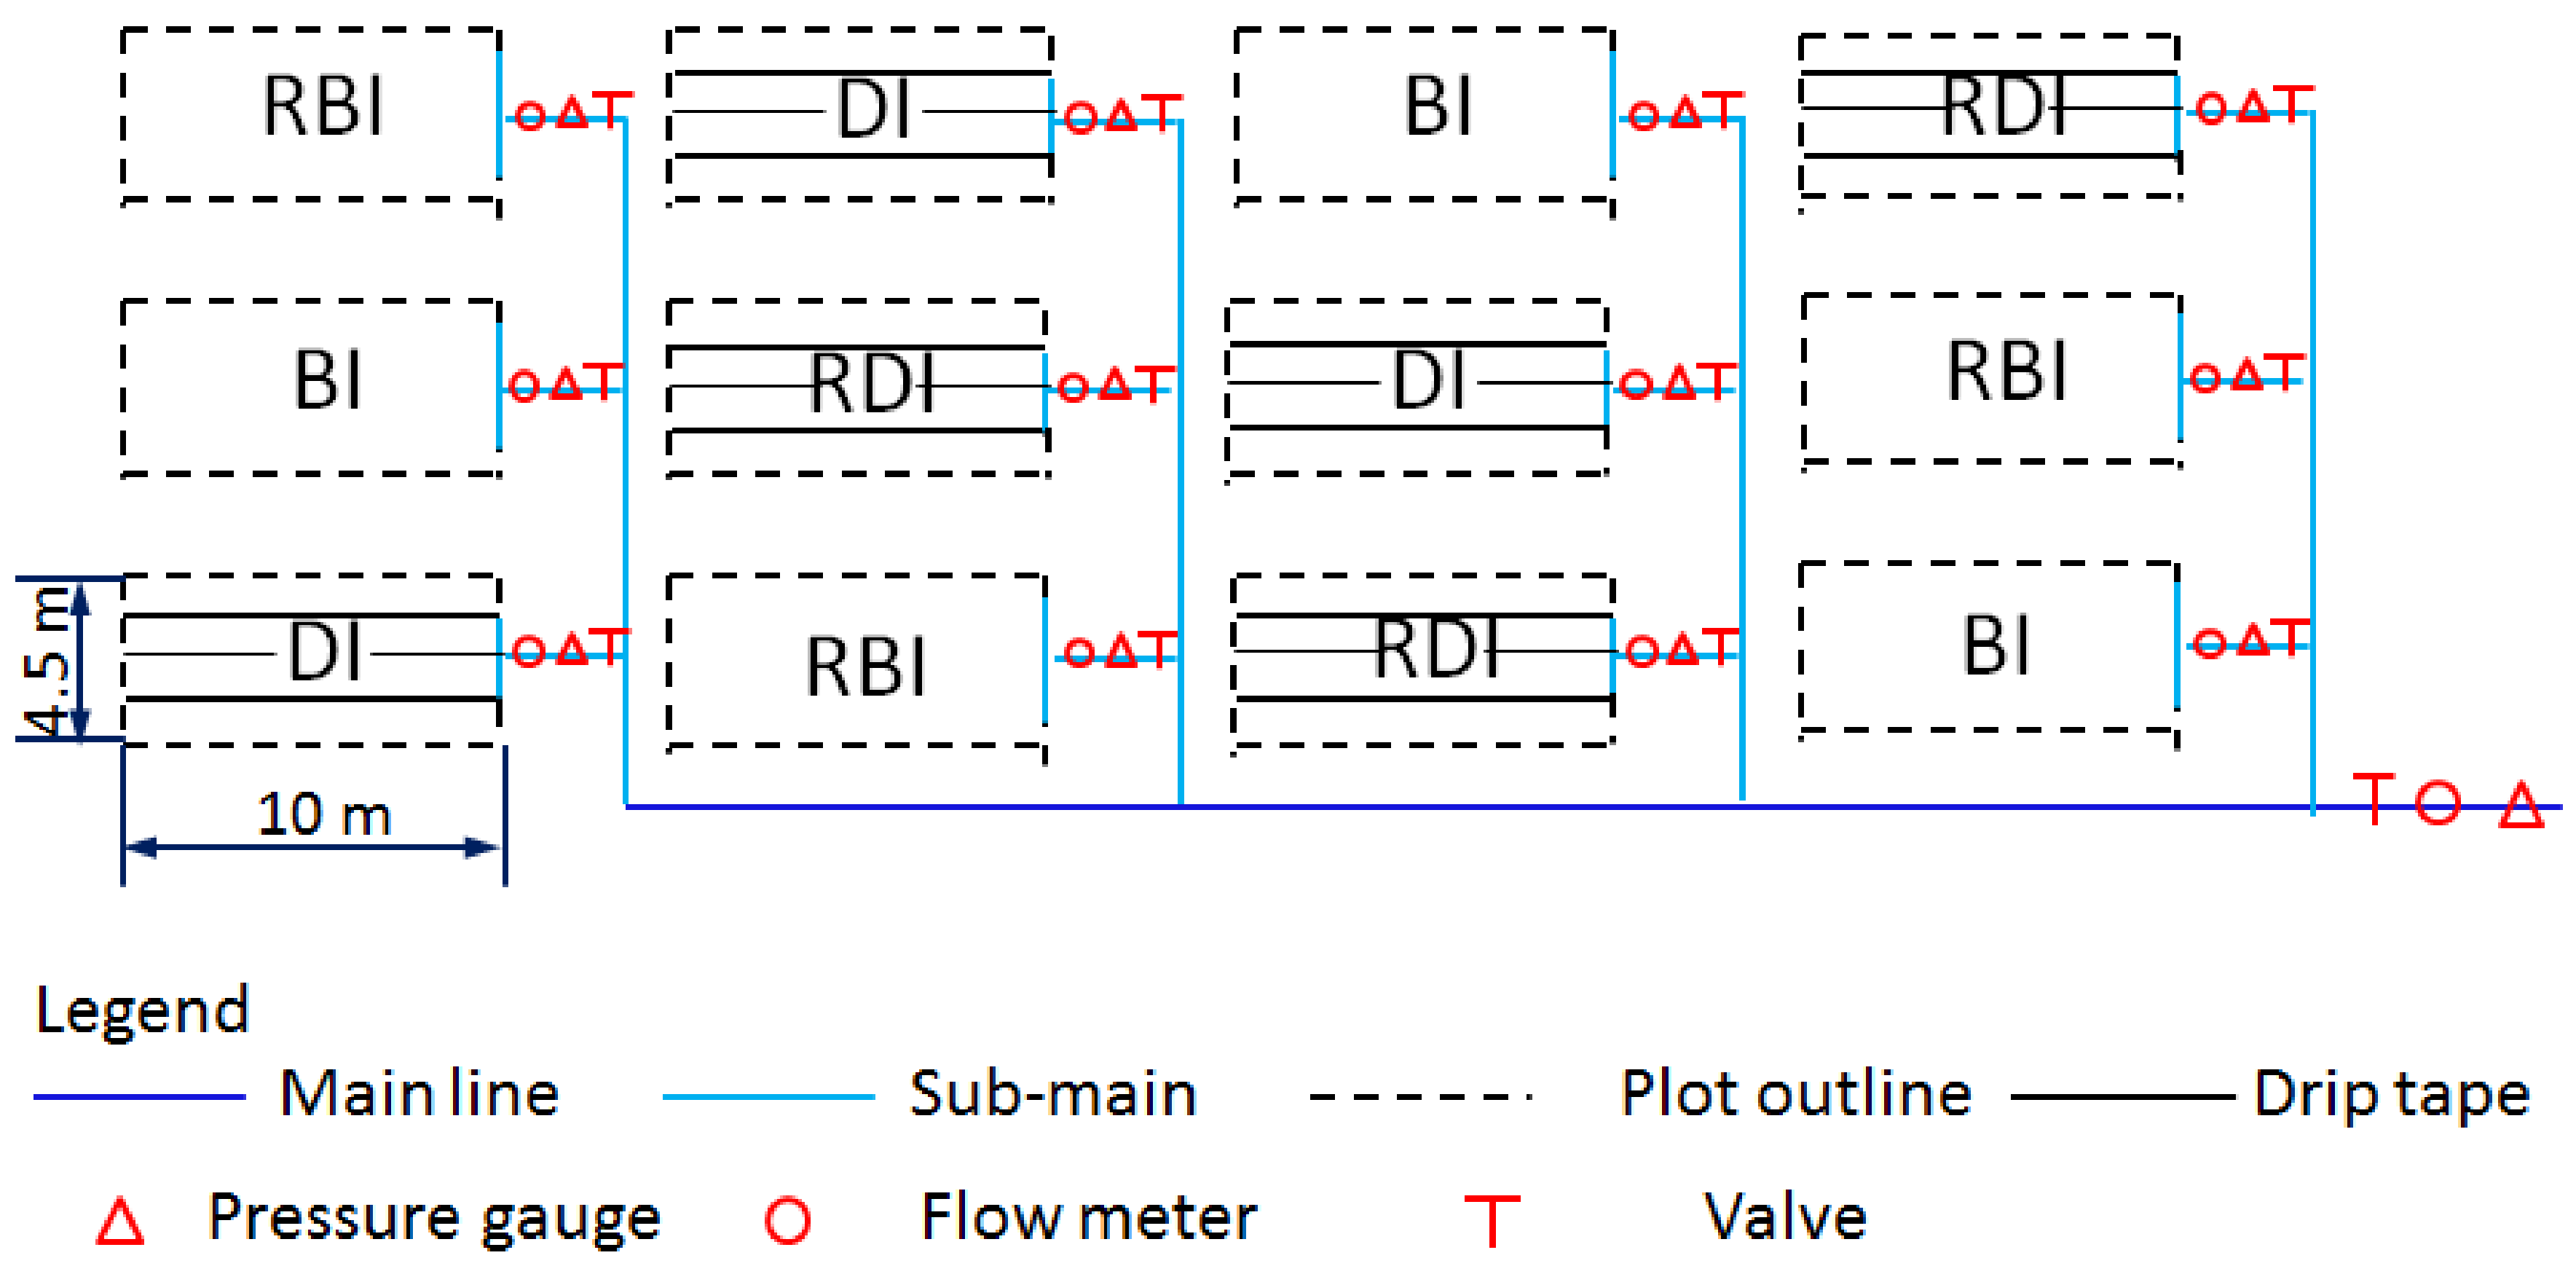
- reduced drip irrigation treatment (RDI) and a reduced basin irrigation treatment (RBI) were considered in 2016. The RDI and RBI treatments were irrigated with 60% of the amount of water of the DI and BI treatments at the same time, respectively. The schematic experimental setup of the 2016 growing season is displayed in Figure 2.
2.4. Measurement
The soil water content in each treatment was measured every 7 days with the soil samples collected by a soil auger every 10 cm for the top 20 cm and every 20 cm from 20 to 60 cm during the crop-growing seasons. Three sampling points were selected in each treatment. Then, the soil water content at the root depth of 60 cm was averaged, and it was used to calibrate and validate the model.
The plant heights (hc) of six randomly selected plants were measured every 7 days. The fraction of canopy cover (fc) at each growth stage was estimated as the percentage of soil shaded by the crop with photographs taken above the plant canopy at near solar noon. Fruits were harvested by hand twice in both years (90 and 98 DAT in 2015 and 92 and 98 DAT in 2016). The yield of each plot was measured with the fruits of 30 randomly and consecutively selected plants. The mean value of three replicates was considered as the yield of each treatment.
Consumptive use water productivity (WPET) was expressed as the ratio between the fresh total yield and the actual crop evapotranspiration [49]:
where WPET is the consumptive use water productivity (kg/m3), Y is the fresh processing tomato yield measured in the field experiment (t/ha), and ET is the crop evapotranspiration simulated using the SIMDualKc model (mm).
Transpiration water productivity (WPT) was calculated as the ratio of the fresh total yield and the crop transpiration:
where WPT is the transpiration water productivity (kg/m3), and T is the crop transpiration simulated using the SIMDualKc model (mm).
2.5. SIMDualKc Model and Data Requirements
The SIMDualKc model was used to estimate the crop evapotranspiration in Hetao. The crop coefficient Kc consists of the crop basal coefficient Kcb and the soil evaporation coefficient Ke. Transpiration and evaporation are partitioned from crop evapotranspiration through multiplying Kcb and Ke by the reference evapotranspiration, respectively. When the model is applied to a new crop or to a new environment, the Kcb values have to be calibrated for various crop cultivars, and the Ke values need to be calculated through the daily soil water balance of the evaporative layer for different soils. The model computes the soil water balance in the root zone following [40]. Further descriptions of the model can be found in [46].
The actual crop ET was calculated using the model as follows:
where KsKcbETo represents the actual crop transpiration, while KeETo represents the soil evaporation. Ks is the water stress coefficient.
The soil water balance in the root zone was computed in terms of depletion at the end of every day [46]:
where Dr,i and Dr,i−1 are the root zone depletion at the end of day i and the previous day, i − 1 (mm), respectively, Pi is the precipitation (mm), ROi is the runoff from the soil surface (mm), Ii is the net irrigation depth (mm), CRi is the capillary rise from the groundwater (mm), ETi is the actual crop evapotranspiration (mm), and DPi is the deep percolation beyond the root zone (mm). In the present study, CR was not considered since the water table was relatively deep, about 1.8–3.0 m, while the maximum depth of the root zone was 0.6 m. No runoff was observed during the two experimental years; thus, RO was considered to be 0. DP was calculated with the default method described by [46].
The impact of plastic film on soil evaporation is considered in the SIMDualKc model. The model has successfully been applied to mulched conditions in various crops and regions [45,48]. Drip irrigation only wets part of the soil surface. Thus, the calculation of soil evaporation is computed in two fractions under drip irrigation: one is calculated for the fractions of soil wetted by precipitation only, and the other is calculated for the fraction of soil wetted by irrigation. Information about plastic mulch and drip irrigation can be found in [46].
The calibration of the SIMDualKc model included the process of adjusting significant model parameters to minimize differences between the observed and simulated soil water contents using data collected during the DI and BI treatments of 2015. The main adjusting parameters were: the crop parameters, e.g., the crop basal coefficient Kcb and the soil water depletion fraction for no stress (p), the soil evaporation parameters, e.g., the evaporative soil layer depth (Ze), the total evaporable water (TEW), and the readily evaporable water (REW). Validation consisted of evaluating the accuracy of the model for soil water content using the calibrated parameter values with the independent data sets relative to the DI and BI treatments of 2016. Parameters were adjusted using a trial and error procedure.
2.6. Statistical Indicators for Model Performance
The determination coefficient (R2), root mean square error (RMSE), mean relative error (MRE), and Nash–Sutcliffe coefficient (NS) were used to evaluate the performances of the model, which are expressed as follows:
where Oi (cm3/cm3) and Si (cm3/cm3) are the observed and simulated values of soil water content at the i-th step, respectively; n is the number of the time steps; and (cm3/cm3) and (cm3/cm3) are the observed and simulated mean values, respectively. RMSE (cm3/cm3) and MRE values closer to 0 indicate a more accurate model. The model’s calibration is considered to be in a good situation when the simulated soil water content has an MRE value lower than 0.3 and an RMSE value lower than 0.03 cm3/cm3. R2 values close to 1.0 represent that the variation of the observed values is well-captured by the model. The NS values range from −∞ (poor model) to 1.0 (perfect model). A zero value of NS means the simulated value is as good as the observation mean.
3. Results and Discussion
3.1. Model Calibration and Validation
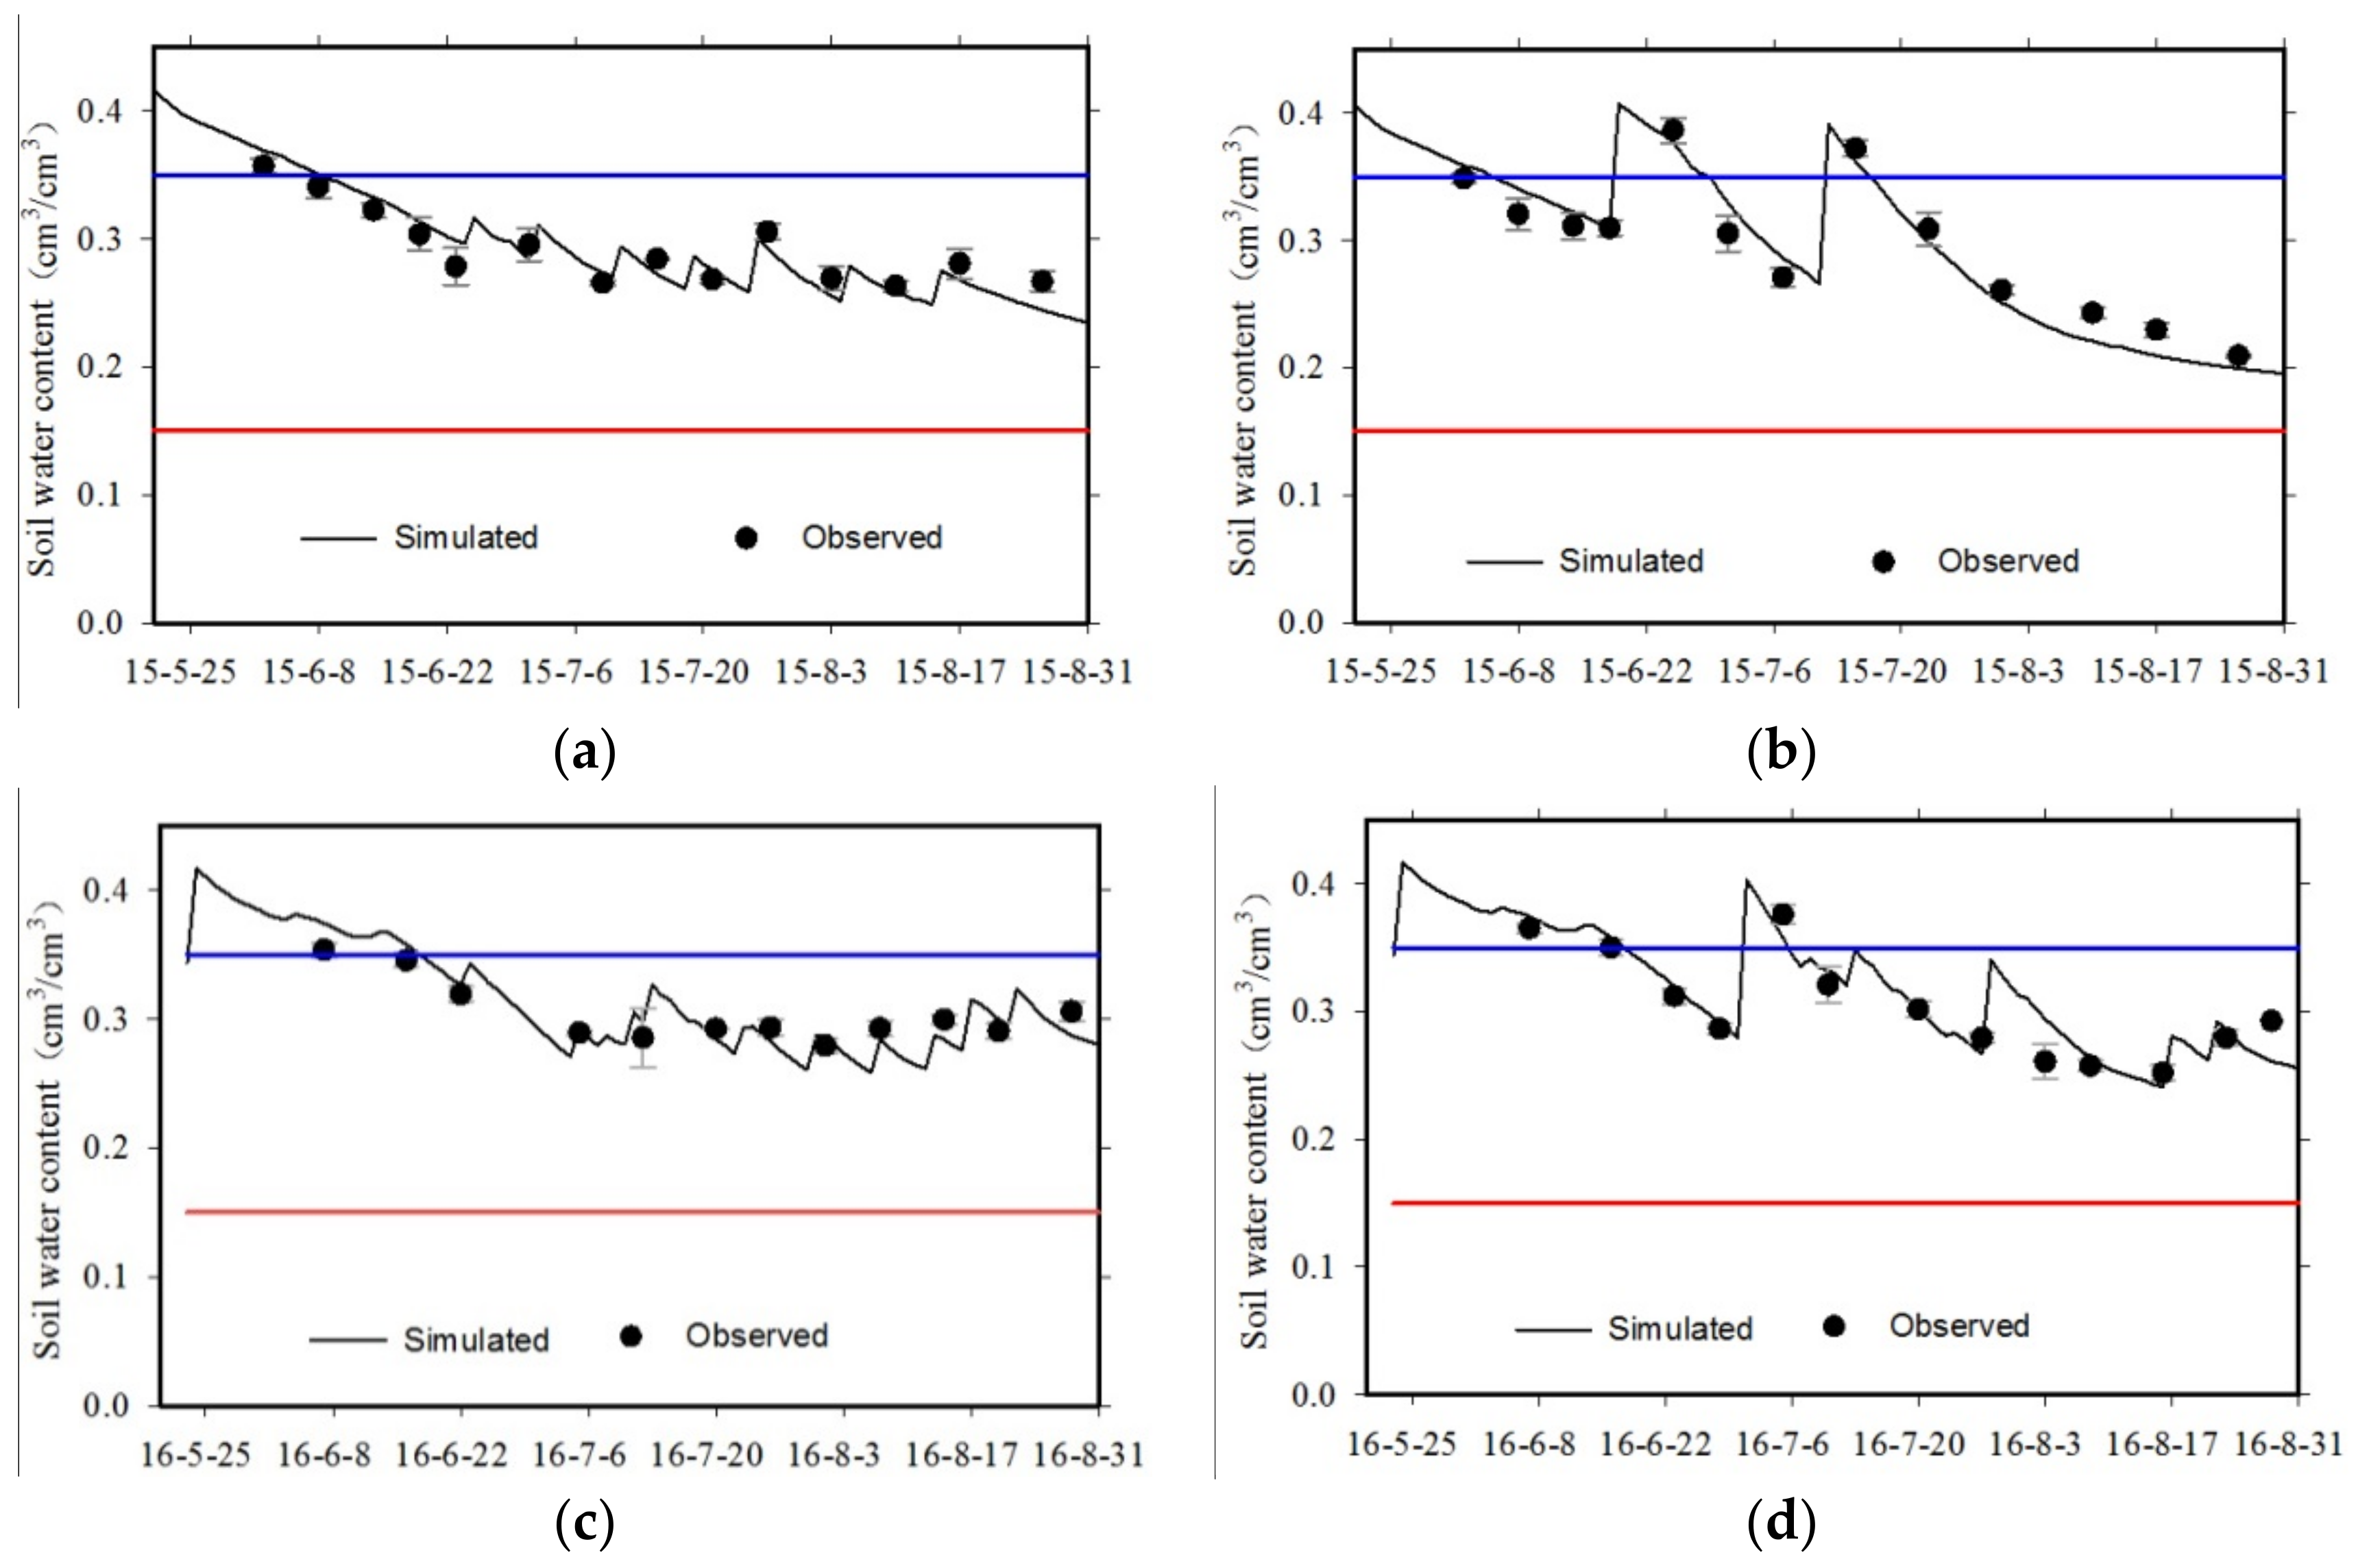
The measured and simulated soil water content in the root zone for the calibration and validation procedures is shown in Figure 3. It can be found that the simulated soil water content using SIMDualKc closely followed the observed soil water content. Table 4 presents the initial values and the calibrated results of the crop and soil evaporation parameters of the SIMDualKc model. For the drip irrigation treatments, the fraction of soil surface wetted by irrigation or precipitation (fw) was set to 0.4, referring to [40], while for the basin irrigation treatments, fw was set to 1.0. In the calibration process, the initial values adopted were recommended by FAO56. Greater calibrated values for TEW and Ze may be due to the larger silt content of the soil at the experimental site as compared with the soil in FAO56, leading to greater field capacity. The calibrated p values were slightly smaller than those proposed in FAO56, which may be attributed to the local crop variety that is more sensitive to water stress. The experimental data of hc and fc were also used during the calibration process. The maximum hc was 0.45 m for the DI treatment and 0.48 m for the BI treatment, whereas the maximum value of fc was 0.7 for both treatments.
The model simulation had RMSE values of 0.01–0.02 cm3/cm3, MRE values of −0.01–0.01, and NS values of 0.76–0.92 for the calibration and validation treatments in the two experimental years, respectively. Linear regression was performed between the simulated soil water content and the observed soil water content, and the determination coefficient R2 values were in the range of 0.89–0.94. The results of both the model simulation and the linear regression supported that the variation of the observed soil water content throughout the crop-growing seasons could be well-explained by the SIMDualKc model. Several studies have also shown similar goodness-of-fit results on the SIMDualKc model’s performance [12,50,51].
3.2. Basal Crop Coefficient and Soil Evaporation Coefficient Dynamics
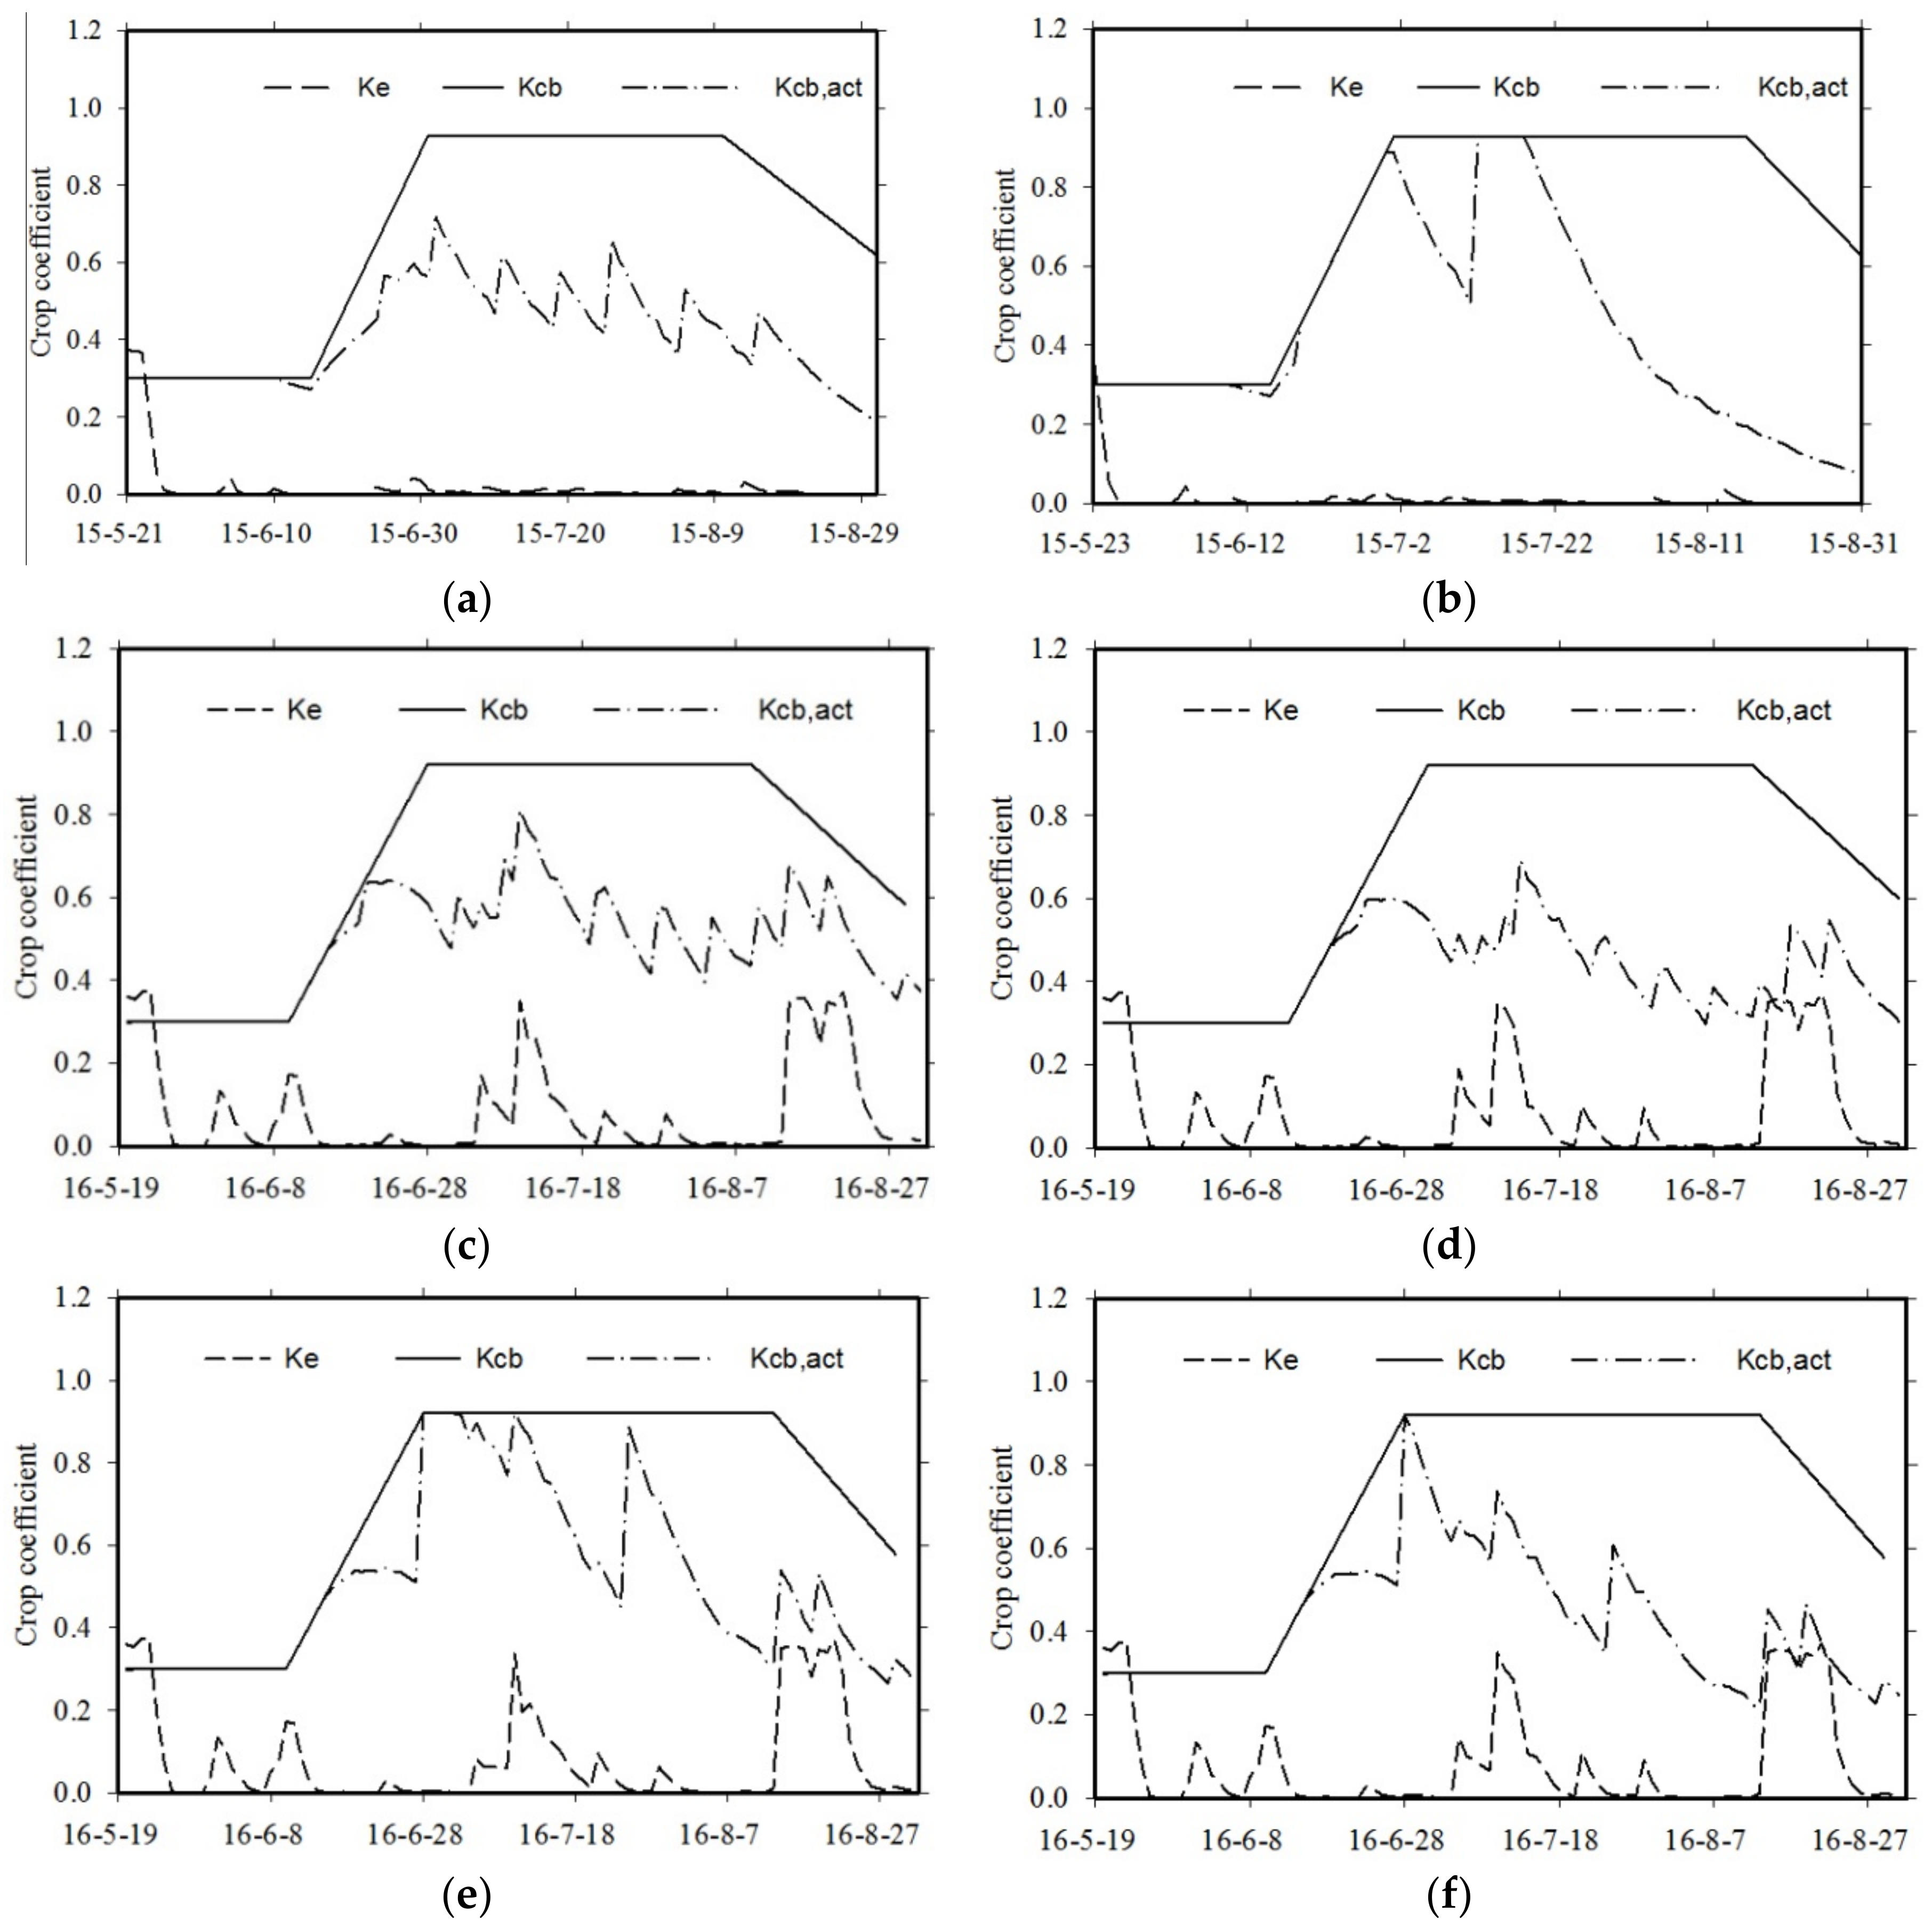
The basal crop coefficient Kcb for processing tomato and the soil evaporation coefficient Ke over the crop-growing seasons are shown in Figure 4. The calibrated potential Kcb values were 0.30, 0.92, and 0.60, respectively (Table 4). The actual Kcb showed day-to-day fluctuation with values in the range of 0.27–0.30, 0.30–0.64, 0.29–0.81, and 0.19–0.68 (drip irrigation), 0.27–0.30, 0.30–0.89, 0.20–0.93, and 0.08–0.54 (basin irrigation) for the initial, development, mid-season, and late-season stages, respectively. The Kcb values in this study were lower than those proposed by FAO56 with one exception in the initial stage. This may be attributed to the shorter growing season (103 days in this study compared with 135–180 days in FAO56), the shallower root depth (0.6 m in this study compared with 0.7–1.5 m in FAO56), and the lower fraction of soil covered by the crop canopy (fc) (0.7 in this study compared with 0.8–1.0 in FAO56).
The actual Kcb values of all the treatments were equal to the potential Kcb during the initial stage (Figure 4). This is attributed to the fact that the plots were irrigated with around 45–55 mm of water when the crop was transplanted. During the development, mid-season, and late stages, the actual Kcb values of the DI treatment were consistently smaller than the potential Kcb, indicating that the irrigation water could not meet the crop water requirement. The actual Kcb values of the BI treatment were smaller than those of the potential Kcb with the exception of the irrigation period during the development and mid-season stages, reflecting that basin irrigation could only satisfy the crop water requirement for a short time as a large amount of irrigation water was applied. For the reduced irrigation treatments, their actual Kcb values were smaller than those of the DI and BI treatments except for the initial stage. The reduced irrigation treatments also caused more serious water stress on crop growth due to the lower amount of water applied for irrigation. The peaks of Ke were related to irrigation and precipitation. The dynamics of Kcb,act showed that the plants were under water-stressed conditions during most of the growing season. The above results indicated that the current drip irrigation regime for processing tomato in Hetao should be improved since the crop was under water-stressed conditions during most of the crop growth stages for the DI treatment.
Figure 4 clearly shows that there was strong evidence of high water stress among all the treatments for almost the entire crop season in both experimental years, indicating that all of the irrigation schedules were inadequate to prevent water stress and should be improved to meet crop water requirements. The curve of Kcb,act was underneath that of the potential Kcb during most of the growing season. Only one basin irrigation event was taken during the mid-season stage and no basin irrigation events took place during the late stage, resulting in severe water stress (Figure 4b). However, basin irrigation during the late stage may result in fruit rot and a decrease in the sugar content in the fruit. Thus, drip irrigation with partial soil wetting is an appropriate irrigation method for processing tomatoes in Hetao.
The soil evaporation coefficients were smaller than the basal crop coefficient (see Figure 4), implying that a very small proportion of water was lost by evaporation due to the plastic mulch. However, Ke increased significantly after large rainfalls occurred in July and August 2016. The damage of the plastic film by frequent agronomic practices resulted in a decrease in the amount of mulch covering the soil and an increase in soil evaporation. The highest Ke values were found during the initial stage of the two years due to the small fraction of crop cover. This also may be attributable to the fact that the soil surface was covered by plastic film 5 days after plant transplanting, resulting in a relatively larger amount of evaporation during this stage. No significant differences (p < 0.05) in Ke were observed among the treatments during the entire growing season. The variation in soil evaporation between the two years was mainly caused by the difference of rainfall.
Few publications are available about the crop coefficients of processing tomato under various water-stressed conditions. Based on the measurement of eddy covariance, Amayreh and Al-Abed found the Kc,act values of field-grown tomato to be 0.65, 0.82, and 0.52, respectively, at the development stage, mid-season stage, and late stage in Jordan Valley [31]. Hanson and May reported that the average Kc,act values of drip-irrigated processing tomato ranged from 0.19 at 10% canopy coverage to 1.08 for canopy coverage exceeding about 90% in San Joaquin Valley, California (USA) [52]. In this study, the average Kc,act values at the initial, development, mid-season, and late stages were, respectively, 0.30, 0.49, 0.51, and 0.41 for drip irrigation and 0.30, 0.51, 0.59, and 0.29 for basin irrigation over the two years. The differences in the Kc values obtained by our study and those from the literature may be attributed to differences in (i) the methods used for ET and ETo measurement and estimation; (ii) crop varieties, cultivars, and the length of their growing season and growth stages; (iii) soils, irrigation regimes, and cultivations; and (iv) weather conditions at specific locations (namely mean RHmin and wind speed).
3.3. Crop Evapotranspiration Partitioning
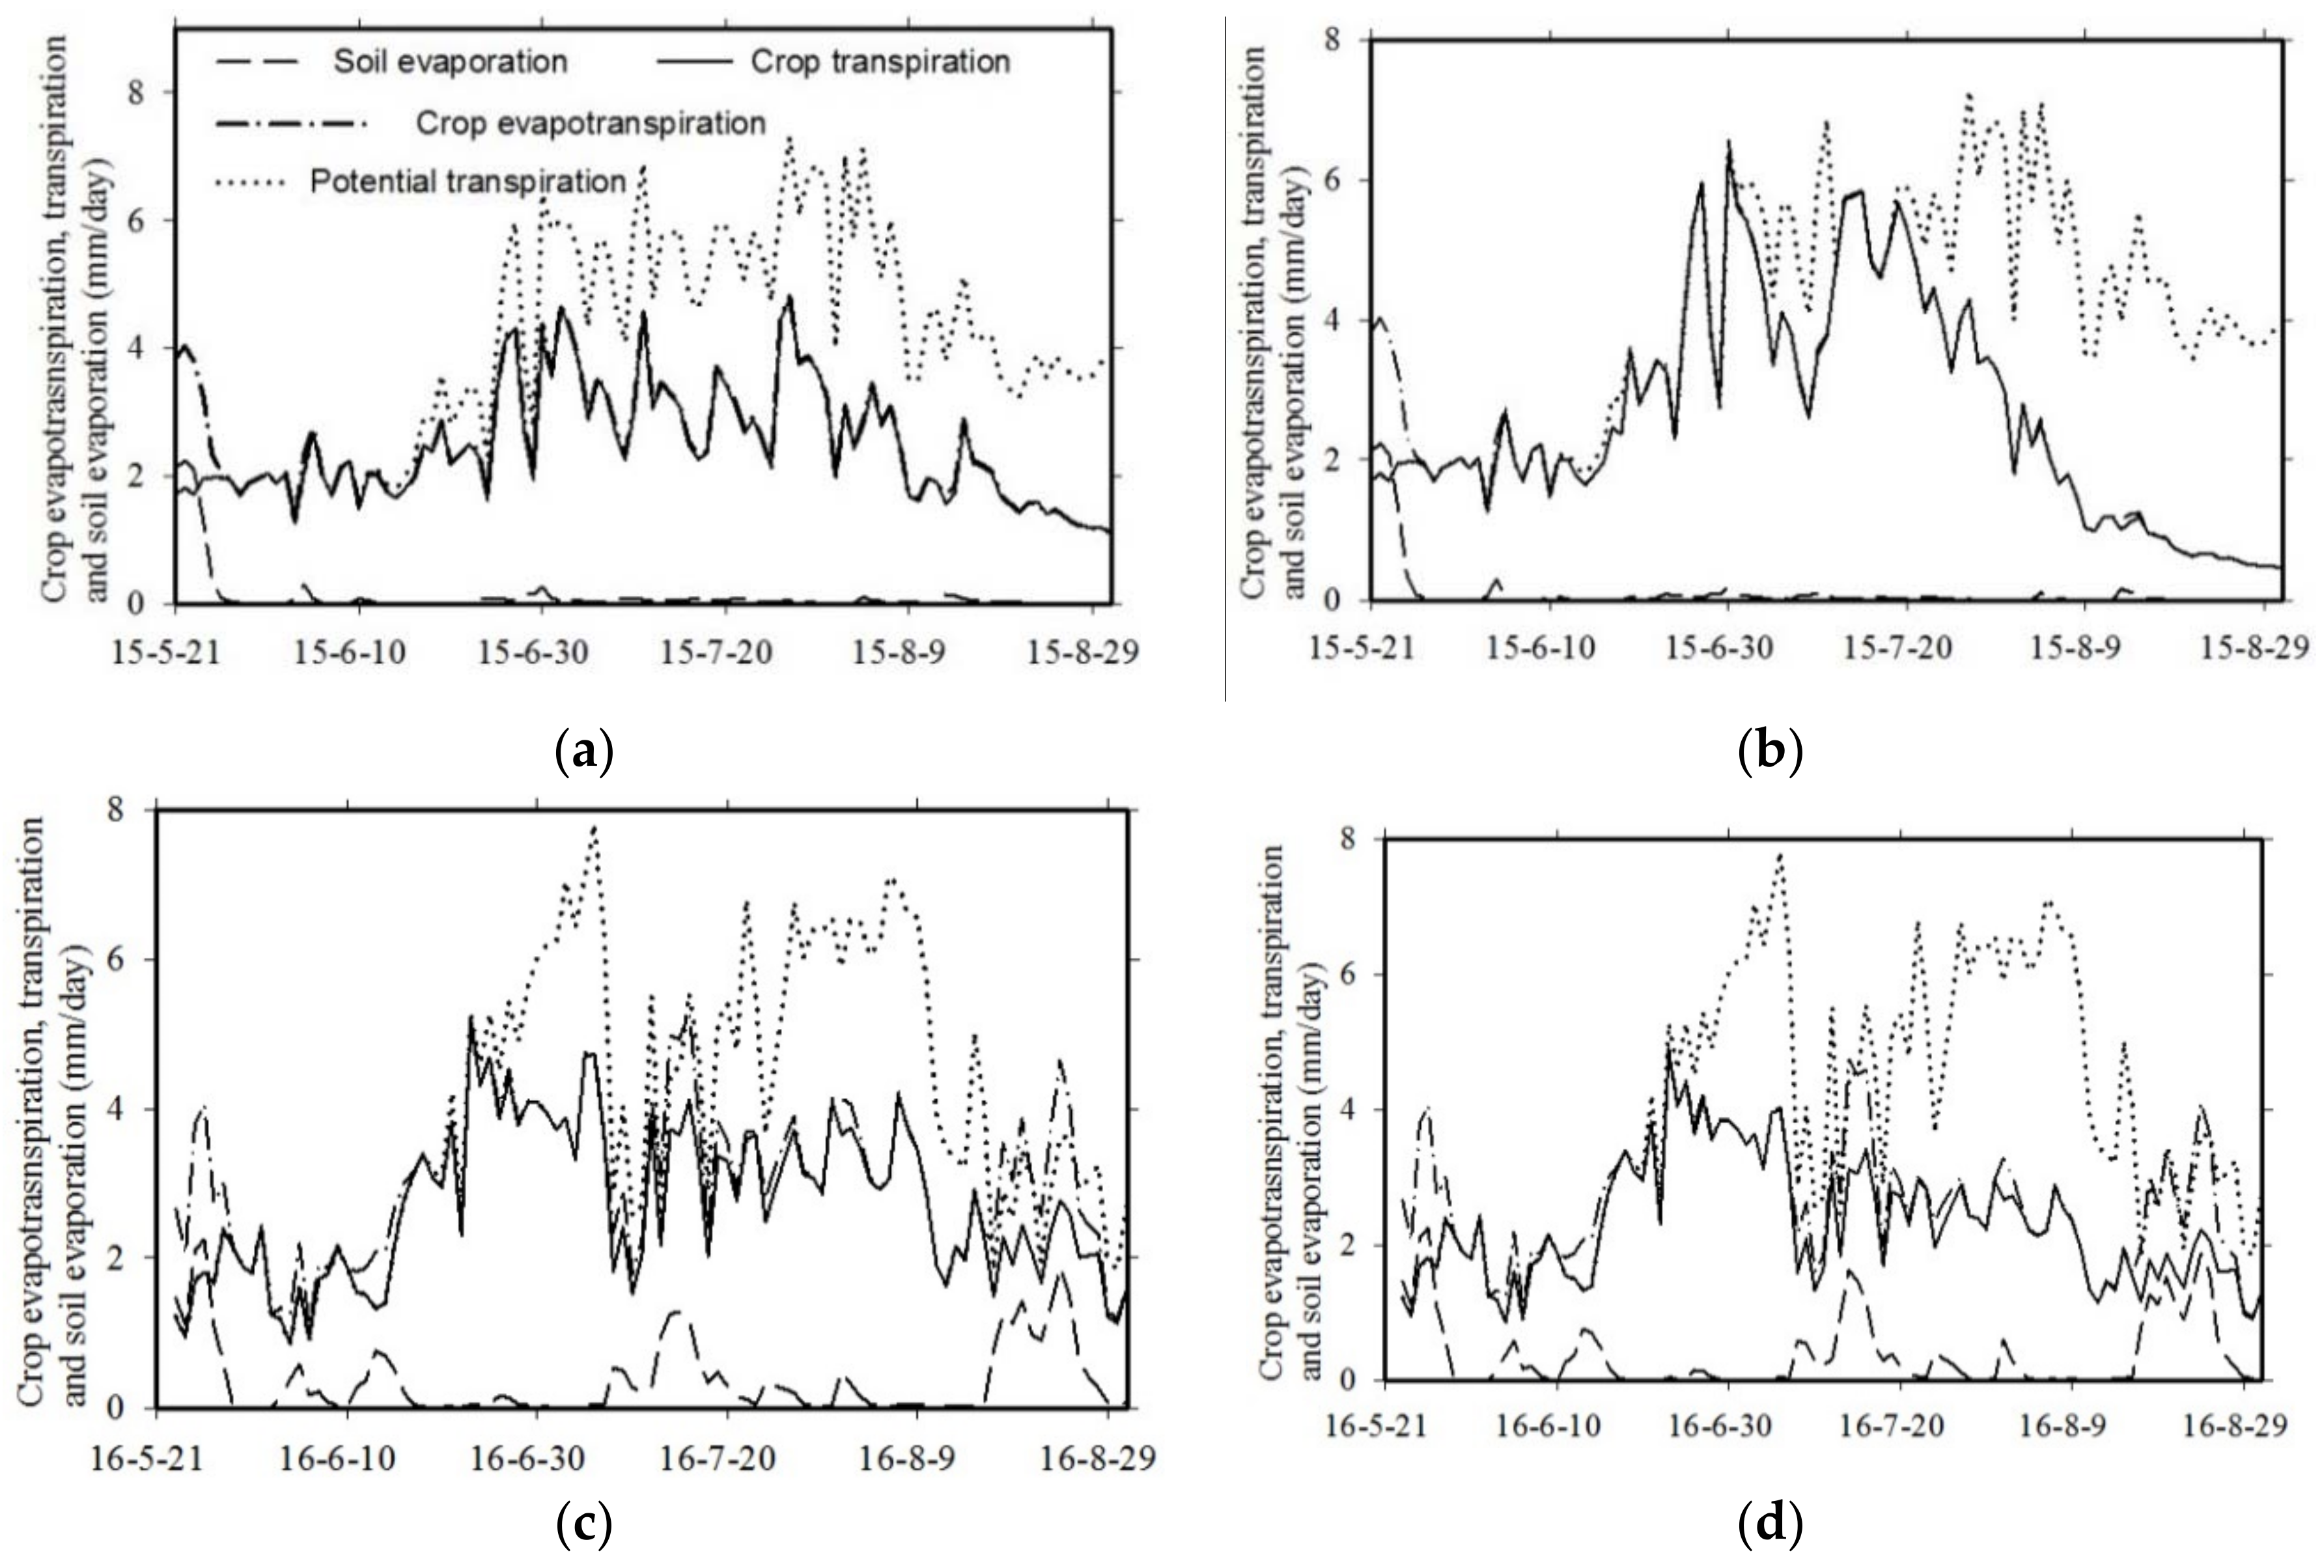
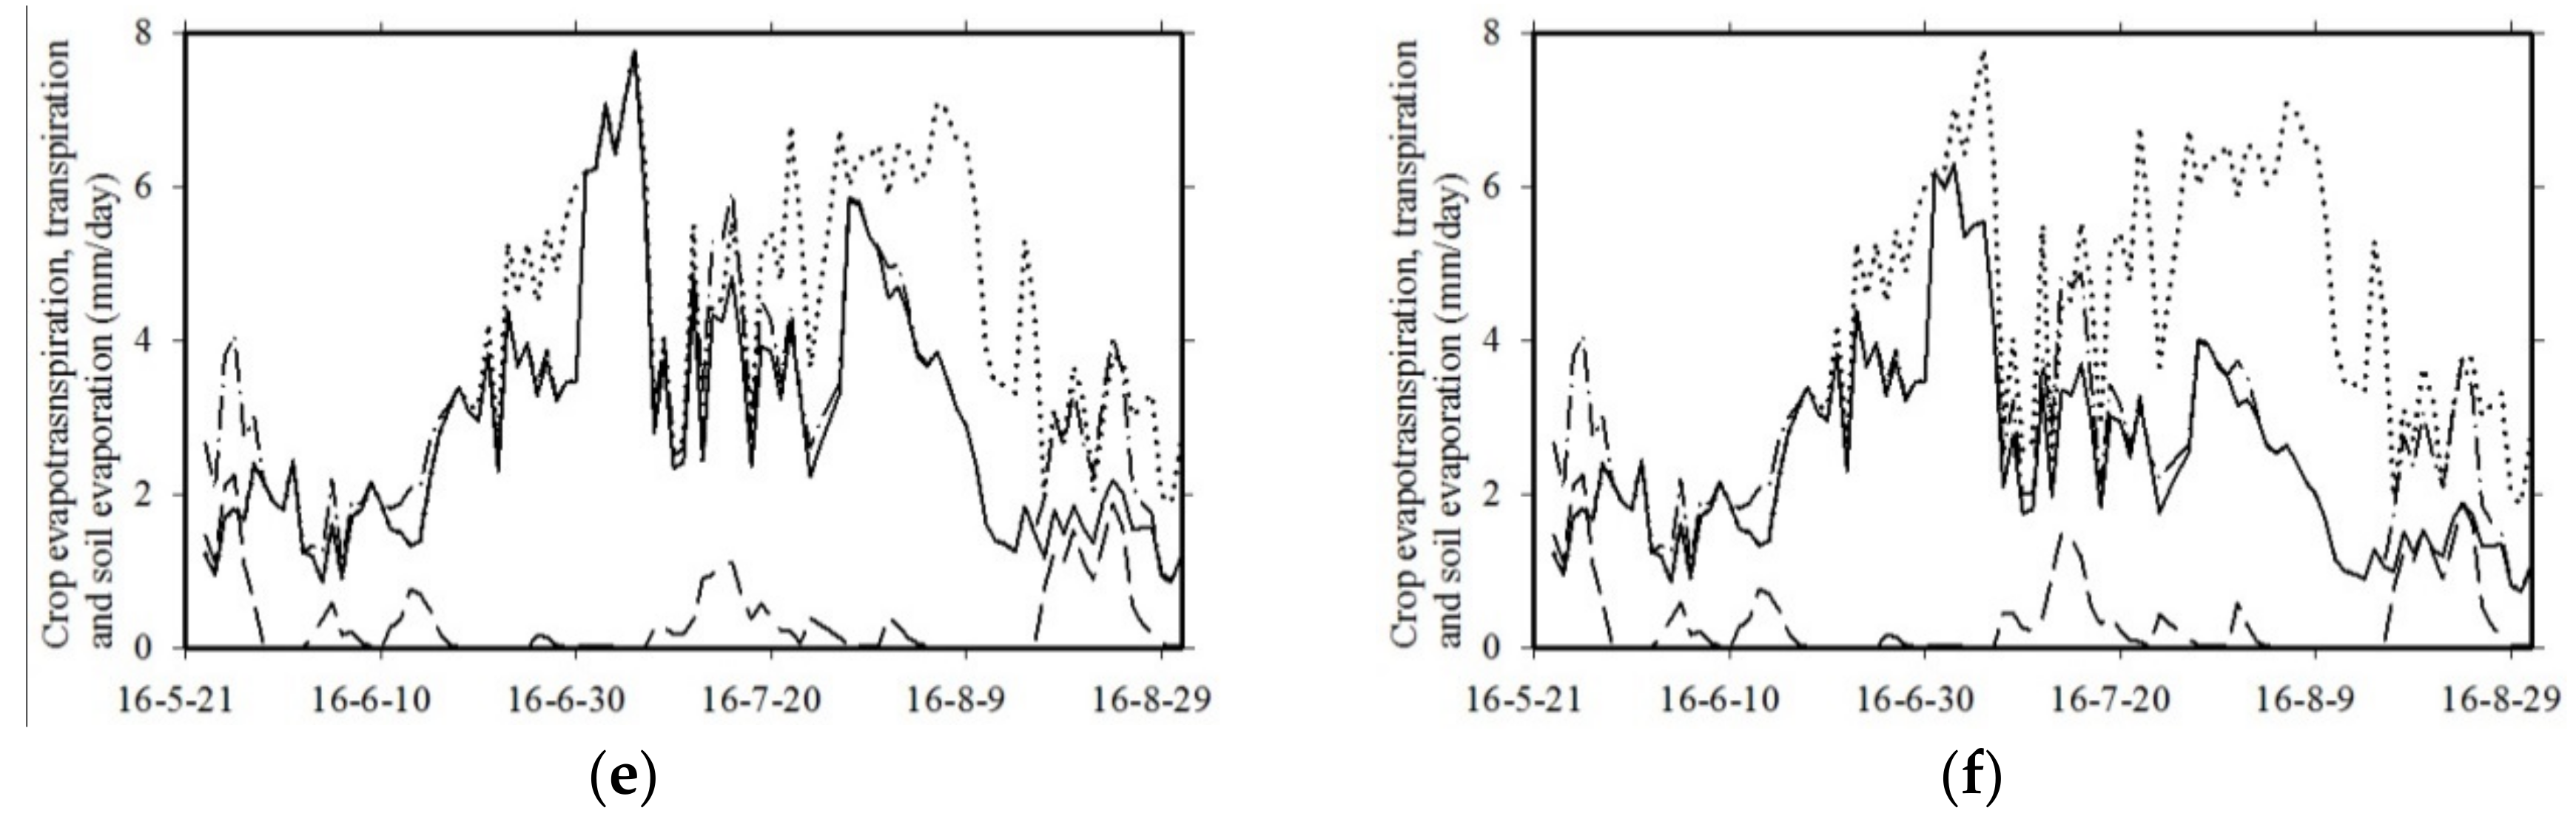
The simulated crop evapotranspiration (ET), transpiration (T), potential transpiration (Tp), and soil evaporation (E) of processing tomato are shown in Figure 5 and Table 5. The seasonal ET varied between 266 and 331 mm with the largest value for the BI treatment in 2016 and the smallest value for the DI treatment in 2015, and ET increased with an increase in irrigation amount. Compared with that in 2015, the seasonal ET in 2016 was higher due to the larger precipitation that occurred during the growing season. The daily ET ranged between 1.0 and 5.3 mm/day with a mean value of 2.8 mm/day for drip irrigation and 0.5 and 6.6 mm/day with a mean value of 2.9 mm/day for basin irrigation over the two years, respectively. In general, the daily ET was small during the initial stage, increased rapidly with its maximum values occurring during the mid-season stage, and then declined during the late stage.
The crop water requirement of processing tomato has been measured and estimated in many studies. With the measurement of the Bowen ratio, Hanson and May reported that the seasonal ET of tomato was 609 mm under subsurface drip irrigation and 678 mm under furrow irrigation in San Joaquin Valley, California, USA [53]. An ET value of 300 mm under non-irrigated conditions and ET values ranging from 556.5 to 621.2 mm under drip irrigation were reported for processing tomato in South Serbia [54]. Mukherjee et al. found ET values between 147 and 225 mm for polyethylene-mulched tomato under rainfed and furrow irrigation conditions in India [55]. Giuliani et al. reported an ET value of 558 mm for tomato with full-drip irrigation in southern Italy [56]. The lower ET of this study was mainly due to the various climatic conditions, the much shorter growing season, the smaller crop canopy fraction, and more severe water-stressed conditions as compared with those in the literature.
Seasonal T was in the range of 233–295 mm with the largest value for the BI treatment in 2016 and the smallest one for the RDI treatment in 2016. The proportion of T to ET in the two growing seasons was 86–96%, indicating that transpiration was the dominant component of crop evapotranspiration. Daily T ranged between 0.9 and 5.2 mm/day with a mean value of 2.5 mm/day for drip irrigation and 0.5 and 6.5 mm/day with a mean value of 2.6 mm/day for basin irrigation over the two years. The seasonal T values of the DI treatment were consistently smaller than those of the potential T except for the initial stage, while the seasonal T values of the BI treatment were smaller than those of the potential T with the exception of the irrigation period, indicating that the crop requirement was not satisfied by the irrigation water during the entire growing season. The total E was 13 and 37 mm during the growing seasons of 2015 and 2016, respectively, which accounted for only 5–14% of ET for the drip irrigation treatments and 4–13% of ET for the basin irrigation treatments. Soil evaporation did not show much difference, while the crop ET for drip irrigation was lower than that for basin irrigation. Thus, a higher ratio of Es/ET was observed in the drip irrigation treatment. There was little soil evaporation after the application of the plastic film, indicating that plastic film could significantly reduce evaporative consumption.
3.4. Yield and Water Productivity
Crop yield and water productivity (WP) are listed in Table 5 for various irrigation treatments. The yield was in the range of 88.4–107.9 t/ha for the drip irrigation treatments and 91.6–105.1 t/ha for the basin irrigation treatments in 2015 and 2016, respectively. The highest yield in 2015 and 2016 was respectively 99.4 and 107.9 t/ha obtained by the DI treatment, which was slightly higher than those obtained by the BI treatment. In the study area, tomato fruits were hand harvested twice during the late stage. For the first harvest, the yield from plants subject to the drip irrigation treatments was 1.2–1.6 times as large as that from plants subject to the basin irrigation treatments, whereas the yield from plants subject to the drip irrigation treatments was 30% lower than that from plants subject to the basin irrigation treatments in the second harvest. This indicates that drip irrigation could speed up the ripening process of fruits due to the fact that soil temperatures in drip-irrigated plots are higher than those in the basin-irrigated plots. A similar result was also found by [28], who reported that crop growth could be significantly enhanced by drip irrigation. Various studies [19,57] have also demonstrated that high-frequency drip irrigation can promote crop yield for large varieties of crops and vegetables as compared with basin irrigation. As shown in Table 5, the yields of the reduced irrigation treatments were lower, indicating that yield increased as the irrigation amount increased.
The consumptive use water productivity (WPET) was in the range of 32.6–37.3 kg/m3 for drip irrigation and 31.7–33.3 kg/m3 for basin irrigation, whereas the transpiration water productivity (WPT) was 37.9–39.6 kg/m3 for drip irrigation and 33.7–38.3 kg/m3 for basin irrigation. The highest WPET and WPT were obtained by the DI treatment in both years, while the smallest WPET and WPT were recorded by the BI treatment in both years. Larger WPET and WPT values for drip irrigation treatments were associated with a reduction in crop ET and an increase in yield. Actually, more soil water was conserved and used for crop growth in drip-irrigated plots, which could thus benefit crop production. The slight differences of WPET and WPT between the DI/BI and the reduced irrigation treatments may be attributed to the fact that both crop yield and ET were enhanced by increasing the irrigation amount; in contrast, reduced irrigation could inhibit crop yield and ET.
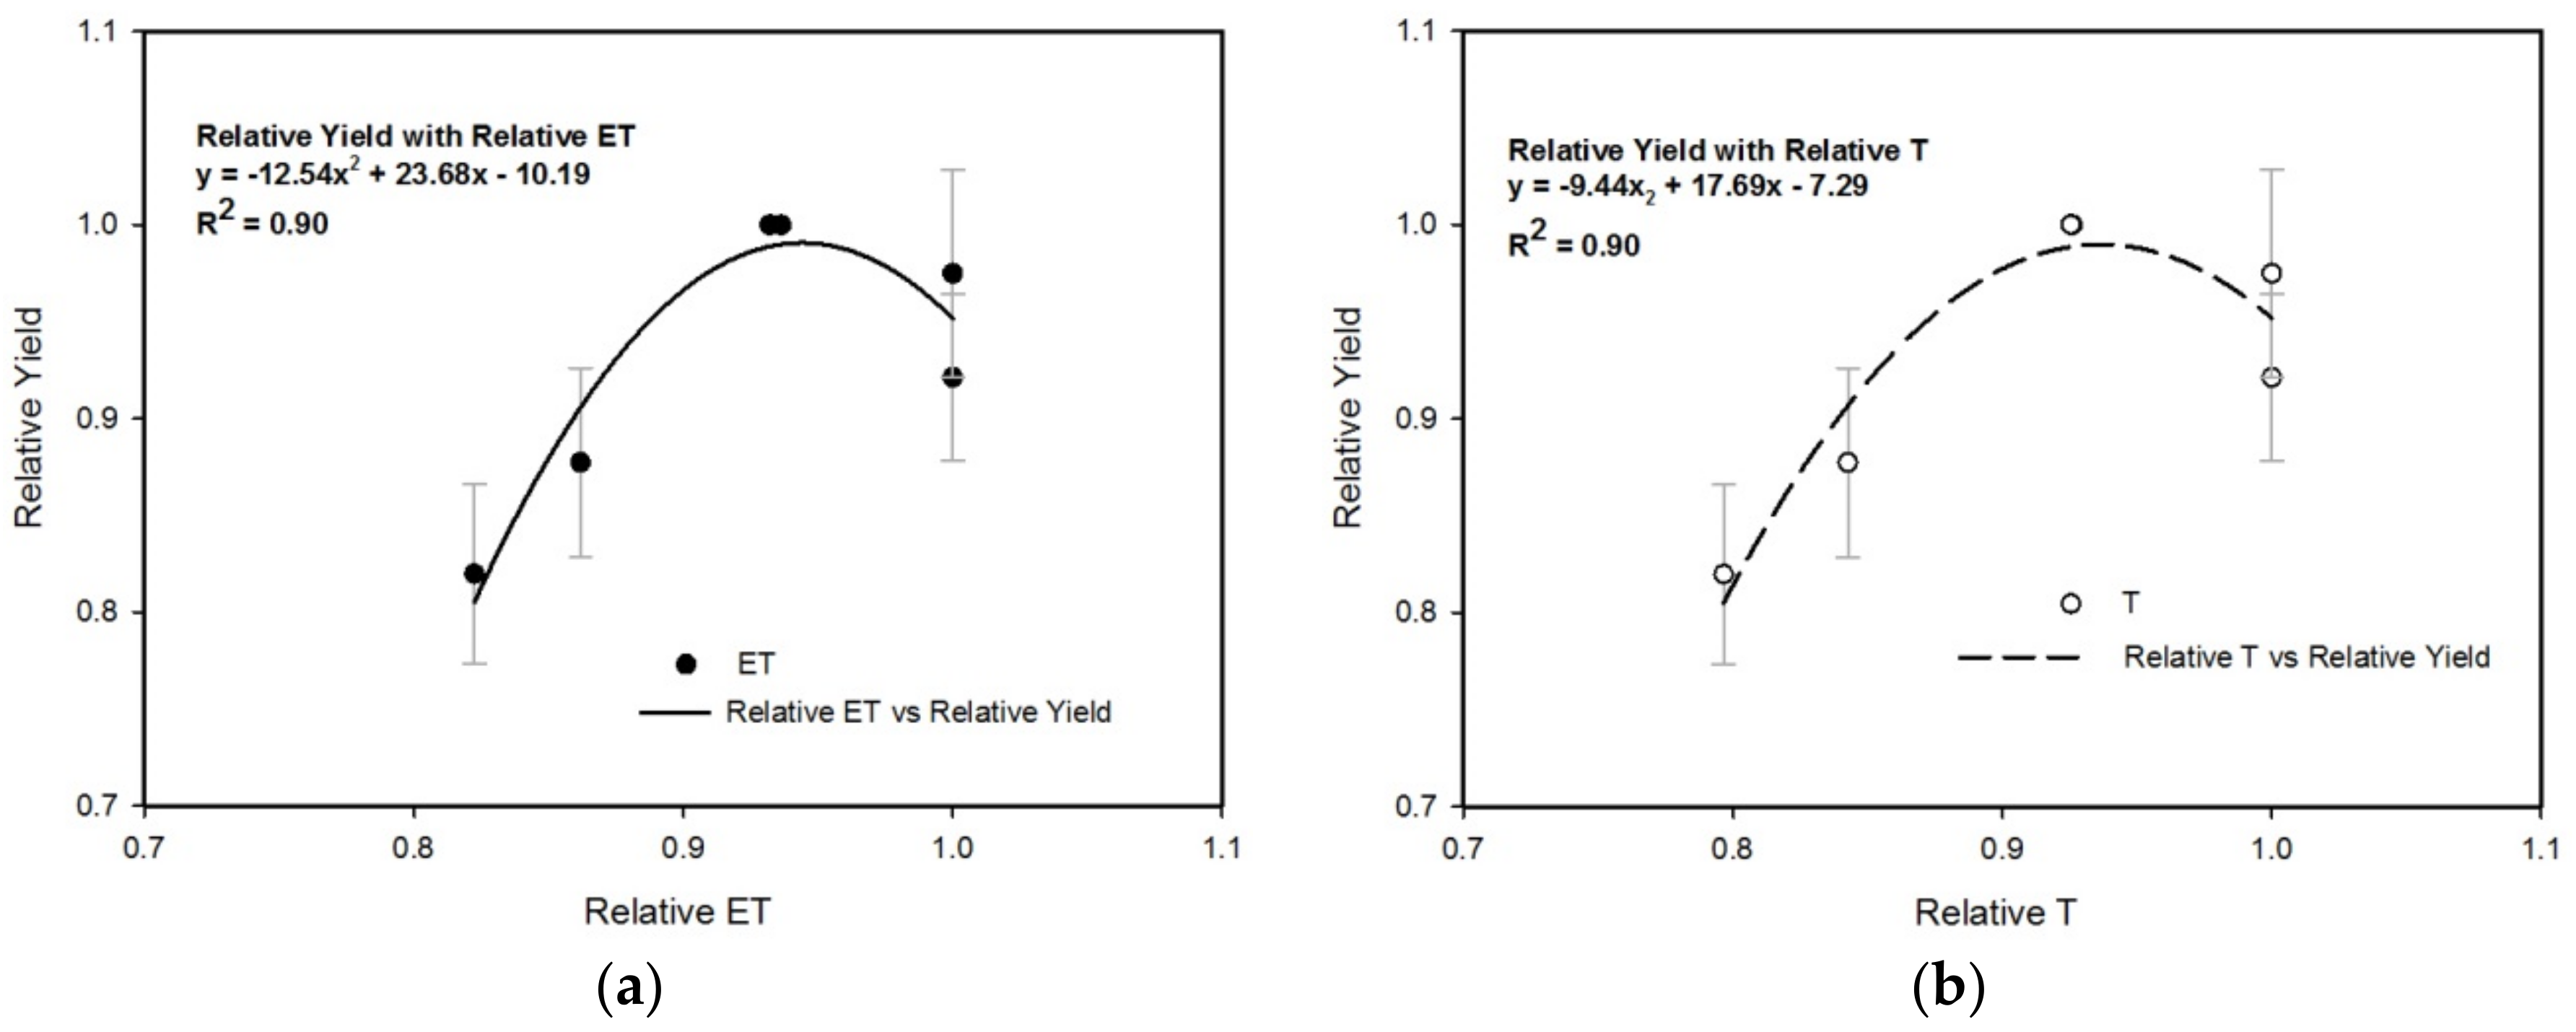
The relationship of relative yield to relative evapotranspiration (and/or relative transpiration) can be well-quantified using a quadratic function (see Figure 6) with a coefficient of determination R2 of 0.90 for fitted curves. The relative values were obtained by dividing the actual values by the respective maximum value in each year. Thus, the values varied between 0 and 1. The relative yield generally first increased with relative ET and T in both years, and then decreased after reaching the highest value. The best result was achieved for the DI treatment when the relative ET was about 0.92. This result was different from the linear relationship between yield and ET obtained by [58] in an arid region of northwest China and the exponential relationship between yield and ET found by [59] under semi-arid Mediterranean climate conditions. In general, appropriate irrigation scheduling should be associated with high WP and high (or acceptable) yield. Thus, the irrigation schedule of the DI treatment could be proposed as a preferable irrigation regime for processing tomato due to its relatively high yield and WP in the study area under the condition of plastic mulch. However, such an irrigation regime for plastic-mulched processing tomato in the Hetao Irrigation District should be further formulated and validated with consideration for the water-stressed conditions of plants, the economic costs of drip irrigation systems, and the benefits of farmers.
4. Conclusions
The two-year field experiment on processing tomato under the conditions of plastic-mulched irrigation provided the basic data to validate and calibrate the high applicability of SimDualKc in the upper reaches of the Yellow river. The results of the crop coefficients adjusted to the actual conditions were successfully obtained from the model and were appropriate to be further used locally. The total ET increased with an increase in irrigation amount both in drip and basin irrigation. Transpiration accounted for over 86% of ET, whereas soil evaporation was less than 14% of ET during the two growing seasons.
The highest yield and WP in both years were achieved for the treatment with drip irrigation. A quadratic relationship was found between the relative yield and the relative ET (and/or the relative T). Compared with basin irrigation, drip irrigation could speed up the ripening of fruits and shorten the period of crop growth. Considering both WP and crop yield, plastic-film-mulched drip irrigation was recommended for processing tomato in the upper reaches of the Yellow River. However, the crop suffered from high water stress in all of the treatments during most of the growing season due to an inadequate irrigation schedule. Thus, a proper irrigation schedule, which can meet the crop water requirement and obtain high yield for processing tomato under plastic-film-mulched drip irrigation, should be established in the future research. The adoption of drip irrigation highly relies on farmers’ decisions based on economic information on costs and benefits and the capability of using the new water-saving technologies. Further study is also required to obtain the optimal irrigation schedules for processing tomato using optimization approaches while considering farmers’ willingness and social-economical situations.
Author Contributions
G.H. and H.Z. conceived and designed the experiments; H.Z. performed the experiments, analyzed the data, conducted the simulation, and wrote the paper. G.H. corrected and improved the paper. X.X., Y.X. and Q.H. made significant suggestions in data analysis and manuscript writing.
Funding
This research was jointly supported by the National Key R&D Program of China (Grant No. 2017YFC0403301) and the National Natural Science Foundation of China (Grant Nos. 51639009, 51621061, 51125036).
Acknowledgments
We are grateful to the editors and two anonymous reviewers for their constructive critiques on a previous version of this manuscript.
Conflicts of Interest
The authors declare no conflict of interest.
References
- Feng, Z.Z.; Wang, X.K.; Feng, Z.W. Soil N and salinity leaching after the autumn irrigation and its impact on groundwater in Hetao Irrigation District, China. Agric. Water Manag. 2005, 71, 131–143. [Google Scholar] [CrossRef] [Green Version]
- Lei, T.W.; Shainberg, I.; Yuan, P.J.; Huang, X.F.; Yang, P.L. Strategic considerations of efficient irrigation and salinity control on Hetao Plain in Inner Mongolia. Transf. CSAE 2001, 17, 48–52. [Google Scholar]
- Xu, X.; Sun, C.; Qu, Z.Y.; Huang, Q.Z.; Ramos, T.B.; Huang, G.H. Groundwater recharge and capillary rise in irrigated areas of the upper Yellow river basin assessed by an agro-hydrological model. Irrig. Drain. 2016, 64, 587–599. [Google Scholar] [CrossRef]
- Wu, Y.; Shi, X.H.; Li, C.Y.; Zhao, S.N.; Pen, F.; Green, T.R. Simulation of hydrology and nutrient transport in the Hetao Irrigation District, Inner Mongolia, China. Water 2017, 9, 169. [Google Scholar] [CrossRef]
- Yang, Y.T.; Shang, S.H.; Jiang, L. Remote sensing temporal and spatial patterns of evapotranspiration and the responses to water management in a large irrigation district of North China. Agric. For. Meteorol. 2012, 164, 112–122. [Google Scholar] [CrossRef]
- Szuvandzsiev, P.; Daood, H.G.; Posta, K.; Helyes, L.; Pék, Z. Application of VIS-NIR reflectance spectra for estimating soluble solid and lycopene content of open-field processing tomato fruit juice from irrigation and mycorrhiza treatments. Acta Hortic. 2017, 1159, 73–78. [Google Scholar] [CrossRef]
- Patanè, C.; Cosentino, S.L. Effects of soil water deficit on yield and quality of processing tomato under a Mediterranean climate. Agric. Water Manag. 2010, 97, 131–138. [Google Scholar] [CrossRef]
- Patane, C.; Saita, A. Biomass, fruit yield, water productivity and quality response of processing tomato to plant density and deficit irrigation under a semi-arid Mediterranean climate. Crop Pasture Sci. 2015, 66, 224–234. [Google Scholar] [CrossRef]
- Zhang, H.M.; Xiong, Y.W.; Huang, G.H.; Xu, X.; Huang, Q.Z. Effects of water stress on processing tomatoes yield, quality and water use efficiency with plastic mulched drip irrigation in sandy soil of the Hetao Irrigation District. Agric. Water Manag. 2017, 179, 205–214. [Google Scholar] [CrossRef]
- Xu, X.; Huang, G.H.; Qu, Z.Y.; Pereira, L.S. Assessing the groundwater dynamics and impacts of water saving in the Hetao Irrigation District, Yellow River basin. Agric. Water Manag. 2010, 98, 301–313. [Google Scholar] [CrossRef]
- Hunsaker, D.J.; Barnes, E.M.; Clarke, T.R.; Fitzgerald, G.J.; Pinter, P.J., Jr. Cotton irrigation scheduling using remotely sensed and FAO-56 basal crop coefficients. Trans. ASABE 2005, 48, 1395–1407. [Google Scholar] [CrossRef]
- Paredes, P.; D’Agostino, D.; Assif, M.; Todorovic, M.; Pereira, L.S. Assessing potato transpiration, yield and water productivity under various water regimes and planting dates using the FAO dual Kc approach. Agric. Water Manag. 2018, 195, 11–24. [Google Scholar] [CrossRef]
- Sezen, S.M.; Yazar, A.; Eker, S. Effect of drip irrigation regimes on yield and quality of field grown bell pepper. Agric. Water Manag. 2006, 81, 115–131. [Google Scholar] [CrossRef]
- Jensen, C.R.; Ørum, J.E.; Pedersen, S.M.; Andersen, M.N.; Plauborg, F.; Liu, F.; Jacobsen, S.E. A short overview of measures for securing water resources for irrigated crop production. J. Agron. Crop Sci. 2014, 200, 333–343. [Google Scholar] [CrossRef]
- Gerçek, S.; Demirkaya, M.; Işik, D. Water pillow irrigation versus drip irrigation with regard to growth and yield of tomato grown under greenhouse conditions in a semi-arid region. Agric. Water Manag. 2017, 180, 172–177. [Google Scholar] [CrossRef]
- Munoz-Carpena, R.; Bryan, H.; Klassen, W.; Dukes, M.D. Automatic soil moisture based drip irrigation for improving tomato production. Proc. Fla. State Hortic. Soc. 2003, 116, 80–85. [Google Scholar]
- Ngouajio, M.; Wang, G.Y.; Goldy, R. Withholding of drip irrigation between transplanting and flowering increases the yield of field-grown tomato under plastic mulch. Agric. Water Manag. 2007, 87, 285–291. [Google Scholar] [CrossRef]
- Sui, J.; Wang, J.D.; Gong, S.H.; Xu, D.; Zhang, Y.Q.; Qin, Q.M. Assessment of maize yield-increasing potential and optimum N level under mulched drip irrigation in the Northeast of China. Field Crops Res. 2018, 215, 132–139. [Google Scholar] [CrossRef]
- Fang, Q.; Zhang, X.Y.; Shao, L.W.; Chen, S.Y.; Sun, H.Y. Assessing the performance of different irrigation systems on winter wheat under limited water supply. Agric. Water Manag. 2018, 196, 133–143. [Google Scholar] [CrossRef]
- Hanson, B.R.; Schwankl, L.J.; Schulbach, K.F.; Pettygrove, G.S. A comparison of furrow, surface drip, and subsurface drip irrigation on lettuce yield and applied water. Agric. Water Manag. 1997, 33, 139–157. [Google Scholar] [CrossRef]
- Namara, R.E.; Nagar, R.K.; Upadhyay, B. Economics, adoption determinants, and impacts of micro-irrigation technologies: Empirical results from India. Irrig. Sci. 2007, 25, 283–297. [Google Scholar] [CrossRef]
- Burt, C.M.; Isbell, B. Leaching of accumulated soil salinity under drip irrigation. Trans. ASABE 2005, 48, 2115–2121. [Google Scholar] [CrossRef]
- Zheng, J.H.; Huang, G.H.; Wang, J.; Huang, Q.Z.; Pereira, L.S.; Xu, X.; Liu, H.J. Effects of water deficits on growth, yield and water productivity of drip-irrigated onion (Allium cepa L.) in an arid region of Northwest China. Irrig. Sci. 2013, 31, 995–1008. [Google Scholar] [CrossRef]
- Li, X.Y.; Shi, H.B.; Simunek, J.; Gong, X.W.; Peng, Z.Y. Modeling soil water dynamics in a drip-irrigated intercropping field under plastic mulch. Irrig. Sci. 2015, 33, 289–302. [Google Scholar] [CrossRef] [Green Version]
- Vazquez, N.; Pardo, A.; Suso, M.L.; Quemada, M. Drainage and nitrate leaching under processing tomato growth with drip irrigation and plastic mulching. Agric. Ecosyst. Environ. 2006, 112, 313–323. [Google Scholar] [CrossRef]
- Berihun, B. Effect of mulching and amount of water on the yield of tomato under drip irrigation. J. Hortic. For. 2011, 3, 200–206. [Google Scholar]
- Biswas, S.K.; Akanda, A.R.; Rahman, M.S.; Hossain, M.A. Effect of drip irrigation and mulching on yield, water-use efficiency and economics of tomato. Plant Soil Environ. 2015, 61, 97–102. [Google Scholar]
- Qin, S.J.; Li, S.E.; Kang, S.Z.; Du, T.S.; Tong, L.; Ding, R.S. Can the drip irrigation under film mulch reduce crop evapotranspiration and save water under the sufficient irrigation condition? Agric. Water Manag. 2016, 177, 128–137. [Google Scholar] [CrossRef]
- Rana, G.; Katerji, N. Measurement and estimation of actual evapotranspiration in the field under Mediterranean climate: A review. Eur. J. Agron. 2000, 13, 125–153. [Google Scholar] [CrossRef]
- Al-Omran, A.M.; Mohammad, F.S.; Al-Ghobari, H.M.; Alazba, A.A. Determination of evapotranspiration of tomato and squash using lysimeters in central Saudi Arabia. Int. Agric. Eng. J. 2004, 13, 27–36. [Google Scholar]
- Amayreh, J.; Al-Abed, N. Developing crop coefficients for field-grown tomato (Lycopersicon esculentum Mill.) under drip irrigation with black plastic mulch. Agric. Water Manag. 2005, 73, 247–254. [Google Scholar] [CrossRef]
- Hanson, B.R.; May, D.M. Crop evapotranspiration of processing tomato in the San Joaquin Valley of California, USA. Irrig. Sci. 2006, 24, 211–221. [Google Scholar] [CrossRef]
- Colaizzi, P.D.; O’Shaughnessy, S.A.; Evett, S.R.; Mounce, R.B. Crop evapotranspiration calculation using infrared thermometers aboard center pivots. Agric. Water Manag. 2017, 187, 173–189. [Google Scholar] [CrossRef] [Green Version]
- Howell, T.A.; Evett, S.R.; Tolk, J.A.; Schneider, A.D. Evapotranspiration of full-, deficit-irrigated and dryland cotton on the Northern Texas High Plains. J. Irrig. Drain. Eng. 2004, 130, 277–285. [Google Scholar] [CrossRef]
- Valdés-Gómez, H.; Ortega-Farías, S.; Argote, M. Evaluation of water requirements for a greenhouse tomato crop using the Priestley-Taylor method. Chil. J. Agric. Res. 2009, 69, 3–11. [Google Scholar]
- Zhao, P.; Li, S.E.; Li, F.S.; Du, T.S.; Tong, L.; Kang, S.Z. Comparison of dual crop coefficient method and Shuttleworth–Wallace model in evapotranspiration partitioning in a vineyard of Northwest China. Agric. Water Manag. 2015, 160, 41–56. [Google Scholar] [CrossRef]
- Abrisqueta, I.; Abrisqueta, J.M.; Tapia, L.M.; Munguía, J.P.; Conejero, W.; Vera, J.; Ruiz-Sánchez, M.C. Basal crop coefficients for early-season peach trees. Agric. Water Manag. 2013, 121, 158–163. [Google Scholar] [CrossRef]
- Allen, R.G.; Pereira, L.S.; Smith, M.; Raes, D.; Wright, J.L. FAO-56 dual crop coefficient method for estimating evaporation from soil and application extensions. J. Irrig. Drain. Eng. 2005, 131, 2–13. [Google Scholar] [CrossRef]
- Sumner, D.M.; Jacobs, J.M. Utility of Penman–Monteith, Priestley–Taylor, reference evapotranspiration, and pan evaporation methods to estimate pasture evapotranspiration. J. Hydrol. 2005, 308, 81–104. [Google Scholar] [CrossRef]
- Allen, R.G.; Pereira, L.S.; Raes, D.; Smith, M. Crop Evapotranspiration: Guidelines for Computing Crop Water Requirements; FAO: Rome, Italy, 1998; p. 56. [Google Scholar]
- Zhang, B.Z.; Liu, Y.; Xu, D.; Zhao, N.N.; Lei, B.; Rosa, R.D.; Paredes, P.; Paço, T.A.; Pereira, L.S. The dual crop coefficient approach to estimate and partitioning evapotranspiration of the winter wheat–summer maize crop sequence in North China Plain. Irrig. Sci. 2013, 31, 1303–1316. [Google Scholar] [CrossRef]
- Bodner, G.; Loiskandl, W.; Kaul, H.-P. Cover crop evapotranspiration under semi-arid conditions using FAO dual crop coefficient method with water stress compensation. Agric. Water Manag. 2007, 93, 85–98. [Google Scholar] [CrossRef]
- Feng, Y.; Gong, D.Z.; Mei, X.R.; Cui, N.B. Estimation of maize evapotranspiration using extreme learning machine and generalized regression neural network on the China Loess Plateau. Hydrol. Res. 2017, 48, 1156–1168. [Google Scholar] [CrossRef]
- Paredes, P.; Rodrigues, G.C.; Alves, I.; Pereira, L.S. Partitioning evapotranspiration, yield prediction and economic returns of maize under various irrigation management strategies. Agric. Water Manag. 2014, 135, 27–39. [Google Scholar] [CrossRef]
- Zhao, N.N.; Liu, Y.; Cai, J.B.; Paredes, P.; Rosa, R.D.; Pereira, L.S. Dual crop coefficient modelling applied to the winter wheat-summer maize crop sequence in North China Plain: Basal crop coefficients and soil evaporation component. Agric. Water Manag. 2013, 117, 93–105. [Google Scholar] [CrossRef]
- Rosa, R.D.; Paredes, P.; Rodrigues, G.C.; Alves, I.; Fernando, R.M.; Pereira, L.S.; Allen, R.G. Implementing the dual crop coefficient approach in interactive software. 1. Background and computational strategy. Agric. Water Manag. 2012, 103, 8–24. [Google Scholar] [CrossRef]
- Paço, T.A.; Pôças, I.; Cunha, M.; Silvestre, J.C.; Santos, F.L.; Paredes, P.; Pereira, L.S. Evapotranspiration and crop coefficients for a super intensive olive orchard. An application of SIMDualKc and METRIC models using ground and satellite observations. J. Hydrol. 2014, 519, 2067–2080. [Google Scholar] [CrossRef] [Green Version]
- Qiu, R.J.; Du, T.S.; Kang, S.Z.; Chen, R.Q.; Wu, L.S. Assessing the SIMDualKc model for estimating evapotranspiration of hot pepper grown in a solar greenhouse in Northwest China. Agric. Syst. 2015, 138, 1–9. [Google Scholar] [CrossRef]
- Pereira, L.S.; Cordery, I.; Iacovides, I. Improved indicators of water use performance and productivity for sustainable water conservation and saving. Agric. Water Manag. 2012, 108, 39–51. [Google Scholar] [CrossRef]
- Pereira, L.S.; Paredes, P.; Rodrigues, G.C.; Neves, M. Modeling malt barley water use and evapotranspiration partitioning in two contrasting rainfall years. Assessing AquaCrop and SIMDualKc models. Agric. Water Manag. 2015, 159, 239–254. [Google Scholar] [CrossRef]
- Martins, J.D.; Rodrigues, G.C.; Paredes, P.; Carlesso, R.; Oliveira, Z.B.; Knies, A.E.; Petry, M.T.; Pereira, L.S. Dual crop coefficients for maize in southern Brazil: Model testing for sprinkler and drip irrigation and mulched soil. Biosyst. Eng. 2013, 115, 291–310. [Google Scholar] [CrossRef]
- Hanson, B.R.; May, D.M. Crop coefficients for drip-irrigated processing tomato. Agric. Water Manag. 2006, 81, 381–399. [Google Scholar] [CrossRef]
- Hanson, B.R.; May, D.M. Crop evapotranspiration of processing tomato under furrow and subsurface drip irrigation. Acta Hortic. 2004, 664, 303–307. [Google Scholar] [CrossRef]
- Aksic, M.; Gudzic, S.; Deletic, N.; Gudzic, N.; Stojkovic, S. Tomato fruit yield and evapotranspiration in the conditions of South Serbia. Bulg. J. Agric. Sci. 2011, 17, 150–157. [Google Scholar]
- Mukherjee, A.; Kundu, M.; Sarkar, S. Role of irrigation and mulch on yield, evapotranspiration rate and water use pattern of tomato (Lycopersicon esculentum L.). Agric. Water Manag. 2010, 98, 182–189. [Google Scholar] [CrossRef]
- Giuliani, M.M.; Nardella, E.; Gagliardi, A.; Gatta, G. Deficit irrigation and partial root-zone drying techniques in processing tomato cultivated under Mediterranean climate conditions. Sustainability 2017, 9, 2197. [Google Scholar] [CrossRef]
- Zaccaria, D.; Carrillo-Cobo, M.T.; Montazar, A.; Putnam, D.H.; Bali, K. Assessing the viability of sub-surface drip irrigation for resource-efficient alfalfa production in central and southern California. Water 2017, 9, 837. [Google Scholar] [CrossRef]
- Zheng, J.H.; Huang, G.H.; Jia, D.D.; Wang, J.; Mota, M.; Pereira, L.S.; Huang, Q.Z.; Xu, X.; Liu, H.J. Responses of drip irrigated tomato (Solanum lycopersicum L.) yield, quality and water productivity to various soil matric potential thresholds in an arid region of Northwest China. Agric. Water Manag. 2013, 129, 181–193. [Google Scholar] [CrossRef]
- Patanè, C.; Tringali, S.; Sortino, O. Effects of deficit irrigation on biomass, yield, water productivity and fruit quality of processing tomato under semi-arid Mediterranean climate conditions. Sci. Hortic. 2011, 129, 590–596. [Google Scholar] [CrossRef]
Figure 1.
Daily meteorological data during the crop-growing seasons of maximum temperature (Tmax), minimum temperature (Tmin), average relative humidity (RH) (a,b), precipitation, and crop reference evapotranspiration (ETo) (c,d) in 2015 and 2016.
Figure 1.
Daily meteorological data during the crop-growing seasons of maximum temperature (Tmax), minimum temperature (Tmin), average relative humidity (RH) (a,b), precipitation, and crop reference evapotranspiration (ETo) (c,d) in 2015 and 2016.


Figure 2.
Schematic view of the experimental setup in 2016. Note: DI, Drip irrigation treatment; BI, Basin irrigation treatment; RDI, Reduced drip irrigation treatment; RBI, Reduced basin irrigation treatment.
Figure 2.
Schematic view of the experimental setup in 2016. Note: DI, Drip irrigation treatment; BI, Basin irrigation treatment; RDI, Reduced drip irrigation treatment; RBI, Reduced basin irrigation treatment.

Figure 3.
Comparison of the observed and simulated daily soil water content in the root zone: (a) DI in 2015 (calibration), (b) BI in 2015 (calibration), (c) DI in 2016 (validation), (d) BI in 2016 (validation). (The blue line (—) and red line (—) are the soil water content at field capacity and the wilting point. Note: DI, Drip irrigation treatment; BI, Basin irrigation treatment.

Figure 4.
The daily variation of the potential and actual basal crop coefficients (Kcb and Kcb,act) and the evaporation coefficient (Ke) relative to (a) DI in 2015; (b) BI in 2015; (c) DI in 2016; (d) RDI in 2016; (e) BI in 2016; and (f) RBI in 2016. Note: DI, Drip irrigation treatment; BI, Basin irrigation treatment; RDI, Reduced drip irrigation treatment; RBI, Reduced basin irrigation treatment.

Figure 5.
The daily variation of crop evapotranspiration, crop transpiration, potential transpiration, and soil evaporation relative to (a) DI in 2015; (b) BI in 2015; (c) DI in 2016; (d) RDI in 2016; (e) BI in 2016; and (f) RBI in 2016. Note: DI, Drip irrigation treatment; BI, Basin irrigation treatment; RDI, Reduced drip irrigation treatment; RBI, Reduced basin irrigation treatment; crop evapotranspiration (− · −); crop transpiration (―); potential transpiration (······); soil evaporation (- - -).


Figure 6.
The relationships between the relative yield (Y) and the relative evapotranspiration (ET) (a) and the relative transpiration (T) (b).
Figure 6.
The relationships between the relative yield (Y) and the relative evapotranspiration (ET) (a) and the relative transpiration (T) (b).


Table 1.
Soil physical properties of the soil profile at the experimental site.
| Soil Depths (cm) | Soil Particle Fraction (%) | Soil Texture | Bulk Density (g/cm3) | Field Capacity (cm3/cm3) | Wilting Point (cm3/cm3) | ||
|---|---|---|---|---|---|---|---|
| Sand (>0.05 mm) | Silt (0.05–0.002 mm) | Clay (<0.002 mm) | |||||
| 0–20 | 12.18 | 60.98 | 26.84 | Silt loam | 1.47 | 0.33 | 0.16 |
| 20–40 | 21.84 | 56.87 | 21.29 | Silt loam | 1.53 | 0.35 | 0.15 |
| 40–60 | 18.46 | 54.81 | 26.73 | Silt loam | 1.49 | 0.35 | 0.13 |
Table 2.
The initial dates of different crop growth stages in 2015 and 2016.
| Crop Growth Stages | Initial Date in 2015 | Initial Date in 2016 | ||
|---|---|---|---|---|
| Drip Irrigation | Basin Irrigation | Drip Irrigation | Basin Irrigation | |
| Initial stage | 20 May 2015 | 20 May 2015 | 20 May 2016 | 20 May 2016 |
| Development stage | 15 June 2015 | 15 June 2015 | 13 June 2016 | 13 June 2016 |
| Midseason stage | 1 July 2015 | 1 July 2015 | 1 July 2016 | 1 July 2016 |
| Late stage | 10 August 2015 | 16 August 2015 | 12 August 2016 | 16 August 2016 |
| Harvest | 31 August 2015 | 31 August 2015 | 31 August 2016 | 31 August 2016 |
Table 3.
Irrigation depth (mm) during different growth stages for each irrigation treatment in 2015 and 2016.
Table 3.
Irrigation depth (mm) during different growth stages for each irrigation treatment in 2015 and 2016.
| Crop Growth Stages | Irrigation Depth in 2015 (mm) | Irrigation Depth in 2016 (mm) | ||||
|---|---|---|---|---|---|---|
| DI | BI | DI | RDI | BI | RBI | |
| Initial stage | 55.0 | 55.0 | 45.0 | 45.0 | 45.0 | 45.0 |
| Development stage | 15.0 | 80.0 | 15.0 | 9.0 | 80.0 | 48.0 |
| Midseason stage | 108.2 | 80.0 | 90.4 | 54.2 | 50.0 | 30.0 |
| Late stage | 19.0 | 0.0 | 17.8 | 10.7 | 0.0 | 0.0 |
| Harvest | 197.2 | 215.0 | 168.2 | 118.9 | 175.0 | 123.0 |
Note: DI, Drip irrigation treatment; BI, Basin irrigation treatment; RDI, Reduced drip irrigation treatment; RBI, Reduced basin irrigation treatment.
Table 4.
Initial and calibrated values of crop parameters and soil evaporation parameters of the SIMDualKc model.
Table 4.
Initial and calibrated values of crop parameters and soil evaporation parameters of the SIMDualKc model.
| Types | Parameters (Units) | Initial Value | Calibrated Value |
|---|---|---|---|
| Crop | Kcb,ini (/) | 0.15 | 0.30 |
| Kcb,mid (/) | 1.10 | 0.92 | |
| Kcb,end (/) | 0.60 | 0.60 | |
| pini (/) | 0.40 | 0.30 | |
| pdev (/) | 0.40 | 0.30 | |
| pmid (/) | 0.40 | 0.30 | |
| pend (/) | 0.40 | 0.30 | |
| Soil evaporation | REW (mm) | 8 | 10 |
| TEW (mm) | 25 | 37 | |
| Ze (m) | 0.10 | 0.15 |
Note: Kcb,ini, basal crop coefficient during the initial stage; Kcb,mid, basal crop coefficient during the mid-season stage; Kcb,end, basal crop coefficient during the late stage; pini, evapotranspiration depletion fraction during the initial stage; pdev, evapotranspiration depletion fraction during the development stage; pmid, evapotranspiration depletion fraction during the mid-season stage; pend, evapotranspiration depletion fraction during the late stage; REW, readily evaporable water; TEW, total evaporable water; Ze, depth of surface soil layer subjected to drying by evaporation.
Table 5.
Crop yield (Y), evapotranspiration (ET), transpiration (T), water productivity (WPET), and transpiration water productivity (WPT) over the two years.
Table 5.
Crop yield (Y), evapotranspiration (ET), transpiration (T), water productivity (WPET), and transpiration water productivity (WPT) over the two years.
| Years | Treatments | Y (t/ha) | ET (mm) | T (mm) | WPET (kg/m3) | WPT (kg/m3) | Es/ET |
|---|---|---|---|---|---|---|---|
| 2015 | DI | 99.4 ± 7.7 a | 266.3 | 253.2 | 37.3 ± 2.9 a | 39.2 ± 3.0 a | 4.9% |
| BI | 91.6 ± 6.8 a | 284.3 | 272.0 | 32.2 ± 2.4 b | 33.7 ± 2.5 b | 4.3% | |
| 2016 | DI | 107.9 ± 10.5 a | 309.7 | 272.5 | 34.8 ± 3.4 a | 39.6 ± 3.9 a | 11.9% |
| RDI | 88.4 ± 7.5 b | 270.9 | 233.3 | 32.6 ± 2.8 a | 37.9 ± 3.2 a | 13.8% | |
| BI | 105.1 ± 8.3 a | 331.2 | 295.0 | 31.7 ± 2.5 a | 35.6 ± 2.8 a | 10.9% | |
| RBI | 94.6 ± 7.8 ab | 283.9 | 246.9 | 33.3 ± 2.7 a | 38.3 ± 3.2 a | 12.9% |
Note: DI, Drip irrigation treatment; BI, Basin irrigation treatment; RDI, Reduced drip irrigation treatment; RBI, Reduced basin irrigation treatment. The letters a, b, and ab are used to indicate the statistical significance according to the Duncan’s multiple range tests at 0.05 P level. Values within columns followed by different letters are statistically significant at the 0.05 level.
© 2018 by the authors. Licensee MDPI, Basel, Switzerland. This article is an open access article distributed under the terms and conditions of the Creative Commons Attribution (CC BY) license (http://creativecommons.org/licenses/by/4.0/).
Share and Cite
MDPI and ACS Style
Zhang, H.; Huang, G.; Xu, X.; Xiong, Y.; Huang, Q. Estimating Evapotranspiration of Processing Tomato under Plastic Mulch Using the SIMDualKc Model. Water 2018, 10, 1088. https://doi.org/10.3390/w10081088
AMA Style
Zhang H, Huang G, Xu X, Xiong Y, Huang Q. Estimating Evapotranspiration of Processing Tomato under Plastic Mulch Using the SIMDualKc Model. Water. 2018; 10(8):1088. https://doi.org/10.3390/w10081088
Chicago/Turabian StyleZhang, Huimeng, Guanhua Huang, Xu Xu, Yunwu Xiong, and Quanzhong Huang. 2018. "Estimating Evapotranspiration of Processing Tomato under Plastic Mulch Using the SIMDualKc Model" Water 10, no. 8: 1088. https://doi.org/10.3390/w10081088
Note that from the first issue of 2016, this journal uses article numbers instead of page numbers. See further details here.