Development of Nomogram for Debris Flow Forecasting Based on Critical Accumulated Rainfall in South Korea


Department of Urban Environment & Disaster Management, School of Disaster Prevention, Kangwon National University, 346 Joongang-ro, Samcheok-si Gangwon-do 25913, Korea
*
Author to whom correspondence should be addressed.
Water 2019, 11(10), 2181; https://doi.org/10.3390/w11102181
Submission received: 16 September 2019
/
Revised: 4 October 2019
/
Accepted: 16 October 2019
/
Published: 19 October 2019
(This article belongs to the Special Issue Debris Flows Research: Hazard and Risk Assessments)
Abstract
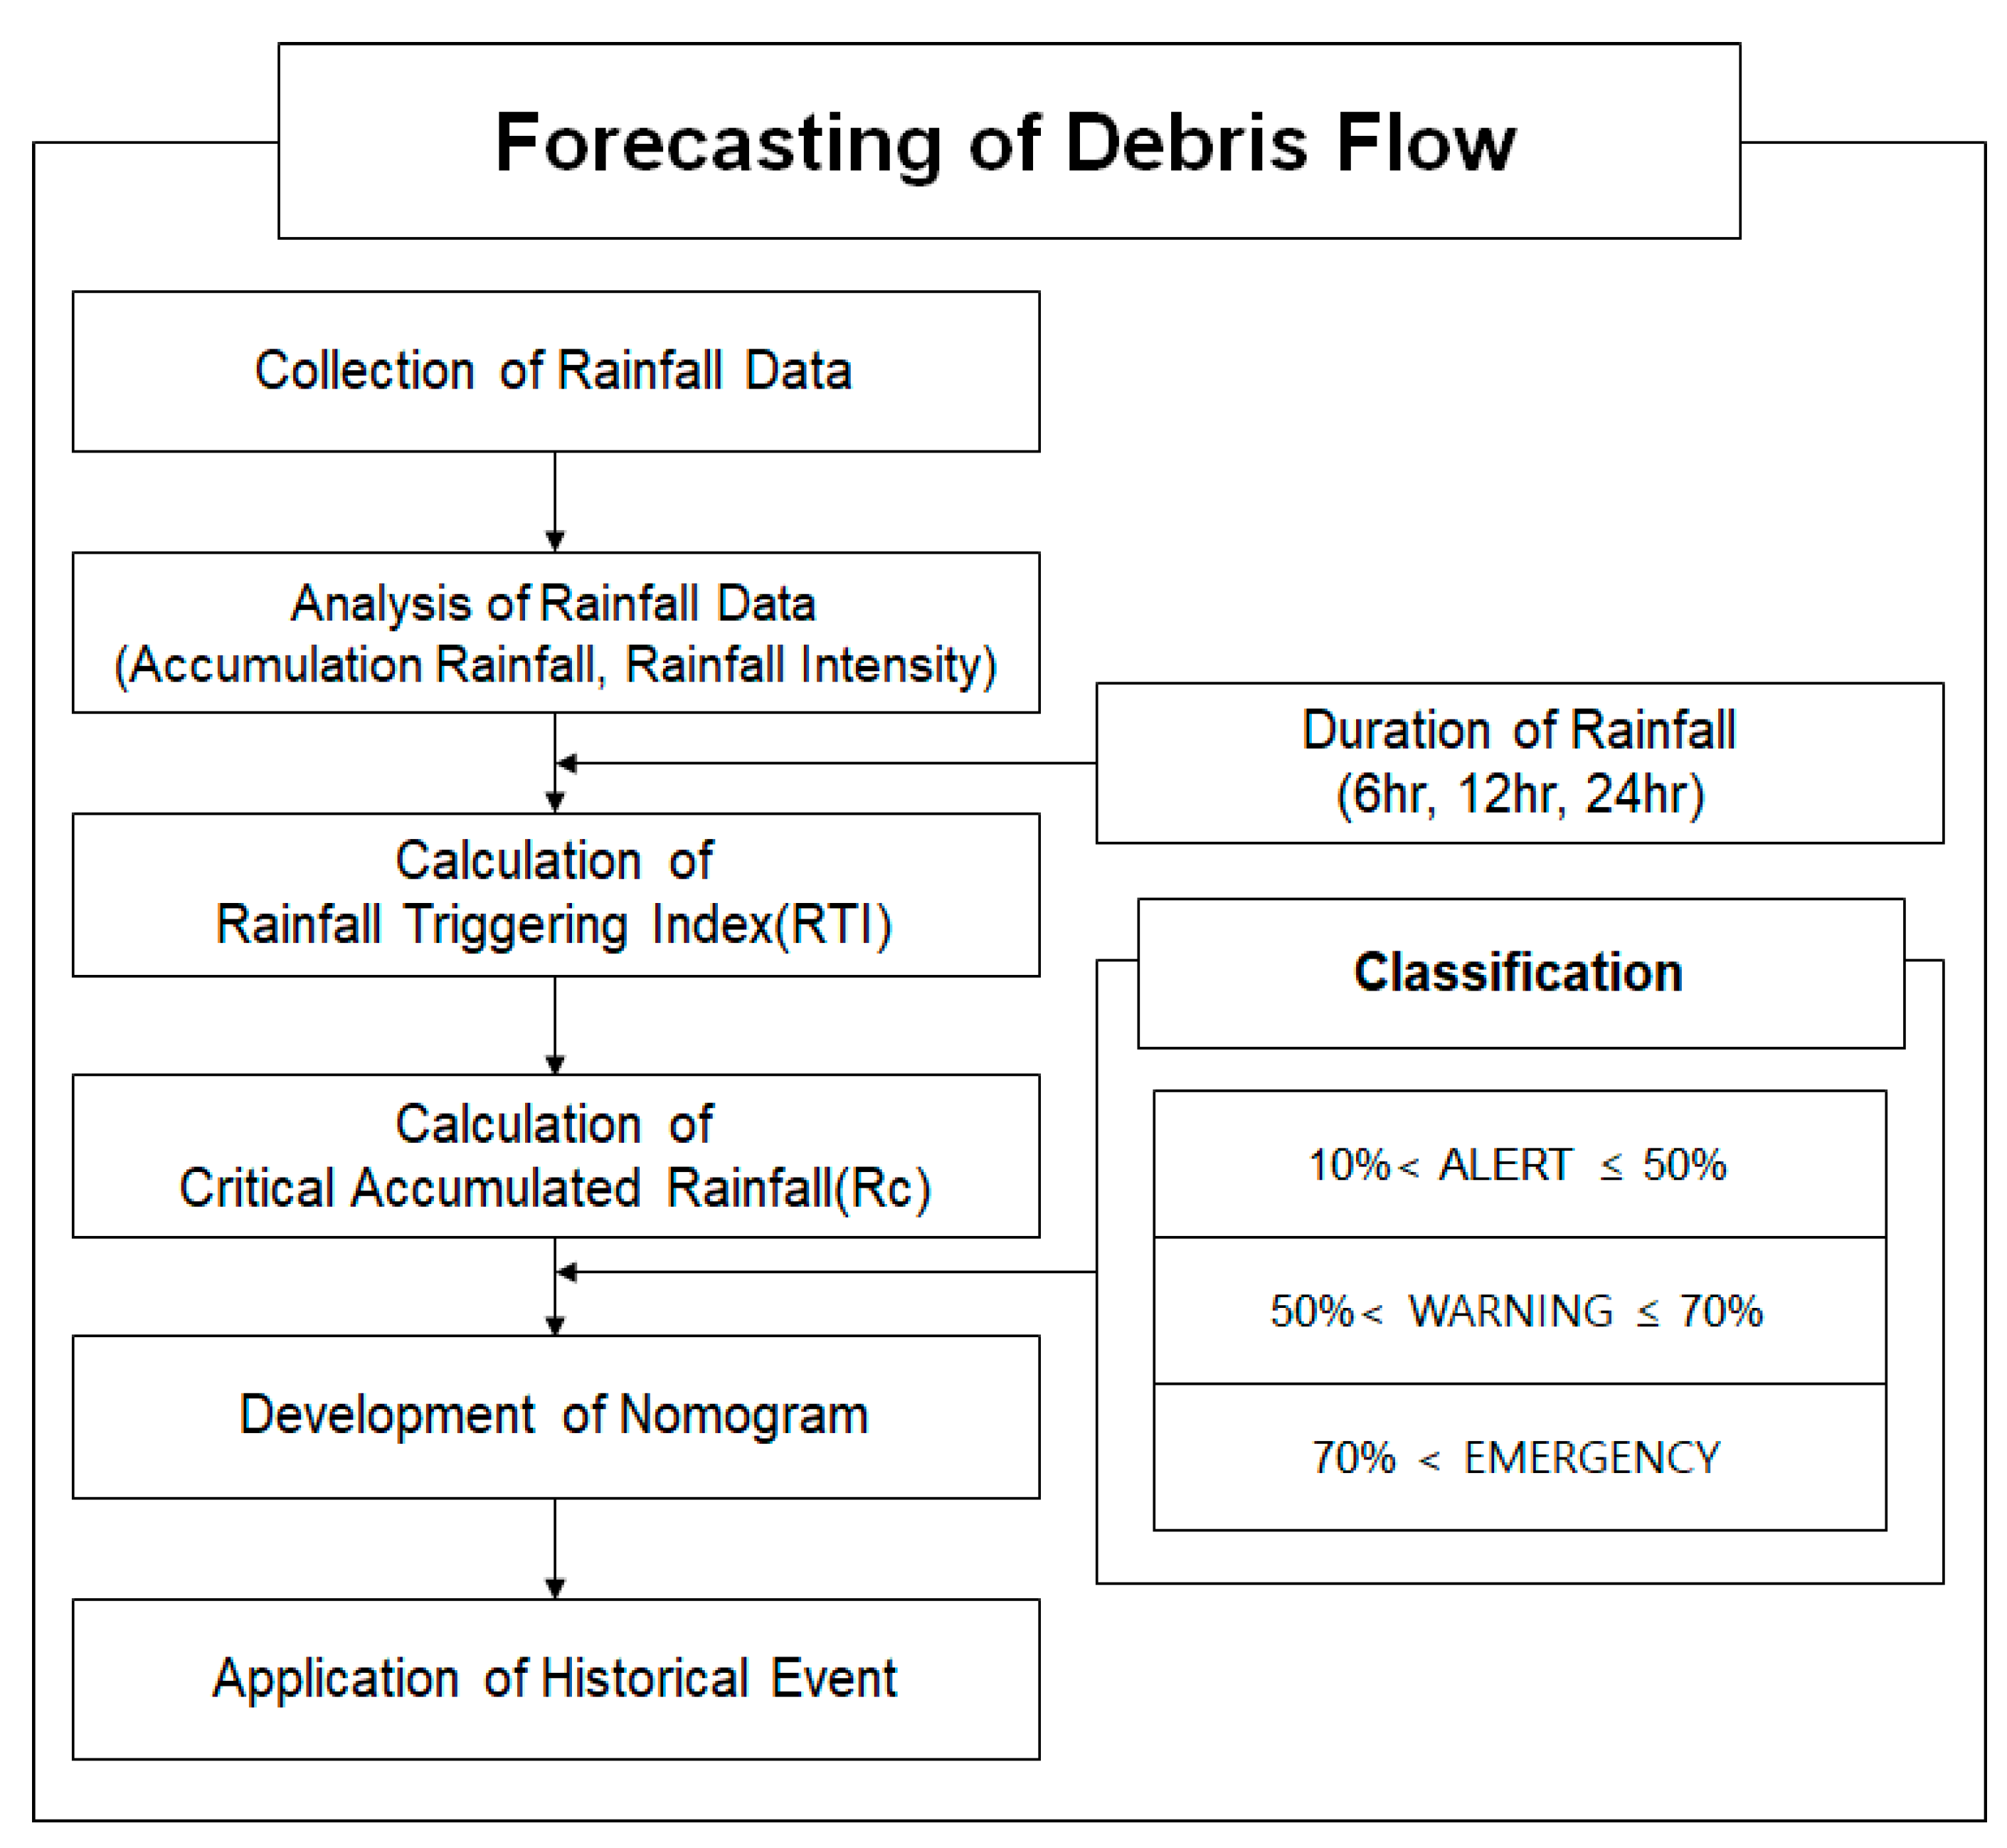
:Climate change causes extreme weather events worldwide such as increasing temperatures and changing rainfall patterns. With South Korea facing growing damage from the increased frequency of localized heavy rains. In particular, its steep slope lands, including mountainous areas, are vulnerable to damage from landslides and debris flows. In addition, localized short-term heavy rains that occur in urban areas with extremely high intensity tend to lead a sharp increase in damage from soil-related disasters and cause huge losses of life and property. Currently, South Korea forecasts landslides and debris flows using the standards for forecasting landslides and heavy rains. However, as the forecasting is conducted separately for rainfall intensity and accumulated rainfall, this lacks a technique that reflects both amount and intensity of rainfall in an episode of localized heavy rainfall. In this study, aims to develop such a technique by collecting past cases of debris flow occurrences and rainfall events that accompanied debris flows to calculate the rainfall triggering index (RTI) reflecting accumulated rainfall and rainfall intensity. In addition, the RTI is converted into the critical accumulated rainfall () to use rainfall information and provide real-time forecasting. The study classifies the standards for flow debris forecasting into three levels: ALERT (10–50%), WARNING (50–70%), and EMERGENCY (70% or higher), to provide a nomogram for 6 h, 12 h, and 24 h. As a result of applying this classification into the actual cases of Seoul, Chuncheon, and Cheongju, it is found that about 2–4 h of response time is secured from the point of the Emergency level to the occurrence of debris flows.
1. Introduction
Global warming-initiated, extreme weather events receive great attention worldwide. South Korea, in particular, has faced such events, including increasing temperature and rainfall and a growing number of heavy rain days, for the recent 100 years [1], which has led to natural disasters such as localized heavy rainfall, wind and waves, droughts, and heavy snows. Notably, the summer season from June to September shows a tendency of having an increased number of debris flows [2]. Debris flows are a type of natural disaster that occurs by a complex interaction between flooding from heavy rainfall and ground soil, as well as by a wide range of other factors such as thawing during spring, indiscriminate logging, and forest fire. They are also, commonly, secondary damage from typhoons and localized heavy rains, with the latter being their main cause because of how heavy rainfall brings an increase in flow speed, soil loss, and large-scale movement of rocks that lead to huge disasters [3]. In South Korea, damage from debris flows has been reported frequently nationwide, with examples such as Inje County and Pyeongchang County of Gangwon Province in 2006; Seoul, Chuncheon City, and Pocheon City in 2011; Samcheok City in 2012; Busan Metropolitan city in 2014; and Cheongju City and Cheonan City in 2017. For this study, debris flows are seen as mainly from localized heavy rains. In this regard, it requires a thorough understanding of the characteristics of rainfall events that cause debris flows, when establishing an early-warning system for debris flow damage and related planning, maintaining, or managing disaster prevention facilities.
In South Korea, studies on forecasting of debris flows and landslides are mainly about using the related standards provided by the Korea Forest Service and the Korea Meteorological Administration to review their relevance with an analysis of rainfall events that cause debris flows and landslides or to quantitatively calculate the standards. However, studies on debris flow forecasting based on rainfall events have not been actively conducted [4,5,6,7,8,9,10]. Table 1 and Table 2 show the forecasting standards for landslides and rainfall, provided by the Korea Forest Service and the Korea Meteorological Administration, respectively. Such standards mainly defined rainfall and accumulated rainfall separately.
South Korea forecasts landslides and debris flows by analyzing rainfall and basin characteristics and using models to calculate the triggering factors. With the current advancement in radar technologies, studies are continuously conducted for forecasting using radar data [11,12,13,14,15,16,17,18,19,20,21]. Therefore, the study attempted to establish a method that considers rainfall intensity and accumulated rainfall not as an independent factor but a function. To this end, it modified the RTI calculation method developed by Jan and Lee [22] to support the forecasting of debris flows potentially caused by rainfall.
The study used past rainfall data from 80 stations located at the areas that experienced damage from debris flows from 2012 to 2013 for rainfall intensity and accumulated rainfall for each rainfall duration. Based on this, it classified debris flow damages to estimate the rainfall triggering index (RTI). In addition, it calculated the average intensity of the rainfall that causes debris flows. For debris flow forecasting, the study classified the forecasting standards for accumulated rainfall into ALERT (RTI from 10 to 50%), WARNING (RTI from 50 to 70%), and EMERGENCY (RTI from 70% or higher). The 10%, 50%, and 70% RTIs were divided by the average rainfall intensity to estimate the critical accumulated rainfall () and its curve by duration. The calculated was applied to the actual cases of Umyeon Mountain of Seoul, Chuncheon of Gangwon County, and Cheongju City of Chungcheongbuk Province, where damage actually occurred, to make the debris flow forecasting for 24 h of the rainfall triggering such, which aims to determine its applicability for debris flow forecasting.
2. Materials and Methods
To analyze the influence from the interlinkage between accumulated rainfall and rainfall intensity, the study collected the rainfall data of 80 areas that experienced debris flow damage in Gangwon Province from 2012 to 2013 and used the rainfall amount by duration with a maximum of 24 h in which debris flows occurred. Based on this, the RTI, an index for accumulated rainfall and rainfall intensity was calculated for 6 h, 12 h, and 24 h, respectively. Furthermore, the study estimated an average rainfall intensity at the time of debris flow occurrence before using the RTI equation to calculate for each duration (6 h, 12 h, and 24 h). The of 10%, 50%, and 70% was then used with the occurrence probability to define the three risk levels. In addition, based on actual damage cases, the study developed a nomogram for continuous rainfall to verify its applicability for debris flow forecasting (Figure 1).
3. Theoretical Background
3.1. Debris Flow
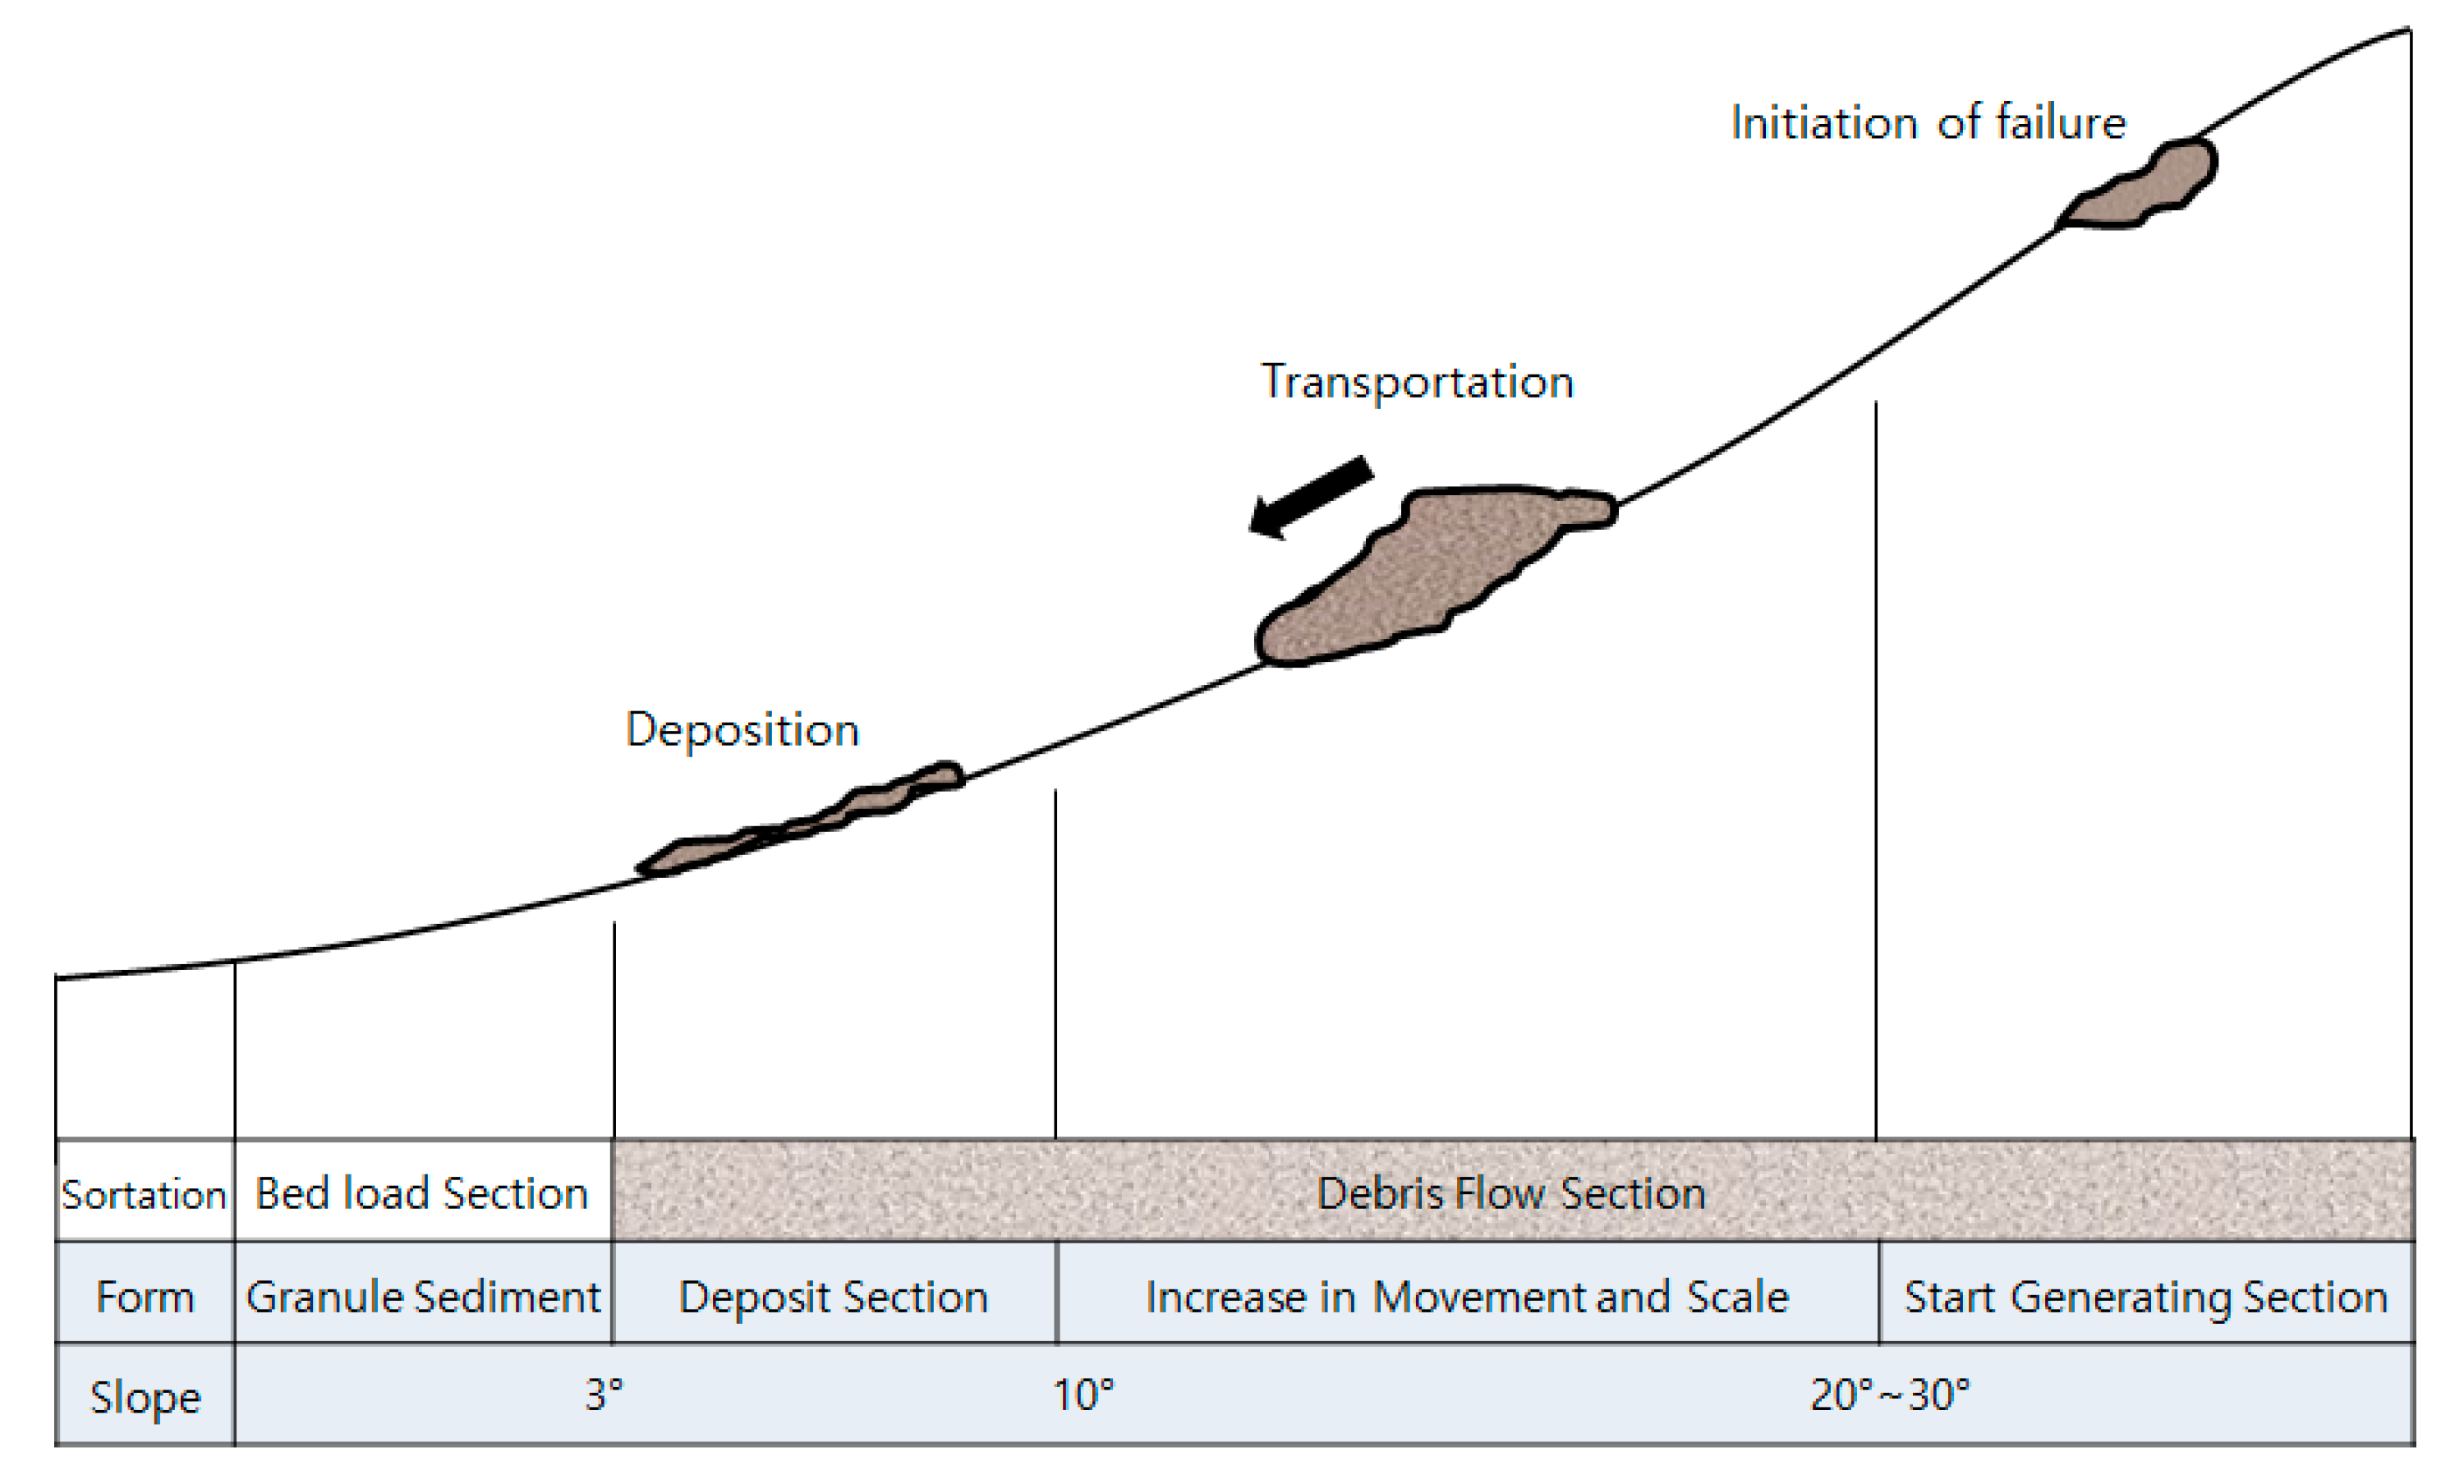
A debris flow refers to the dynamic phenomenon where soil, rocks, and floating substances flow down a slope by gravity with changes in their shape and sizes. Sharpe [23] differentiated debris flows from debris avalanches in his United States–based studies, with the former as a movement of soil and rocks saturated with water at a water channel with a steep slope, and the latter as a phenomenon where fragmented soil of an upper layer at a steep slope flow fast, similar to a snow avalanche. As shown in Figure 2, the path of debris flows comprises three zones: initiation, transportation, and deposition [24]. Since debris flows have pressure 4–5 times higher than that of flooding water, given that they are mixed with soil and rocks, their external force is 10 times higher than that of flooding water when conflicting with facilities [25].
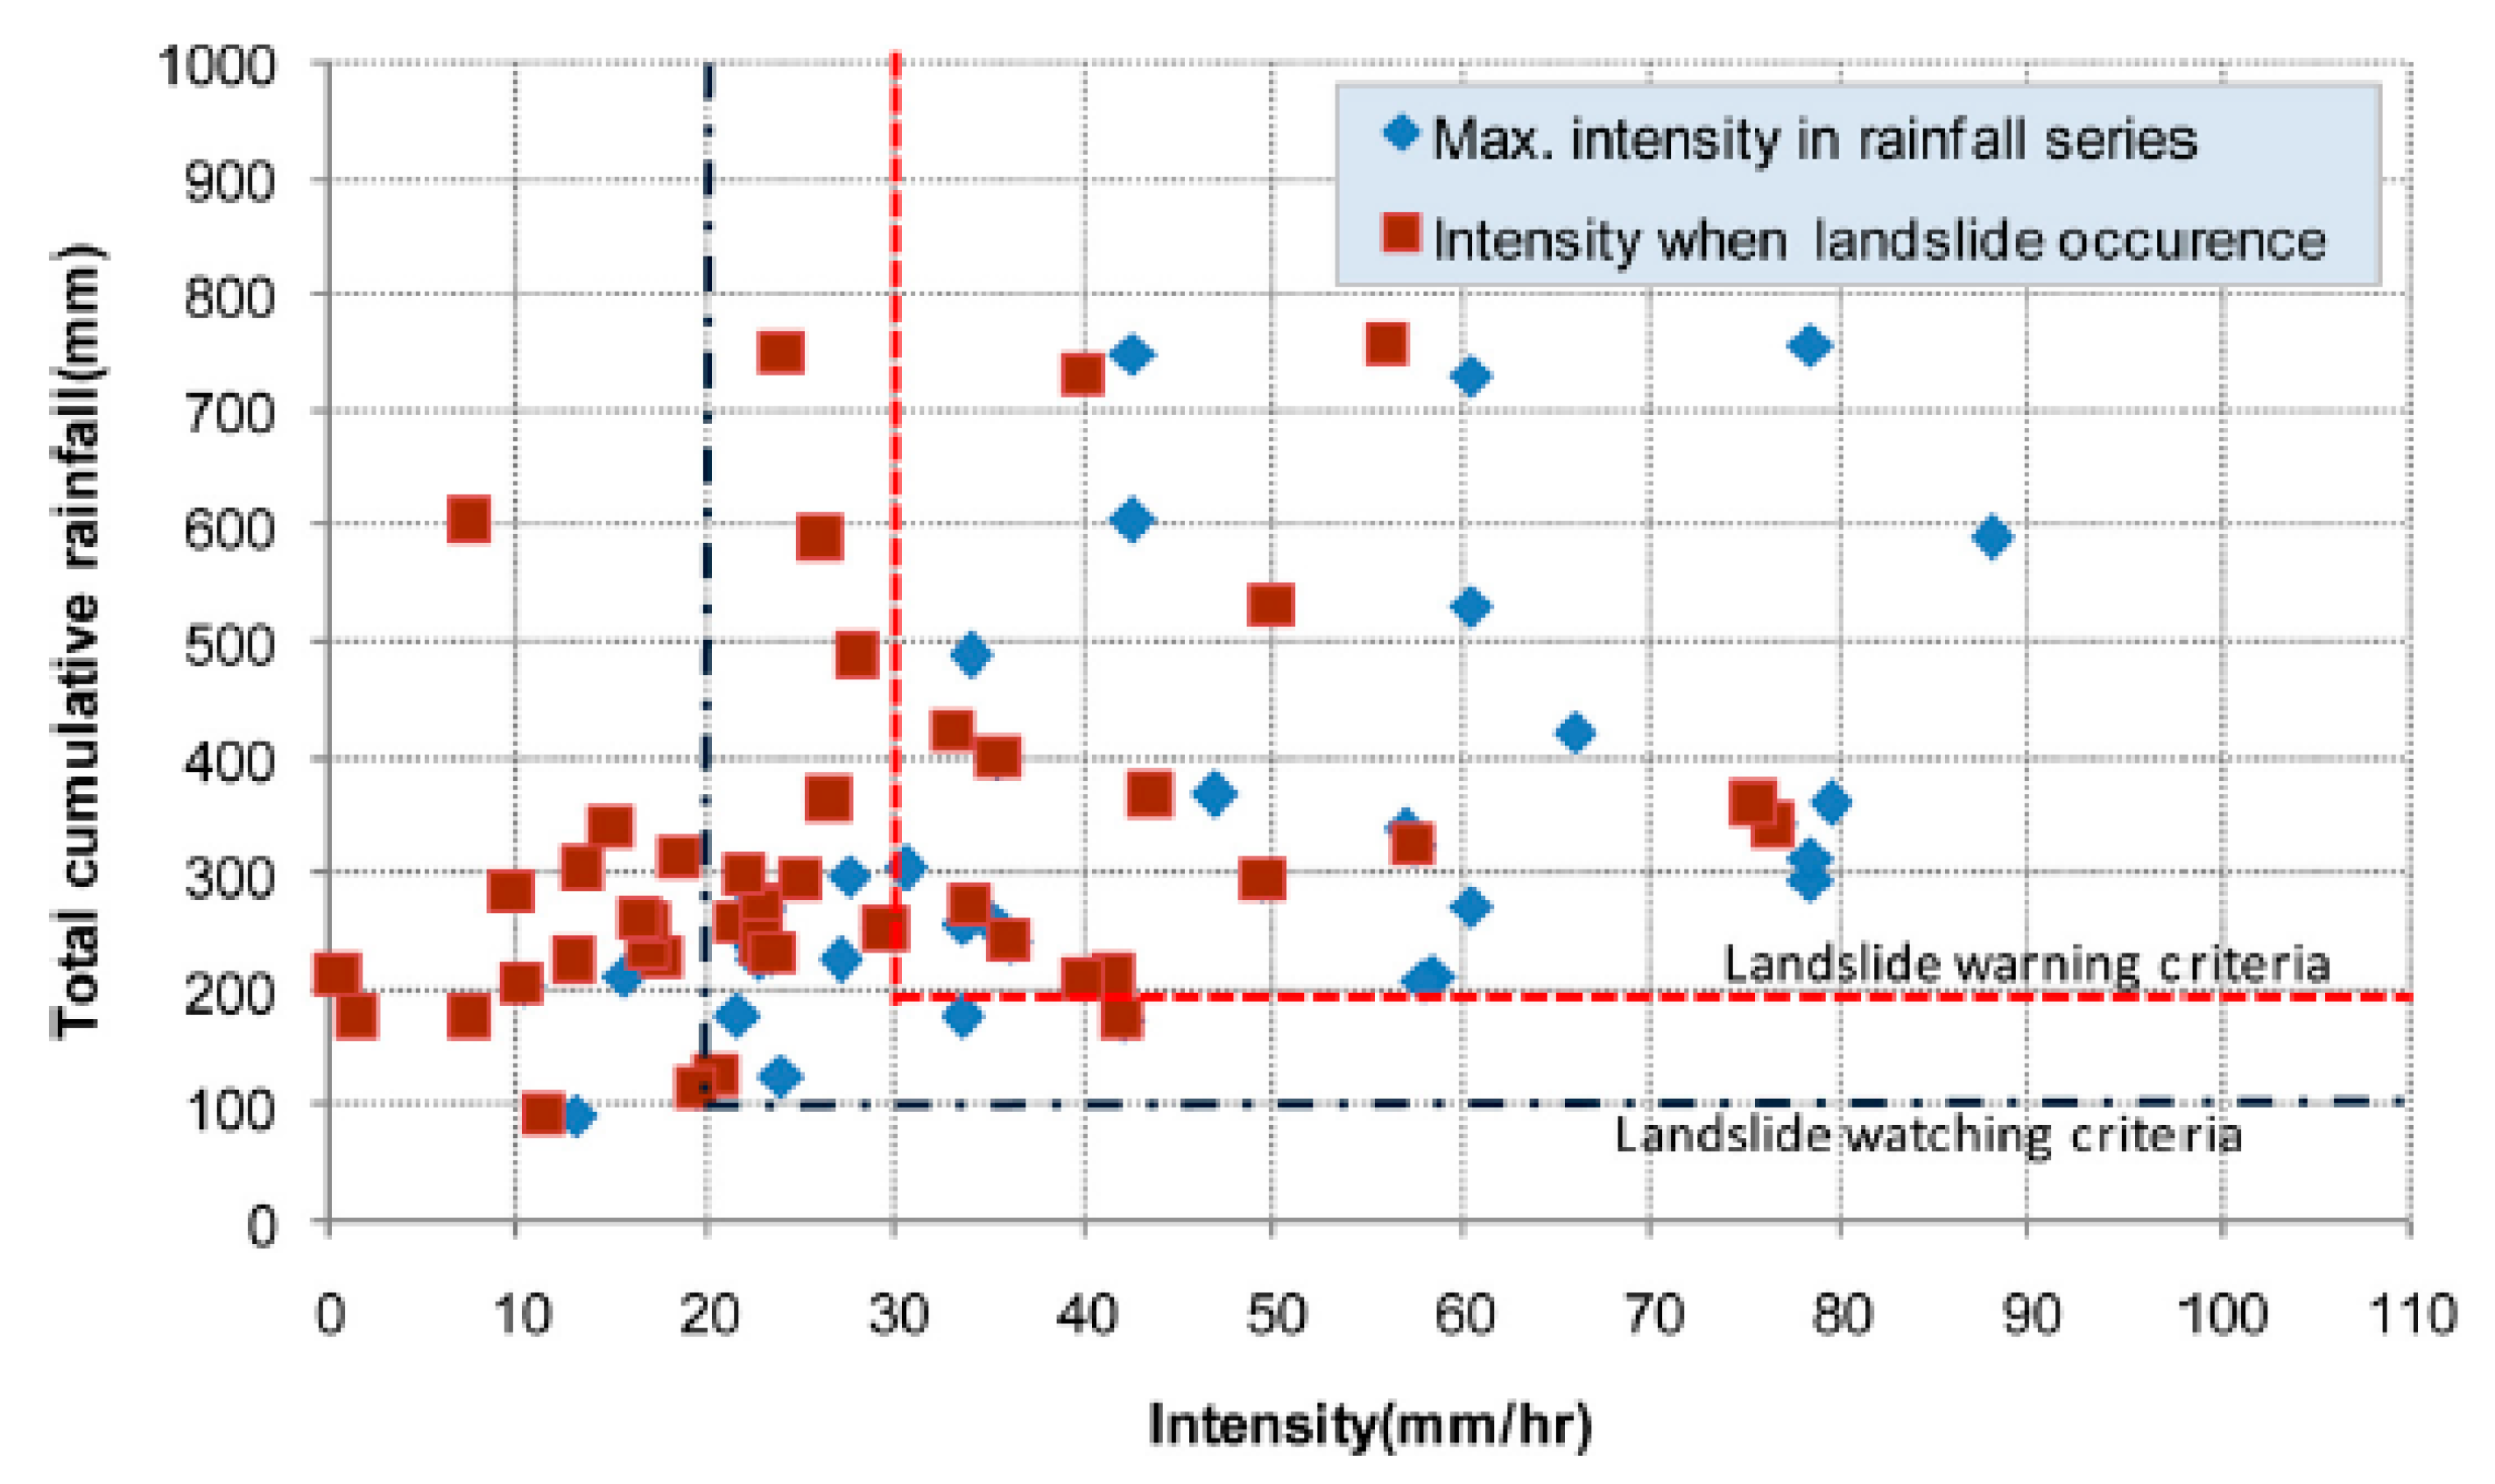
Major factors that have influence on the occurrence of debris flows include topographic factors (slope angle, slope impact, and facilities to reduce the flow of pumice stones and soil), geographical factors (depth of soil layers and characteristics of top soil), and hydrological factors (amount of rainfall). Among such factors, rainfall increases pore water pressure and soil weight and leads to erosion and scour of the surface. The analysis of scales and accumulated rainfall indicates that an area with 200 mm or higher of rainfall and 20 mm/h of rainfall intensity will face severe damage with increasing frequency (Figure 3). This result suggests that areas with low vulnerability may experience a higher probability of debris flow occurrence, in a rainfall episode with a certain level and intensity. Therefore, for the rainfall that triggers a debris flow, it is standard to consider both accumulated rainfall and rainfall intensity observed at the time of its occurrence.
3.2. Estimation of Critical Accumulated Rainfall Using RTI
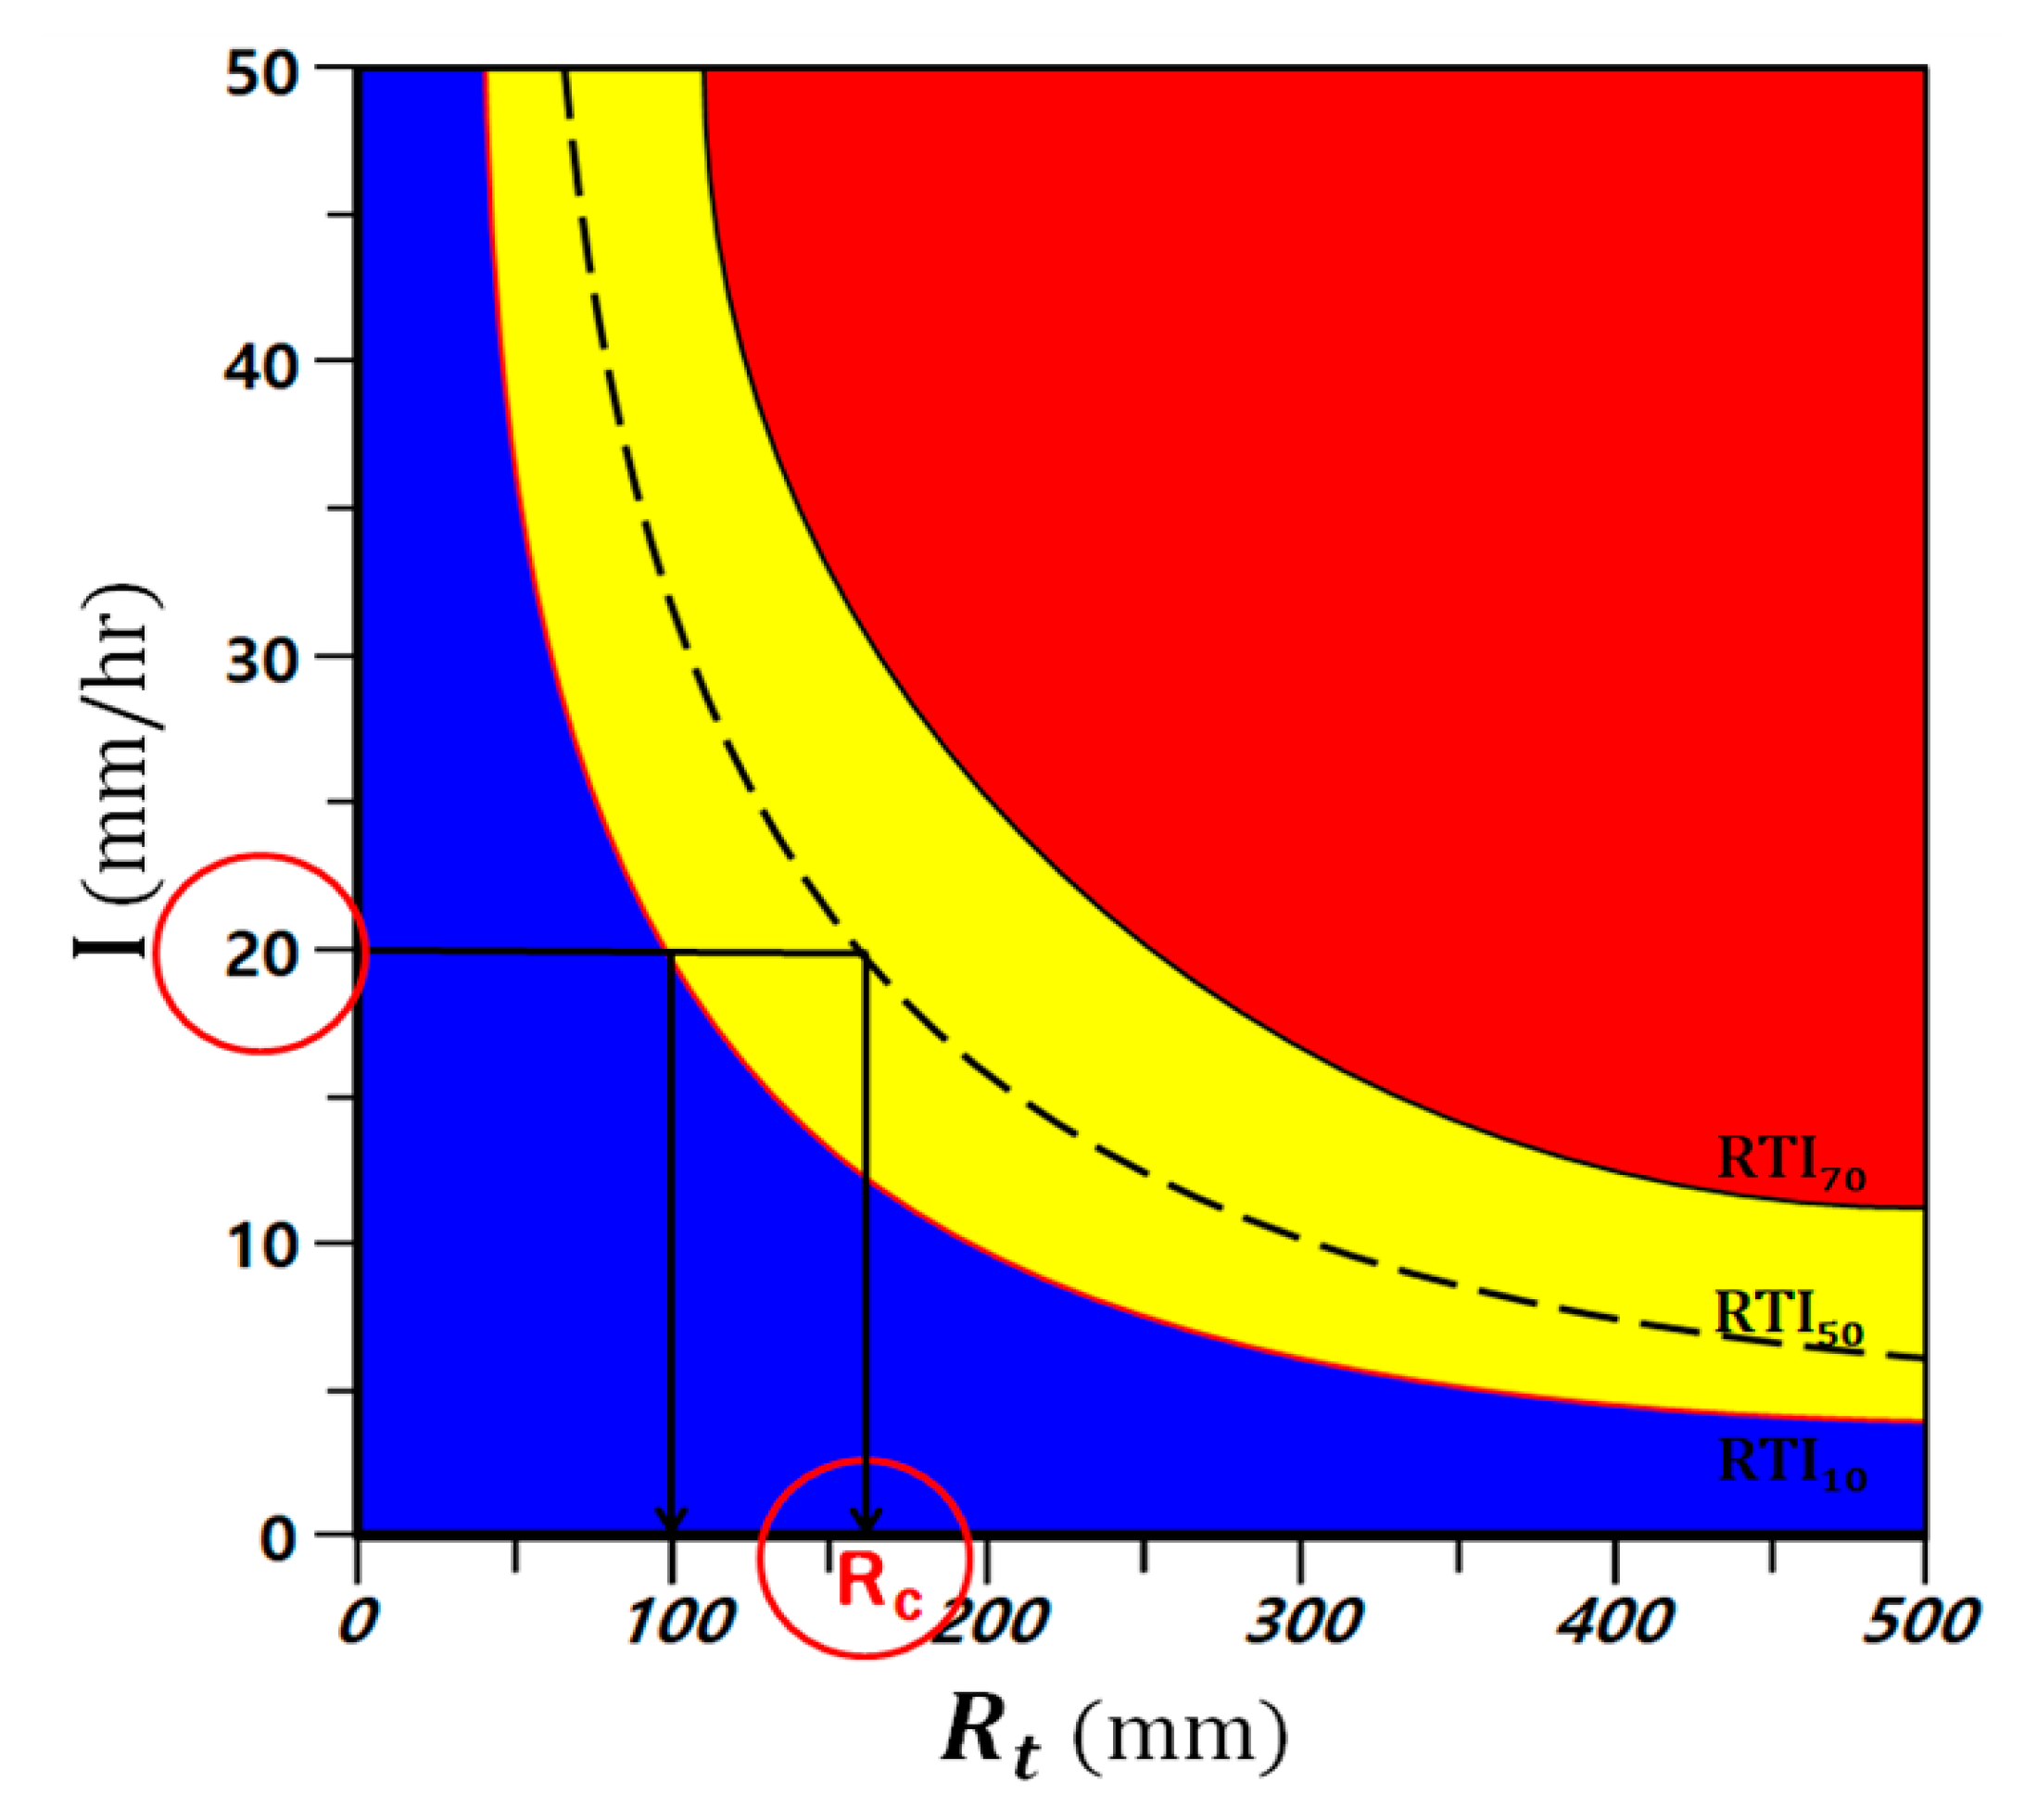
The RTI model developed by Jan and Lee [22] was designed to forecast debris flows triggered by rainfall in real time. For the RTI calculation, rainfall intensity (I) and accumulated rainfall () are used as follows.
In the equation above, I indicates rainfall intensity (mm/h) and is the accumulated rainfall (mm) observed shortly before the occurrence of debris flows. Among of the rainfall episodes for up to seven days, the one that continues for 24 h with a direct influence on debris flows is considered as antecedent rainfall. The study used the rainfall accumulated for duration 6 h, 12 h, and 24 h to estimate the RTI. Since rainfall has a direct impact on the occurrence of debris flows, especially its accumulation and intensity, the existing system for forecasting landslides uses forecasting for accumulated rainfall and rainfall intensity and daily rainfall, whereas the RTI is calculated with accumulated rainfall and rainfall intensity to consider both the amount and intensity. However, the RTI can be difficult to understand for communities where debris flow–related damage is expected, as it is only a combination of rainfall intensity and accumulated rainfall and does not directly deliver the information about a risk level of debris flow. Therefore, the RTI was converted into critical accumulated rainfall () to aid understanding in the provided forecasting. Since the RTI focused on damage in Taiwan during the country’s developed stage, it showed a gap for the rainfall and intensity of South Korea. Therefore, the study changed the level to 10%, 50%, and 70%, taking into consideration the flood forecasting standards provided by the Han River Flood Control Office [26]. Figure 4 shows the definition of RTI and .
4. Result and Discussion
4.1. Analysis of Debris Flow-Triggering Rainfall Data
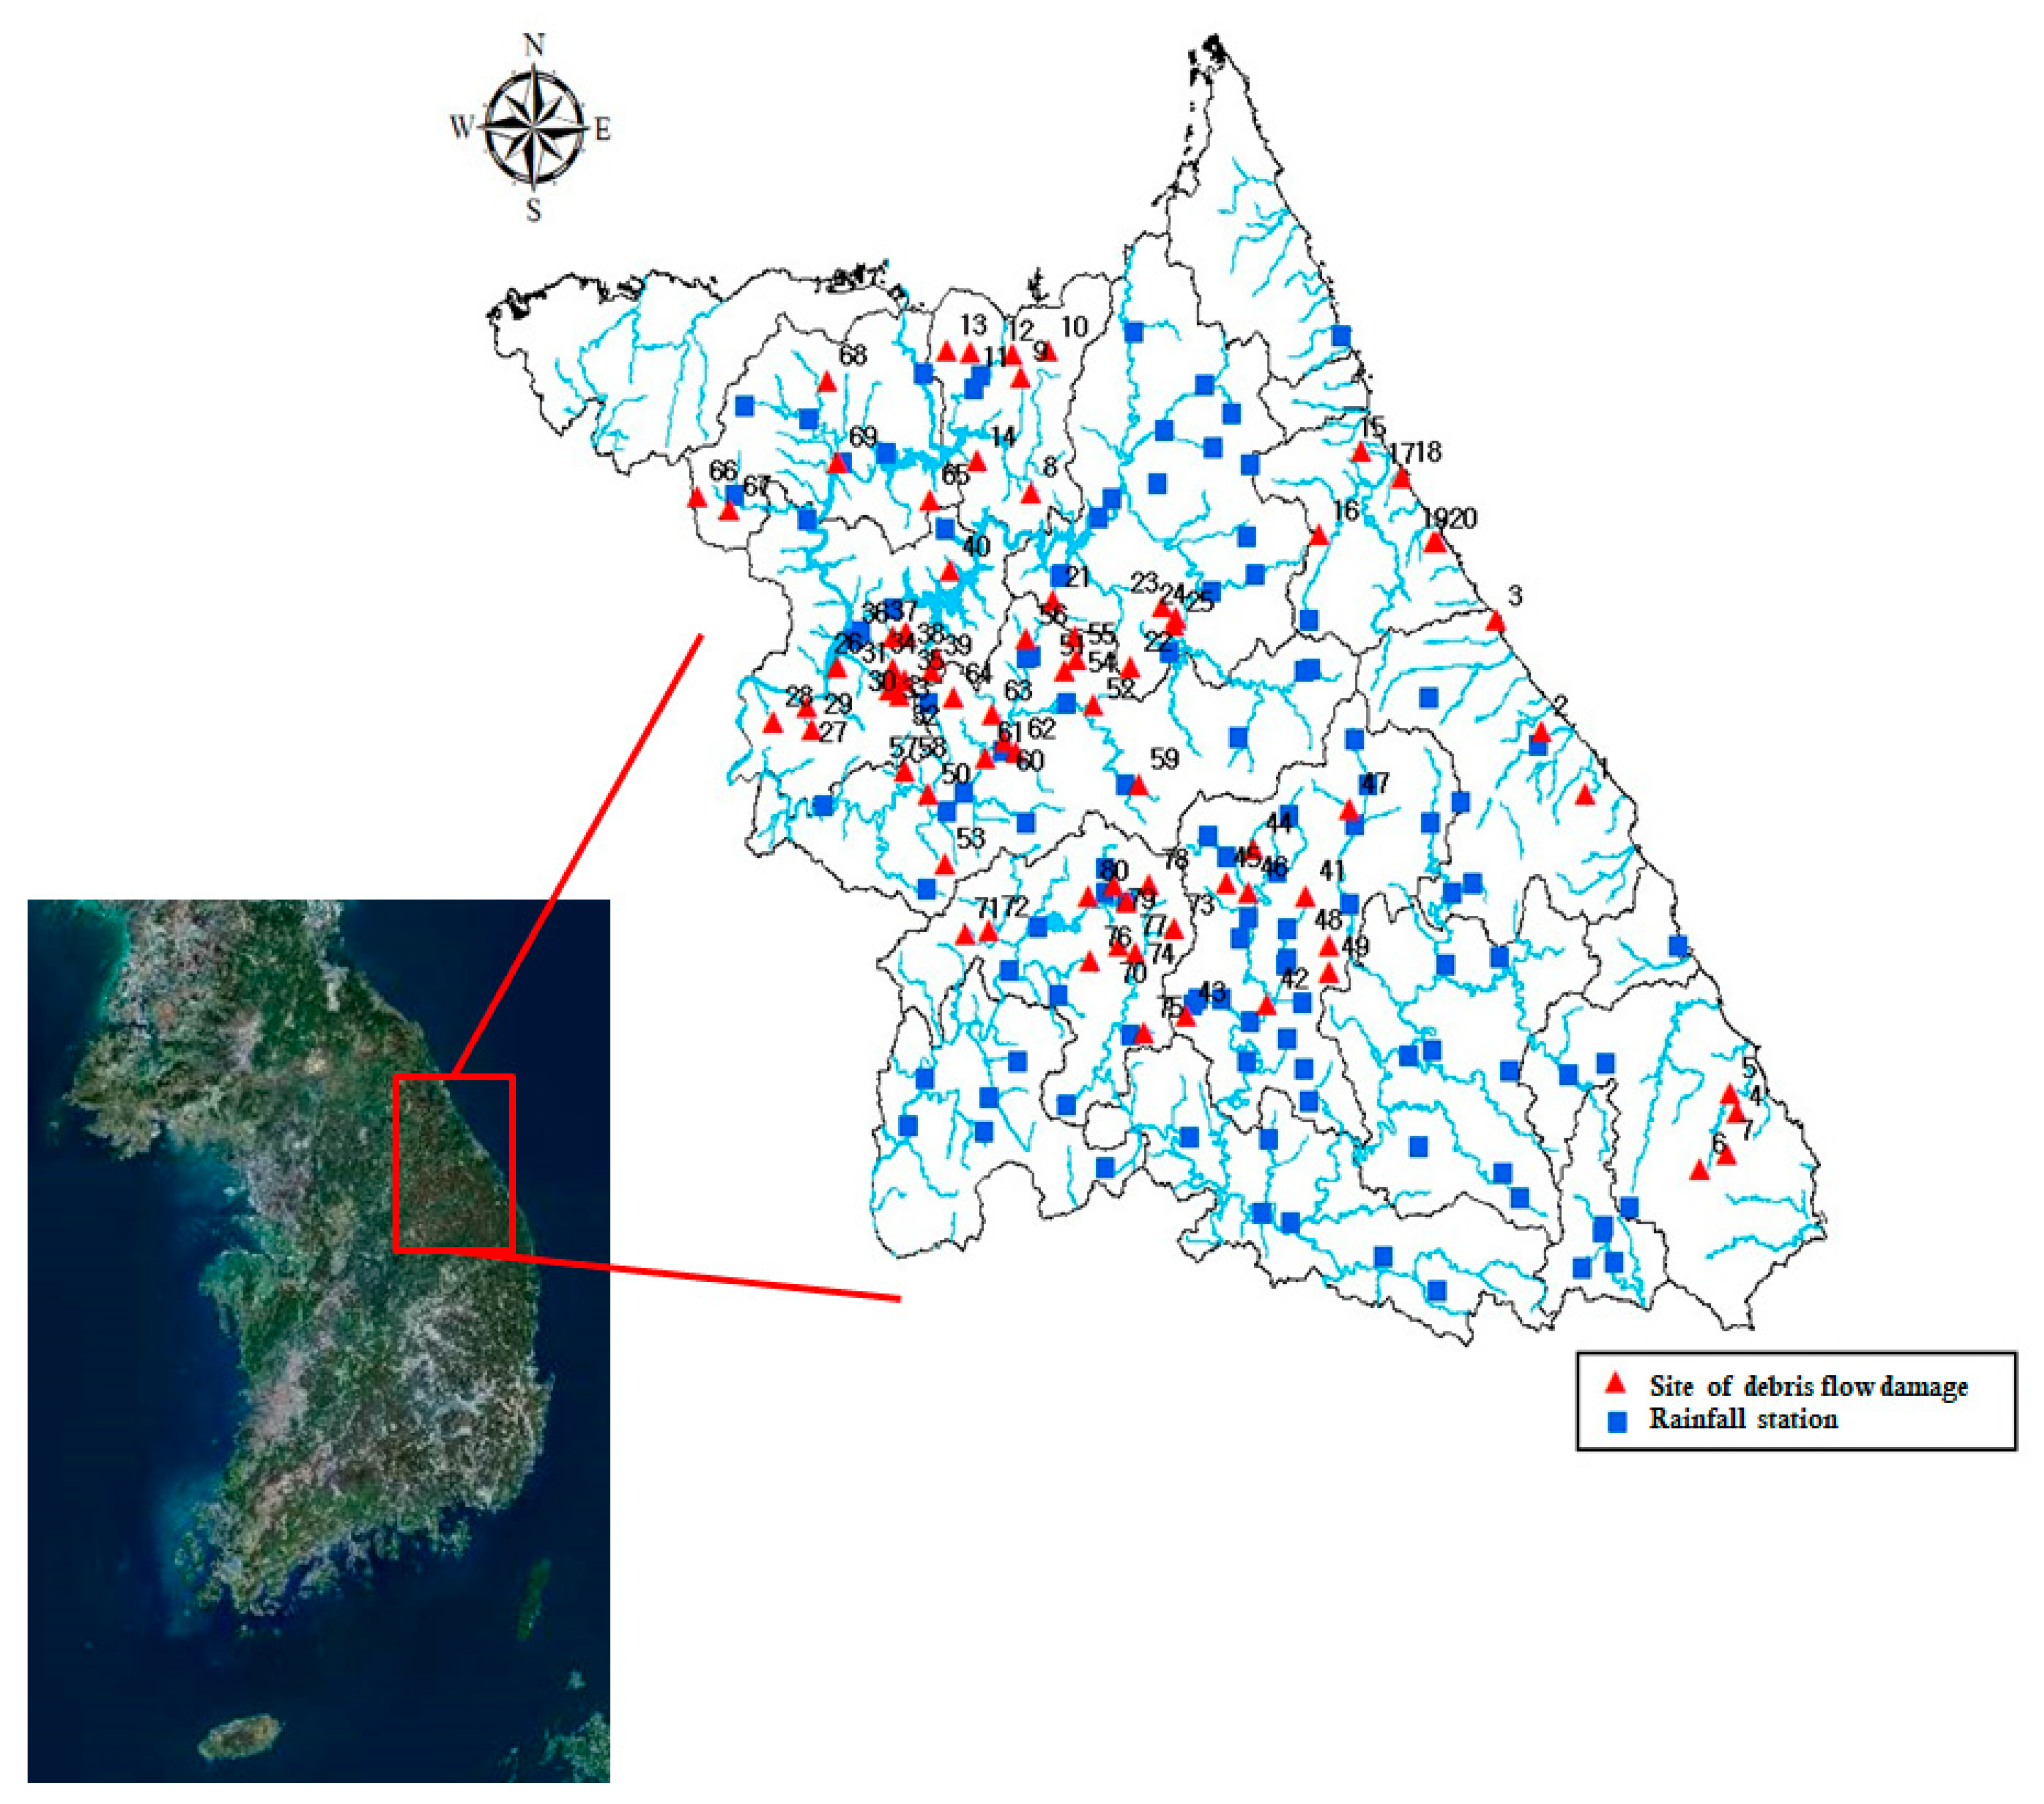
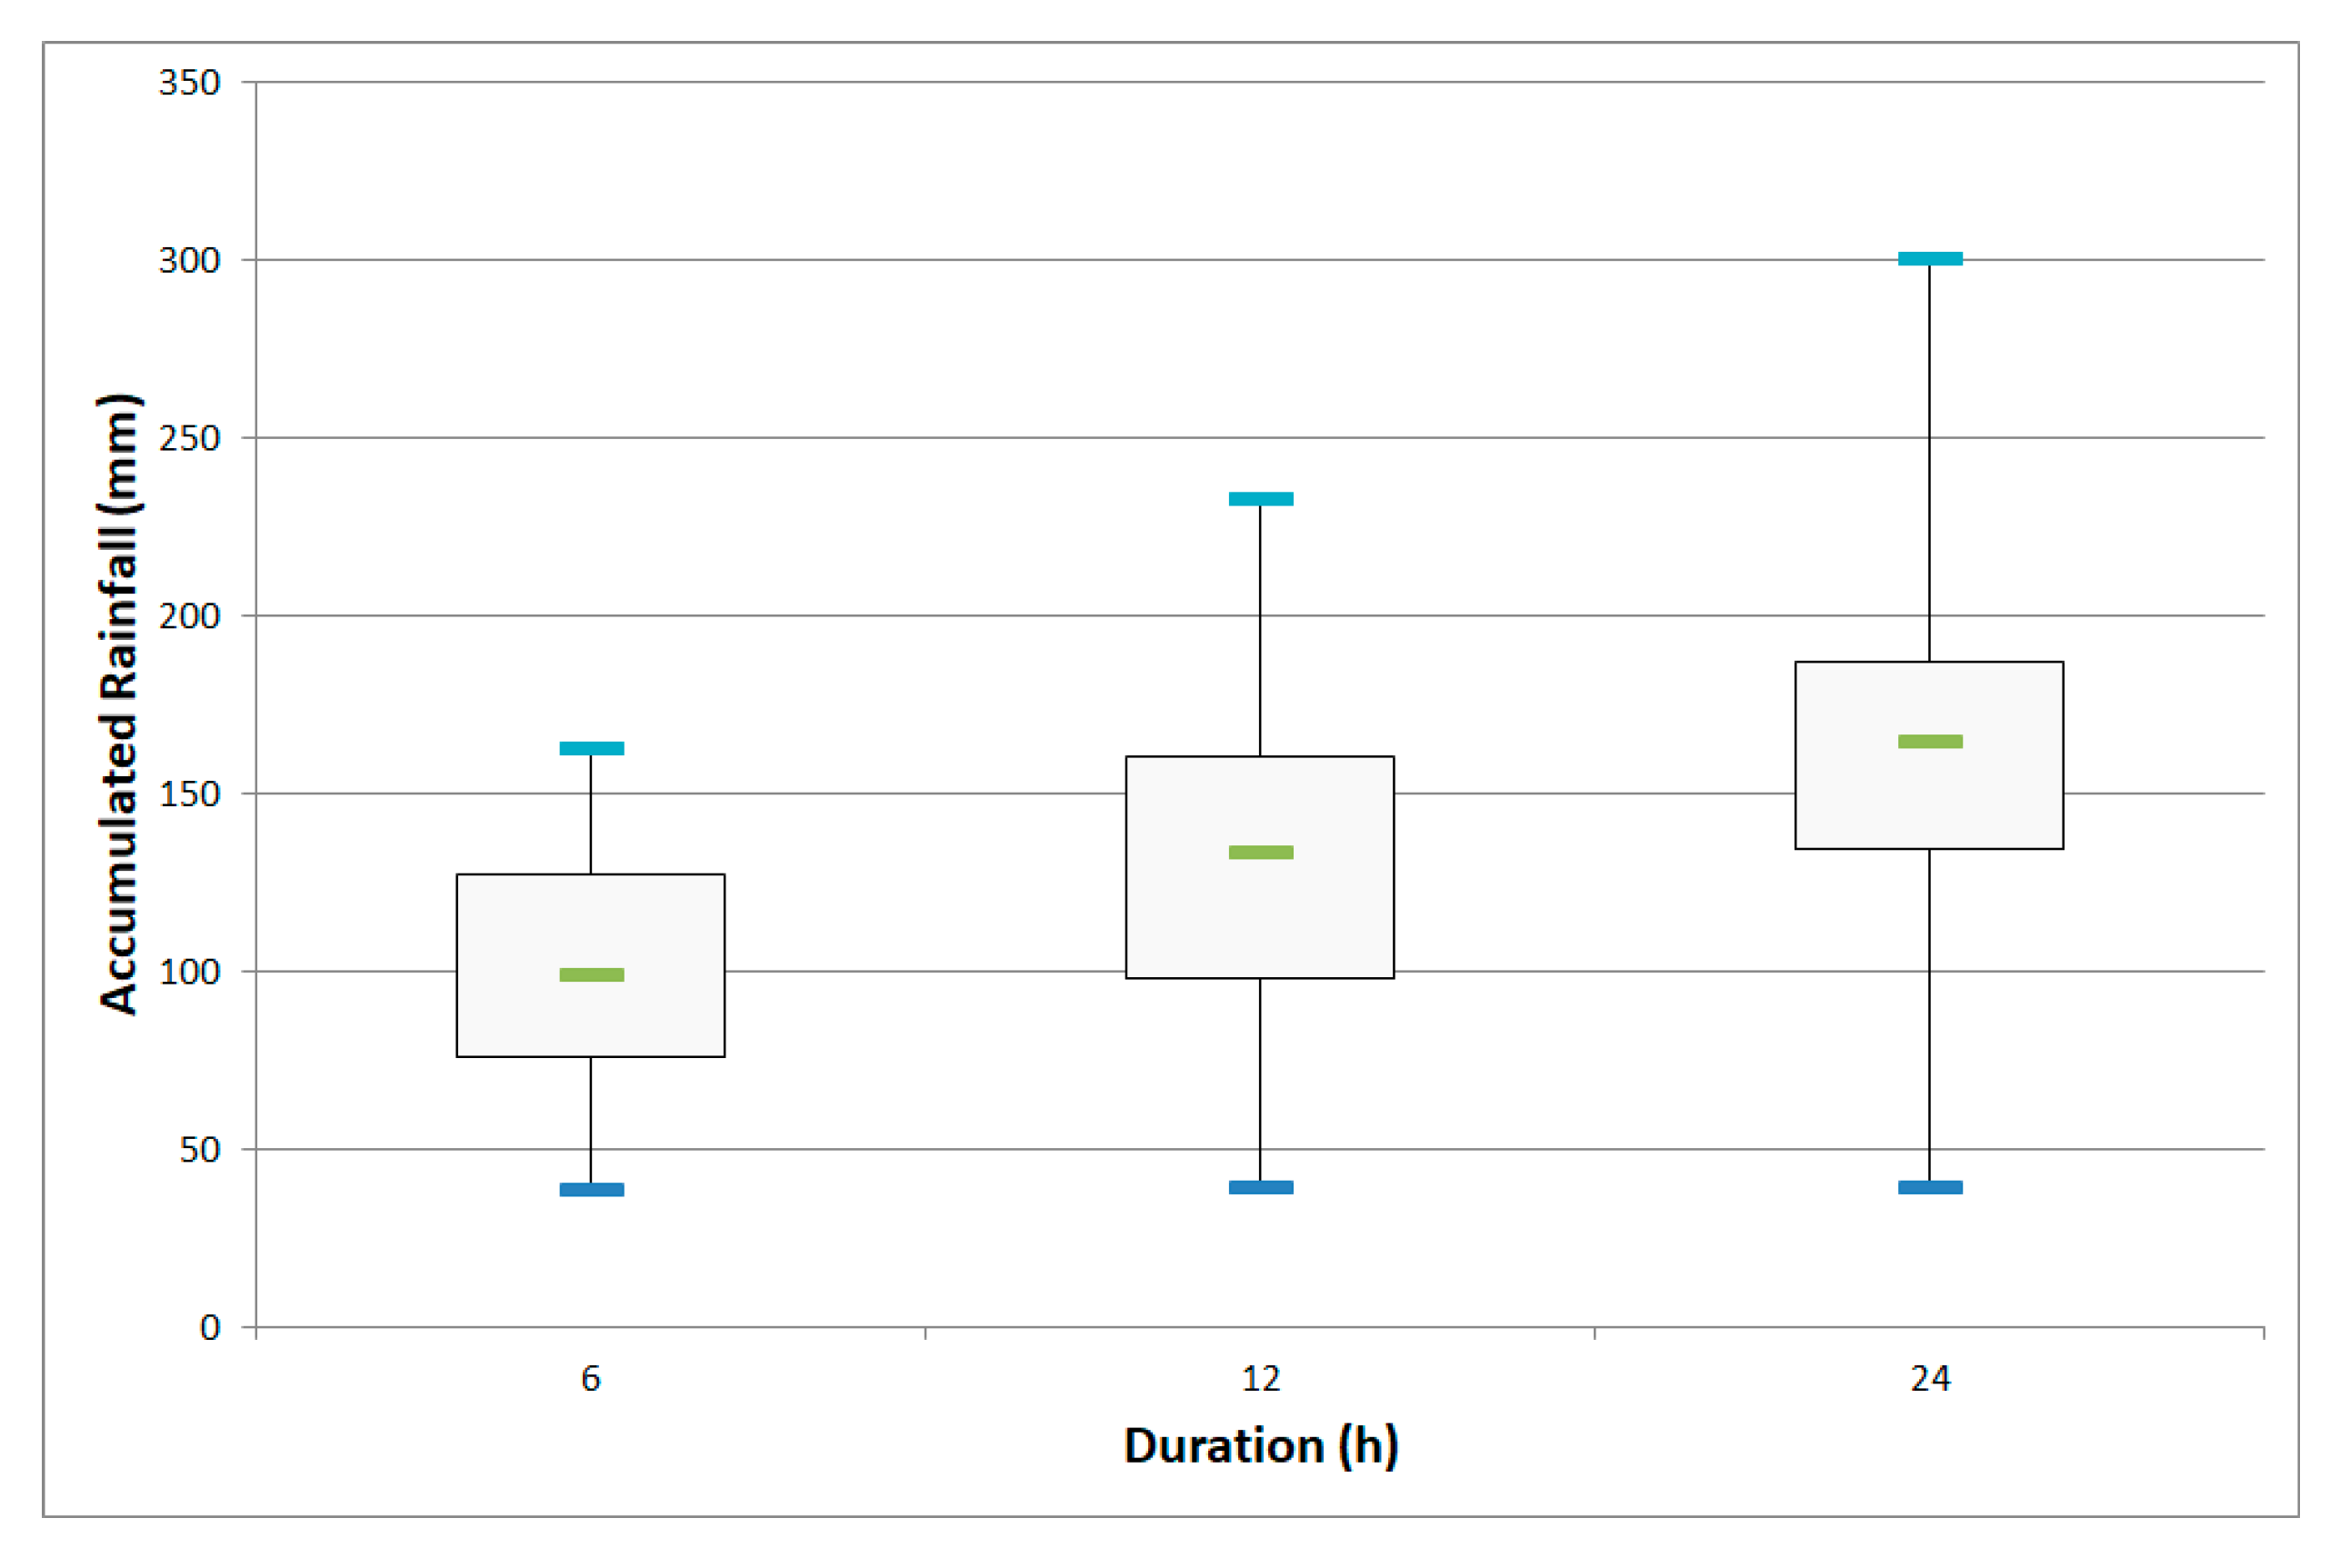
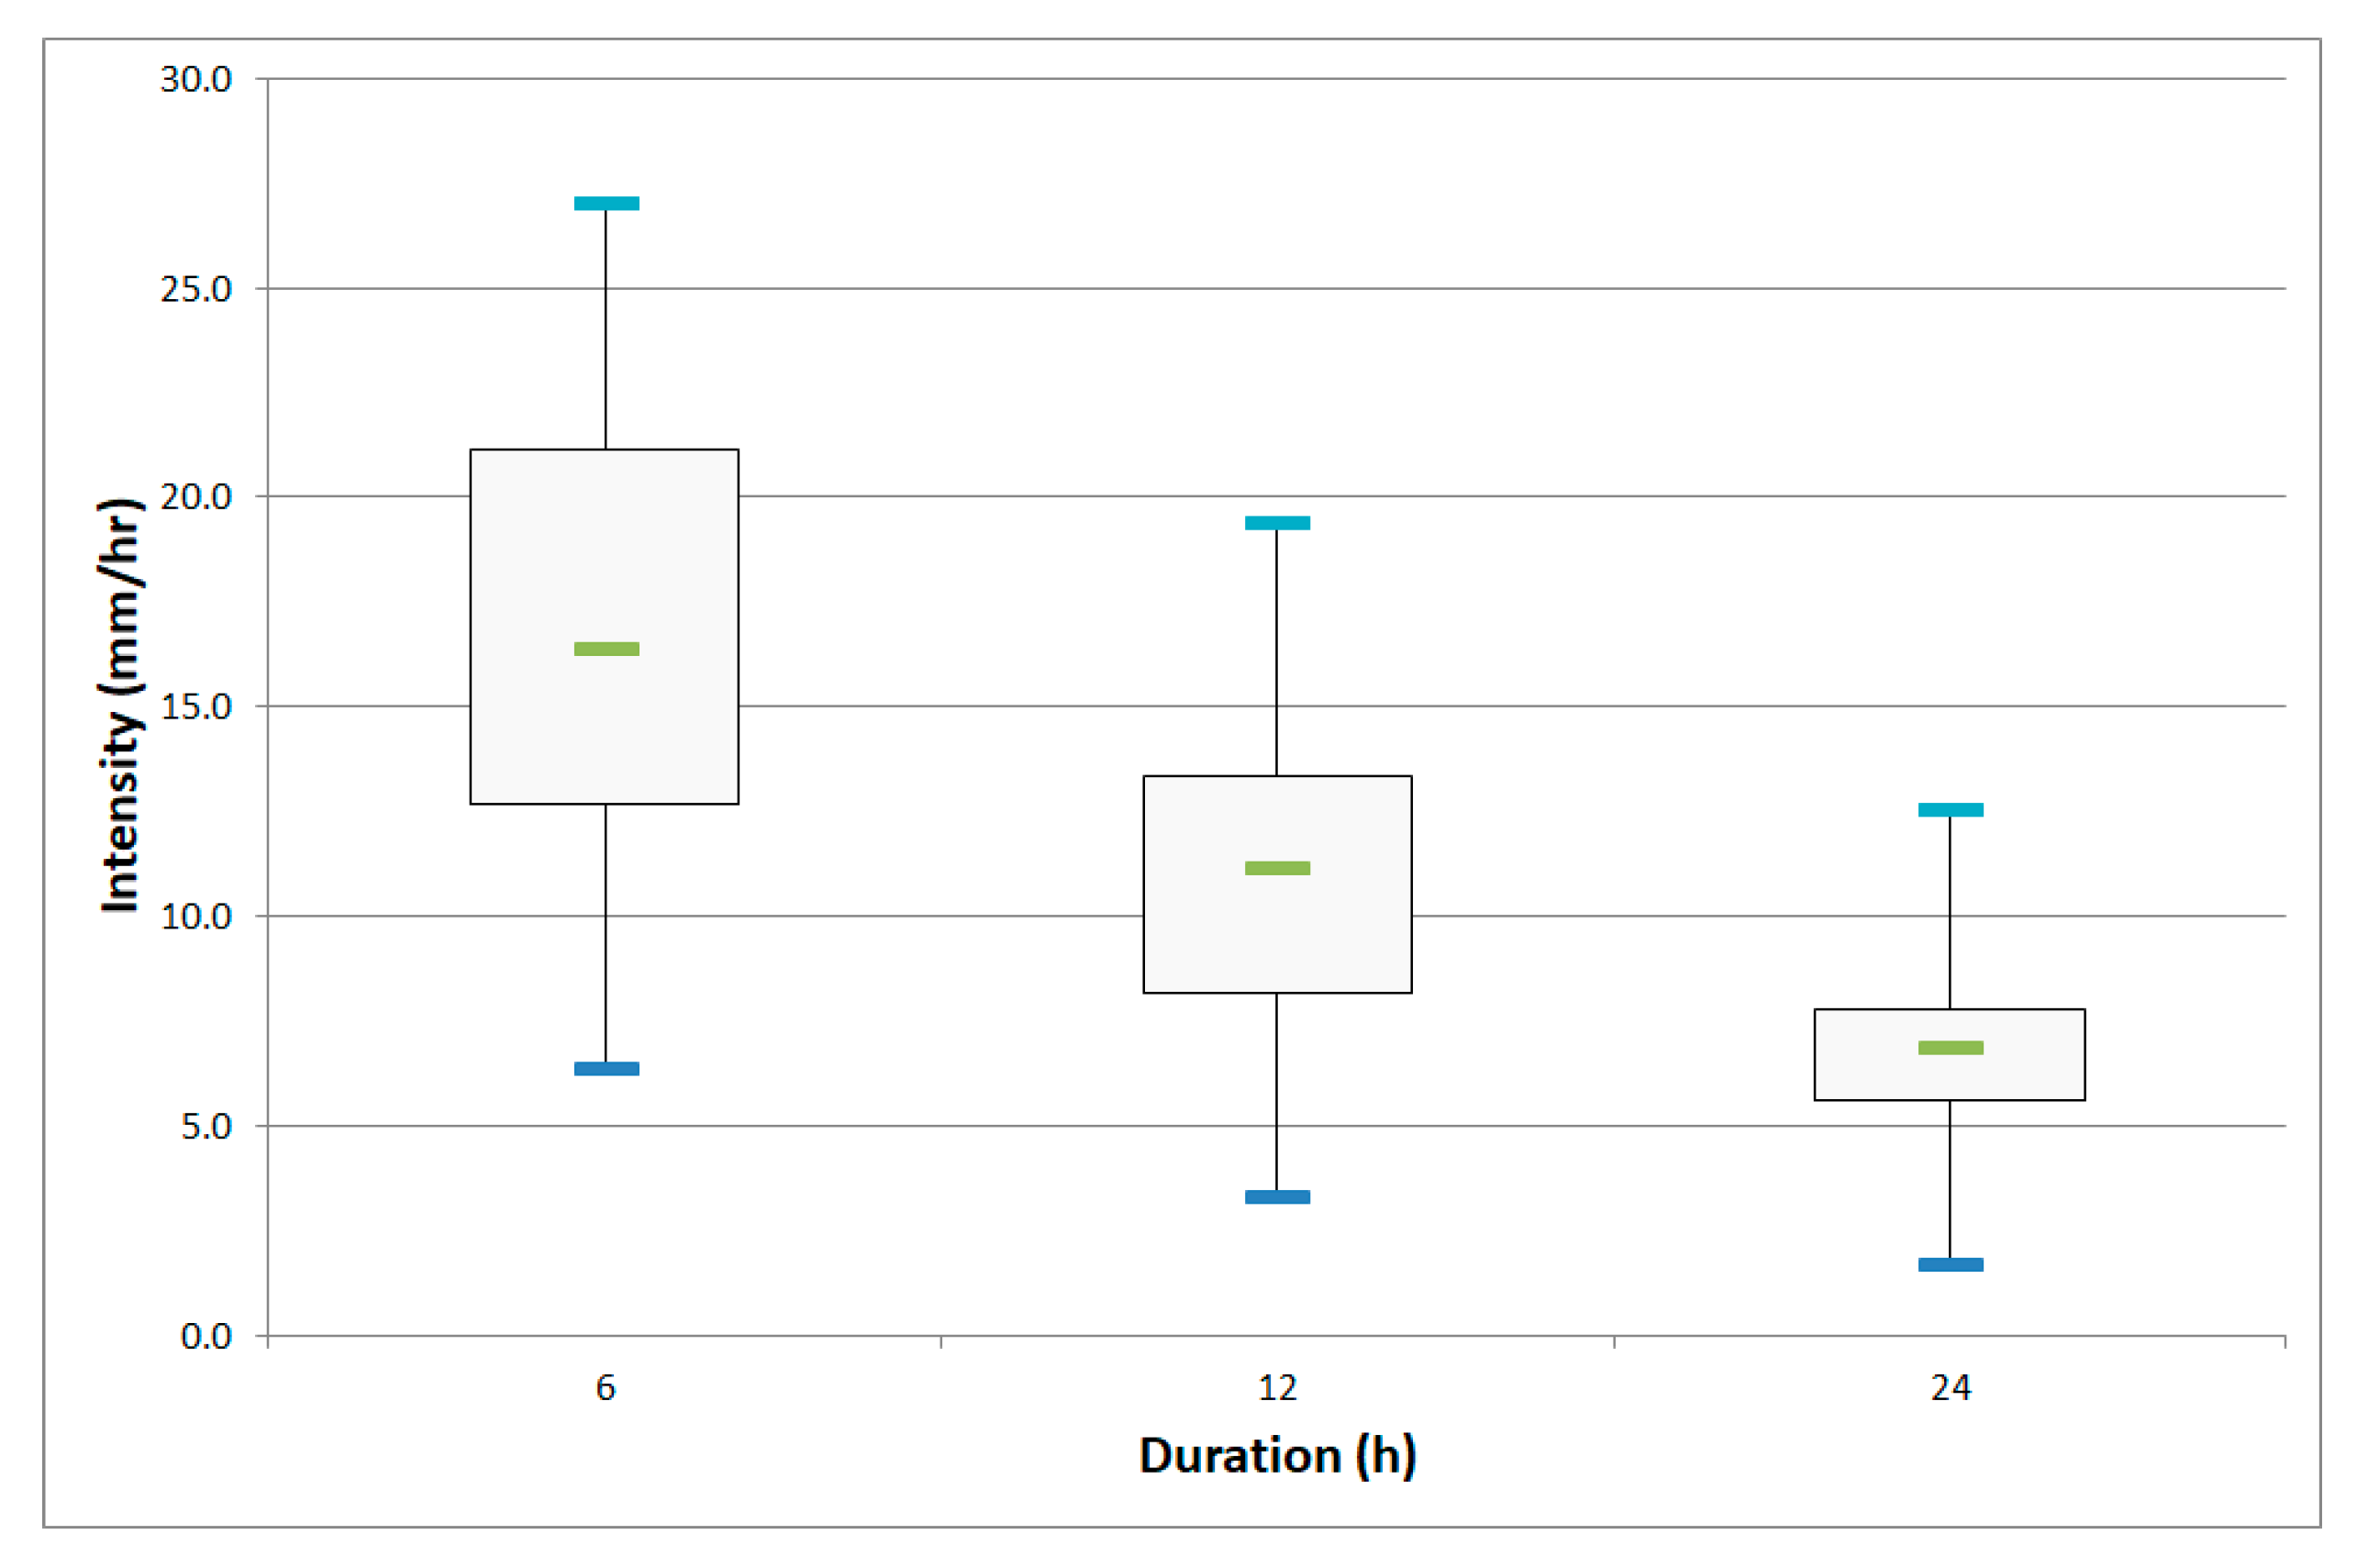
In South Korea, mountainous areas account for 60% of its territory. Since most of them are concentrated in Gangwon Province, debris flow damage is frequently reported for the province. In this regard, the study collected data on the debris flow–triggering rainfall from 80 stations for 2012 to 2013 in Gangwon Province, where debris flows easily occur, and calculated accumulated rainfall and rainfall intensity at the site of damage occurrence (Table 3). Figure 5 shows the points of debris flows and the current status of rainfall monitoring stations. Figure 6 and Figure 7 show dispersion of the maximum accumulated rainfall and rainfall intensity for 6 h, 12 h, and 24 h at the 80 stations in the damaged areas.
4.2. Development of Nomogram for Debris Flow Forecasting, Using RTI and
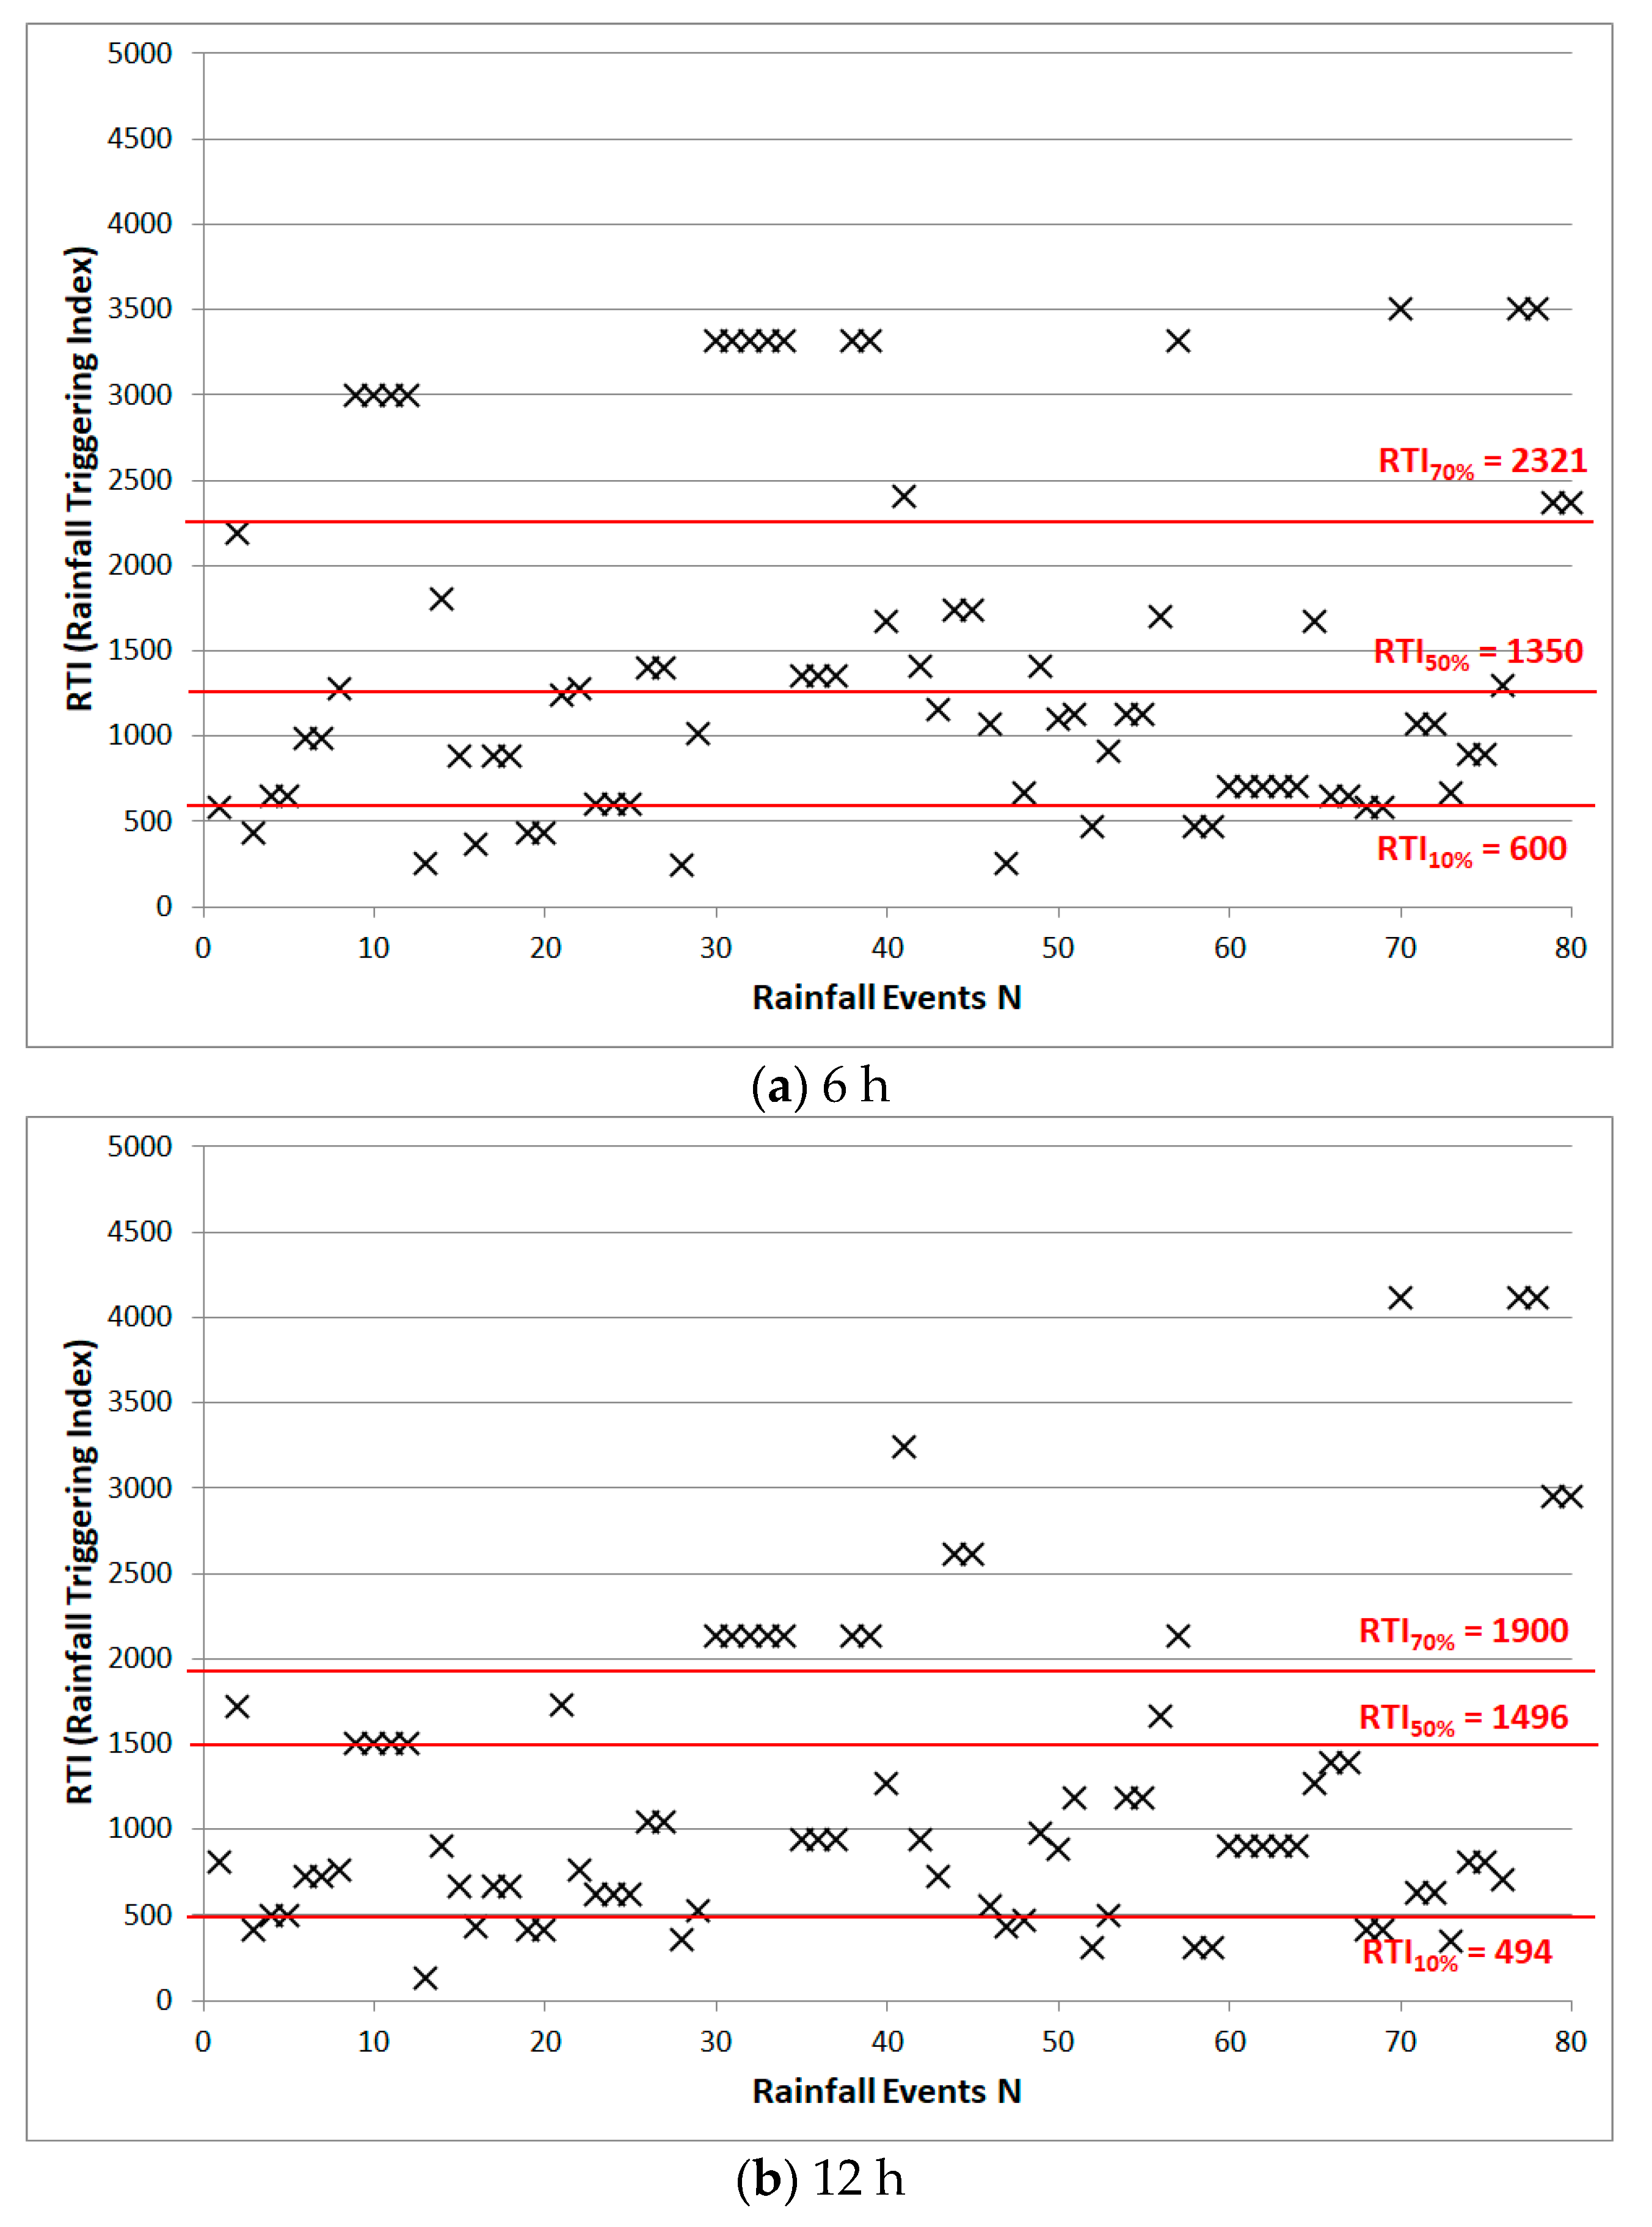
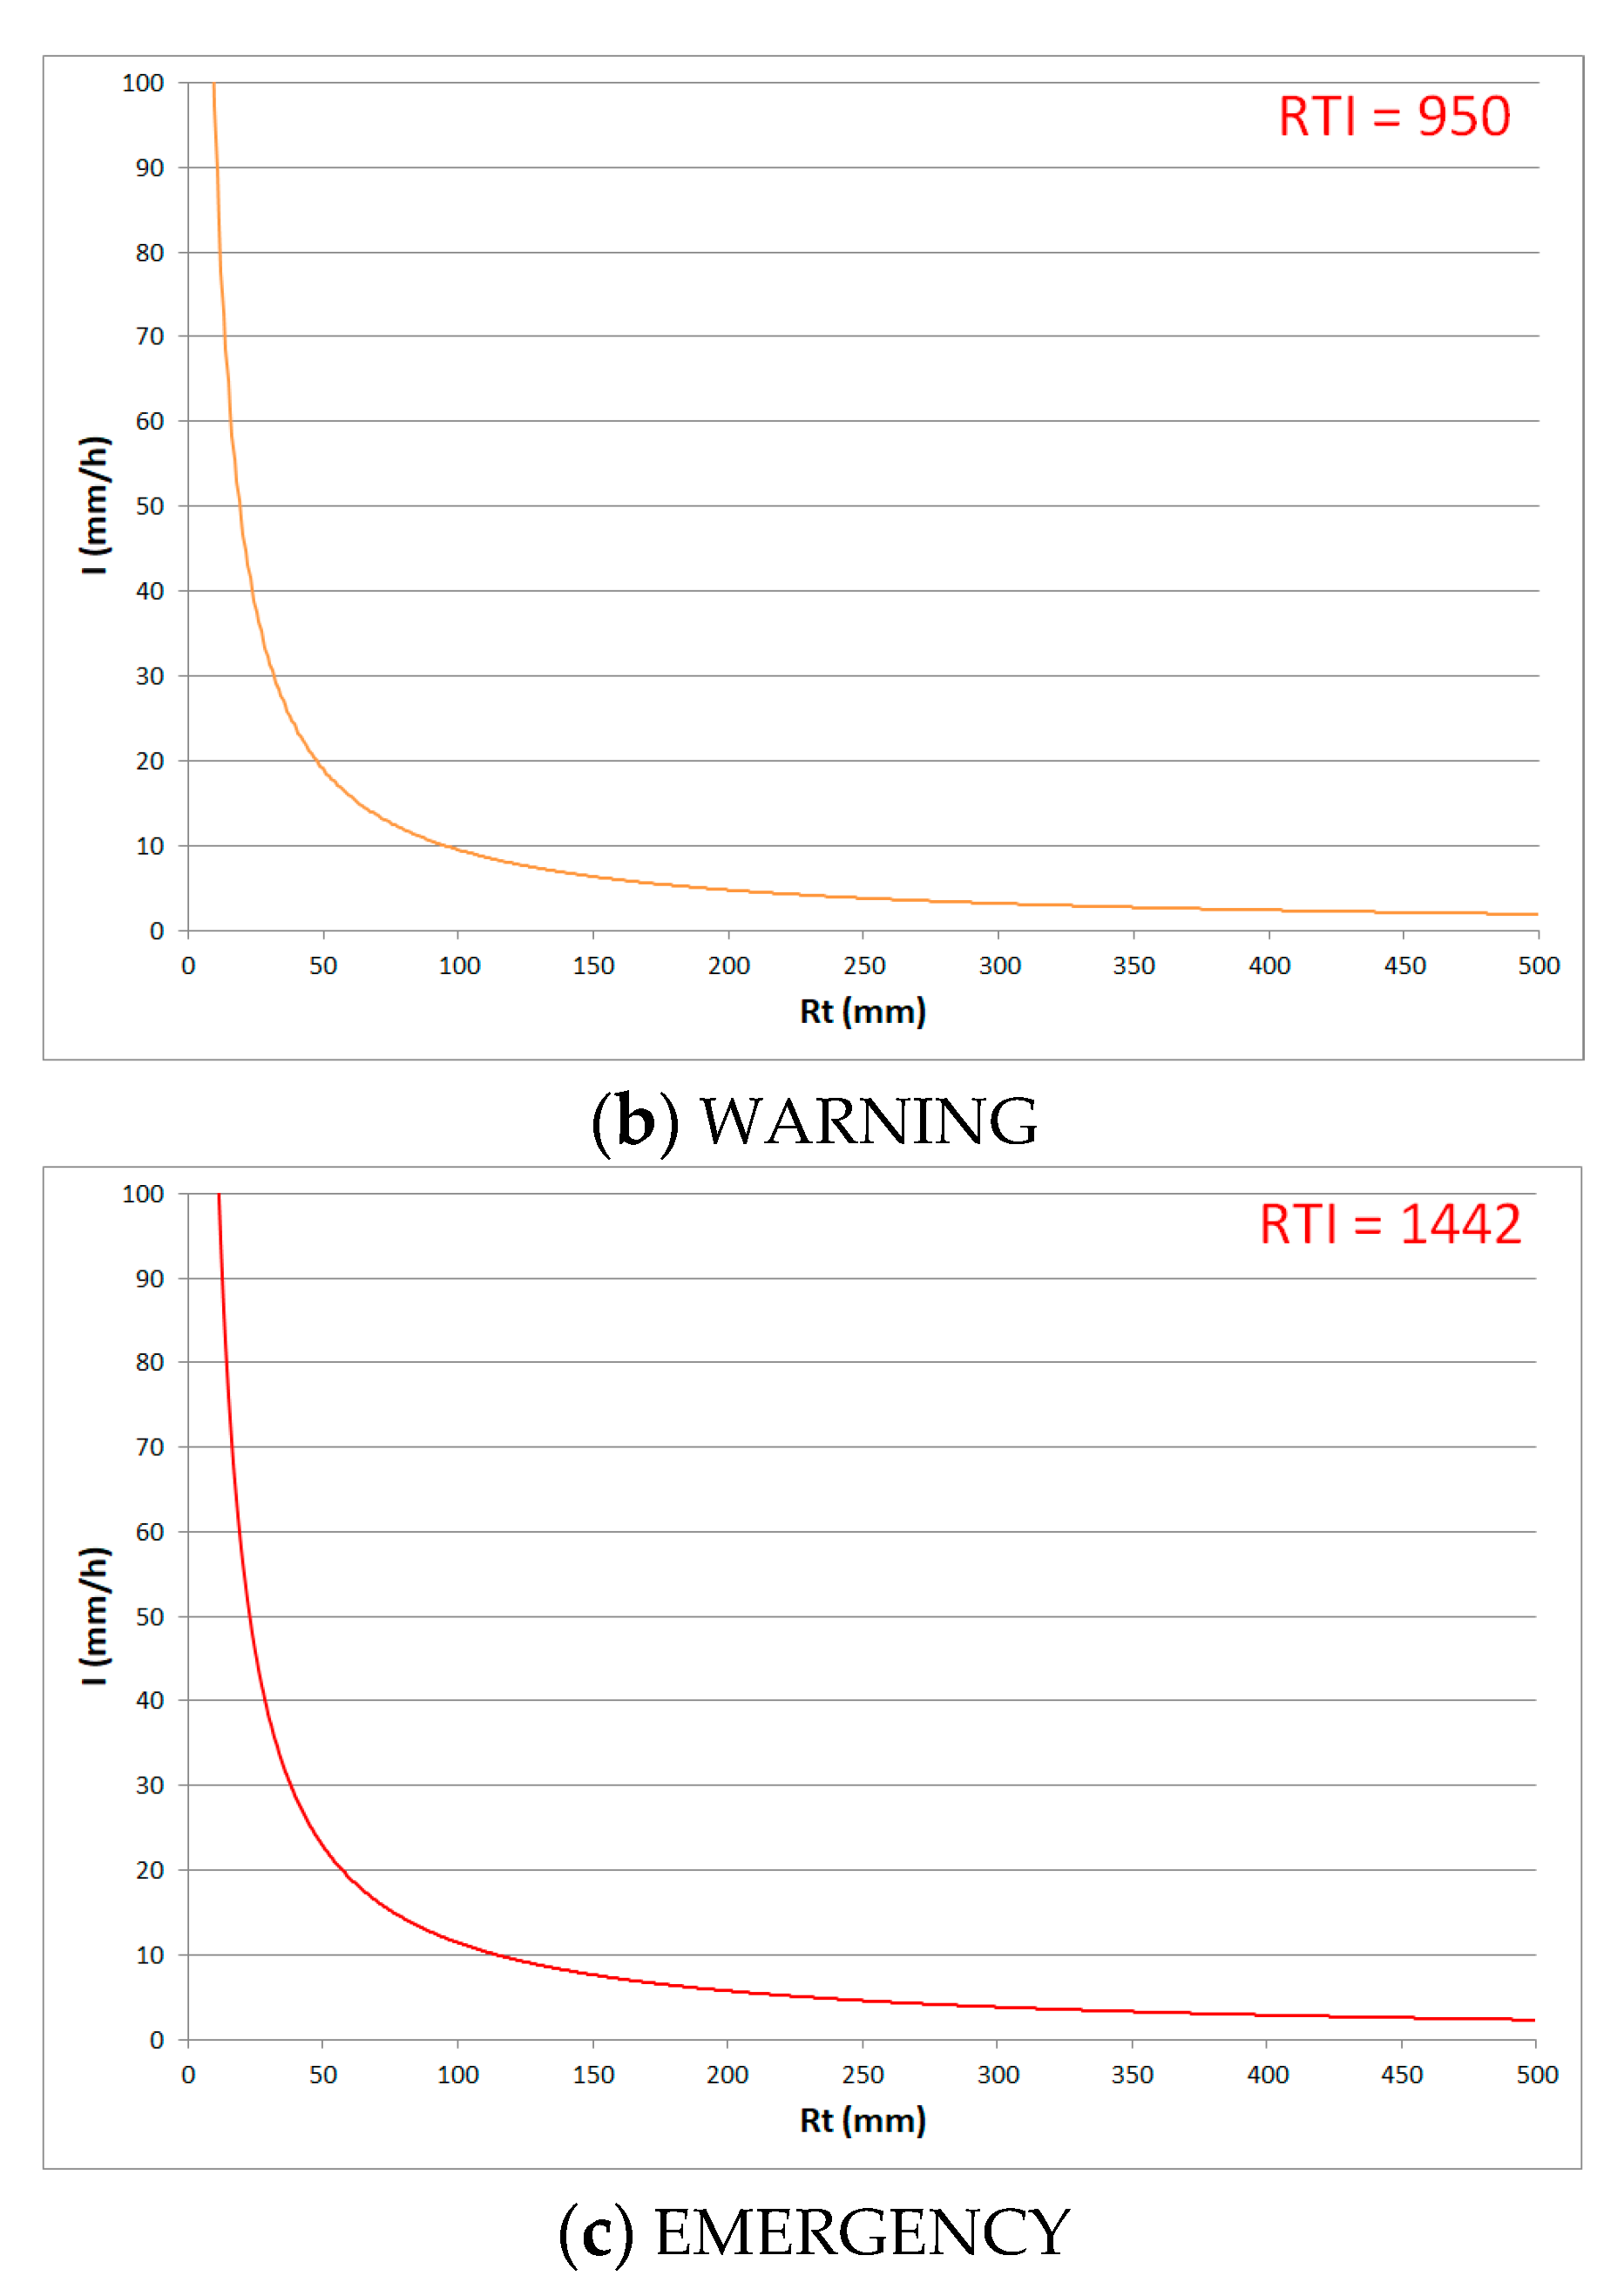
The study used rainfall information from the 80 stations mentioned above to calculate the RTIs by phase (ALERT, WARNING, and EMERGENCY) for each rainfall duration (6 h, 12 h, and 24 h). The RTIs were estimated as 600 (10%), 1350 (50%), and 2321 (70%) for the 6 continuous hours; 494 (10%), 1496 (50%), and 1900 (70%) for the 12 hours; and 570 (10%), 950 (50%), 1442 (70%) for the 24 hours. Table 4 summarizes the calculated RTIs and accumulated rainfall and rainfall intensity for each duration.
Prior to forecasting debris flow, related standards should be established. In South Korea, flood forecasting is made, wherein flood levels are standardized with 50 to 70% of the project flood water levels, in general, applied for the warning and alerting. As explained above, the study referred to the flood forecasting standards of the Han River Flood Control Office [26], with the following set for each level: 10 to 50% of the occurrence possibility for ALERT, 50 to 70% for WARNING, and 70% or higher for EMERGENCY. Furthermore, the study classified three forecasting levels for the durations of 6 h, 12 h, and 24 h. Figure 8 shows events of the 80 stations in relation with RTIs, whereas Figure 9, Figure 10 and Figure 11 show graphs of the RTI estimations.
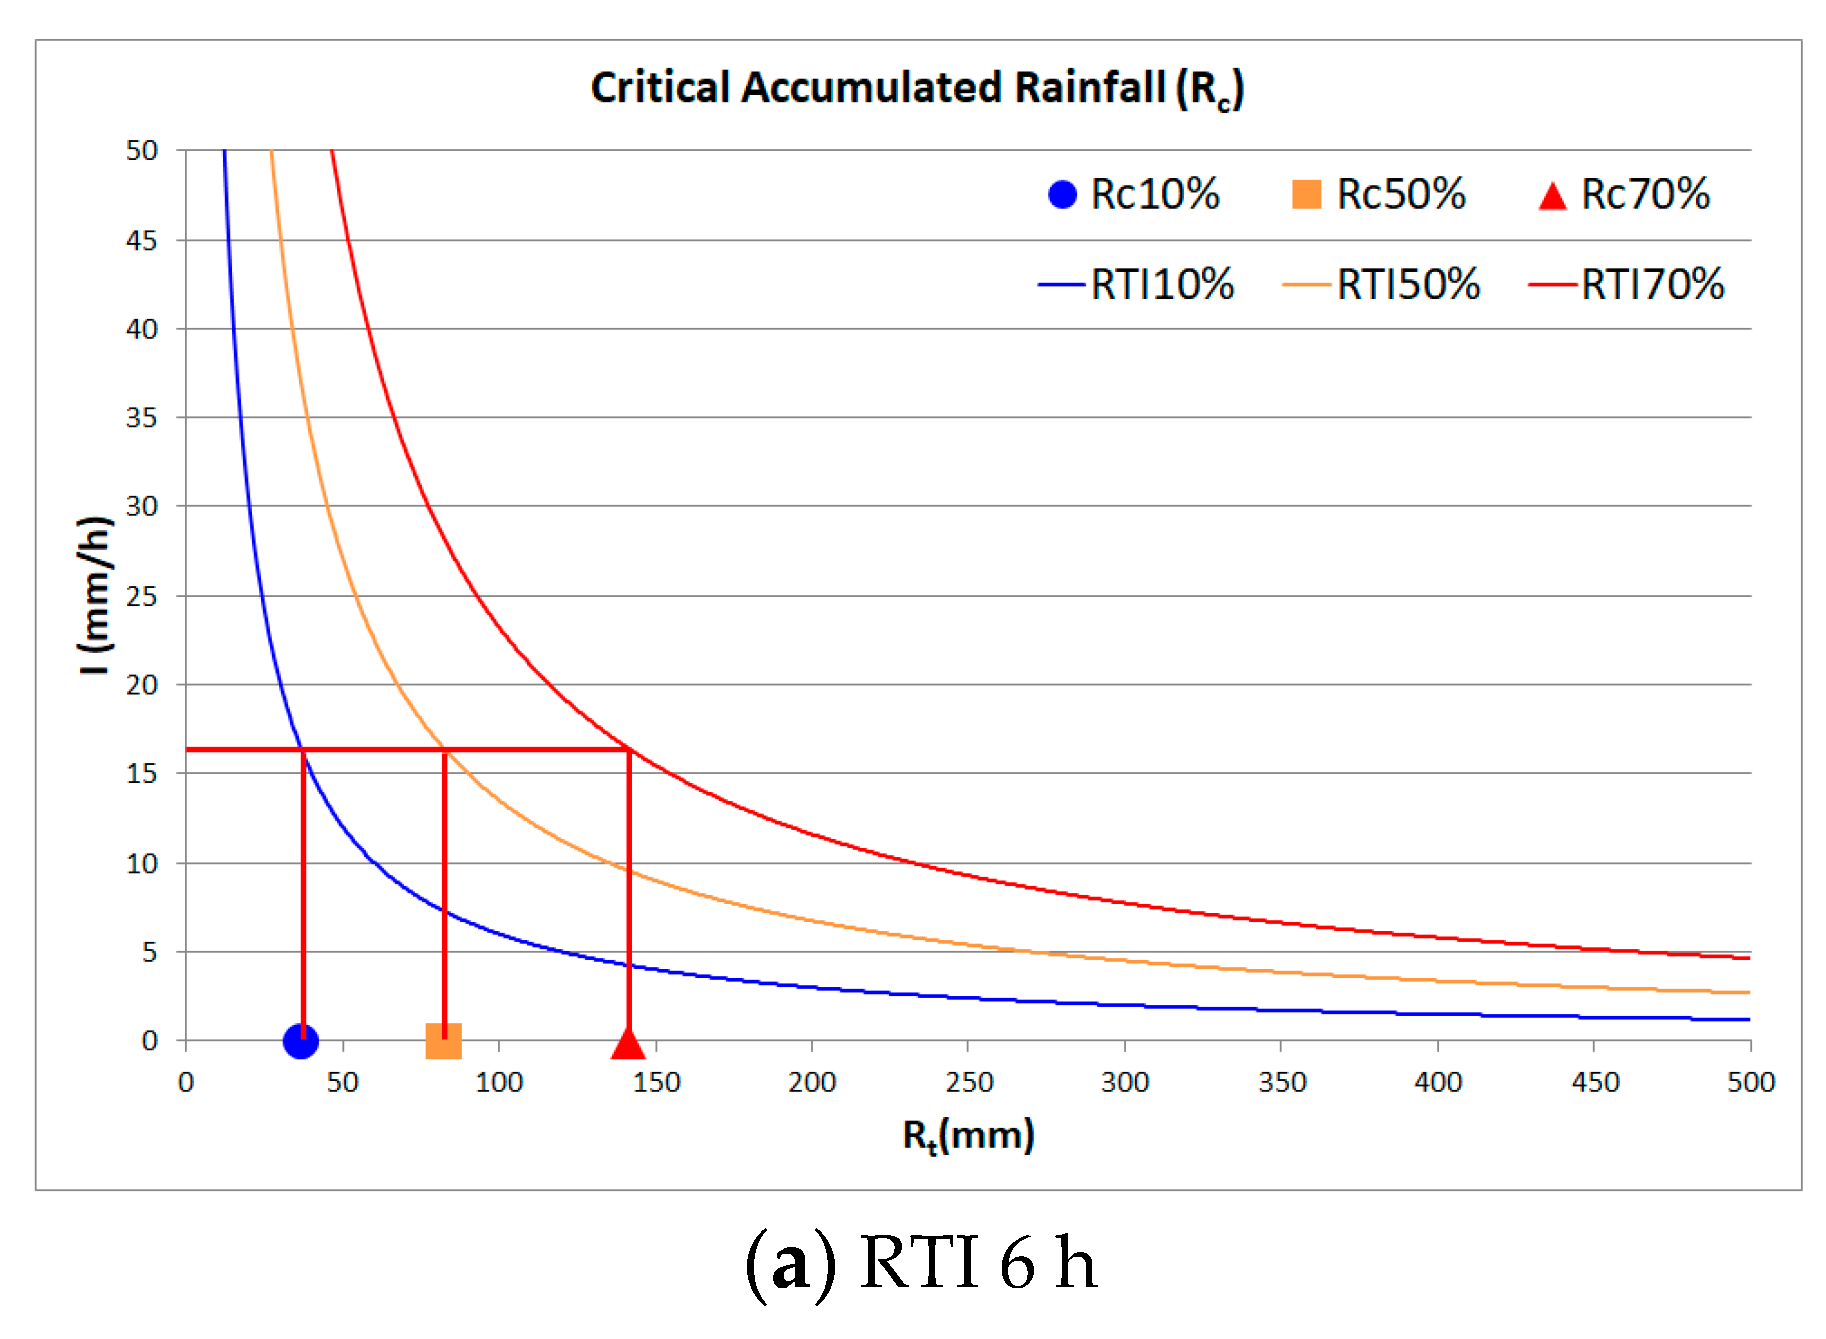
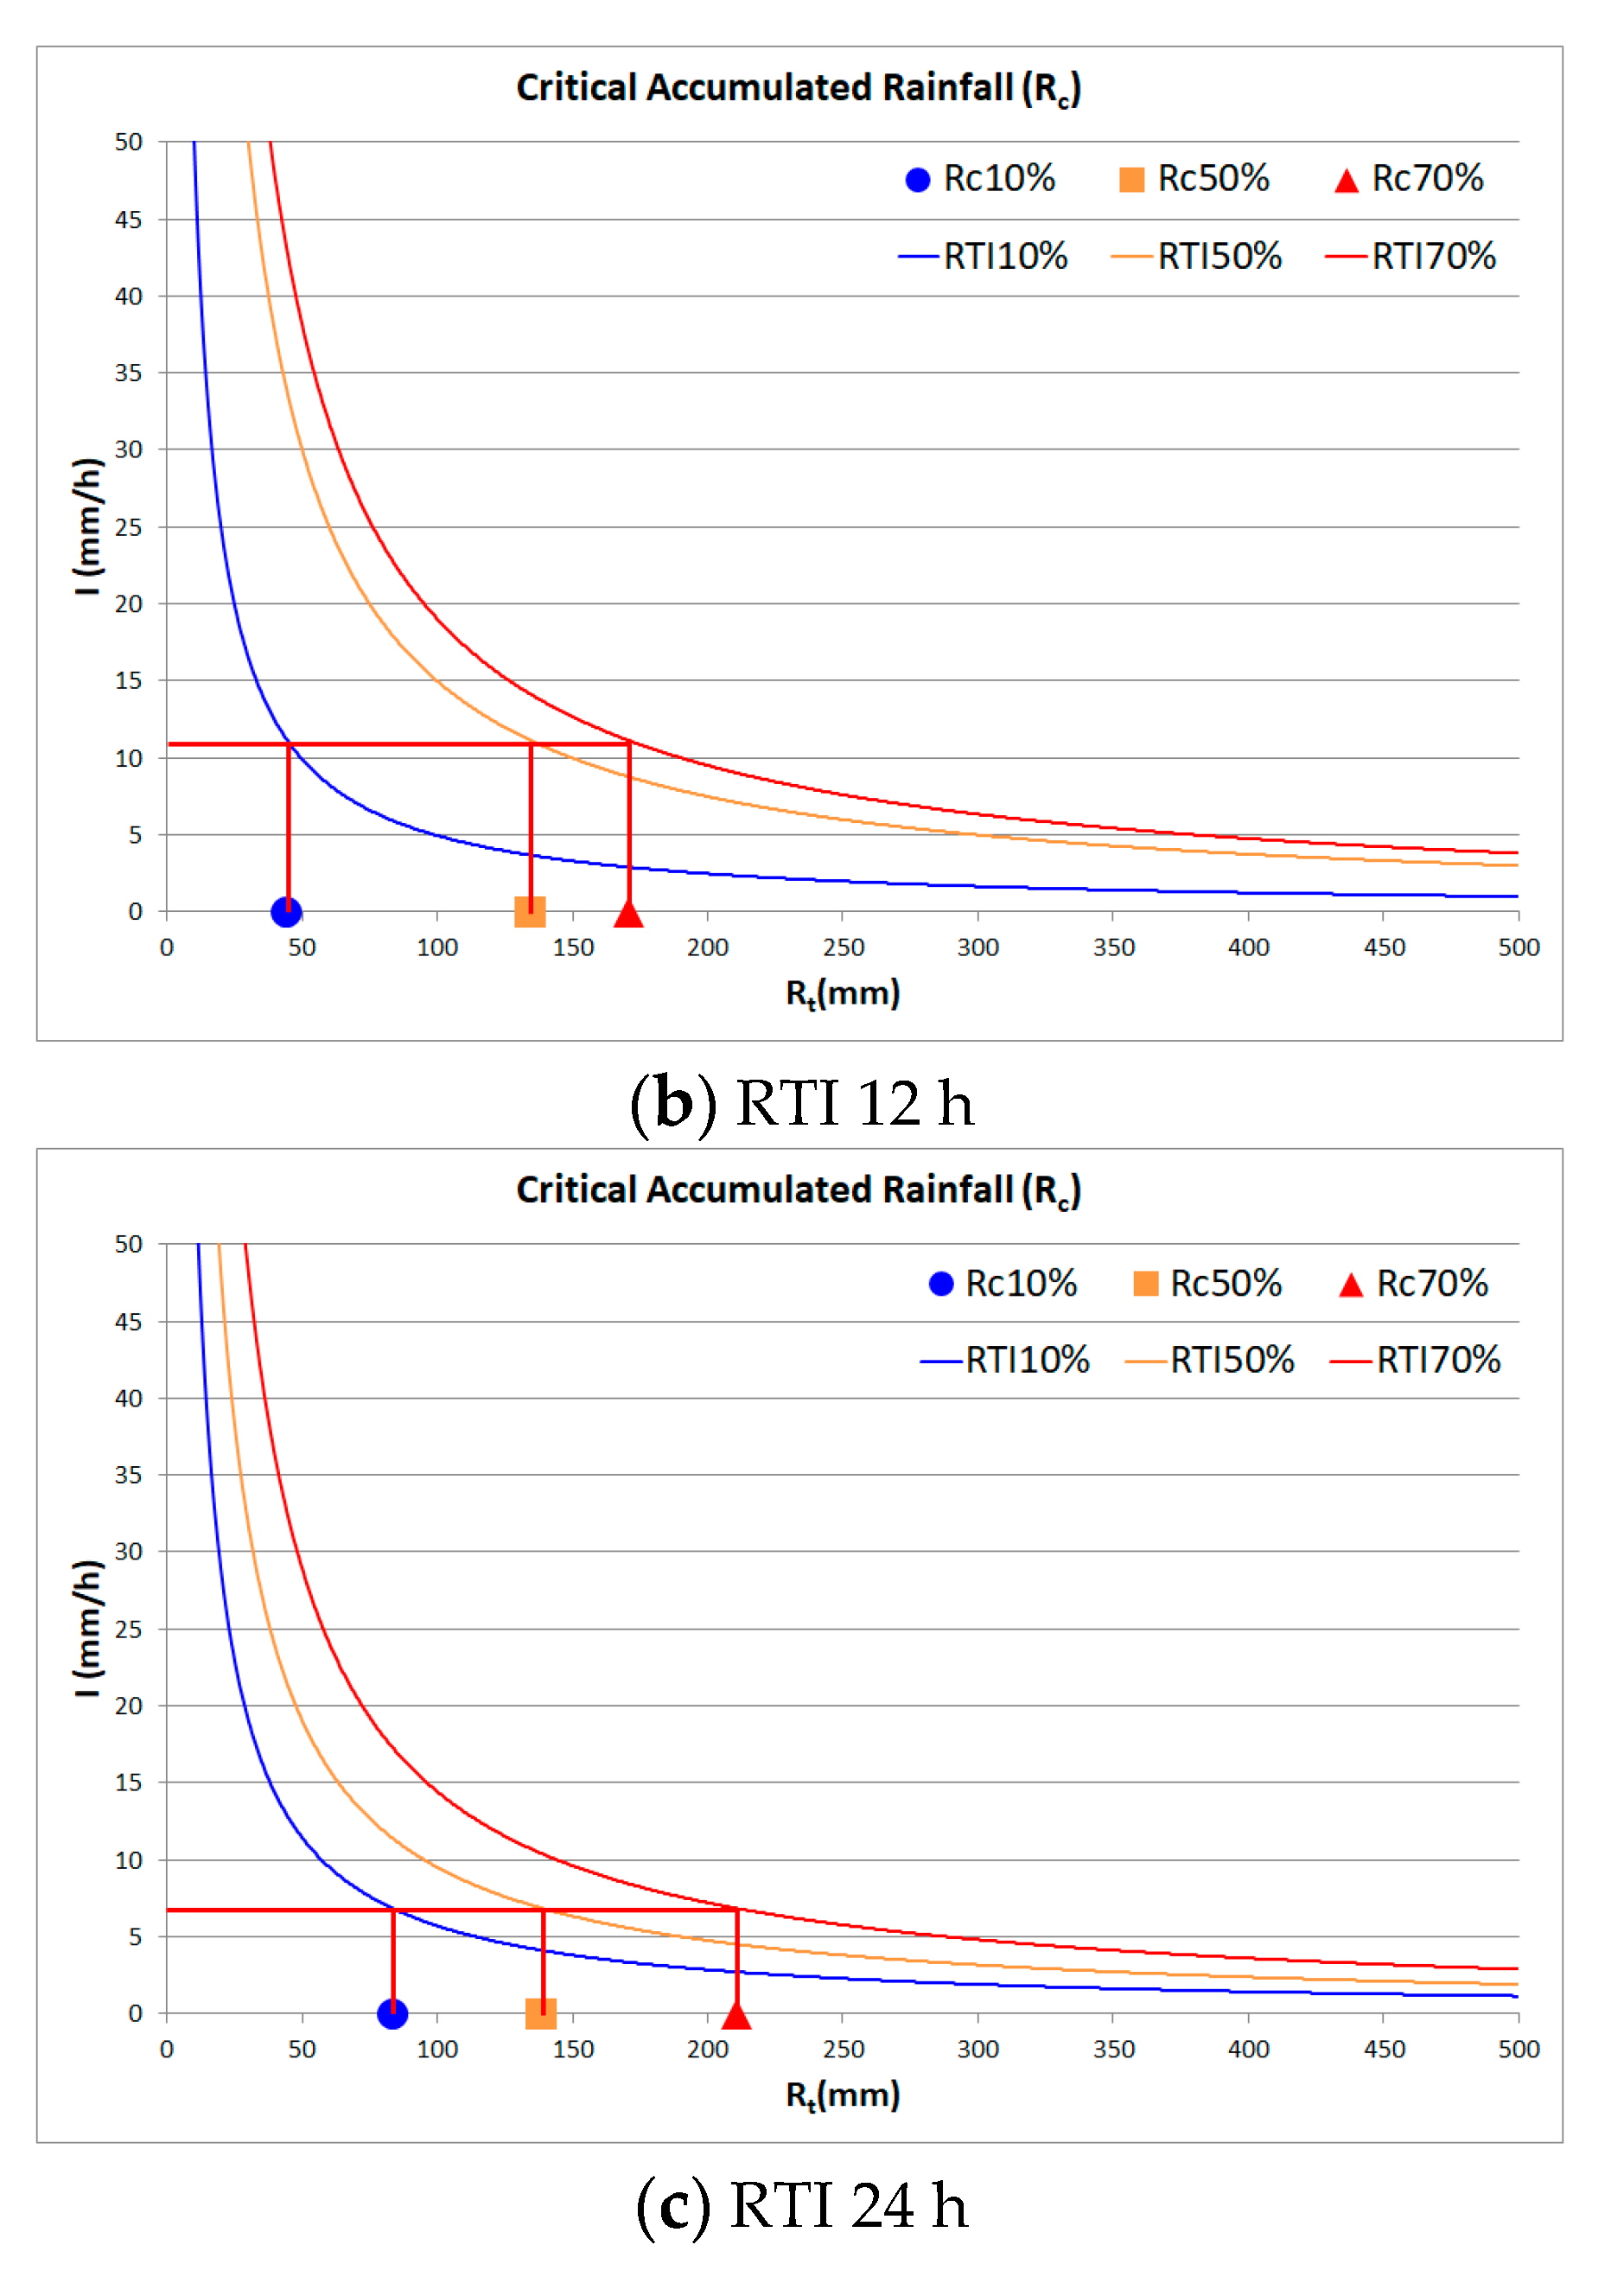
RTIs are not information obtained directly from rainfall. Moreover, most people find RTIs difficult to understand and use. Therefore, the study converted RTIs to to aid understanding. To estimate values, average rainfall intensity was used for each duration. that corresponds to the average rainfall intensity is shown in Table 5. Figure 12 shows RTIs for 10%, 50%, and 70% calculated from Figure 9, Figure 10 and Figure 11 and estimation graphs.
The study developed a nomogram for debris flow forecasting by rainfall duration, using the critical accumulated rainfall () for each occurrence possibility (10%, 50%, and 70%) and duration (6 h, 12 h, and 24 h). As shown in Figure 13, a nomogram is a graph of debris flow forecasting levels for the rainfall accumulated from the start to 24 h of the duration. For each duration, the debris flow forecasting levels (ALERT, WARNING, and EMERGENCY) are classified with different colors to aid the visual expression of each level by duration of accumulated rainfall.
4.3. Review on Applicability of Debris Flow Nomogram with Actual Cases
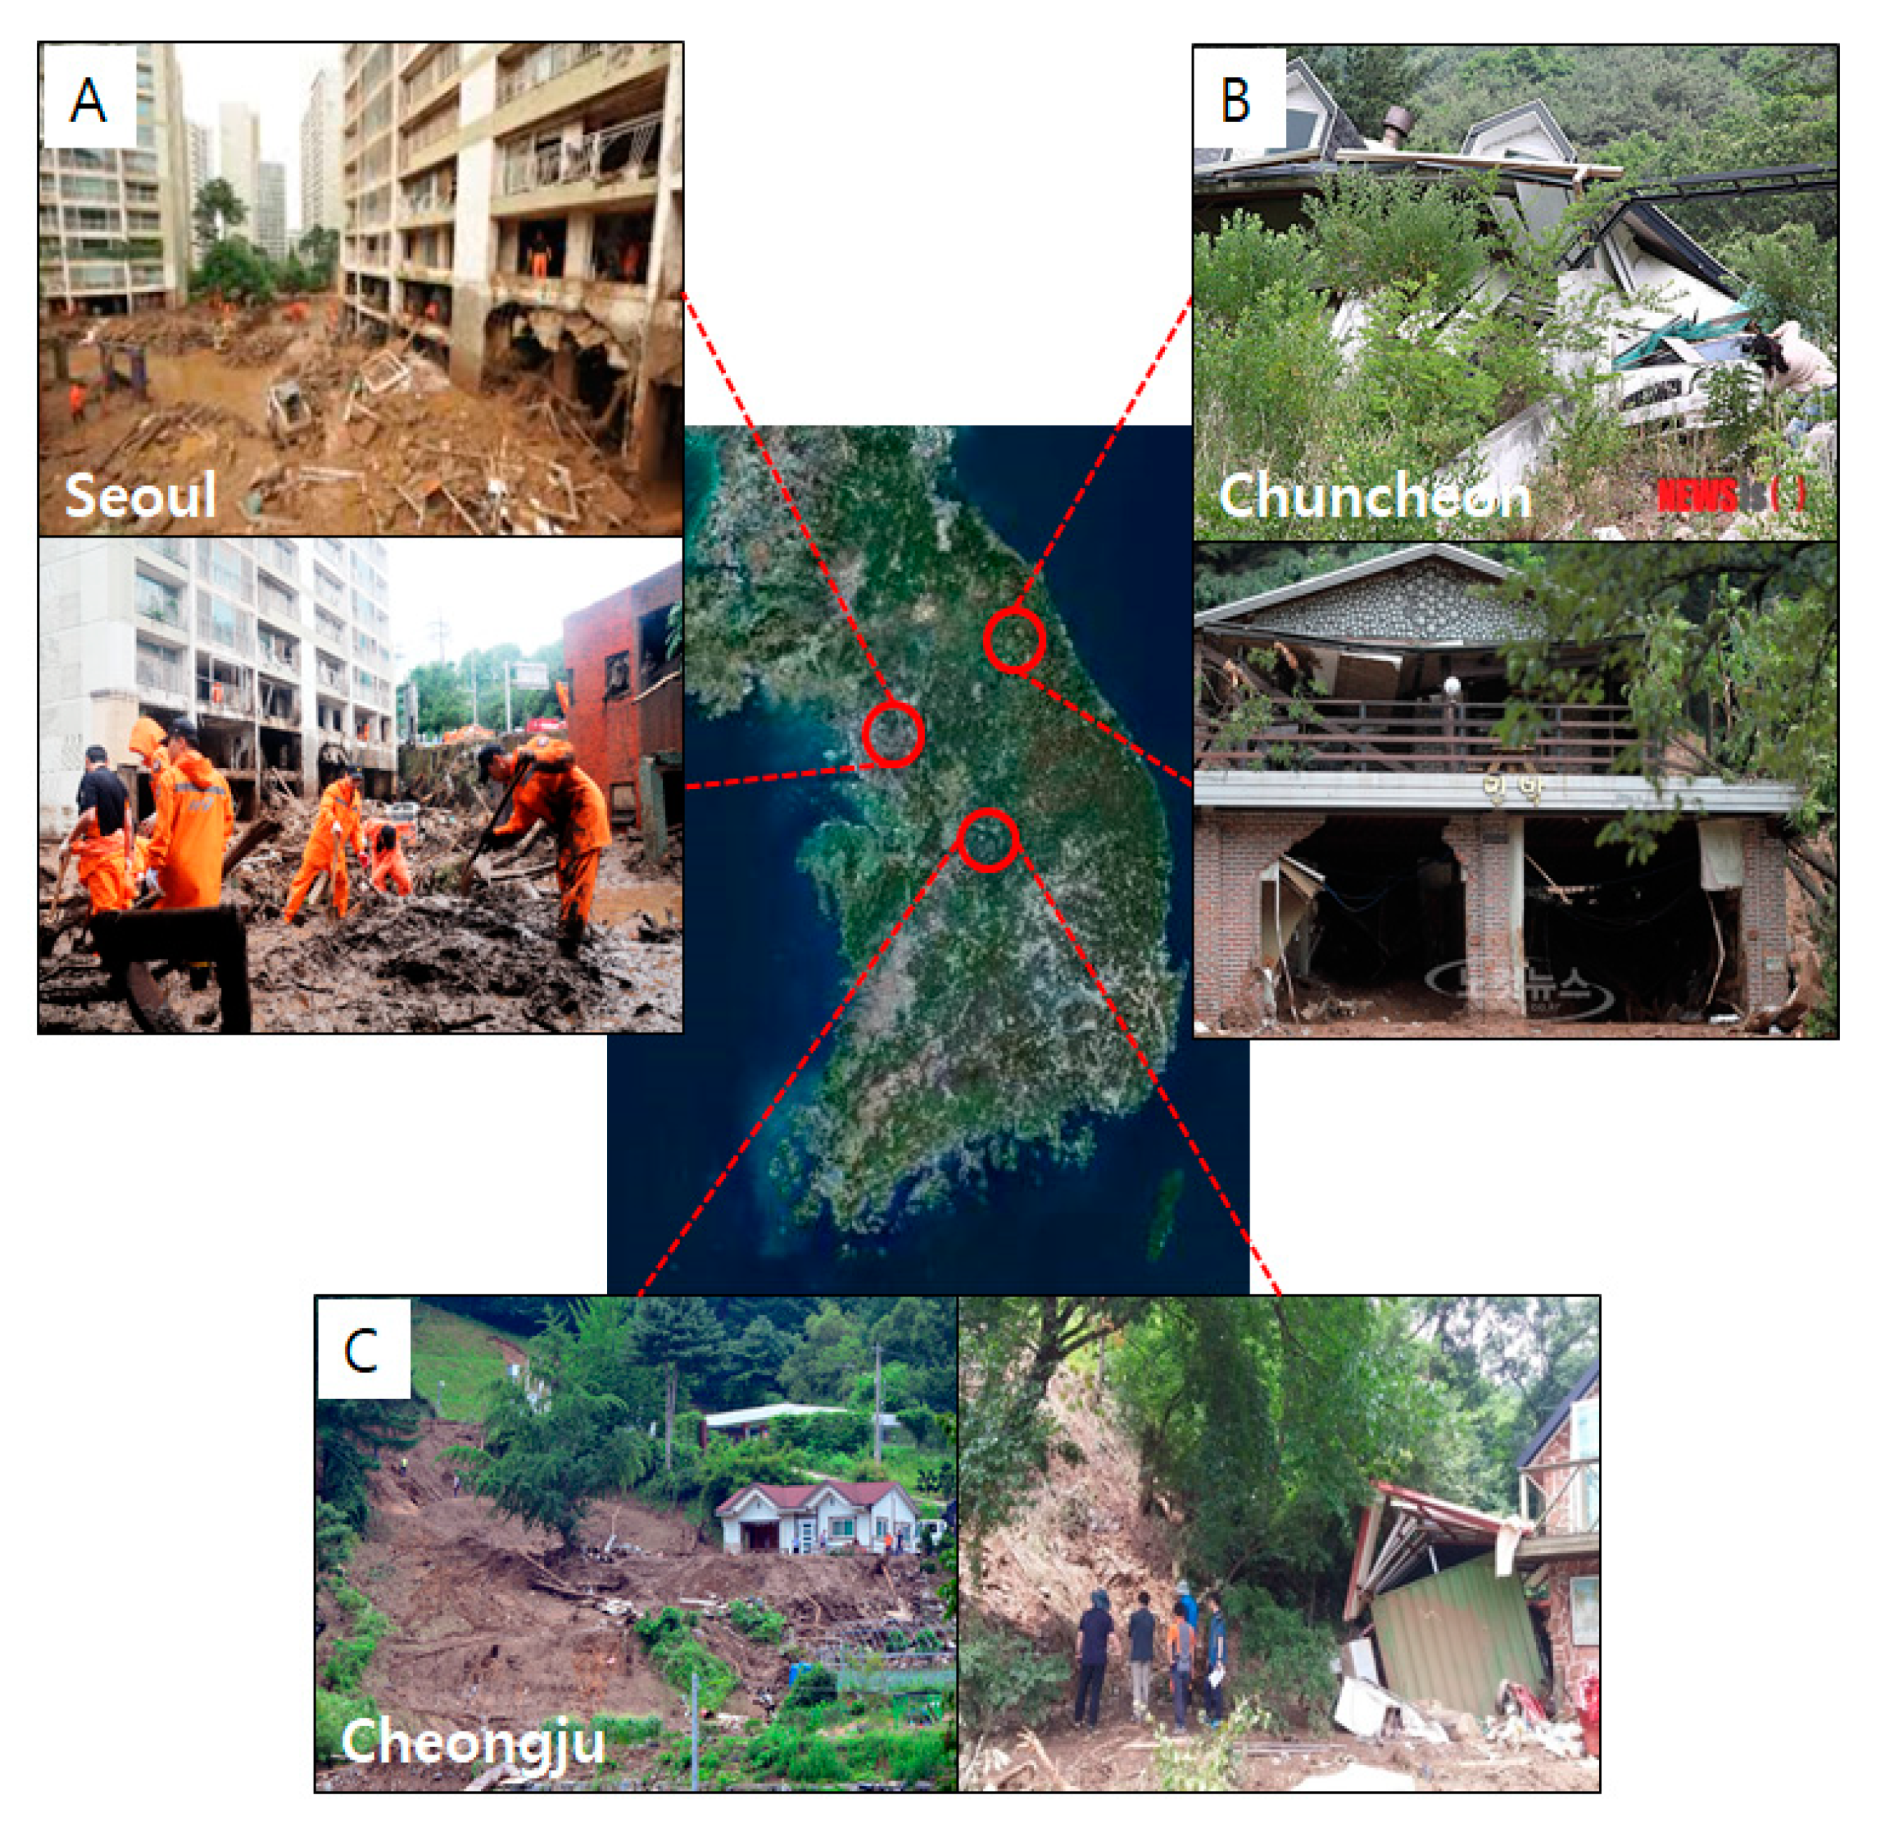
To review applicability of the debris flow nomogram that the study developed, it applied the nomogram to cases of damage caused in the past by debris flows. The representative cases include Umyeon Mountain of Seoul Seoul Metropolitan City, the capital of Korea in 2011, Chuncheon City of Gangwon Province in 2011, and Cheongju City of Chungcheongbuk Province in 2017. The study estimated the response time before the damage occurrence by forecasting debris flows with the actual rainfall data for the cases. The case of Umyeon Mountain where debris flows occurred at 10:00 in 27 July 2011, resulted in 18 deaths and the evacuation of 400 people. In 2011, Chuncheon City of Gangwon Province experienced debris flows that occurred at 24:00 and caused 13 deaths and 26 injuries. The case of Cheongju City of Chungcheongbuk Province occurred at 11:00 on 16 July 2017, causing two deaths. Figure 14 shows the photos of damaged areas taken at those times.
The results of debris flow forecasting with the nomogram the study developed are as follows.
4.3.1. Case 1: Umyeon Mountain, Seoul
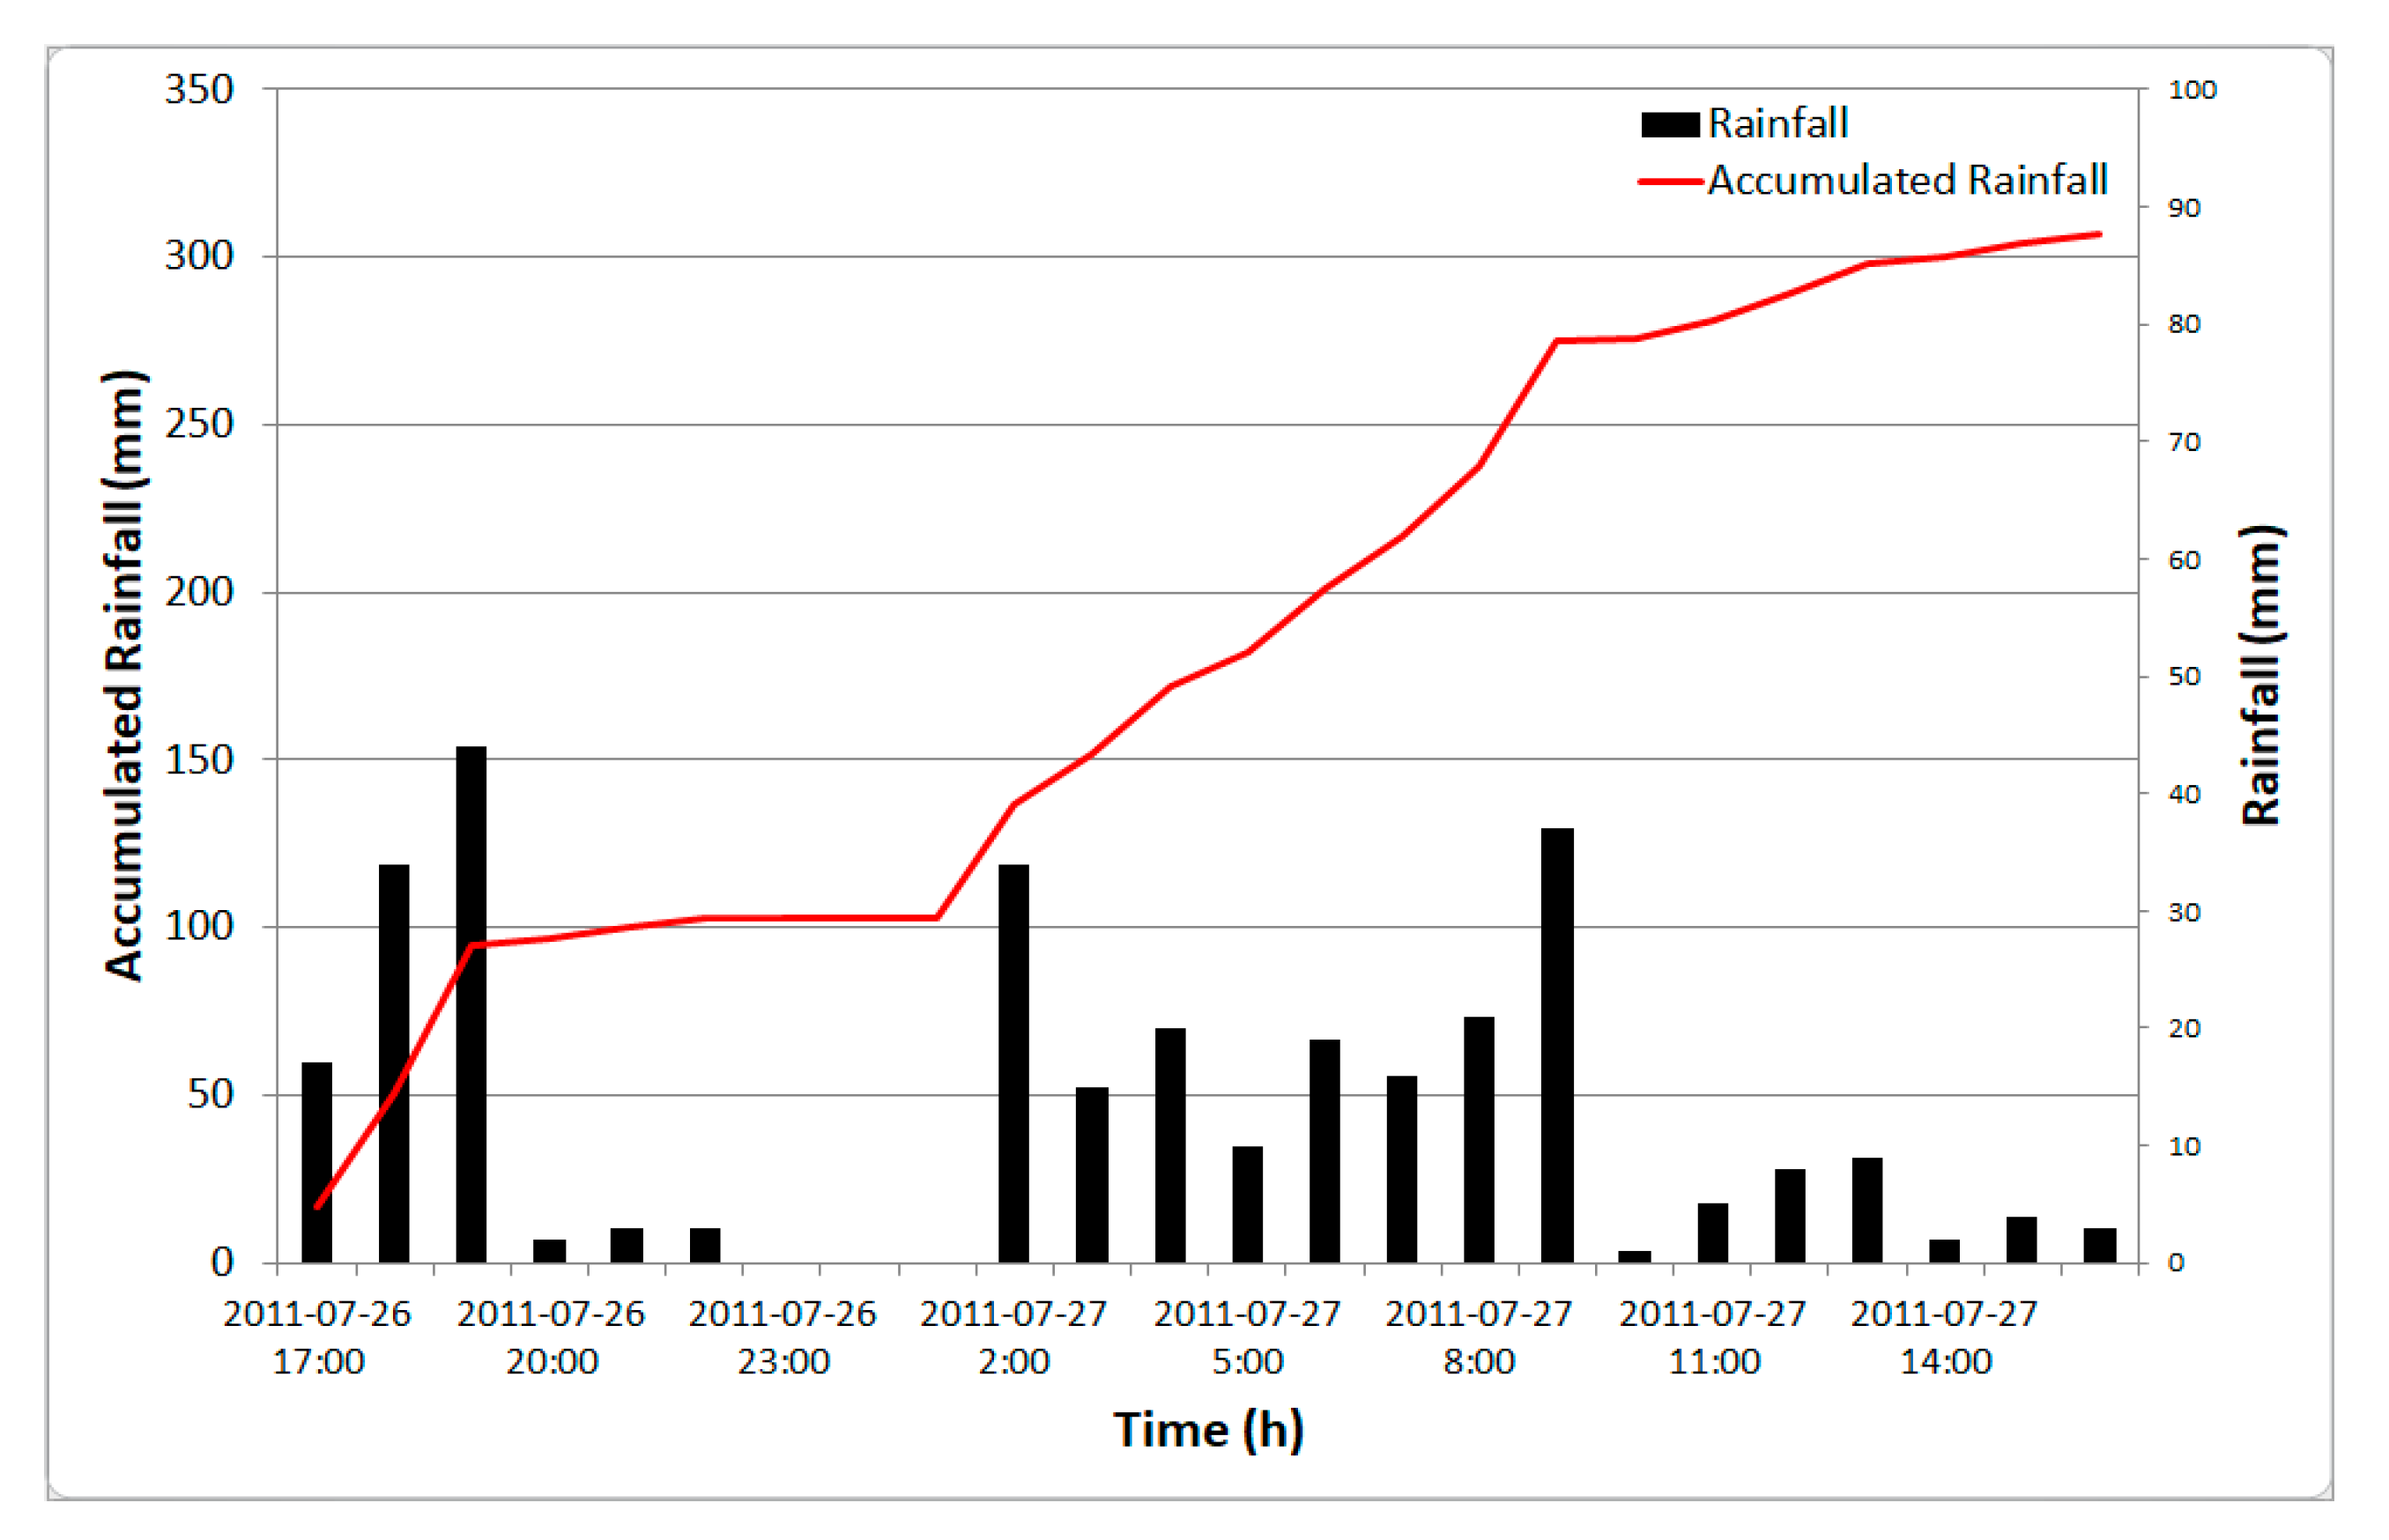
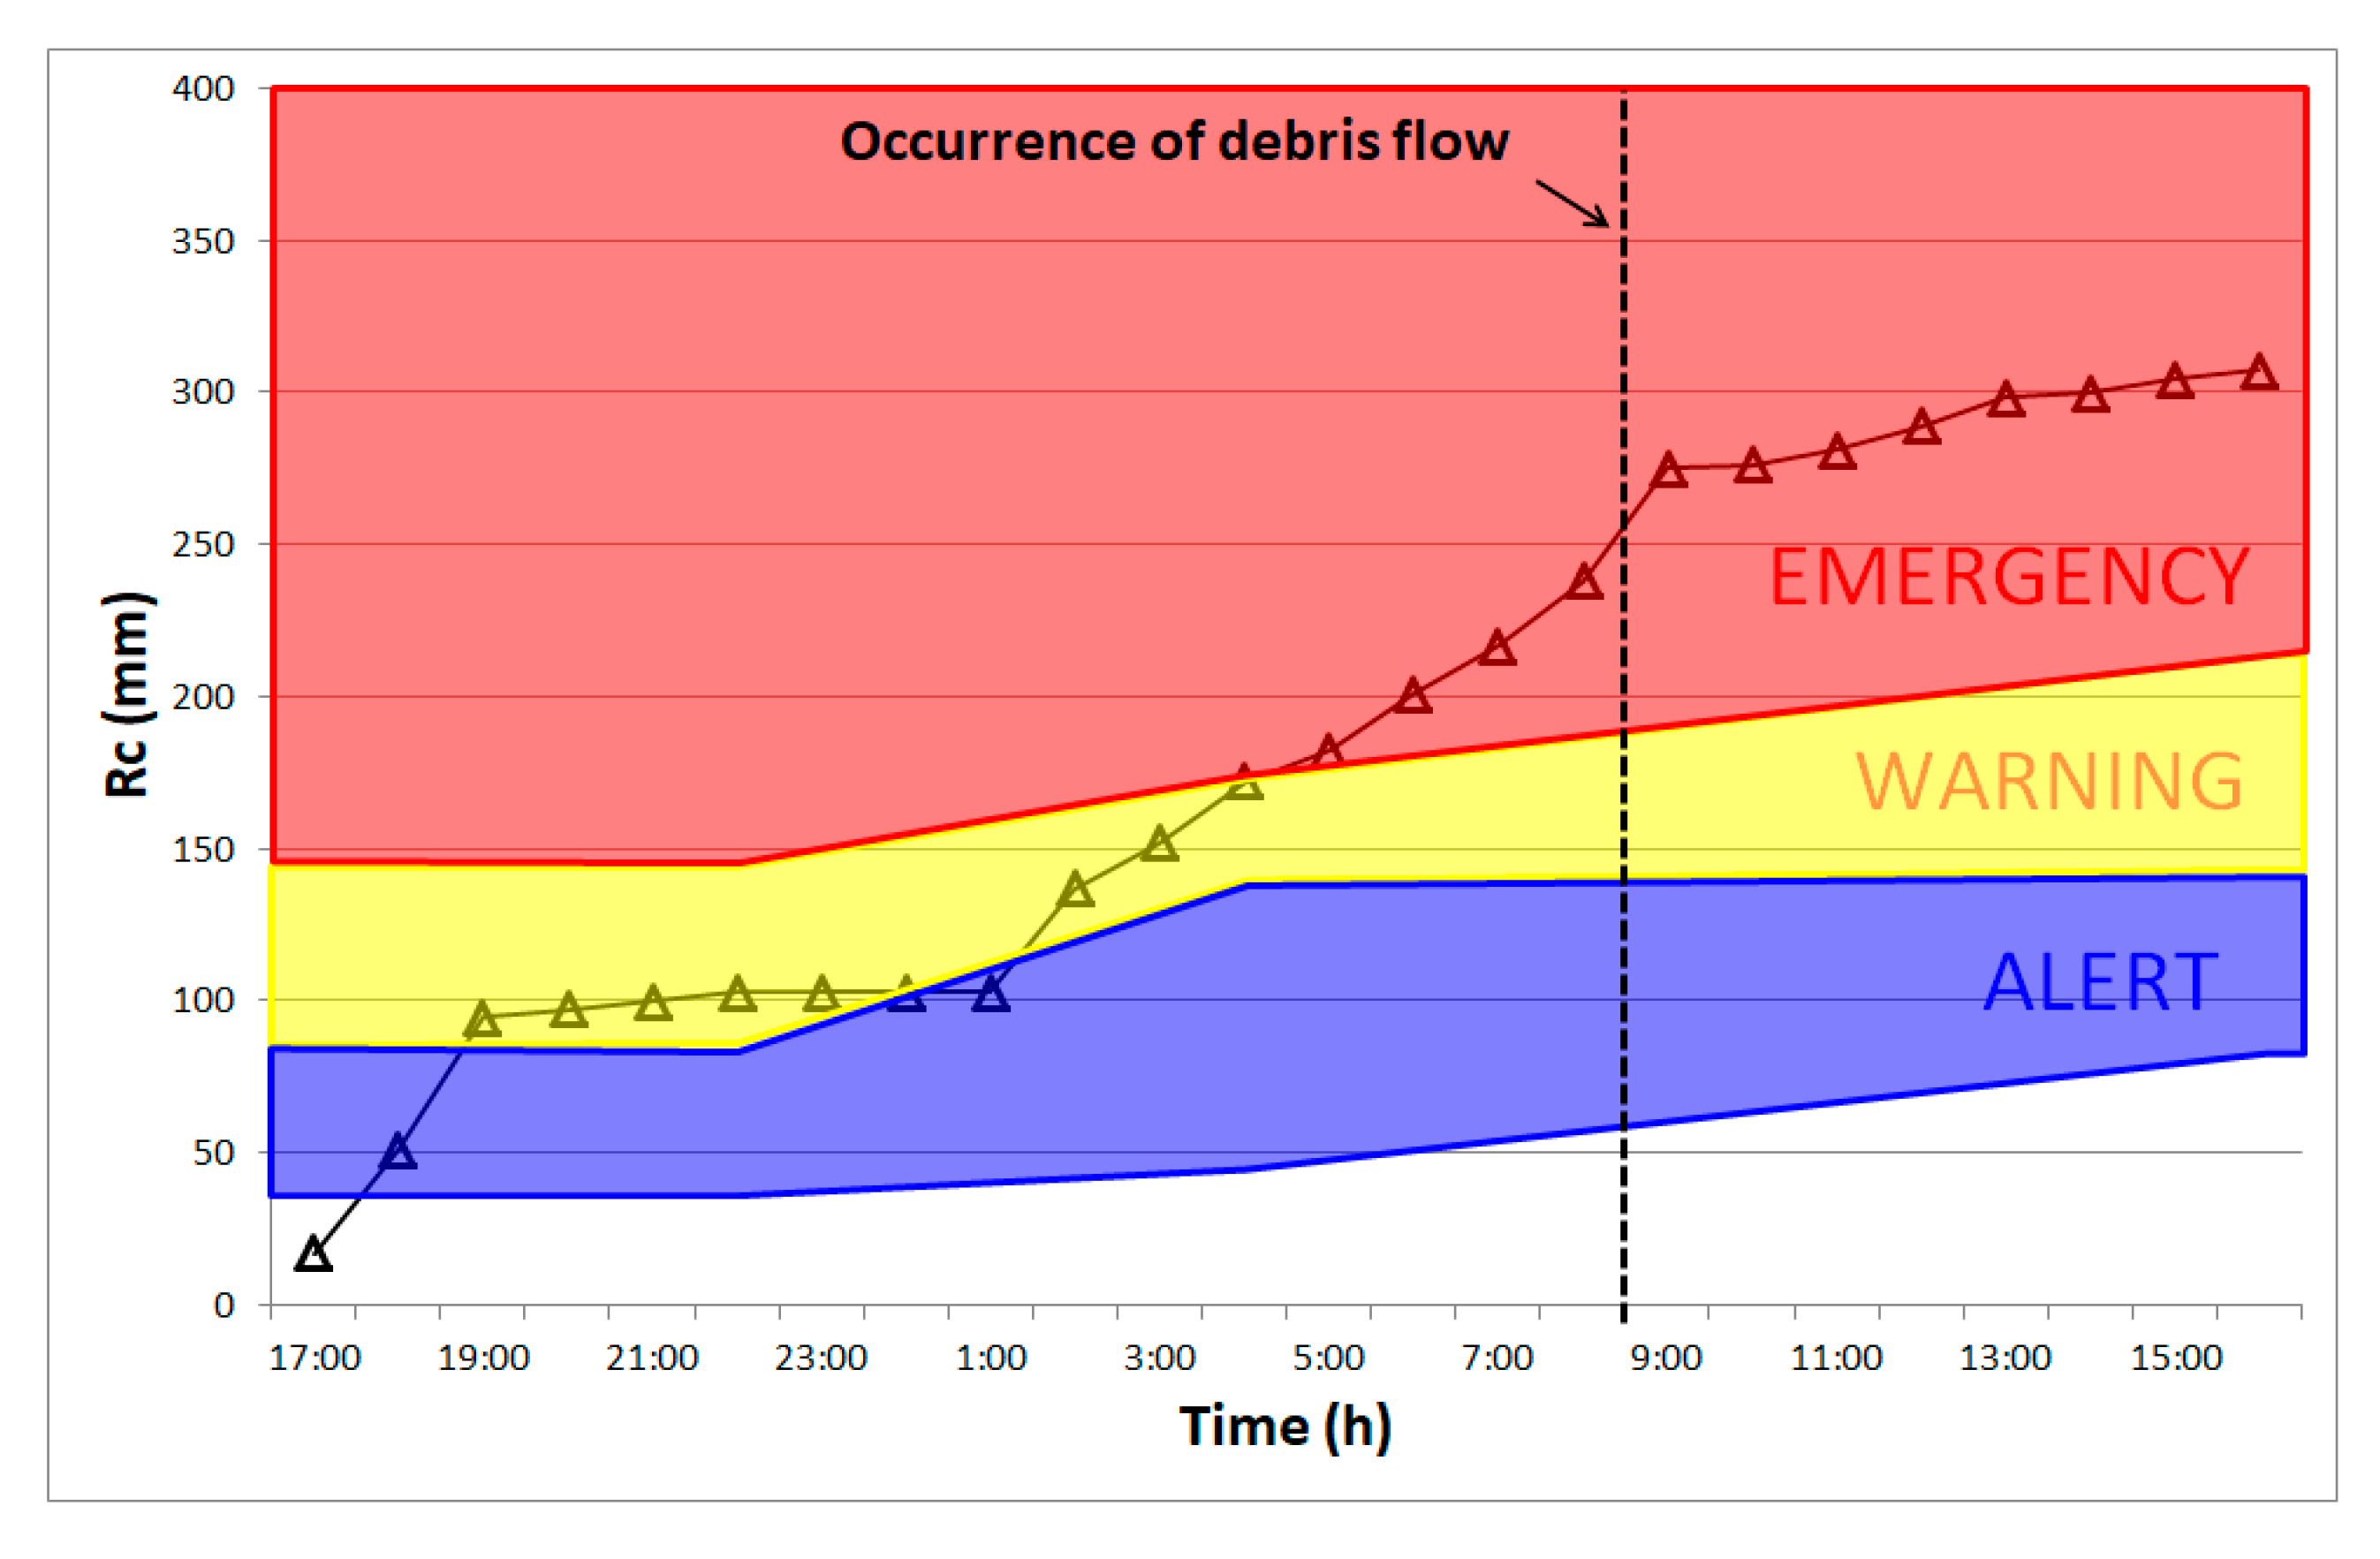
For the case of Umyeon Mountain of Seoul, the capital of Korea, it started raining at 17:00 on 26 July and recorded the maximum accumulated rainfall 307 mm (Figure 15) until 16:00 on 27 July with damage occurring at 9:00 on 27 July. The debris flow forecasting results were ALERT for 18:00 on 26 July, WARNING for 19:00 of the same day, and EMERGENCY for 5:00 on 27 July (Figure 16). Based on this, it can be assumed that damage occurs after the EMERGENCY level. Therefore, it is estimated that 4 h of response time is secured prior to damage occurrence. When forecasting is made additionally for the WARNING level, the response time that can be secured is estimated as 7 h.
Regarding the comparison analysis with the alerting standards of the Korea Forest Service and the Korea Meteorological Administration, the former provided the same level of risk; however, it produced the Alarm level for 18:00 of 26 July and 2:00 of 27 July, which are some hours before the damage occurrence, with its response time delayed for an hour. On the other hand, the latter provided the Alarm level for 19:00 of 26 July, which is some hours before the damage occurrence, and issued the alert for 24:00, which is 3 h passed the actual damage occurrence (Table 6).
4.3.2. Case 2: Chuncheon, Gangwon Province
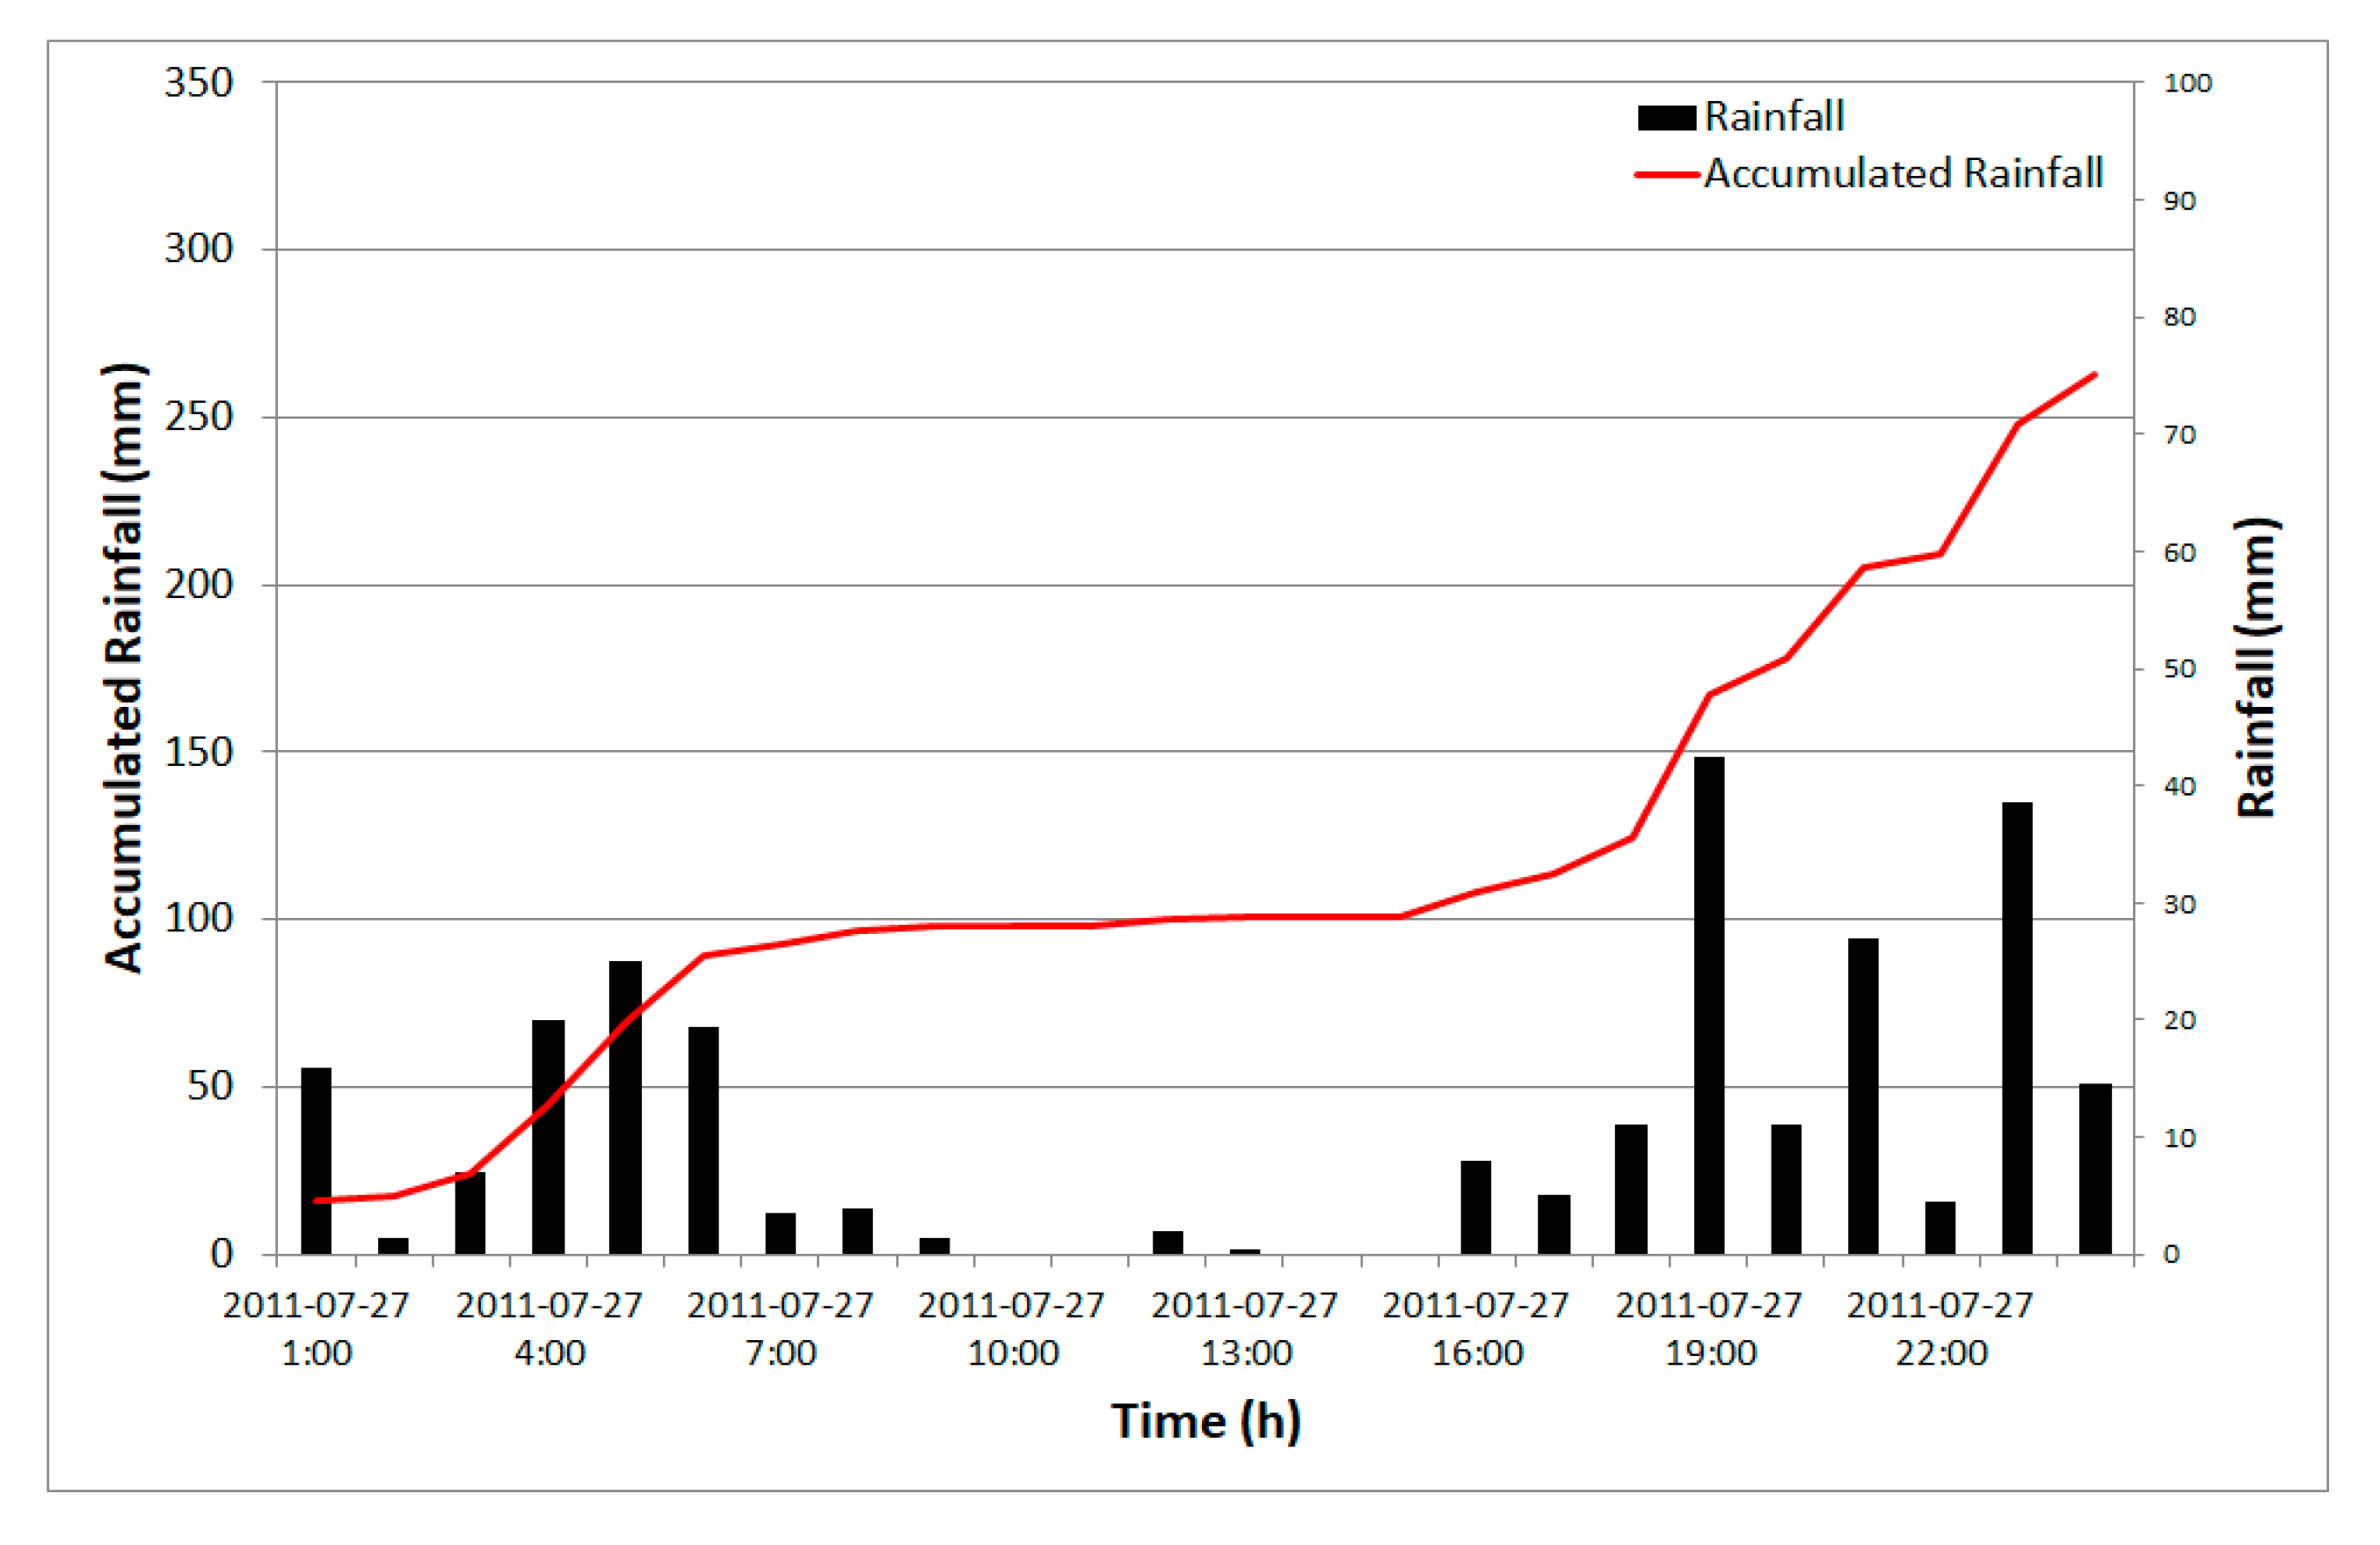
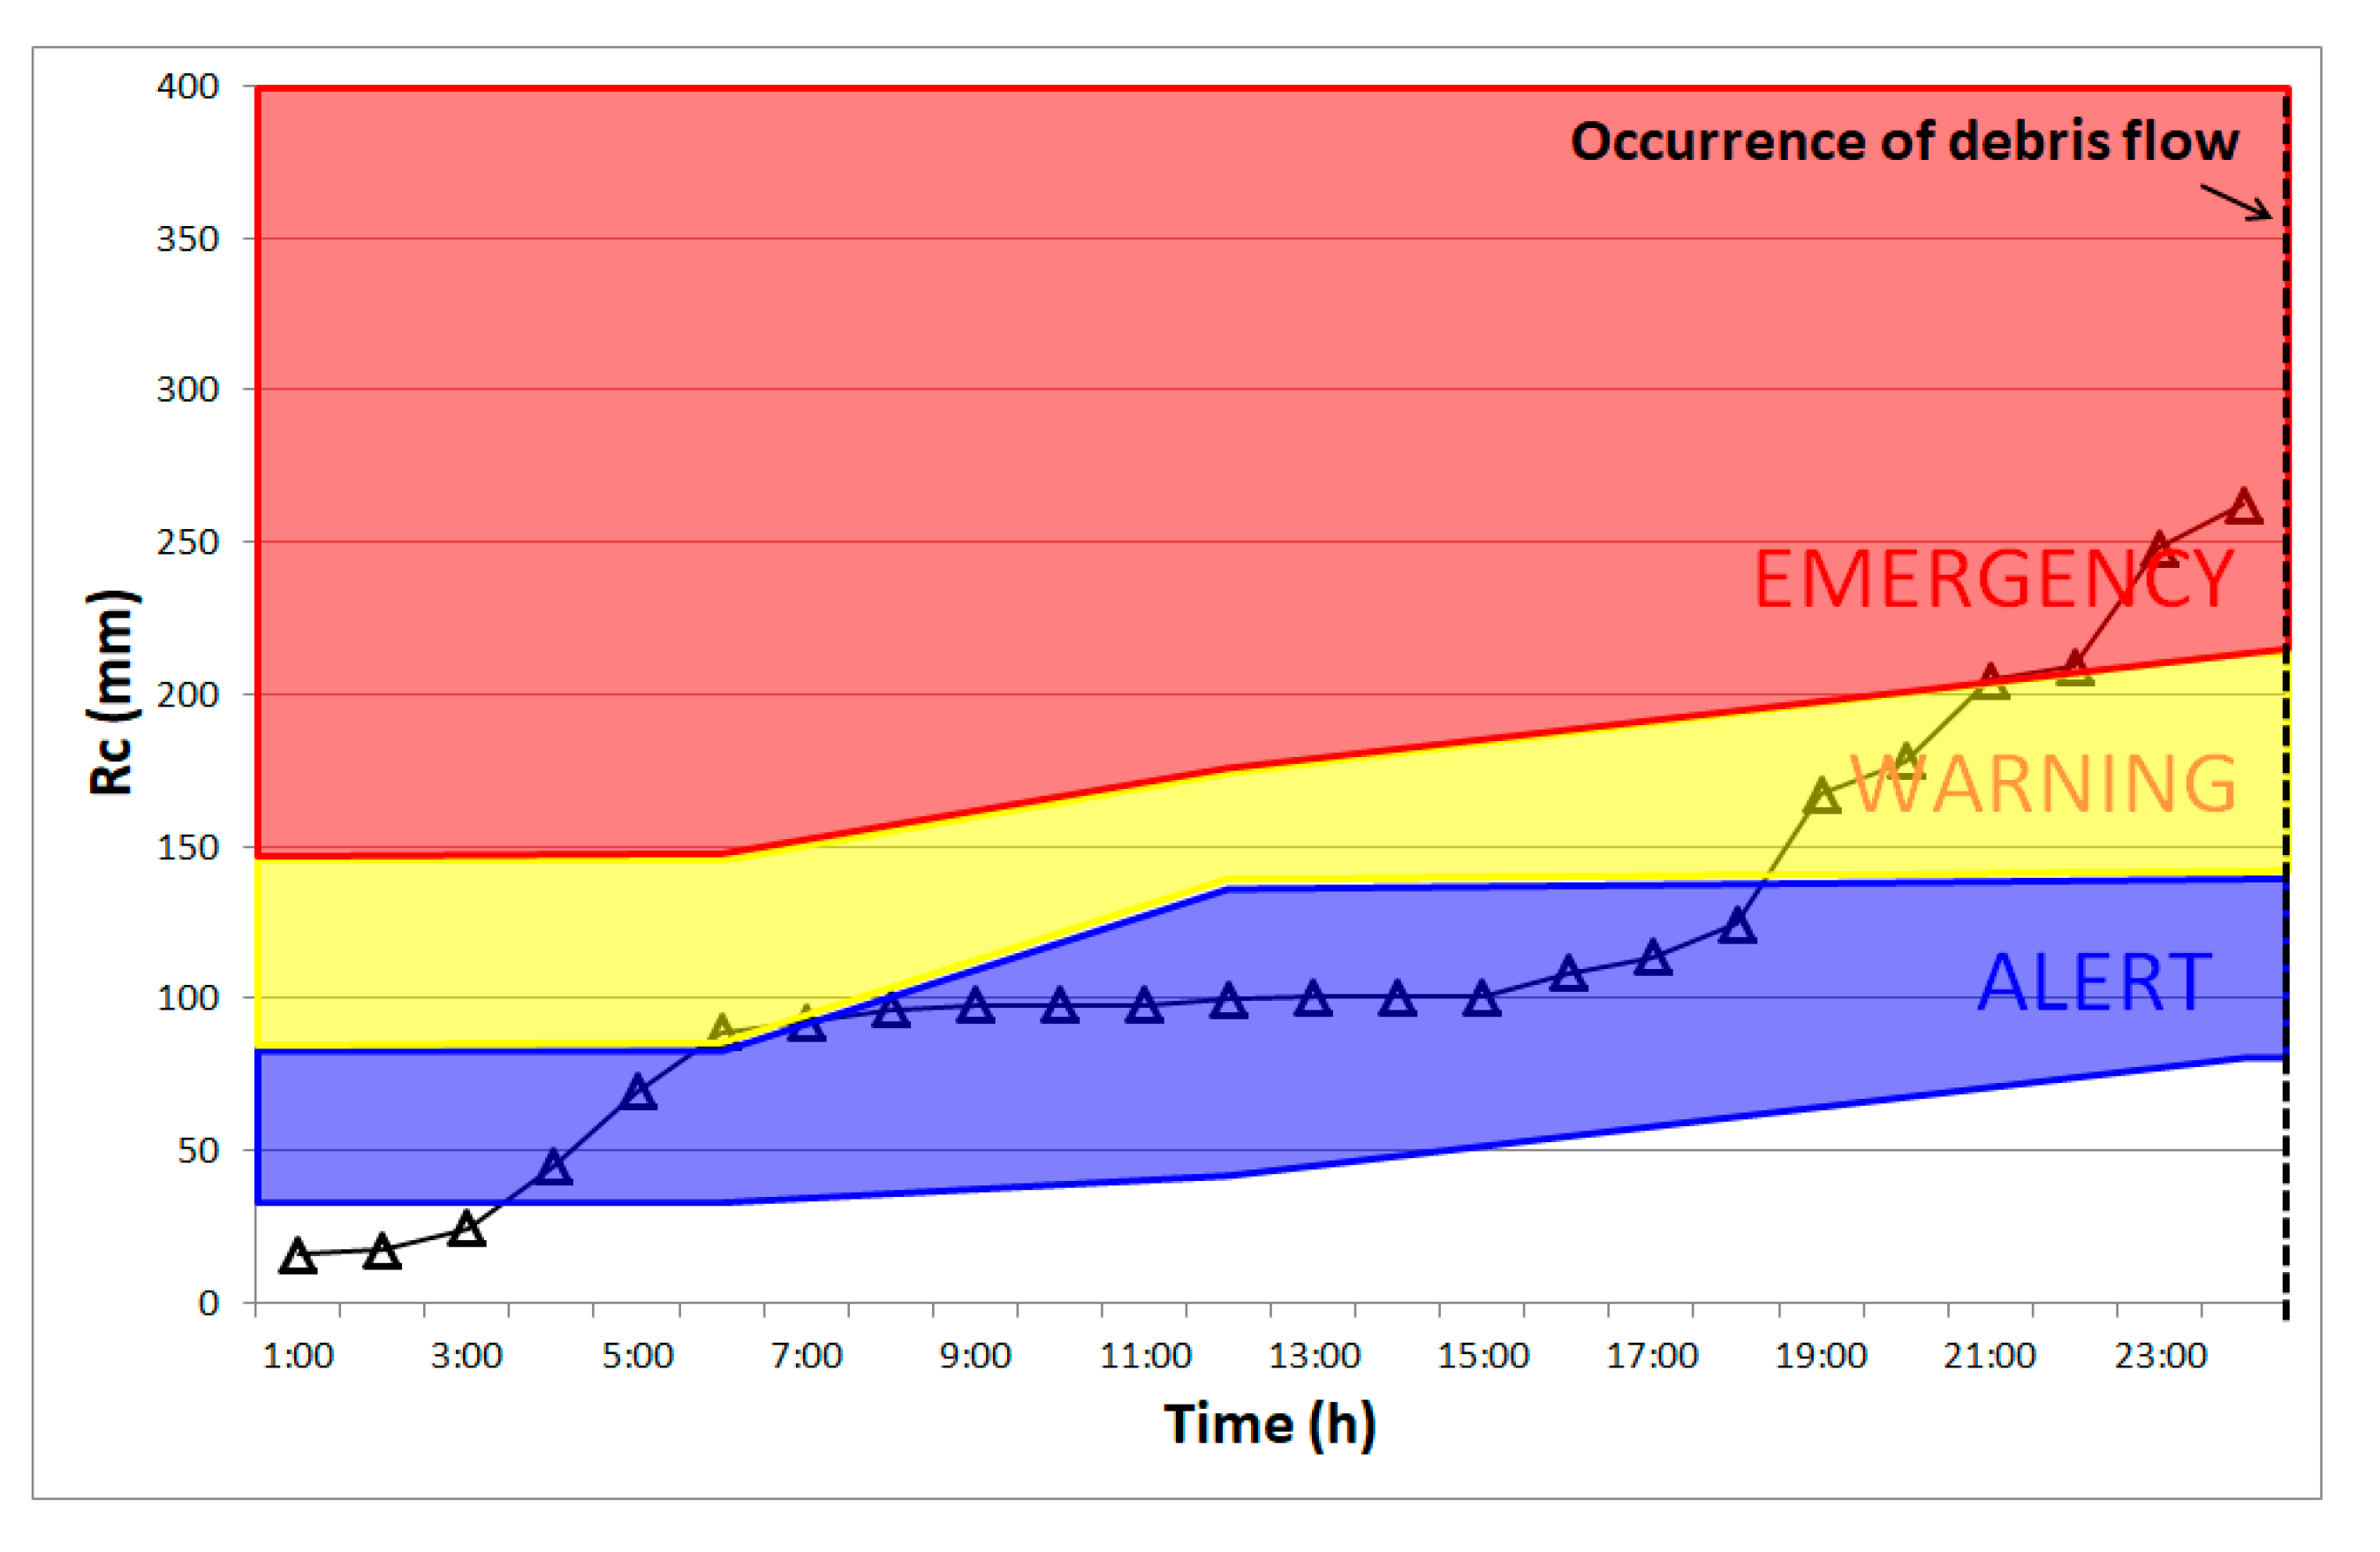
In the case of Chuncheon City, located in Gangwon Province, the rainfall started at 1:00 of 27 July, and the 230 mm of maximum accumulated rainfall was recorded until 24:00 of the same day (Figure 17). The damage occurred at 24:00 of 27 July, and forecasting for debris flows was made on 4:00 for ALERT, 19:00 for WARNING, and 21:00 for EMERGENCY (Figure 18). With the application of the EMERGENCY level, it was found that 4 h of response time was secured prior to the damage occurrence, and with the additional forecasting for the WARNING level, a total of 6 h of the time was secured. Regarding the comparison analysis with the alerting standards of the Korea Forest Service and the Korea Meteorological Administration, the former provided the same risk level; however, it produced the Alarm level for 19:00 of 27 July and for 21:00 of 27 July again before the actual damage occurrence. The standards of the latter issued Alarm from 1:00 of 27 July, which is some hours before the damage occurrence. This is a level lower, compared to the actual risk level of Warning at the time of damage occurrence (Table 7).
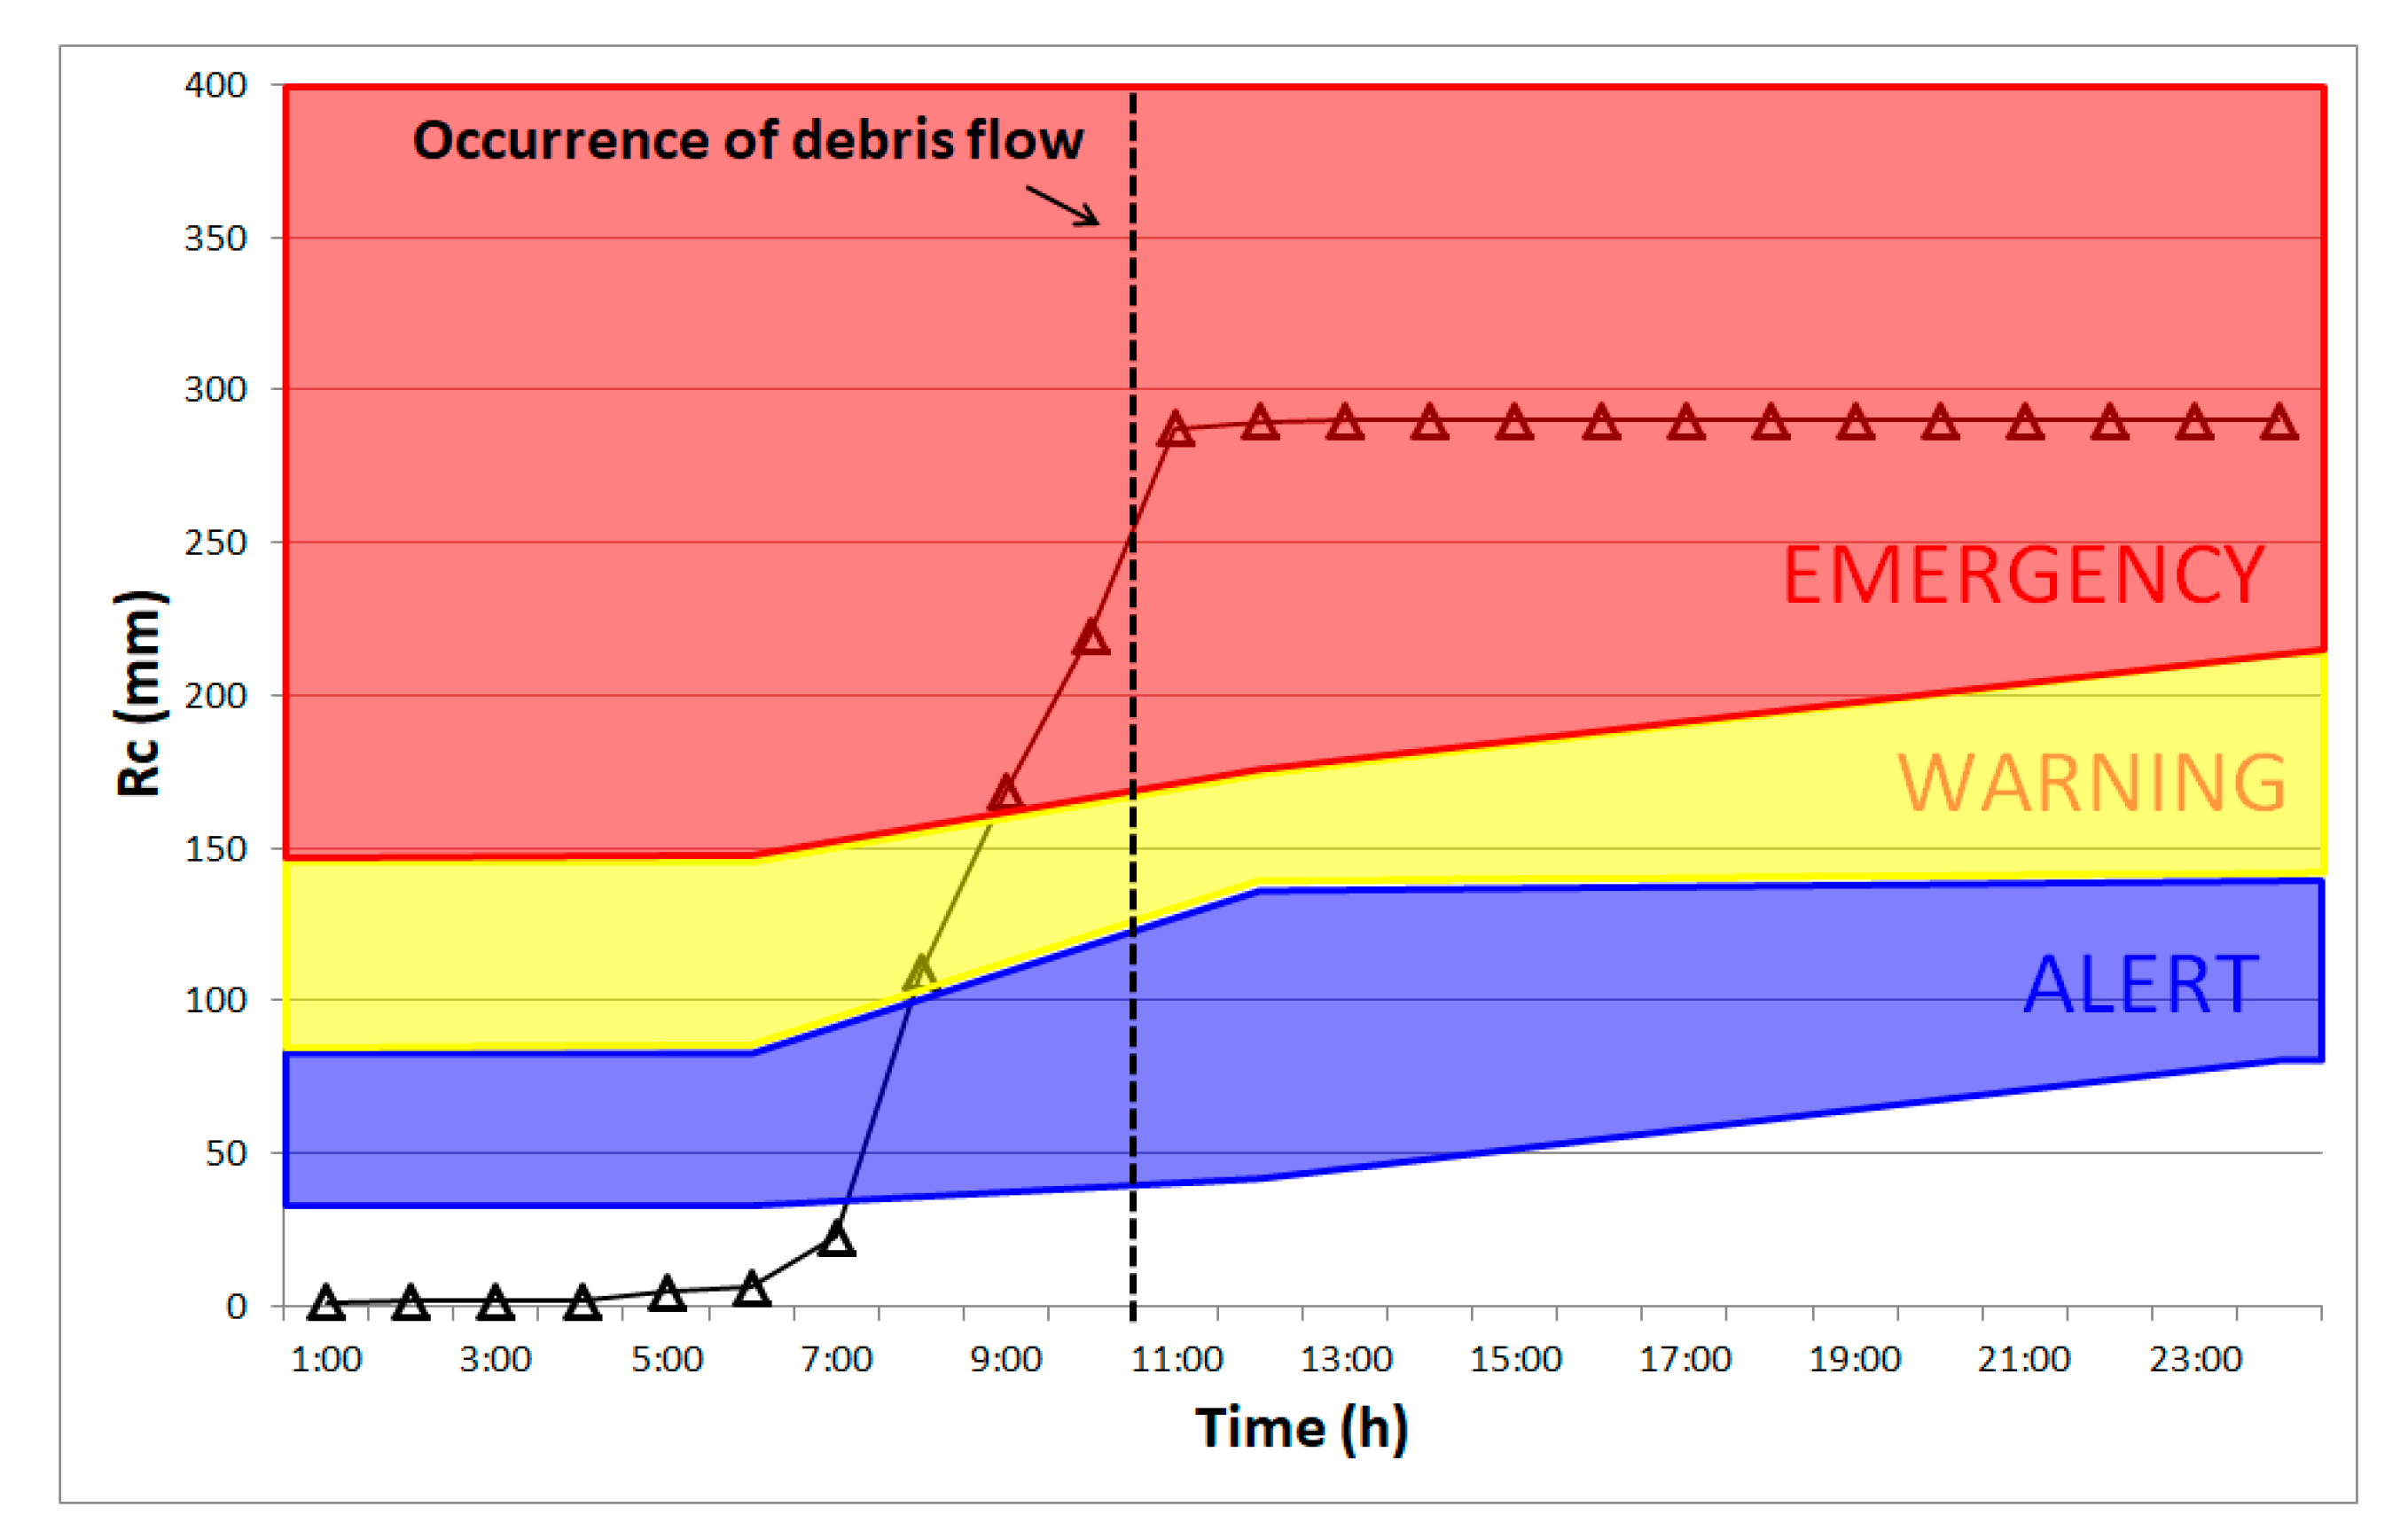
4.3.3. Case 3: Cheongju, Chungcheongbuk Province
In the case of Chuncheon City, located in Chungcheongbuk Province, the rainfall started at 1:00 of 16 July, and the 290 mm of maximum accumulated rainfall was recorded until 14:00 of the same day (Figure 19). The damage occurred at 11:00 of 16 July, and forecasting for debris flows was made at 8:00 for WARNING and 9:00 for EMERGENCY (Figure 20). With the application of the EMERGENCY level, it was found that 2 h of response time was secured prior to the damage occurrence, and with the additional forecasting for the WARNING level, a total of 3 h of the time was secured. Regarding the comparison analysis with the alerting standards of the Korea Forest Service and the Korea Meteorological Administration, similar tendency risk levels were shown for all three alerting standards (Table 8).
5. Conclusions
In this study, we collected rainfall data targeting the areas that experienced damage from debris flows from 2012 to 2013, and developed the debris flow nomogram that reflects both accumulated rainfall and rainfall intensity. It used the two elements observed shortly before the occurrence of debris flows to estimate RTIs and set the three levels according to the possibility of debris flow occurrence: 10 to 50% for ALERT, 50 to 70% for WARNING, and 70% or higher for EMERGENCY. In addition, to help the understanding of the residents in the areas where debris flows can occur, the study converted RTIs to actual accumulated rainfall values () for use in forecasting. In this study, the debris flow nomogram was developed for each duration (6 h, 12 h, and 24 h) and applied to actual cases of debris flow damage for Umyeon Mountain of Seoul, Inje County of Gangwon Province, and Cheongju City of Chungcheongbuk Province.
As a result, the use of the nomogram for debris flow forecasting that the study developed could secure sufficient response time for the cases of Umyeon Mountain of Seoul and Chuncheon of Gangwon Province, where rainfall continues for long durations, and the case of Cheongju of Chungcheongbuk Province where heavy rain is localized. Results for each case are summarized as follows.
Case 1: In the case of Umyeon Mountain of Seoul, 280 mm of the rain that continued for 17 h caused the occurrence of debris flows. The results of using the nomogram in forecasting debris flows for the EMERGENCY level showed that it could secure 4 h of the response time. When the forecasting was made additionally for the WARNING level, a total of 7 h of the response time could be secured to ensure reactive actions.
Case 2: In the case of Chuncheon of Gangwon Province, 260 mm of the rain for about 24 h caused the occurrence of debris flows. The results of using the nomogram in forecasting debris flows showed that it could secure 4 h of the response time. In addition to the forecasting for the WARNING level, a total of 6 h of the response time could be secured.
Case 3: In the case of Cheongju of Chungcheongbuk Province, 290 mm of the rain for about 11 h caused the occurrence of debris flows. The results of using the nomogram in forecasting debris flows showed that it could secure 2 h of the response time. With addition to the forecasting for the WARNING level, a total of 3 h of the response time could be secured.
The results above suggest that the debris flow forecasting nomogram provided by the study is applicable for the actual forecasting on debris flow damages that can be caused by the long-term increase in rainfall and short-term, localized heavy rain. Meanwhile, in the cases of Seoul and Chuncheon, the forecasting standards of the Korean Meteorological Administration and the Korean Forest Service led to the indiscriminate issuance of alerts at the starting point of rainfall. However, the forecasting with the nomogram of the study is expected to support the understanding of rainfall value by general users with a visual representation of the risk level, and allow a proper forecasting or response system to the situation.
Due to the diverse causes of debris flows, rainfall-related factors are not enough in determining debris flow occurrence. Therefore, it is crucial to provide the standards that general people can use to make decisions even without expert knowledge. As rainfall is considered the most common factor that causes debris flows, it is expected that the forecasting on debris flows using the nomogram can support the easier interpretation of general users for debris flows. In addition, the forecasting that uses the nomogram the study developed and radar rainfall information can prevent debris flow damage in real time.
Author Contributions
D.-H.N. and S.-H.L. carried out the survey of previous study and wrote the graph of the data. B.-S.K. suggested idea of study and contributed to the writing of the paper. In addition, we contributed to conducting a reanalysis of the research data responding to the reviewers’ results and providing a clear research result with a solid academic basis that coincides with the research purposes.
Funding
This research was supported by a grant(2017-MOIS31-004) from Fundamental Technology Development Program for Extreme Disaster Response funded by Korean Ministry of Interior and Safety (MOIS). This research was supported by a grant (MOIS-DP-2015-05) of Disaster Prediction and Mitigation Technology Development Program funded by Ministry of Interior and Safety (MOIS, Korea). This study was supported by 2016 research grant from kangwon national university (number-620160136) Also, This paperwork (or document) was financially supported by Ministry of the Interior and Safety as “Human resource development Project in Disaster management”.
Conflicts of Interest
The authors declare no conflict of interest.
References
- Korea Meteorological Administration. Korean Peninsula Climate; Korea Meteorological Administration: Seoul, Korea, 2016; pp. 1–3. (In Korean)
- Korea Forest Service. Landslide Forecast Criterial; Korea Forest Service: Seoul, Korea, 2019. Available online: http://sansatai.forest.go.kr (accessed on 7 August 2019).
- Nam, D.H.; Lee, S.H.; Jun, K.W.; Kim, B.S. A study on the debris flow movement and the run-out calculation using the coupling of flood runoff model and debris flow model (in Korean with English abstract). Crisisonomy 2016, 12, 131–143. [Google Scholar] [CrossRef]
- Gangwon Development Research Institute. Characteristics and Protective Measures against Natural Hazards in the Mountain Areas of Gangwon Province; Research Report; GDRI: Gangwon, Korea, 2008; pp. 1–77. (In Korean) [Google Scholar]
- Yune, C.; Jun, K.-J.; Kim, K.-S.; Kim, G.-H.; Lee, S.-W. Analysis of slope hazard-triggering rainfall characteristics in Gangwon Province by database construction (in Korean with English abstract). J. Korean Geotech. Soc. 2010, 26, 27–38. [Google Scholar]
- Hwang, H.; Lee, S.W.; Kim, G.; Choi, B.; Yune, C.-Y. Analysis of slope hazard-triggering rainfall and geological characteristics in 2011 and 2012 (in Korean with English abstract). J. Korean Soc. Hazard Mitig. 2013, 13, 179–190. [Google Scholar] [CrossRef]
- Oh, J.; Park, H.J. Establishment of landslide rainfall threshold for risk assessment in Gangwon area (in Korean with English abstract). J. Korean Soc. Hazard Mitig. 2013, 13, 43–52. [Google Scholar] [CrossRef]
- Kang, W.S.; Ma, H.S.; Kang, E.M. Landslide Early Warning Standard Using Rainfall Information. Available online: https://scholar.google.com.tw/scholar?hl=en&as_sdt=0%2C5&q=Landslide+early+warning+standard+using+rainfall+information&btnG= (accessed on 7 August 2019).
- Ham, D.H.; Hwang, S.H. Review of landslide forecast standard suitability by analysing landslide-inducing rainfall (in Korean with English abstract). J. Korean Soc. Hazard Mitig. 2014, 14, 299–310. [Google Scholar] [CrossRef]
- Jeong, J.W. Development on Early Warning Criteria for Debris-Flow Using Realtime Rainfall Monitoring (in Korean with English abstract). Master’s Thesis, Seokyeong University, Seoul, South Korea, 2015. [Google Scholar]
- Chang, T.C.; Chao, R.J. Application of back-propagation networks in debris flow prediction. Eng. Geol. 2006, 85, 270–280. (In English) [Google Scholar] [CrossRef]
- Arattano, M.; Marchi, L. Systems and sensors for debris-flow monitoring and warning. Sensors (Basel) 2008, 8, 2436–2452. (In English) [Google Scholar] [CrossRef] [PubMed]
- Jakob, M.; Owen, T.; Simpson, T. A regional real-time debris-flow warning system for the district of north Vancouver Canada. Landslides 2012, 9, 165–178. (In English) [Google Scholar] [CrossRef]
- Wu, Y.-H.; Liu, K.-F.; Chen, Y.-C. Comparison between FLO-2D and debris-2D on the application of assessment of granular debris flow hazards with case study. J. Mt. Sci. 2012, 10, 293–304. (In English) [Google Scholar] [CrossRef]
- Gomes, R.A.T.; Guimaraes, R.F.; de Carvalho, O.A.; Fernandes, N.F.; do Amaral, E.V. Combining spatial models for shallow landslides and debris-flows prediction. Remote Sens. 2013, 5, 2219–2237. (In English) [Google Scholar] [CrossRef]
- Borga, M.; Stoffel, M.; Marchi, L.; Marra, F.; Jakob, M. Hydrogeomorphic response to extreme rainfall in headwater systems: Flash floods and debris flows. J. Hydrol. 2014, 518, 194–205. (In English) [Google Scholar] [CrossRef]
- Pan, H.-L.; Jiang, Y.-J.; Wang, J.; Ou, G.-Q. Rainfall threshold calculation for debris flow early warning in areas with scarcity of data. Nat. Hazards Earth Syst. 2018, 18, 1395–1409. (In English) [Google Scholar] [CrossRef] [Green Version]
- Ahmed, B.; Rahman, M.S.; Islam, R.; Sammonds, P.; Zhou, C.; Uddin, K.; Al-Hussaini, T.M. Developing a dynamic Web-GIS based landslide early warning system for the Chittagong Metropolitan Area, Bangladesh. ISPRS Int. Geo Inf. 2018, 7, 485. (In English) [Google Scholar] [CrossRef]
- Segoni, S.; Rosi, A.; Fanti, R.; Gallucci, A.; Monni, A.; Casagli, N. A regional-scale landslide warning system based on 20 years of operational experience. Water 2018, 10, 1297. (In English) [Google Scholar] [CrossRef]
- Palumbo, A.; Mazzarella, A. Rainfall Statistical Properties in Naples. Am. Meteorol. Soc. 1980, 108, 1041–1045. (In English) [Google Scholar] [CrossRef] [Green Version]
- Fortelli, A.; Scafetta, N.; Mazzarella, A. Nowcasting and Real-Time Monitoring of Heavy Rainfall Events Inducing Flash-Floods: An Application to Phlegraean Area (Central-Southern Italy); Springer: Berlin/Heidelberg, Germany, 2019; Volume 97, pp. 861–889. (In English) [Google Scholar]
- Jan, C.D.; Lee, M.H. A debris-flow rainfall-based warning model. J. Chin. Soil Water Conserv. 2004, 35, 275–285. (In Chinese) [Google Scholar]
- Sharpe, C.F.S. Landslide and Related Phenomena; Columbia University Press: New York, NY, USA, 1938; pp. 3–137. [Google Scholar]
- Yun, C.Y.; Kim, K.S.; Lee, J.W. Definition and classification of debris flow. Korean Geotech. Soc. 2009, 25, 28–35. (In Korean) [Google Scholar]
- Naver. New Dictionary of Civil Engineering Terms 1977, Civil Related Engineering Terms Compilation Committee. Available online: https://terms.naver.com/entry.nhn?docId=615229&cid=42322&categoryId=42322 (accessed on 7 August 2019).
- Han River Flood Control Office. Act on the Investigation, Planning and Management of Water Resources; Han River Flood Control Office: Seoul, Korea, 2018. [Google Scholar]
Figure 1.
Flowchart for debris flow forecasting.

Figure 2.
Initiation, transportation, and deposition of debris flows [25].
Figure 2.
Initiation, transportation, and deposition of debris flows [25].

Figure 3.
Accumulated rainfall and rainfall intensity at the time of debris flow occurrence [6].
Figure 3.
Accumulated rainfall and rainfall intensity at the time of debris flow occurrence [6].

Figure 4.
Concept of RTI and [22].
Figure 4.
Concept of RTI and [22].

Figure 5.
Positions of debris flow damage.

Figure 6.
Box plot of accumulated rainfall used in this study.

Figure 7.
Box plot of rainfall intensity used in this study.

Figure 8.
Determination of RTI values according to risk level (a) 6 h; (b) 12 h; (c) 24 h.


Figure 9.
Estimation of rainfall triggering index (6 h): (a) ALERT; (b) WARNING; (c) EMERGENCY.

Figure 10.
Estimation of rainfall triggering index (12 h): (a) ALERT; (b) WARNING; (c) EMERGENCY.

Figure 11.
Estimation of rainfall triggering index (24 h): (a) ALERT; (b) WARNING; (c) EMERGENCY.


Figure 12.
Estimation of rainfall triggering index (RTI) and critical accumulated rainfall (): (a) RTI 6 h; (b) RTI 12 h; (c) RTI 24 h.
Figure 12.
Estimation of rainfall triggering index (RTI) and critical accumulated rainfall (): (a) RTI 6 h; (b) RTI 12 h; (c) RTI 24 h.


Figure 13.
Debris flow Nomogram.

Figure 14.
Photo of damage areas in this study. (A) Seoul Metropolitan City; (B) Chuncheon City; (C) Cheongju City.
Figure 14.
Photo of damage areas in this study. (A) Seoul Metropolitan City; (B) Chuncheon City; (C) Cheongju City.

Figure 15.
Hyetograph (Case 1).

Figure 16.
Debris flow forecasting using nomogram (Case 1).

Figure 17.
Hyetograph (Case 2).

Figure 18.
Debris flow forecasting using nomogram (Case 2).

Figure 19.
Hyetograph (Case 3).

Figure 20.
Debris flow forecasting using nomogram (Case 3).


Table 1.
Landslide forecasting standard (Korea Forest Service).
| Maximum Hourly Rainfall (mm) | Daily Rainfall (mm) | Continuous Rainfall (mm) | |
|---|---|---|---|
| Landslide warning | 20–30 | 80–150 | 100–200 |
| Landslide alarm | >30 | >150 | >200 |
Table 2.
Rainfall forecasting standard (Korea Meteorological Administration).
| 3 h Rainfall (mm) | 12 h Rainfall (mm) | |
|---|---|---|
| Rainfall warning | >60 | >110 |
| Rainfall alarm | >90 | >180 |
Table 3.
Analysis of accumulated rainfall and rainfall intensity.
| Classification | Accumulated Rainfall (mm) | Rainfall Intensity (mm/h) | ||||
|---|---|---|---|---|---|---|
| Min | Ave | Max | Min | Ave | Max | |
| 6 h | 38 | 98.24 | 162 | 6.33 | 16.37 | 27 |
| 12 h | 39 | 133.18 | 232 | 3.25 | 11.10 | 19.33 |
| 24 h | 39 | 164.31 | 300 | 1.63 | 6.85 | 12.5 |
Table 4.
Estimation of rainfall triggering index.
| No. | ① Accumulated Rainfall (mm) | ② Rainfall Intensity (mm/h) | ① × ② RTI | ||||||
|---|---|---|---|---|---|---|---|---|---|
| 6 h | 12 h | 24 h | 6 h | 12 h | 24 h | 6 h | 12 h | 24 h | |
| 1 | 59 | 98.5 | 136.5 | 9.83 | 8.21 | 5.69 | 580 | 809 | 776 |
| 2 | 59 | 98.5 | 136.5 | 9.83 | 8.21 | 5.69 | 580 | 809 | 776 |
| 3 | 51 | 70 | 116 | 8.5 | 5.83 | 4.83 | 434 | 408 | 561 |
| 4 | 62 | 77 | 150 | 10.33 | 6.42 | 6.25 | 640 | 494 | 937 |
| 5 | 62 | 77 | 150 | 10.33 | 6.42 | 6.25 | 640 | 494 | 640 |
| 6 | 77 | 93 | 147 | 12.83 | 7.75 | 6.13 | 988 | 720 | 900 |
| 7 | 77 | 93 | 147 | 12.83 | 7.75 | 6.13 | 988 | 720 | 900 |
| 8 | 87.5 | 95.5 | 121 | 14.58 | 9.55 | 5 | 1276 | 912 | 610 |
| 9 | 134 | 134 | 134 | 22.33 | 11.17 | 5.58 | 2992 | 1496 | 748 |
| 10 | 134 | 134 | 134 | 22.33 | 11.17 | 5.58 | 2992 | 1496 | 748 |
| 11 | 134 | 134 | 134 | 22.33 | 11.17 | 5.58 | 2992 | 1496 | 748 |
| 12 | 134 | 134 | 134 | 22.33 | 11.17 | 5.58 | 2992 | 1496 | 748 |
| 13 | 39 | 39 | 39 | 6.5 | 3.25 | 1.63 | 253 | 507 | 63 |
| 14 | 104 | 104 | 104 | 17.33 | 8.67 | 4.33 | 1802 | 901 | 450 |
| 15 | 72.5 | 89.5 | 128 | 12.08 | 7.46 | 5.33 | 876 | 667 | 712 |
| 16 | 47 | 72 | 105 | 7.83 | 6 | 4.38 | 368 | 432 | 459 |
| 17 | 72.5 | 89.5 | 128 | 12.08 | 7.46 | 5.33 | 876 | 667 | 682 |
| 18 | 72.5 | 89.5 | 128 | 12.08 | 7.46 | 5.33 | 876 | 667 | 682 |
| 19 | 51 | 70 | 116 | 8.5 | 5.83 | 4.83 | 433 | 408 | 560 |
| 20 | 51 | 70 | 116 | 8.5 | 5.83 | 4.83 | 433 | 408 | 560 |
| 21 | 80 | 144 | 179 | 13.33 | 12 | 7.46 | 1066 | 1728 | 1335 |
| 22 | 87.5 | 95.5 | 121 | 14.58 | 7.96 | 5 | 1276 | 760 | 610 |
| 23 | 60 | 86 | 117 | 10 | 7.17 | 4.88 | 600 | 616 | 570 |
| 24 | 60 | 86 | 117 | 10 | 7.17 | 4.88 | 600 | 616 | 570 |
| 25 | 60 | 86 | 117 | 10 | 7.17 | 4.88 | 600 | 616 | 570 |
| 26 | 91.5 | 111.5 | 151 | 15.25 | 9.29 | 6.29 | 1395 | 1036 | 950 |
| 27 | 91.5 | 111.5 | 151 | 15.25 | 9.29 | 6.29 | 1395 | 1036 | 950 |
| 28 | 38 | 65 | 83 | 6.33 | 5.41 | 3.49 | 240 | 384 | 287 |
| 29 | 78 | 79 | 119 | 13 | 6.58 | 4.96 | 1014 | 520 | 590 |
| 30 | 141 | 160 | 187 | 23.5 | 13.33 | 7.79 | 3313 | 2133 | 1457 |
| 31 | 141 | 160 | 187 | 23.5 | 13.33 | 7.79 | 3313 | 2133 | 1457 |
| 32 | 141 | 160 | 187 | 23.5 | 13.33 | 7.79 | 3313 | 2133 | 1457 |
| 33 | 141 | 160 | 187 | 23.5 | 13.33 | 7.79 | 3313 | 2133 | 1457 |
| 34 | 141 | 160 | 187 | 23.5 | 13.33 | 7.79 | 3313 | 2133 | 1457 |
| 35 | 90 | 106 | 141 | 15 | 8.83 | 5.88 | 1350 | 936 | 828 |
| 36 | 90 | 106 | 141 | 15 | 8.83 | 5.88 | 1350 | 936 | 828 |
| 37 | 90 | 106 | 141 | 15 | 8.83 | 5.88 | 1350 | 936 | 828 |
| 38 | 141 | 160 | 187 | 23.5 | 13.33 | 7.79 | 3313 | 2133 | 1457 |
| 39 | 141 | 160 | 187 | 23.5 | 13.33 | 7.79 | 3313 | 2133 | 1457 |
| 40 | 100 | 123 | 150 | 16.67 | 10.25 | 6.25 | 1666 | 1260 | 937 |
| 41 | 120 | 197 | 231 | 20.00 | 16.42 | 9.63 | 2400 | 3234 | 2223 |
| 42 | 147 | 185 | 209 | 24.50 | 15.42 | 8.71 | 3602 | 2852 | 1820 |
| 43 | 117 | 146 | 173 | 19.50 | 12.17 | 7.21 | 2282 | 1776 | 1247 |
| 44 | 119 | 199 | 232 | 19.83 | 16.58 | 9.67 | 2360 | 3300 | 2243 |
| 45 | 119 | 199 | 232 | 19.83 | 16.58 | 9.67 | 2360 | 3300 | 2243 |
| 46 | 118 | 202 | 238 | 19.67 | 16.83 | 9.92 | 2321 | 3400 | 2360 |
| 47 | 85 | 131 | 166 | 14.17 | 10.92 | 6.92 | 1204 | 1430 | 1148 |
| 48 | 98 | 139 | 187 | 16.33 | 11.58 | 7.79 | 1601 | 1610 | 1457 |
| 49 | 155 | 188 | 216 | 25.83 | 15.67 | 9.00 | 4004 | 2945 | 1944 |
| 50 | 89 | 130 | 143 | 14.83 | 10.83 | 5.96 | 1320 | 1408 | 852 |
| 51 | 96 | 136 | 139 | 16.00 | 11.33 | 5.79 | 1536 | 1541 | 805 |
| 52 | 78 | 138 | 161 | 13.00 | 11.50 | 6.71 | 1014 | 1587 | 1080 |
| 53 | 87 | 167 | 190 | 14.50 | 13.92 | 7.92 | 1262 | 2324 | 1504 |
| 54 | 96 | 136 | 139 | 16.00 | 11.33 | 5.79 | 1536 | 1541 | 805 |
| 55 | 96 | 136 | 139 | 16.00 | 11.33 | 5.79 | 1536 | 1541 | 805 |
| 56 | 134 | 176 | 198 | 22.33 | 14.67 | 8.25 | 2993 | 2581 | 1634 |
| 57 | 162 | 222 | 300 | 27.00 | 18.50 | 12.50 | 4374 | 4107 | 3750 |
| 58 | 73 | 84 | 88 | 12.17 | 7.00 | 3.67 | 888 | 588 | 323 |
| 59 | 78 | 138 | 161 | 13.00 | 11.50 | 6.71 | 1014 | 1587 | 1080 |
| 60 | 88 | 135 | 175 | 14.67 | 11.25 | 7.29 | 1291 | 1519 | 1276 |
| 61 | 88 | 135 | 175 | 14.67 | 11.25 | 7.29 | 1291 | 1519 | 1276 |
| 62 | 88 | 135 | 175 | 14.67 | 11.25 | 7.29 | 1291 | 1519 | 1276 |
| 63 | 88 | 135 | 175 | 14.67 | 11.25 | 7.29 | 1291 | 1519 | 1276 |
| 64 | 88 | 135 | 175 | 14.67 | 11.25 | 7.29 | 1291 | 1519 | 1276 |
| 65 | 125 | 178 | 191 | 20.83 | 14.83 | 7.96 | 2604 | 2640 | 1520 |
| 66 | 68 | 129 | 138 | 11.33 | 10.75 | 5.75 | 771 | 1387 | 794 |
| 67 | 68 | 129 | 138 | 11.33 | 10.75 | 5.75 | 771 | 1387 | 794 |
| 68 | 89 | 120 | 186 | 14.83 | 10.00 | 7.75 | 1320 | 1200 | 1442 |
| 69 | 89 | 120 | 186 | 14.83 | 10.00 | 7.75 | 1320 | 1200 | 1442 |
| 70 | 145 | 232 | 265 | 24.17 | 19.33 | 11.04 | 3504 | 4485 | 2926 |
| 71 | 107 | 151 | 180 | 17.83 | 12.58 | 7.50 | 1908 | 1900 | 1350 |
| 72 | 107 | 151 | 180 | 17.83 | 12.58 | 7.50 | 1908 | 1900 | 1350 |
| 73 | 97 | 138 | 162 | 16.17 | 11.50 | 6.75 | 1568 | 1587 | 1094 |
| 74 | 73 | 103 | 131 | 12.17 | 8.58 | 5.46 | 888 | 884 | 715 |
| 75 | 73 | 103 | 131 | 12.17 | 8.58 | 5.46 | 888 | 884 | 715 |
| 76 | 112 | 154 | 174 | 18.67 | 12.83 | 7.25 | 2091 | 1976 | 1262 |
| 77 | 145 | 232 | 265 | 24.17 | 19.33 | 11.04 | 3504 | 4485 | 2926 |
| 78 | 145 | 232 | 265 | 24.17 | 19.33 | 11.04 | 3504 | 4485 | 2926 |
| 79 | 132 | 213 | 241 | 22.00 | 17.75 | 10.04 | 2904 | 3781 | 2420 |
| 80 | 132 | 213 | 241 | 22.00 | 17.75 | 10.04 | 2904 | 3781 | 2420 |
Table 5.
Estimation of critical accumulated rainfall ().
| Classification | |||
|---|---|---|---|
| ALERT (10% and over) | WARNING (up to 50% and over) | EMERGENCY (up to 70% and over) | |
| 6 hr | 37 | 82 | 142 |
| 12 hr | 45 | 135 | 171 |
| 24 hr | 83 | 139 | 211 |
Table 6.
Comparison of debris flow forecasting level results (Case 1).
| Occurrence Time of Debris Flow: 27 July 2011, 9:00 | ||||||||||||||||||||||||
|---|---|---|---|---|---|---|---|---|---|---|---|---|---|---|---|---|---|---|---|---|---|---|---|---|
| Time | 17:00 | 18:00 | 19:00 | 20:00 | 21:00 | 22:00 | 23:00 | 0:00 | 1:00 | 2:00 | 3:00 | 4:00 | 5:00 | 6:00 | 7:00 | 8:00 | 9:00 | 10:00 | 11:00 | 12:00 | 13:00 | 14:00 | 15:00 | 16:00 |
| Accumulated rainfall (mm) | 17 | 51 | 95 | 97 | 100 | 103 | 103 | 103 | 103 | 137 | 152 | 172 | 182 | 201 | 217 | 238 | 275 | 276 | 281 | 289 | 298 | 300 | 304 | 307 |
| (mm) | - | AL | W | W | W | W | W | W | AL | W | W | W | EM | EM | EM | EM | EM | EM | EM | EM | EM | EM | EM | EM |
| KFS (mm/h) | - | A | A | - | W | W | W | W | W | A | W | W | W | A | A | A | A | A | A | A | A | A | A | A |
| KMA (mm/h) | - | - | A | W | - | - | - | - | - | W | W | W | W | W | W | W | W | W | W | A | A | W | W | W |
※ ALERT: AL, WARNING: W, EMERGENCY: EM, ALARM: A.
Table 7.
Comparison of debris flow forecasting level results (Case 2).
| Occurrence Time of Debris Flow: 27 July 2011, 24:00 | ||||||||||||||||||||||||
|---|---|---|---|---|---|---|---|---|---|---|---|---|---|---|---|---|---|---|---|---|---|---|---|---|
| Time | 1:00 | 2:00 | 3:00 | 4:00 | 5:00 | 6:00 | 7:00 | 8:00 | 9:00 | 10:00 | 11:00 | 12:00 | 13:00 | 14:00 | 15:00 | 16:00 | 17:00 | 18:00 | 19:00 | 20:00 | 21:00 | 22:00 | 23:00 | 24:00 |
| Accumulated rainfall (mm) | 16 | 18 | 25 | 45 | 70 | 89 | 93 | 97 | 98 | 98 | 98 | 100 | 101 | 101 | 101 | 109 | 114 | 125 | 167 | 178 | 205 | 210 | 248 | 263 |
| (mm) | - | - | - | AL | AL | W | AL | AL | AL | AL | AL | AL | AL | AL | AL | AL | AL | AL | W | W | EM | EM | EM | EM |
| KFS (mm/h) | - | - | - | W | W | - | - | - | - | - | - | W | W | W | W | W | W | W | A | W | A | A | A | A |
| KMA (mm/h) | A | A | A | A | A | A | A | A | A | W | W | - | - | - | - | - | - | - | - | W | W | W | W | W |
※ ALERT: AL, WARNING: W, EMERGENCY: EM, ALARM: A.
Table 8.
Comparison of debris flow forecasting level results (Case 3).
| Occurrence Time of Debris Flow: 16 July 2011, 11:00 | ||||||||||||||||||||||||
|---|---|---|---|---|---|---|---|---|---|---|---|---|---|---|---|---|---|---|---|---|---|---|---|---|
| Time | 1:00 | 2:00 | 3:00 | 4:00 | 5:00 | 6:00 | 7:00 | 8:00 | 9:00 | 10:00 | 11:00 | 12:00 | 13:00 | 14:00 | 15:00 | 16:00 | 17:00 | 18:00 | 19:00 | 20:00 | 21:00 | 22:00 | 23:00 | 24:00 |
| Accumulated rainfall (mm) | 2 | 2 | 2 | 2 | 5 | 6 | 23 | 109 | 168 | 220 | 288 | 290 | 290 | 290 | 290 | 290 | 290 | 290 | 290 | 290 | 290 | 290 | 290 | 290 |
| (mm) | - | - | - | - | - | - | - | W | EM | EM | EM | EM | EM | EM | EM | EM | EM | EM | EM | EM | EM | EM | EM | EM |
| KFS (mm/h) | - | - | - | - | - | - | - | A | A | A | A | A | A | A | A | A | A | A | A | A | A | A | A | A |
| KMA (mm/h) | - | - | - | - | - | - | - | A | A | A | A | A | A | A | A | A | A | A | A | A | W | - | - | - |
※WARNING: W, EMERGENCY: EM, ALARM: A.
© 2019 by the authors. Licensee MDPI, Basel, Switzerland. This article is an open access article distributed under the terms and conditions of the Creative Commons Attribution (CC BY) license (http://creativecommons.org/licenses/by/4.0/).
Share and Cite
MDPI and ACS Style
Nam, D.-H.; Lee, S.-H.; Kim, B.-S. Development of Nomogram for Debris Flow Forecasting Based on Critical Accumulated Rainfall in South Korea. Water 2019, 11, 2181. https://doi.org/10.3390/w11102181
AMA Style
Nam D-H, Lee S-H, Kim B-S. Development of Nomogram for Debris Flow Forecasting Based on Critical Accumulated Rainfall in South Korea. Water. 2019; 11(10):2181. https://doi.org/10.3390/w11102181
Chicago/Turabian StyleNam, Dong-Ho, Suk-Ho Lee, and Byung-Sik Kim. 2019. "Development of Nomogram for Debris Flow Forecasting Based on Critical Accumulated Rainfall in South Korea" Water 11, no. 10: 2181. https://doi.org/10.3390/w11102181
Note that from the first issue of 2016, this journal uses article numbers instead of page numbers. See further details here.