Evaluating the Measurement of Activated Sludge Foam Potential

Water Technology Research Group, Centre for the Environment, School of Natural Sciences, Trinity College Dublin, Dublin 2, Ireland
*
Author to whom correspondence should be addressed.
Water 2011, 3(1), 424-444; https://doi.org/10.3390/w3010424
Submission received: 23 December 2010
/
Revised: 15 March 2011
/
Accepted: 16 March 2011
/
Published: 18 March 2011
Abstract
:The most widely used technique for assessing the propensity of activated sludge to suffer from biological foaming is to measure foam potential. This involves measuring the amount of foam produced from sludge under conditions of controlled aeration. Two approaches have been adopted: (1) Air is passed through specially designed columns from fine porous diffusers at a fixed rate to form uniform sized bubbles or (2) employing Alka-Seltzer™ tablets which effervesce when added to the sludge. Both tests generate foam formation which can then be quantified. Foam assessment in activated sludge is reviewed. A sintered disc aeration column was compared with the Alka-Seltzer™ test method and both methods examined under a range of different environmental conditions. Foam potential measured by the sintered disc method displayed better repeatability compared to the Alka-Seltzer test. The use of a wire cage placed over the tablets greatly improved the precision of the Alka-Seltzer test. A positive linear correlation was also found between foam potential and temperature (4–20 °C). Sludge solids concentration was also shown to influence foaming potential making comparisons between reactors problematic. Recommendations on how to improve the repeatability of foam potential measurements are given.
1. Introduction
Biologically mediated foaming continues to be a significant problem for activated sludge operation and management. It is the stability and persistence of these foams which differentiates them from other bubble entities seen on the surface of aeration tanks [1]. In large volumes foam can result in a multitude of operational problems including: reduction in plant performance, physical hazard to operators from exposure to pathogens and walkway obstruction [2,3,4,5], blockage of pipes [1], reduction in oxygen transfer [6], interference with essential plant monitoring equipment [2], and risk to consent failure thorough solids loss from the final settlement stage of the treatment process [7,8,9]. Recently, the presence of foam has also been recognised in systems which employ advanced wastewater treatment such as membrane bioreactors (MBR) [10].
The exact mechanism of how foaming is initiated and then stabilized still remains unanswered [6,10,11]. In general terms, the formation of foam initially involves the dispersion of a gas in a liquid [6]. In the presence of surface active agents, thin films of water surrounding the gas bubbles are prevented from draining back into the bulk liquid rendering the foam partially stable [12,13,14]. Activated sludge foam production also involves the addition of hydrophobic material [15]. Studies have shown that sites suffering from activated sludge foaming are often complemented by the presence of large quantities of the filamentous species Microthrix parvicella and/or nocardioform actinomycetes which are found in large amounts within the foam and mixed liquor [2]. These filamentous species are strongly hydrophobic due to having cell walls composed of mycolic acid [7,16,17,18]. In the absence of such species, non-stable foams are created [19]. One widely recognized theory behind activated sludge foaming is that the hydrophobic filaments attach themselves to surfaces of solid particles to create what is described as ‘three-phase foams [20]’. Following this, the floc particles then have the ability to adhere to the surface of gas bubbles, causing them rise and form a stable froth on the surface of aeration basins [10,14]. These hydrophobic filaments are also believed to perform an additional role of producing extra bio-surfactants [21] as well as stabilizing foam bubbles by bridging the interspatial water layer, forming a dam which then prevents liquid drainage and film thinning [19,22]. Within MBRs the occurrence of foams has been linked to the presence of extracellular polymeric substances (EPS) in the form of extracellular proteins [10]. These have the characteristics of surface active agents and can come from sources other than filamentous bacteria [23]. The key problem facing plant operators is that unlike other foams associated with the activated sludge process, the removal of biological foams are not straight forward as they are neither disrupted nor broken down to any degree by any inherent mixing or aeration processes [24] and are generally resistant to dispersion by water sprays [1]. To add to the problem of activated sludge foaming, there are currently only limited tools available that can be used to predict the onset of foaming events [25].
1.1. Common Methods Used to Determine Foam Stability and ‘Foamability’
Historically, the production of surfactants for detergent applications necessitated the development of methods to assess their performance. When evaluating foaming, two of the most important factors to be taken into consideration are how easily a foam forms and its stability [26]. Traditionally the ease of foaming, or ‘foamability’, is the foam-generating power of a liquid or the tendency for a liquid to form foam [26,27,28]. Foamability of solutions (characterised by volume of foam generated during testing) depends on composition of the liquid being tested, temperature and method of foam generation [27]. Stability, in turn, is determined by the volume of liquid which is drained from the foam within a fixed time period [29] and represented by rate of collapse or decay of the whole foam column or part of it [27]. There are several different ways in which foams can be formed, including whipping, stirring, plunging, shaking, oscillating, pouring, and bubbling [30].
Probably the simplest way to produce foam is by shaking a fixed volume of a mixture of liquid/gas within a container for a set period of time. The collapse time of the foam after this test is then an indication of the stability of the foam [12]. Such procedures are, however, difficult to standardise due to variations in bubble size which can differ between different experimental tests; therefore, this approach can only be used as a reference guide towards determining foam formation capability of different foaming systems [12].
One of the most commonly used procedures for the assessment of the foamability and stability of foam solutions (which has been adopted by the ASTM as a standard test protocol) is the Ross-Miles pouring test [31,32]. During this test, a fixed quantity of foaming solution is released from a specially designed pipette which is positioned at a set height above a container of the same dilute testing solution [33]. The volume of foam that is produced immediately upon the draining of the pipette is then recorded as the capacity of the solution to form foam, and the stability of the resultant foam is evaluated from the degree of decay in foam volume measured within a designated time period [34]. Variations on this test have been developed including temperature-controlled conditions [30]. Pinazo et al. [32] adapted the original Ross-Miles test so that the volume of liquid in the dispensing vessel was kept constant by continuously pumping the previously released solution back into the dispensing container at a constant rate so that the time period over which the test was conducted could be controlled. Despite the simplicity and wide use of this test as a means to assess foamability, its fundamental disadvantage is the lack of control over the amount of gas being introduced into the liquid matrix [31].
For test solutions which possess greater foamability and hence tend to foam more easily, bubbling a gas through the liquid represents a milder method of treatment which is better suited to such solutions [28]. Early experiments passed air at a fixed flow-rate through a porous glass disc at the bottom of a glass column [35], and this method (i.e., the Bikerman test) was adopted to assess the stability of dynamic foams under conditions of continuous aeration. Whilst modifications have been made to this test, such as the use of video technology and optical detection to accurately record changes in foam height [36,37] and measuring foam stability through detecting liquid draining rates using conductivity [26,38]; the basic practice that originally formed the Bikerman test is still one of the main procedures used today. One widely-used test, the Rudin test for beer foam quality assessment, measures foam stability using a similar gas bubbling/sparging technique [28].
Activated sludge foam is often described as being both viscous and stable in nature [14,18]. Once removed from the aeration zone, activated sludge foam quickly loses its structure and stability. To qualitatively investigate foaming in samples of activated sludge and to quantify the degree of potential foaming within activated sludge plants, only tests which can produce foam that remains stable long enough to be measurable and which generate conditions that mimic as closely as possible those experienced within the aeration process should be considered. Therefore, whilst all the tests described have been successively integrated for use within the food, manufacturing and surfactant industries, their use with activated sludge is limited.
1.2. Assessing Severity of Activated Sludge Foaming and Use of Foam Potential
Microscopic techniques are now established as one of the first steps in evaluating biological problems within activated sludge. For example, the relationship between the density of filamentous bacteria and reduced sludge settleability leading to bulking [39]. Likewise, an enrichment of Nocardia (Gordonia) spp. and the filamentous species Microthrix parvicella have been associated with activated sludge foaming [22]. Such work has lead to the principle of threshold numbers of mycolata being required for the formation of stable activated sludge foams [7,40]. A subjective approach to assessing activated sludge foaming has been to simply classify foams using the degree of aeration basin foam coverage [41], although it has not always been possible to directly correlate foam coverage with the abundance of suspected foam-causing bacteria [2].
Attempts have been made to simulate the portion of biomass that becomes entrained within the foam matrix by sequential factional flotation methods. Gravimetric analysis is then used to compare the mass of biomass in the foam to that of the biomass recorded in the mixed liquor to give rise to what has been termed ‘scum index’ [42]. The classification of foams has also been extended to ranking each according to stability and bubble size and assigning a ‘foam rating’ accordingly on this basis [19].
Other methods have focused on looking into the properties of foam and mixed liquor rheology through measurements of surface tension and viscosity. Decreases in the surface tension of mixed liquor samples measured during foaming events have been reported [43], while foaming sludge samples can possess higher degrees of hydrophobicity compared to non-foaming sludge samples [44]. This has prompted other authors to attempt to measure changes in the level of hydrophobicity within the activated sludge biomass [41,45]. Scum index and foam rating have been correlated with the hydrophobicity of the mixed liquor but not with foam coverage [46] which is subject to the individual hydraulic regime within each plant [2]. Foam quality tests have been applied to the substrates themselves within the activated sludge. Foaming power is a test which concentrates on what happens during foam production rather than the volume or stability of the foam produced. Albumin and EPS were extracted from mixed liquor samples taken from the MBR process and the foaming power due to these components was determined as the sample volume consumed during foam production [10]. Foaming power was found to increase proportionally to the protein content within the EPS. There is a lack of similar research when considering foaming within the conventional activated sludge process.
Whilst these techniques represent potentially valid approaches for investigating foaming within activated sludge, a major drawback is the complexity and cost of analysis particularly when considering the actual extraction of constituents of the mixed liquor itself.
In order to determine the likelihood of activated sludge samples to foam, the most commonly used method is to directly measure the foamability of mixed liquor and return activated sludge (RAS) samples. Within the context of wastewater research, the term ‘foam potential’ is specifically used to reflect foamability and can be viewed as the propensity of mixed liquor samples to foam under conditions of aeration. Ho and Jenkins [47] proposed a simple method to measure foam potential in activated sludge that has been widely adopted, by dropping two effervescent tablets of Alka-Seltzer into a 500 mL graduated cylinder containing a fixed volume of mixed liquor. The bubbles rise up through the sample, producing foam similar to that encountered in a wastewater treatment plant (WWTP). The maximum height of the foam generated was then used as a measure of the foaming power of the sludge. Earlier methods assessed foam potential by introducing a set volume of compressed gas through a sintered sand diffuser directly into a sample of mixed liquor and recorded the amount of foam generated in this way [48]. This test is similar to the Bikerman test described above. Despite the range of methods which have already been used to evaluate foaming characteristics, to date there is no standard method for assessing the foam potential or stability of activated sludge [2] (Table 1). Due to its simplicity and ease of operation, the Alka-Seltzer test remains the most popular method for both researchers and operators [40,49,50,51,52]. Some significant relationships have been identified using this test. For example, seasonal foaming events were directly linked with increased values of measured foam potential [51], and using this method a threshold level of foam potential that was necessary to start foaming was proposed [40]. Unlike many of the tests detailed in Table 1, the Alka-Seltzer test is widely employed by plant operators.

Table 1.
Brief descriptions of alternative methods to the Alka-Seltzer test used to measure foam potential of activated sludge.
| Summary of method | Description of key apparatus | Ref. |
|---|---|---|
| 500 mL of activated sludge at specific mixed liquor suspended solids (MLSS) of 3,340 mg SS/L was aerated in a graduated cylinder and aerated with a flow-rate of 2 L min−1 through sintered sand diffuser for 60 seconds. Foam height was recorded every 15secs throughout this period. | Graduated cylinder with sintered sand diffuser. | [53] |
| 20 mL of sample (filament cell culture) was placed in a glass column with sintered glass disc through which samples were aerated with industrial grade air at 100 mL min−1 for 1 min. Test used to measure foam stability assessed by the time taken after the cessation of air. | Specially blown cylinder of diameter 21 mm and length 210 mm. | [6] |
| 250 mL of activated sludge sample taken from different sources with contrasting solid concentrations. Samples were aerated for three minutes at an air flow-rate of 4 L min−1 and foam produced was rated on an arbitrary scale adapted from [54]. | 1 litre graduated cylinder of 60 mm diameter. Air purged through an Elastox-T© rubber diffuser membrane. | [2] |
| Identical aeration conditions to [6] performed on cell culture broth. Foam generation assessed on scale rating from 0 (no foam formed) to 7 (dense stable foam, stable for more than 5 minutes after aeration ceased). | 250 mL measuring cylinder with sintered disc in base | [17] |
| 50 mL of MLSS liquid sample was placed into a glass cylinder. Gas was passed through a sintered disc and the foam produced was then assessed using an arbitrary rating system. | Specially blown cylinder of diameter 40 mm and length 500 mm. Sintered glass disc had a pore size of 40–90 µm | [2] |
| Test performed on combined surfactant and Gordonia spp. containing activated sludge sample. Instantaneous foam heights were recorded every 10 seconds for 10mins and average foam height determined. | 1 litre graduated cylinder and aerated by compressed at rate of 0.11 m3 h−1 through a sintered silica sand diffuser. | [48] |
2. Materials and Methods
2.1. Samples of Activated Sludge
Samples of mixed liquor were collected from four different activated sludge wastewater treatment plants (WWTPs) situated within south-east Ireland. The basic type and configurations of each plant are summarised in Table 2. The plants at Greystones, Swords and Leixlip (industrial) suffer from regular foaming events while Leixlip (domestic) is largely free from foam although has suffered from severe foaming in the past. In all cases mixed liquor was collected directly before the combined effluent discharge weir, prior to secondary settlement. The samples obtained were all stored at ambient temperature and transported to the laboratory where they were continuously aerated and analysed within 24 hours.
| Greystones WWTP (30,000 pe) | Swords WWTP (60,000 pe) | Leixlip Industrial WWTP (35,000 pe) | Leixlip Domestic WWTP (45,000 pe) | |
|---|---|---|---|---|
| System | Conventional Plug-flow | Extended Aeration | Conventional Plug-flow | Completely Mixed |
| Primary Treatment | Yes | Yes | No | Yes |
| Aeration type | Fine bubble diffused aeration | Fine bubble diffused aeration | Fine bubble diffused aeration | Mechanical |
| Aerobic reactor | Yes | Yes | Yes | Yes |
| Anoxic reactor | No | Yes | Yes | No |
| Industrial wastes treated | 10% | 5% | 70% | 20% |
2.2. Alka-SeltzerFoam Potential and Stability Test
Using the method described by Ho and Jenkins [47], two tablets of Alka-Seltzer™ (acetylsalicylic acid 324 mg, sodium hydrogen carbonate, 1,625 mg, citric acid anhydrous, 965 mg, Bayer Corporation: Berkshire, UK) were dropped into a 250 mL aliquot of mixed liquor in a 500 mL graduated cylinder. The foam potential was recorded as the maximum volume of the foam generated during the test. Foam stability was calculated by noting the foam half-life, i.e., the time elapsed for half the volume of foam generated in the foam potential test to dissipate. Initial results using this method proved unreliable as in all cases a persistent layer of scum was formed once the foam had collapsed. Therefore stability data was not included as part of this study. When measuring the effect of environmental variables on the sample, an ice bath or hot water bath was used to adjust the sample to the required temperature.
Initially, replicate tests were conducted to determine the effects of storage time and conditions (e.g., aeration of samples) on foam potential using this test. Ten replicate tests of aerated and non-aerated mixed liquor were tested at time intervals of 0, 4, 8 and 12 hours from the time the samples had reached the laboratory (i.e., normally within 1 h of sampling). For testing whether sample volume has an effect, graduated cylinders of 1,000 mL and 2,000 mL were used.
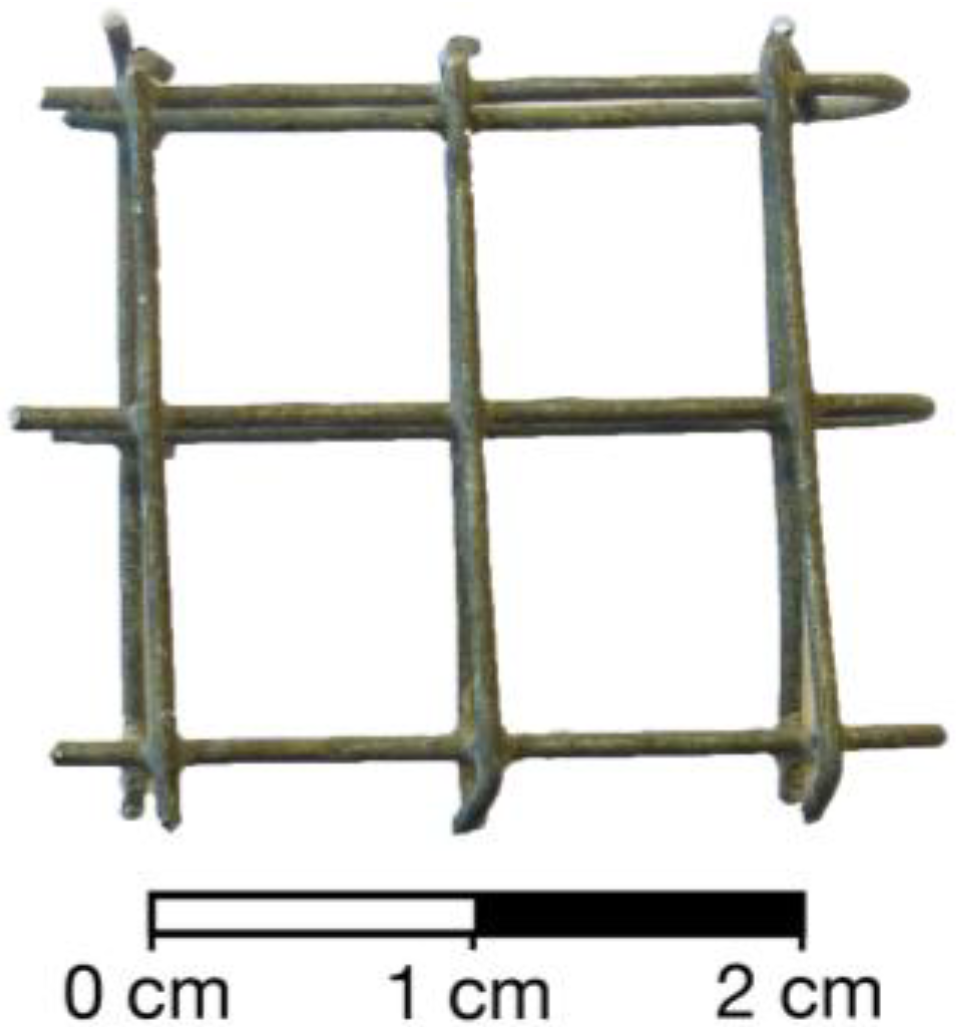
It was observed through the course of the experiments that substantial variation could appear in the results due to the movement of the individual Alka-Seltzer tablets within the samples (e.g., tablets could float to the surface and subsequently sink again in an unpredictable manner). This phenomenon has been reported by other authors [2,22]. In order to reduce this source of potential variation between replicate samples, a galvanised wire cage with 10mm square holes was constructed to contain the tablets and reduce their movements within the sample (Figure 1). Replicates were compared with and without the cage. All total suspended solid concentrations (TSS) were measured in accordance to Standard Methods [55].
Figure 1.
Galvanised wire cage used in modifications to the Alka-Seltzer test.

2.3. Foam Potential Aeration Apparatus
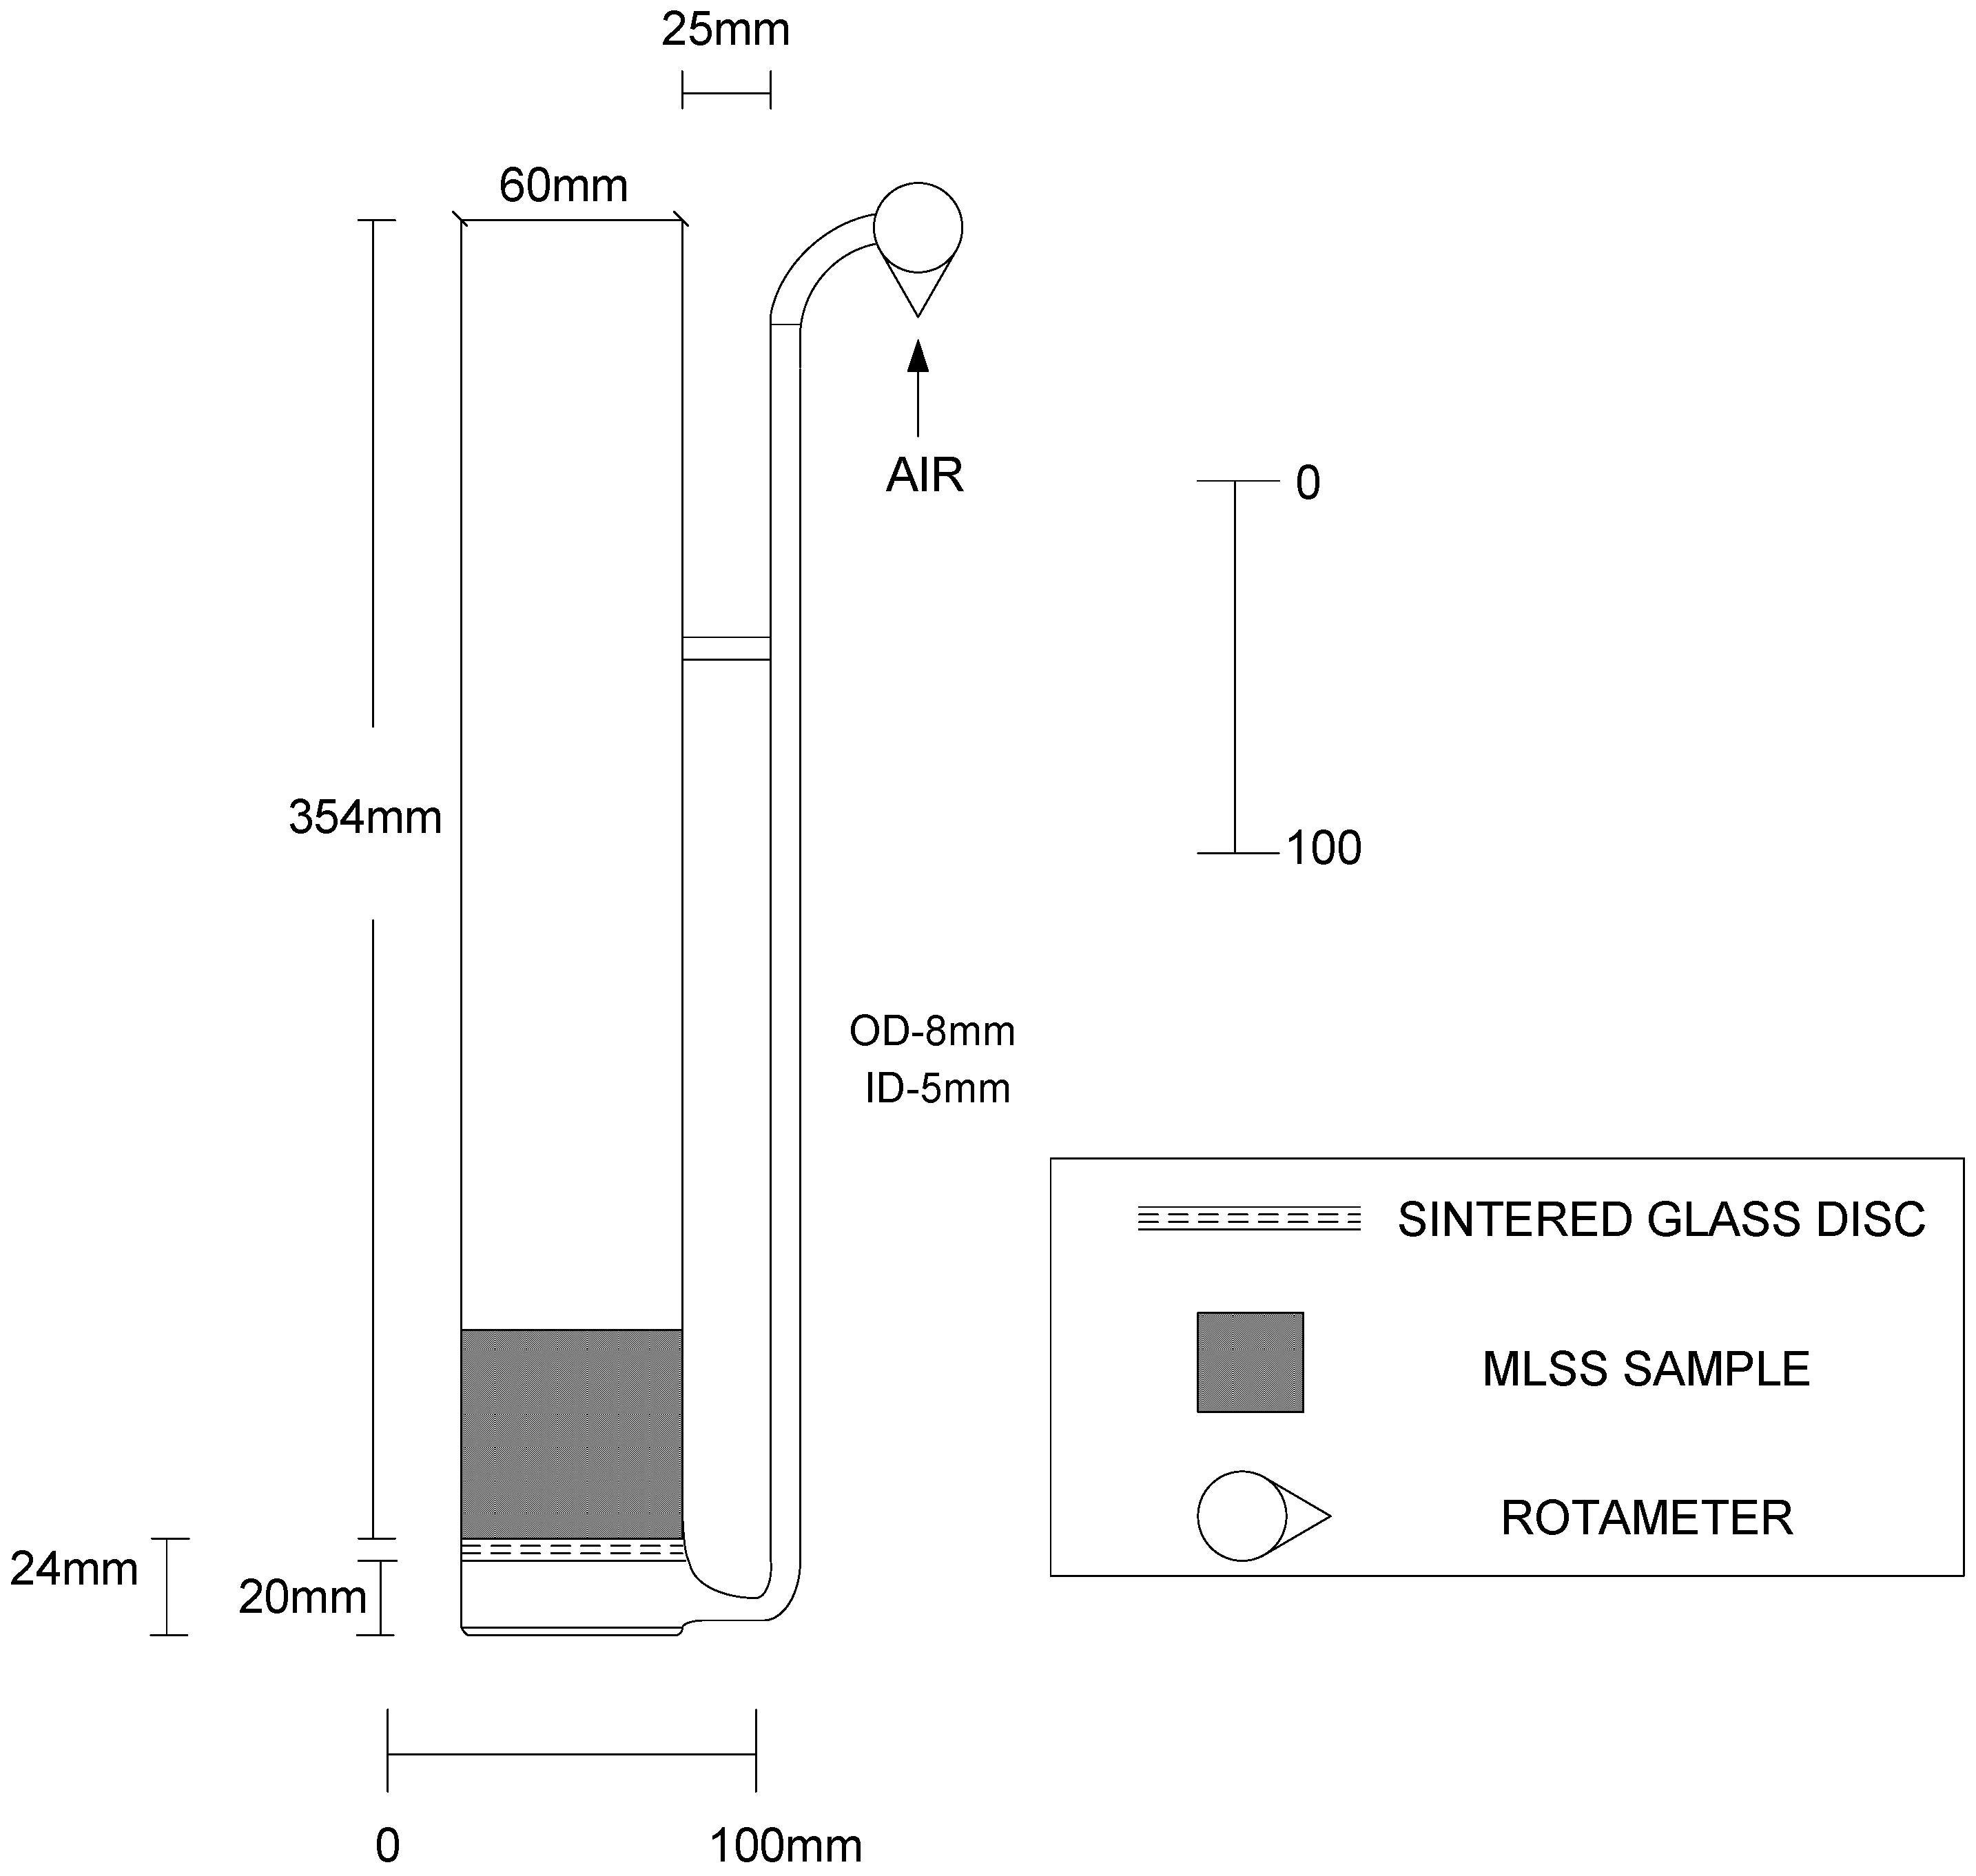
The bubble column apparatus used to measure foam potential was constructed from a 60 mm diameter 1 litre glass cylinder containing a borosilicate sintered disc embedded 20mm from its base (Figure 2). Air was supplied at the base to pass through the disc by an air pump (Rena Air 200, Rena SA Ltd., France). Air flow rate was measured and controlled using appropriately-sized rotameters with scales of 0.1–1.0L min−1 (GAP, England) and 0.5–10 L min−1 (Stabillmento Ltd., Italy). The test aeration period was 60 seconds. Three different sintered disc porosities were tested. Porosity 0 corresponds to a pore size between 160 to 250 µm and pore size 1 and 2 to pore sizes of 100 to 160 µm and 40 to 100 µm respectively. Each disc complied with ISO 4793 [56]. Prior to each experimental period, the sintered glass disc and cylinder was cleaned with 70% v/v nitric acid. The foam potential was evaluated as the maximum level of foam achieved within the aeration period. A sample volume of 150 mL was used in all disc porosity and flow-rate experiments. Subsequent testing was used to confirm the correct volume of sample which should be used when using this apparatus.
Figure 2.
Glass column sintered disc foam potential testing apparatus.

2.4. Statistical Analysis
Analysis of variance (ANOVA) at the 95% confidence level was used to determine the significance of air flow-rate, volume and disc porosity on the results obtained using the different sludges when assessing the sintered disc method. Replicate numbers were validated using power analysis [57] conducted with G*Power (version 3) package software [58]. The coefficient of variation (CV) allowed for comparison of the variability in data obtained between the different experiments. When comparing the difference between the Alka-Seltzer and the sintered disc methods a two sample unpaired t-test was utilised. The degree of precision was by assessing calculating the repeatability (r) using the equation:
Where r is the repeatability of test method, t is taken from a two-sided t-table based on the degrees of freedom (n-1) at the 95% confidence level where n is the total number of replicates and s is the sample standard deviation of repeat determinations [59]. The repeatability value (r) is the value below which the absolute difference between two single results obtained under repeatability conditions may be expected to lie with a probability of 95 %. Hence the smaller the value of r the more precise and repeatable the data is.
The number of replicates (n) required for a particular given variation (δ) in the assessment of the wire cage was determined using the following equation:
where Zα and Zβ refer to significance level of Type I and Type II errors [60].
To achieve the appropriate power to minimise variances associated with type II error, an optimum of value of 0.80 is necessary [57]. Based on a large effect size (f2 = 0.40, α = 0.05) to approximate to this power level a minimum number of 20 replicates (n) (total sample size of 60) was performed.
3. Results and Discussion
3.1. Assessing Optimum Conditions for the Sintered Disc Foam Potential Testing Apparatus
To ensure that foam potential testing using the sintered disc method was performed within an environment that provided maximum repeatability, the propensity of mixed liquor samples to produce foam was first evaluated under varying operating conditions of disc porosity (ø), applied air flow-rate (Qair), and sample volume (V).
3.1.1. Disc porosity
No significant difference was observed in mean foam potential obtained when tests were conducted using different porosity discs on mixed liquor samples taken from either Leixlip (domestic) or Leixlip (industrial) WWTPs, although foam potential results showed significant differences for all porosities investigated using the mixed liquor from Greystones WWTP (ANOVA, p < 0.05) (Table 3). During the experiments the bubbles produced were observed to become more uniform in size distribution as the porosity was reduced and for all the samples tested, maximum repeatability was obtained using the smallest porosity of sintered disc examined (i.e., porosity 2: pore size range 40 to 100 µm).
Table 3.
Influence of disc porosity (ø) on repeatability of foam potential results obtained using three different activated sludges (V = 150 mL, Qair = 0.5 L min−1, n = 20).
| WWTP | Porosity | Min (mm) | Mean (mm) | Max (mm) | Standard Deviation (SD) | Coefficient of variation (%) | Repeatability (r) |
|---|---|---|---|---|---|---|---|
| Greystones | 0 | 295 | 317 | 350 | 20.2 | 6.4 | 56.0 |
| 1 | 285 | 306 | 330 | 11.5 | 3.8 | 31.9 | |
| 2 | 290 | 306 | 320 | 7.76 | 2.5 | 21.5 | |
| Leixlip (Domestic) | 0 | 210 | 261 | 330 | 23.5 | 9.0 | 56.0 |
| 1 | 240 | 253 | 275 | 8.2 | 3.2 | 31.1 | |
| 2 | 250 | 261 | 270 | 6.2 | 2.8 | 21.5 | |
| Leixlip (Industrial) | 0 | 220 | 251 | 270 | 15.5 | 6.2 | 65.1 |
| 1 | 230 | 252 | 300 | 18.4 | 7.3 | 22.7 | |
| 2 | 230 | 244 | 270 | 8.4 | 3.5 | 17.2 |
3.1.2. Air flow-rate
The influence of the rate of air flow through the disc on foam potential was then assessed using the column apparatus with the porosity 2 disc. Initially using the mixed liquor from the Greystones WWTP, a range of flow rates were tested (0.5–1.5 L min−1). The higher flow rates produced excessive foaming (Table 4). The test was then repeated using the two Leixlip mixed liquors using similar flow rates (0.1–0.5 L min−1). The results showed that a greater precision was obtained operating under the low flow-rate conditions. At these flow rates only approximately 40% of the surface of the disc allowed bubbles through, however, all the bubbles were produced uniformly from within the centre of the disc. At the higher flow-rates of 1.0 L min−1 and 1.5 L min−1 the air bubbles were produced unevenly causing a swirl effect within the column. Analysis of variance shows that flow rate caused significant differences in measured foam potential (ANOVA, p < 0.05). Using mixed liquor samples from Leixlip (domestic) WWTP, a rise in flow rate over the range of 0.1–0.5 L min−1 brought about an overall improvement in repeatability (and decrease in standard deviation). When flow rates >0.5 L min−1 were tested using mixed liquor samples from Greystones WWTP repeatability became progressively worse. These trends were less clearly observed with the Leixlip Industrial WWTP samples (Table 4).
Table 4.
Influence of applied air flow-rate (Qair) on repeatability of foam potential results obtained using three different activated sludges (V = 150 mL, ø = 2, n = 20).
| WWTP | Flow rate (L min−1) | Min (mm) | Mean (mm) | Max (mm) | Standard Deviation (SD) | Coefficient of variation (%) | Repeatability (r) |
|---|---|---|---|---|---|---|---|
| Greystones | 0.5 | 290 | 306 | 320 | 7.76 | 2.5 | 23.0 |
| 1.0 | 480 | 574 | 700 | 57.4 | 10.0 | 170.0 | |
| 1.5 | 620 | 720 | 820 | 65.1 | 9.0 | 193.9 | |
| Leixlip (Domestic) | 0.1 | 230 | 250 | 300 | 13.6 | 5.4 | 40.4 |
| 0.3 | 230 | 250 | 270 | 9.03 | 3.6 | 26.7 | |
| 0.5 | 250 | 261 | 270 | 6.20 | 2.4 | 18.3 | |
| Leixlip (Industrial) | 0.1 | 230 | 247 | 265 | 8.90 | 3.6 | 26.4 |
| 0.3 | 250 | 268 | 300 | 13.3 | 5.0 | 39.4 | |
| 0.5 | 230 | 244 | 270 | 8.44 | 3.5 | 25.0 | |
| 1.0 | 270 | 282 | 300 | 8.49 | 3.0 | 25.1 |
3.1.3. Sample volume
A change in sample volume had a significant influence on foam potential observed from each site (p < 0.05) (Table 5). For Greystones WWTP and Leixlip (Domestic) WWTP, optimum conditions of repeatability was achieved when conducting tests using 150 mL sample volumes whilst the difference in repeatability was marginal in results obtained using sample volumes of 150 mL and 200 mL for Leixlip (Industrial) samples. The smallest volume of 100 mL consistently produced the highest coefficient of variation (CV). Also, when testing using the smallest volume of 100 mL, large ‘flat’ films were produced which immediately separated away from the bulk of the rest of the foam and then were forced up the column. These bubbles interfered with the reading of results and made it difficult to determine the true foam potential. At increased volumes, the distance between the surface of the solution and the disc becomes greater. This lead to a dramatic change in the bubble size distribution and the transfer efficiency of the air into the solution matrix. Additionally, a greater volume of test solution will impart an increase in the pressure exerted on the sintered disc at the bottom of the cylinder which in turn possibly influences the ease of bubble release and the size of bubbles produced. Therefore the best volume, whereby the transfer of air is such that the size of bubbles are produced in a reproducible manner and that the release of bubbles is not hindered to any degree, is achieved using a minimum volume of sample of 150 mL.
Variability between the optimum operating parameters of porosity (ø = 2), air flow-rate (Qair = 0.5 L min−1) and sample volume (V = 150 mL) determined here on the basis of best repeatability in each case, has been shown to be very small when comparing the corresponding values of CV.
Table 5.
Influence of sample volume (V) on repeatability of foam potential results obtained using three different activated sludges (Qair = 0.5 L min−1, ø = 2, n = 20).
| WWTP | Volume (mL) | Min (mm) | Mean (mm) | Max (mm) | Standard Deviation (SD) | Coefficient of variation (%) | Repeatability (r) |
|---|---|---|---|---|---|---|---|
| Greystones | 100 | 220 | 296 | 420 | 55.7 | 20.7 | 164.8 |
| 150 | 295 | 308 | 320 | 7.02 | 2.3 | 20.8 | |
| 200 | 420 | 455 | 525 | 37.4 | 8.2 | 111.0 | |
| Leixlip (Domestic) | 100 | 140 | 199 | 215 | 17.8 | 9.0 | 52.8 |
| 150 | 250 | 260 | 270 | 6.11 | 2.4 | 18.0 | |
| 200 | 285 | 300 | 320 | 8.55 | 2.9 | 25.3 | |
| Leixlip (Industrial) | 100 | 170 | 191 | 210 | 12.1 | 6.3 | 35.9 |
| 150 | 230 | 244 | 270 | 9.30 | 3.8 | 27.6 | |
| 200 | 250 | 272 | 280 | 7.72 | 2.8 | 22.9 |
3.2. Assessing Optimum Conditions for Alka-Seltzer Foaming Method
To evaluate the usefulness of Alka-Seltzer foaming test [47], a program of testing was undertaken to first determine the repeatability by identifying potential environmental and experimental sources of variation, and finally testing for repeatability under identified optimized conditions. The variables investigated included sample storage time, sample temperature, tablet movement, sample volume and MLSS concentration.
3.2.1. Use of wire cage
Efficacy of the wire cage in ensuring that a consistently steady stream of bubbles was generated during the Alka-Seltzer test by preventing the tablets from rising to the surface was evaluated. The data produced showed that the use of the wire cage made a significant difference (p < 0.05) in the level of repeatability (r) obtained when the cage was in use (mean = 96.1 mm, SD = 5.19, r = 14.4, n = 10) compared to when it was not implemented (mean = 136.0 mm, SD = 13.86, r = 38.4, n = 10). The minimum number of replicates (sample size) required to maintain 10% variance between mean results decreased from 35 to 7 (Equation 2). The floating effect that sometimes occurs when Alka-Seltzer tablets are added to the sample can reduce the effective gas production rate [2]. The application of the cage prevented this from happening by ensuring the rate of the gas released by the tablets was constant over time. However, when the cage was used this reduced the rate of gas release as the total surface area of the tablets exposed was reduced which resulted in a lower expansion of the foam and hence foaming potential.
3.2.2. Effect of storage
Values of foam potential were found to differ for all samples when stored, regardless of the influence of aeration (ANOVA, p < 0.05). In general, for both aerated and un-aerated samples an increase in foam volume was generated when the time period between collection and testing increased. A paired sample t-test was performed to determine the level of significance in the variation of foam potential under conditions of aeration and non-aeration during storage. No significant difference (p > 0.05) was found between samples which had been oxygenated and those left in the absence of air for up to 4 hours, however, beyond this period when storage was extended to 8 hours and 12 hours average values of foam potential recorded were found to differ significantly depending on the storage conditions of the sludge (Table 6). A negligible change in TSS was recorded in both aerated samples and un-aerated samples after 12 hours on standing (7% mean increase in MLSS for non-aerated sample and 5% mean increase for aerated sample). The fact that the solids concentration did not significantly change (specifically decrease to any degree) would reflect that an endogenous state of biological activity had not been reached. Additionally, the foam potential increasing over time in the aerated sample suggests both the production and release of additional bio-surfactants, increased filaments or both.
Table 6.
The influence of storage time on obtained results of foam potential demonstrated using samples maintained under conditions of aeration and non-aeration. Foam potential values are means ± 95% confidence limits. The standard deviation is shown in brackets.
| Time Period (Hours) | Number of replicates | Foam potential (mm) (AERATED) | Foam Potential (mm) (NON-AERATED) | Significance (α = 0.05) |
|---|---|---|---|---|
| 0 | 10 | 211 ± 12.7 | ||
| (17.8) | ||||
| 4 | 10 | 258 ± 9.7 | 253 ± 14.0 | p > 0.05 |
| (13.8) | (19.6) | |||
| 8 | 10 | 262 ± 7.6 | 294 ± 17.5 | P < 0.05 |
| (10.6) | (24.3) | |||
| 12 | 10 | 310 ± 10.9 | 271 ± 6.0 | P < 0.01 |
| (15.2) | (8.3) | |||
3.2.3. Effect of temperature
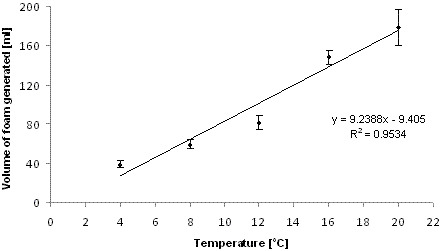
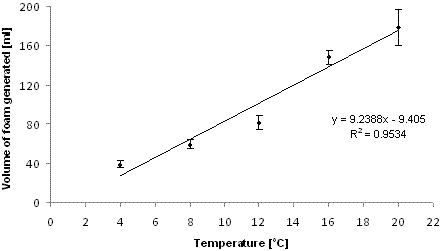
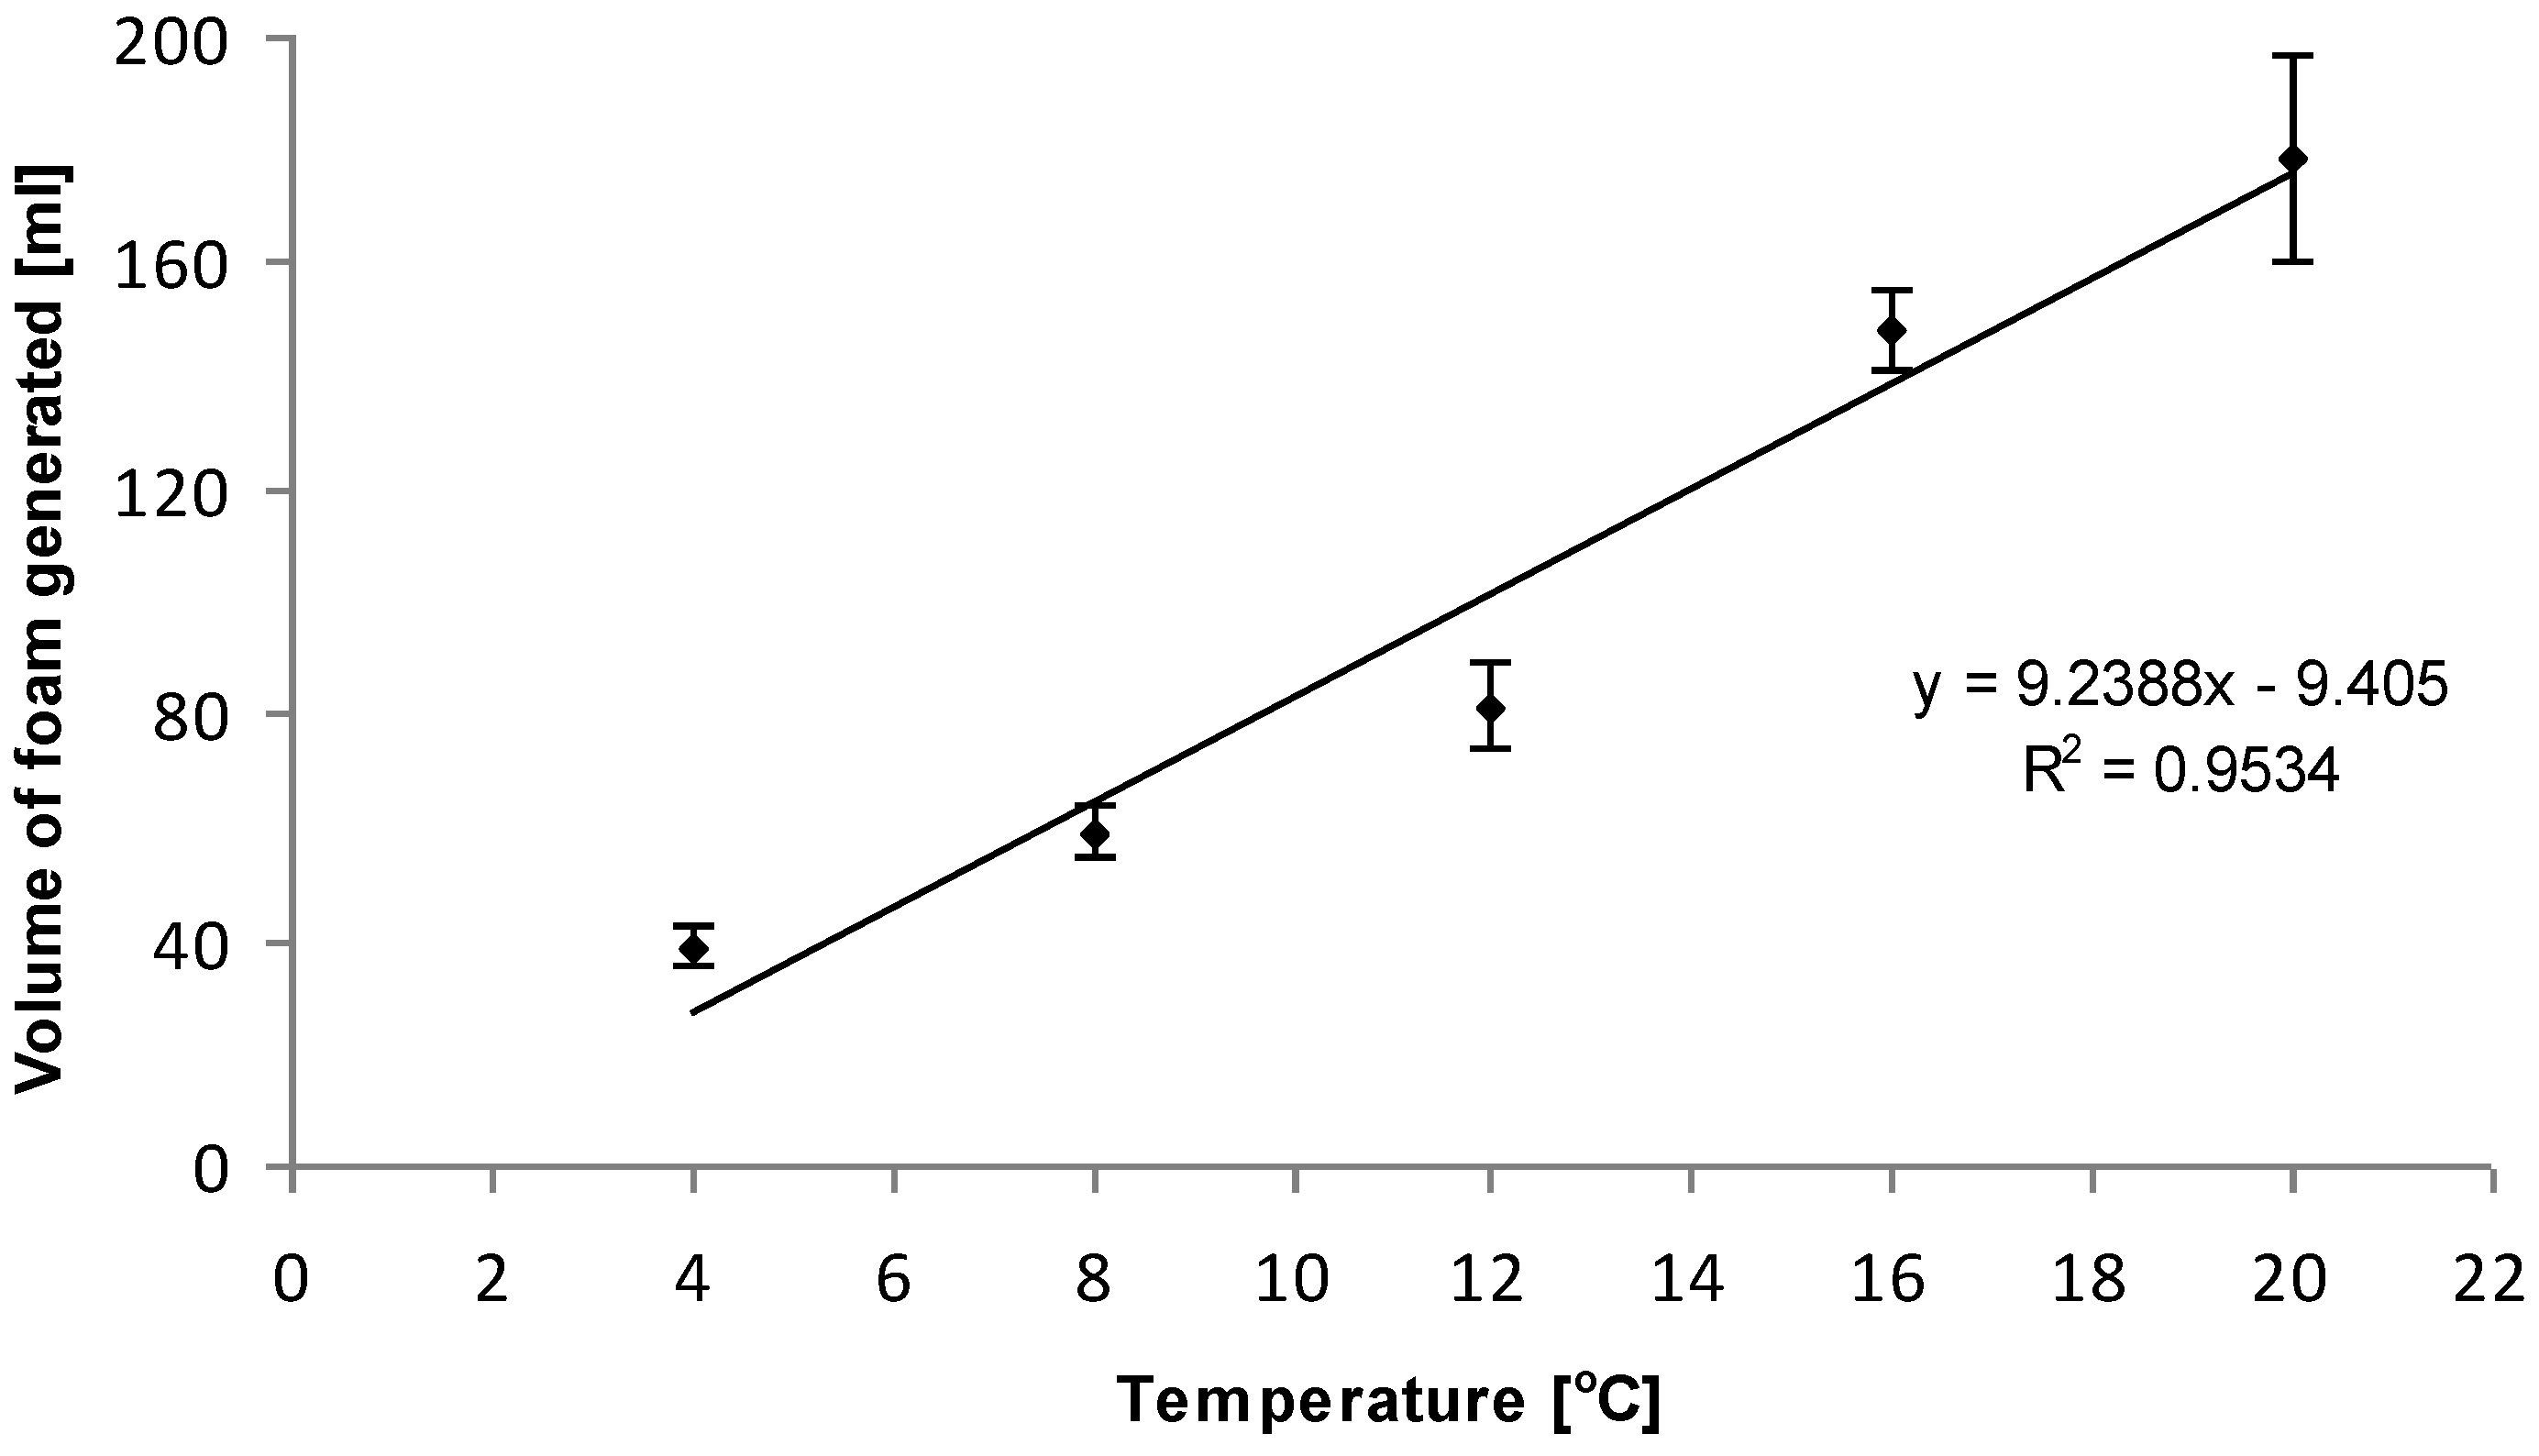
The effect of temperature on foam potential was examined by performing ten replicates of the Alka-Seltzer test at temperatures of 4, 8, 12, 16, and 20 °C using activated sludge obtained from Swords WWTP. This temperature range was considered as being most representative of typical ambient temperatures experienced in Ireland. The temperature was controlled to ±1 °C over the testing period. A significant linear correlation was found to exist between foam potential and temperature (n = 50; R = 0.98; p < 0.05) (Figure 3). ANOVA analysis showed 90% of the variation in data could be explained by linear regression. Whilst the slope produced was found to be significant at the 95% confidence level, the calculated intercept was not found to significantly differ from zero (p > 0.05) demonstrating that temperature plays a key role in foam potential measurements when using this test. This is most likely due to the rate of gas release as the tablets dissolve at different temperatures. Ideally foam potential should be carried out at the same temperature as the mixed liquor within the aeration basin. However, for comparative purposes the test should be performed at a single controlled temperature.
Figure 3.
Relationship between temperature and volume of foam produced (i.e., foam potential) for Alka-Seltzer foaming test (Error bars represent 95% confidence intervals of mean values at each specific temperature).
Figure 3.
Relationship between temperature and volume of foam produced (i.e., foam potential) for Alka-Seltzer foaming test (Error bars represent 95% confidence intervals of mean values at each specific temperature).
3.2.4. Sample volume
Based on the original test methodology of a working volume of 250 mL is consistently used as the benchmark sample size chosen by researchers performing the Alka-Seltzer foaming test. When experiments were conducted using sample volumes of 500, 1,000 and 2,000 mL, the addition of two Alka-Seltzer tablets caused the production of a thick layer of floating sludge (approximately 5–7 mm in height) rather than measurable volume of foam. Therefore, increasing the volume of sample in order to conduct this test is not feasible.
3.2.5. Influence of MLSS concentration
Samples of RAS were taken from both Leixlip (domestic) WWTP and Leixlip (industrial) WWTPs. The foam potential of each sample was then tested at a controlled temperature of 20 oC using a water bath. Subsequent tests were performed with samples diluted with the settled supernatant. Dilution was carried out to produce solutions which contained the following percentage of RAS: 10%, 25%, 50%, 75%, 80%, 90%, and 100%. For each site tested, foam potential increased with TSS (Figure 4). The relationship in each case was found to be nonlinear, confirming similar observations [51].
Figure 4.
Influence of total suspended solids concentration on foam potential measured using Alka-Seltzer test.
Figure 4.
Influence of total suspended solids concentration on foam potential measured using Alka-Seltzer test.
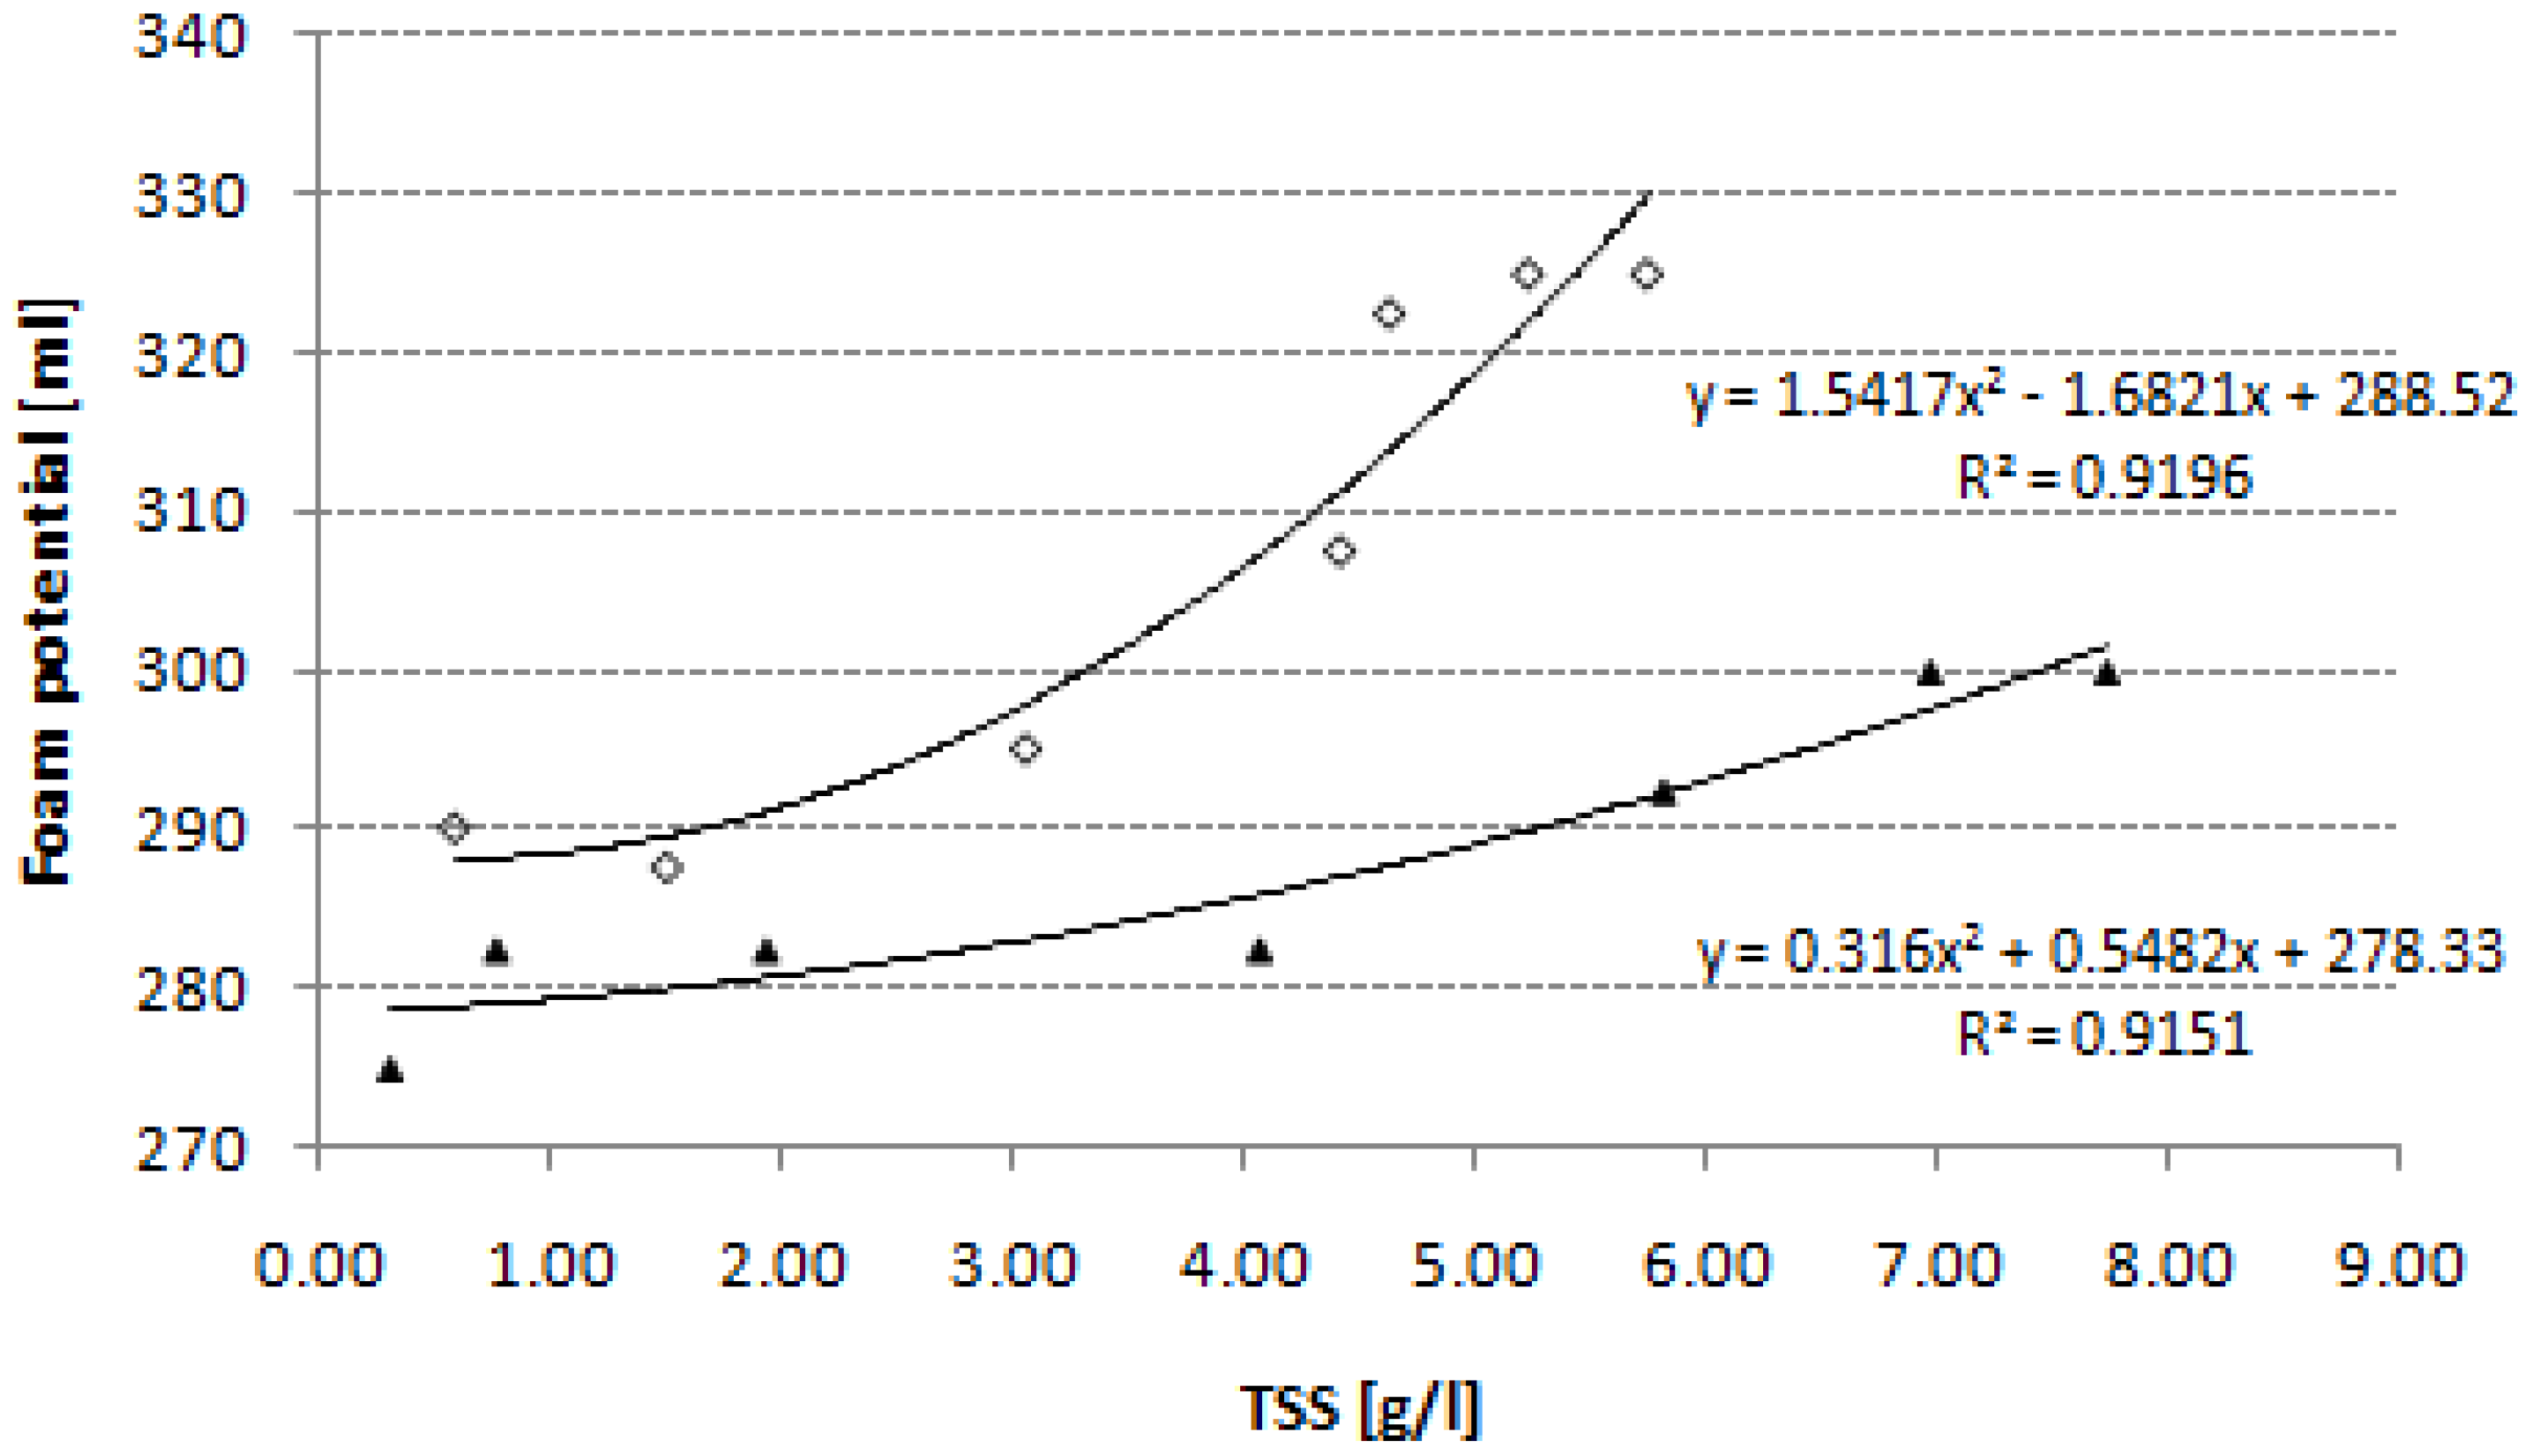
▲ Leixlip Domestic WWTP ◊ Leixlip Industrial WWTP.
For routine plant monitoring this test should be performed at the operational MLSS. As a research tool, however, where there is the need for accurate comparison of data obtained from different plants, over prolonged operational periods or from other studies, it is recommended that this test is carried out on sludge at the same standard concentration of MLSS. In order to establish the ideal solid concentration for this purpose, replicate testing was performed at three contrasting solid concentrations (approx 2.0 g L−1, 3.5 g L−1, and 5.0 g L−1) (Table 7). While analysis of variance shows that the foam potential for each solid concentration differs significantly (ANOVA, p < 0.05), values obtained for repeatability at each solids concentration are comparable. It is therefore recommended the test should be performed on sludge samples with a MLSS of 3.5 g L−1. This concentration is appropriate as it is the same as used to express the specific stirred volume index (SSVI3.5) test and represents the conventional operational MLSS concentration in activated sludge [61].
Table 7.
Repeatability of foam potential measurement using the Alka-Seltzer test at three different mixed liquor suspended solids (MLSS) concentrations.
| Foam Potential | |||||
|---|---|---|---|---|---|
| MLSS (g L-1) | Number of replicates (n) | Mean Foam potential (mm) (± 95% CI) | Standard Deviation | Coefficient of variation (%) | Repeatability (r) |
| 1.84 | 10 | 293 ± 3.0 | 4.22 | 1.4 | 13.8 |
| 3.57 | 10 | 300 ± 3.6 | 4.97 | 1.7 | 15.9 |
| 4.95 | 10 | 305 ± 2.6 | 3.69 | 1.2 | 11.8 |
3.3. Comparison of Foam Potential between Alka-Seltzer and Sintered Disc Tests
Once operating parameters had been established to ensure maximum precision in results from both the sintered disc and the Alka-Seltzer methods, the two tests were directly compared in terms of precision based on repeatability.
The Alka-Seltzer test was performed using 250 mL of sludge. For the sintered disc method, using 250 mL led to the foam approaching the maximum height of the test cylinder apparatus; therefore the optimum volume of 150 mL of sludge was used with this apparatus. In order to be able to compare the results obtained from each method, foam potential is expressed as a percentage of the maximum expansion of foam compared to the volume of mixed liquor used. When analysing Leixlip (Domestic) WWTP samples, both methods produced comparable results of mean foam potential whilst sample results from Leixlip (Industrial) WWTP differed significantly (p < 0.05). In both circumstances the sintered glass disc method produced the best repeatability of the two methods investigated (Table 8).
In all cases, the variability of data measured remained minimal as indicated by the small values of CV.
Table 8.
Comparison of repeatability obtained when measuring foam potential (reported as a percentage of sample starting volume) using the standard Alka-Seltzer test (without the cage) and sintered disc test under pre-determined optimum operating conditions at ambient temperature of 18 °C.
| Leixlip Domestic WWTP | |||||||
| Test Method | Sample Size (n) | Min (%) | Mean (%) ± 95% CI | Max (%) | Standard Deviation (SD) | Coefficient of variation (%) | Repeatability (r) |
| Air test | 20 | 66.7 | 74.0 ± 1.8 | 80.0 | 4.13 | 5.6 | 12.2 |
| Alka-Seltzer | 20 | 44.0 | 73.3 ± 4.1 | 84.0 | 9.27 | 12.6 | 27.4 |
| Leixlip Industrial WWTP | |||||||
| Air test | 20 | 53.3 | 62.3 ± 2.6 | 80.0 | 5.63 | 9.0 | 16.7 |
| Alka-Seltzer | 20 | 32.0 | 49.9 ± 4.2 | 64.0 | 9.63 | 15.0 | 28.5 |
4. Conclusions
- The optimum operating conditions for the sintered disc method are a porosity of 40 to 100 µm (i.e., porosity disc size 2), an air flow-rate of 0.5 L min−1 and a sludge sample volume of 150 mL.
- The application of the wire cage greatly improved the level of precision obtained when performing the Alka-Seltzer test, although the volume of foam produced was reduced by the more controlled release of gas.
- A strong positive linear correlation was found between foam potential results obtained from the Alka-Seltzer test and temperature in the range investigated (4–20 °C). Therefore for comparative purposes the test should be carried out at a prescribed temperature, while for operational use it should be carried out at the same temperature within the aeration basin.
- The Alka-Seltzer method is also affected by mixed liquor solids concentration with non-linear relationships recorded for different sludges. For comparative research then consideration should be given to expressing foam potential at a fixed MLSS concentration (e.g., 3.5 g L−1).
- Based on the mixed liquors used in this work, when measuring foam potential the sintered disc method produces results with better repeatability than the Alka-Seltzer test.
- The Alka-seltzer test also has inherent problems related to the rate of gas released from the tablets as they dissolve which controls the ultimate volume of gas produced.
- The characteristics of the sintered disc test, involving more complex and specialised equipment renders it inappropriate in most cases for use at plant level. Therefore, for routine operational monitoring the Alka-Seltzer test is more appropriate at the operational MLSS and temperature.
| MLSS | mixed liquor suspended solids |
| n | number of replicates |
| r | repeatability of test method |
| RAS | returned activated sludge |
| TSS | total suspended solids |
| Ø | porosity of sintered disc |
| WWTP | waste water treatment plant |
| Zα and Zβ | significance level of Type I and Type II errors |
Acknowledgements
This research has been funded by Science Foundation Ireland under the Research Frontiers Programme (Grant number: 08/RFP/ENM993). The authors are very grateful to the management and operators of the treatment plants from which sample material was collected.
References
- Pipes, W. Actinomycete scum production in activated sludge processes. J. Water Poll. Contr. Fed. 1978, 50, 628–634. [Google Scholar]
- Hug, T. Characterization and Controlling of Foam and Scum in Activated Sludge Systems. PhD Thesis, Swiss Federal Institute of Technology Zurich, Dübendorf, Switzeland, 2006. [Google Scholar]
- Kragelund, C.; Nilsson, B.; Eskilsson, K.; Bøgh, A.; Nielsen, P. Full-scale control of Mycolata foam by FEX-120 addition. Water Sci. Technol. 2010, 61, 2443. [Google Scholar] [CrossRef] [PubMed]
- Narayanan, B.; de Leon, C.; Radke, C.; Jenkins, D. The Role of Dispersed Nocardioform Filaments in Activated Sludge Foaming. Water Environ. Res. 2010, 82, 483–491. [Google Scholar] [CrossRef] [PubMed]
- Ovez, S.; Ors, C.; Murat, S.; Orhon, D. Effect of hypochloride on microbial ecology of bulking and foaming activated sludge treatment for tannery wastewater. J. Environ. Sci. Health A 2006, 41, 2163–2174. [Google Scholar] [CrossRef]
- Heard, J.; Harvey, E.; Johnson, B.; Wells, J.; Angove, M. The effect of filamentous bacteria on foam production and stability. Colloid. Surf. B. Biointerf. 2008, 63, 21–26. [Google Scholar] [CrossRef]
- Davenport, R.; Curtis, T.; Goodfellow, M.; Stainsby, F.; Bingley, M. Quantitative use of fluorescent in situ hybridization to examine relationships between mycolic acid-containing actinomycetes and foaming in activated sludge plants. Appl. Environ. Microbiol. 2000, 66, 1158. [Google Scholar] [CrossRef] [PubMed]
- Kerley, S.; Forster, C. Extracellular polymers in activated sludge and stable foams. J. Chem. Technol. Biotechnol. 1995, 62, 401–404. [Google Scholar] [CrossRef]
- Nam, S.; Chun, J.; Kim, S.; Kim, W.; Zakrzewska-Czerwinska, J.; Goodfellow, M. Tsukamurella spumae sp. nov., a novel actinomycete associated with foaming in activated sludge plants. Syst. Appl. Microbiol. 2003, 26, 367–375. [Google Scholar] [CrossRef] [PubMed]
- Nakajima, J.; Mishima, I. Measurement of foam quality of activated sludge in MBR process. Acta Hydroch. Hydrob. 2005, 33, 232–239. [Google Scholar] [CrossRef]
- Lemmer, H.; Lind, G.; Müller, E.; Schade, M.; Ziegelmayer, B. Scum in activated sludge plants: Impact of non-filamentous and filamentous bacteria. Acta Hydroch. Hydrob. 2000, 28, 34–40. [Google Scholar] [CrossRef]
- Guitián, J.; Joseph, D. Foaminess Measurements Using A Shaker Bottle; Department of Aerospace Engineering and Mechanics, University of Minnesota: Minneapolis, MN, July 1996. [Google Scholar]
- Pugh, R. Foaming, foam films, antifoaming and defoaming. Adv. Colloid Interface Sci. 1996, 64, 67–142. [Google Scholar] [CrossRef]
- Soddell, J.; Seviour, R. Microbiology of foaming in activated sludge plants. J. Appl. Microbiol. 1990, 69, 145–176. [Google Scholar]
- Müller, E.; Lind, G.; Lemmer, H.; Wilderer, P. Population structure and chemical EPS analyses of activated sludge and scum. Acta Hydroch. Hydrob. 2005, 33, 189–196. [Google Scholar] [CrossRef]
- Nielsen, P.; Roslev, P.; Dueholm, T.; Nielsen, J. Microthrix parvicella, a specialized lipid consumer in anaerobic-aerobic activated sludge plants. Water Sci. Technol. 2002, 46, 73. [Google Scholar] [PubMed]
- Stratton, H.; Brooks, P.; Griffiths, P.; Seviour, R. Cell surface hydrophobicity and mycolic acid composition of Rhodococcus strains isolated from activated sludge foam. J. Ind. Microbiol. Biotechnol. 2002, 28, 264–267. [Google Scholar] [CrossRef] [PubMed]
- Wanner, J. Stable foams and sludge bulking: the largest remaining problems (Abridged). Water Environ. J. 1998, 12, 368–374. [Google Scholar] [CrossRef]
- Blackall, L.; Marshall, K. The mechanism of stabilization of actinomycete foams and the prevention of foaming under laboratory conditions. J. Ind. Microbiol. Biotechnol. 1989, 4, 181–187. [Google Scholar]
- Pugh, R. Experimental techniques for studying the structure of foams and froths. Adv. Colloid Interface Sci. 2005, 114, 239–251. [Google Scholar] [CrossRef] [PubMed]
- Uysal, A.; Türkman, A. Effect of biosurfactant on 2, 4-dichlorophenol biodegradation in an activated sludge bioreactor. Process Biochem. 2005, 40, 2745–2749. [Google Scholar] [CrossRef]
- Jenkins, D.; Richard, M.; Daigger, G. Manual on the Causes and Control of Activated Sludge Bulking, Foaming, and Other Solids Separation Problems, 3rd ed.; IWA Publishing: London, UK, 2004; pp. 132–147. [Google Scholar]
- Di Bella, G.; Torregrossa, M.; Viviani, G. The role of EPS concentration in MBR foaming: Analysis of a submerged pilot plant. Bioresour. Technol. 2011, 102, 1628–1635. [Google Scholar] [CrossRef] [PubMed]
- Pujol, R.; Duchene, P.; Schetrite, S.; Canler, J. Biological foams in activated sludge plants: characterization and situation. Water Res. 1991, 25, 1399–1404. [Google Scholar] [CrossRef]
- Comas, J.; Rodríguez-Roda, I.; Gernaey, K.; Rosén, C.; Jeppsson, U.; Poch, M. Risk assessment modelling of microbiology-related solids separation problems in activated sludge systems. Environ. Model. Software 2008, 23, 1250–1261. [Google Scholar] [CrossRef]
- Wilson, A. Experimental techniques for the characterization of foams. In Foams: Theory, Measurements, and Applications; Prud’homme, R.K., Khan, A.D., Eds.; Marcel Dekker: New York, NY, USA, 1995; p. 243. [Google Scholar]
- Ekserova, D.R.; Kruglëiìakov, P.M. Foam and Foam Films : Theory, Experiment, Application; MÖbius, D., Miller, R., Eds.; Elsevier: Amsterdam, The Netherlands, 1998; pp. 556–561. [Google Scholar]
- Weaire, D.L.; Hutzler, S. The Physics of Foams; Clarendon Press: Oxford, UK, 1999; pp. 51–52. [Google Scholar]
- Sebba, F. Foams and Biliquid Foams—Aphrons; Wiley: Chichester, UK, 1987; p. 30. [Google Scholar]
- Kelly, W.; Borza, P. Foam test method. J. Am. Oil Chem. Soc. 1966, 43, 364–365. [Google Scholar] [CrossRef]
- Lunkenheimer, K.; Malysa, K. Simple and generally applicable method of determination and evaluation of foam properties. J. Surfactants Deterg. 2003, 6, 69–74. [Google Scholar] [CrossRef]
- Pinazo, A.; Pérez, L.; Infante, M.; Franses, E. Relation of foam stability to solution and surface properties of gemini cationic surfactants derived from arginine. Colloids Surf. Physicochem. Eng. Aspects 2001, 189, 225–235. [Google Scholar] [CrossRef]
- Ross, J.; Miles, G. An apparatus for comparison of foaming properties of soaps and detergents. J. Am. Oil Chem. Soc. 1941, 18, 99–102. [Google Scholar]
- Schramm, L. Emulsions, Foams, and Suspensions: Fundamentals and Applications; Wiley-VCH: Weinheim, Germany, 2005; p. 41. [Google Scholar]
- Bikerman, J. The unit of foaminess. Trans. Faraday Soc. 1938, 34, 634–638. [Google Scholar] [CrossRef]
- Baniel, A.; Fains, A.; Popineau, Y. Foaming properties of egg albumen with a bubbling apparatus compared with whipping. J. Food Sci. 1997, 62, 377–381. [Google Scholar] [CrossRef]
- Malysa, K.; Krasowska, M.; Krzan, M. Influence of surface active substances on bubble motion and collision with various interfaces. Adv. Colloid Interface Sci. 2005, 114, 205–225. [Google Scholar] [CrossRef] [PubMed]
- Kato, A.; Takahashi, A.; Matsudomi, N.; Kobayashi, K. Determination of foa ming properties of proteins by conductivity measurements. J. Food Sci. 1983, 48, 62–65. [Google Scholar] [CrossRef]
- Sezgin, M.; Jenkins, D.; Parker, D. A unified theory of filamentous activated sludge bulking. J. Water Pollut. Contr. Fed. 1978, 50, 362–381. [Google Scholar]
- De los Reyes, F.; Raskin, L. Role of filamentous microorganisms in activated sludge foaming: relationship of mycolata levels to foaming initiation and stability. Water Res. 2002, 36, 445–459. [Google Scholar] [CrossRef] [PubMed]
- Kocianova, E.; Foot, R.; Forster, C. Physicochemical aspects of activated sludge in relation to stable foam formation. Water Environ. J. 1992, 6, 342–350. [Google Scholar] [CrossRef]
- Pretorius, W.; Laubscher, C. Control of biological scum in activated sludge plants by means of selective flotation. Water Sci. Technol. 1987, 19, 1003. [Google Scholar]
- Goddard, A.; Forster, C. Stable foams in activated sludge plants. Enzyme Microb. Technol. 1987, 9, 164–168. [Google Scholar] [CrossRef]
- Khan, A.; Kocianova, E.; Forster, C. Activated sludge characteristics in relation to stable foam formation. J. Chem. Technol. Biotechnol. 1991, 52, 383–392. [Google Scholar] [CrossRef]
- Hladikova, K.; Ruzickova, I.; Klucova, P.; Wanner, J. An investigation into studying of the activated sludge foaming potential by using physicochemical parameters. Water Sci. Technol. 2002, 46, 525. [Google Scholar] [PubMed]
- Torregrossa, M.; Viviani, G.; Vinci, V. Foaming estimation tests in activated sludge systems. Acta Hydroch. Hydrob. 2005, 33, 240–246. [Google Scholar] [CrossRef]
- Ho, C.F.; Jenkins, D. The effect of surfactants on Nocadia foaming in activated sludge. Water Sci. Technol. 1991, 23, 879–887. [Google Scholar]
- Vega-Rodriquez, B.A. Evaluation of Nocardia spp. Presence in Activated Sludge. M.S. Thesis, University of California, Berkley, CA, USA, 1983. [Google Scholar]
- Jolis, D.; Mitch, A.; Marneri, M.; Ho, C. Effects of anaerobic selector hydraulic retention time on biological foam control and en hanced biological phosphorus removal in a pure-oxygen activated sludge system. Water Environ. Res 2007, 79, 472–478. [Google Scholar] [CrossRef] [PubMed]
- Lee, J.; Cha, D.; Kim, I.; Son, A.; Ahn, K. Fatty Acid Methyl Ester (FAME) Technology for Monitoring Biological Foaming in Acivated Sludge: Full Scale Plant Verification. Environ. Technol. 2008, 29, 199–206. [Google Scholar] [CrossRef] [PubMed]
- Oerther, D.; De Los Reyes, F. Quantifying filamentous microorganisms in activated sludge before, during, and after an incident of foaming by oligonucleotide probe hybridizations and antibody staining. Water Res. 2001, 35, 3325–3336. [Google Scholar] [CrossRef] [PubMed]
- Paris, S.; Lind, G.; Lemmer, H.; Wilderer, P. Dosing aluminum chloride to control Microthrix parvicella. Acta Hydroch. Hydrob. 2005, 33, 247–254. [Google Scholar] [CrossRef]
- Tsang, Y.; Sin, S.; Chua, H. Nocardia foaming control in activated sludge process treating domestic wastewater. Bioresour. Technol. 2008, 99, 3381–3388. [Google Scholar] [CrossRef] [PubMed]
- Blackall, L.; Harbers, A.; Greenfield, P.; Hayward, A. Activated sludge foams: effects of environmental variables on organism growth and foam formation. Environ. Technol. 1991, 12, 241–248. [Google Scholar] [CrossRef]
- American Public Health Association. Standard Methods for the Examination of Water and Wastewater, 20th ed.; APHA (American Public Health Association): Washington, DC, USA, 1998. [Google Scholar]
- BS1752- Laboratory Sintered (Fritted) Filters—Porosity Grading; British Standard Institution: London, UK, 1983.
- Cohen, B.; Lea, R. Essentials of Statistics for the Social and Behavioral Sciences; Wiley: Hoken, NJ, USA; pp. 130–137.
- Faul, F.; Erdfelder, E.; Lang, A.; Buchner, A. G* Power 3: A flexible statistical power analysis program for the social, behavioral, and biomedical sciences. Behav. Res. Methods 2007, 39, 175–191. [Google Scholar] [CrossRef] [PubMed]
- Caulcutt, R.; Boddy, R. Statistics for Analytical Chemists; Chapman and Hall: London, UK, 1983; p. 44. [Google Scholar]
- Sokal, R.; Rohlf, F. The Principles and Practice of Statistics in Biological Research, 3rd ed.; Freeman and Co: New York, NY, USA, 1995; pp. 261–264. [Google Scholar]
- von Sperling, M. Basic Principles of Wastewater Treatment, 2nd ed.; IWA Publishing: London, UK, 2007; p. 151. [Google Scholar]
© 2011 by the authors; licensee MDPI, Basel, Switzerland. This article is an open access article distributed under the terms and conditions of the Creative Commons Attribution license (http://creativecommons.org/licenses/by/3.0/).
Share and Cite
MDPI and ACS Style
Fryer, M.; O’Flaherty, E.; Gray, N.F. Evaluating the Measurement of Activated Sludge Foam Potential. Water 2011, 3, 424-444. https://doi.org/10.3390/w3010424
AMA Style
Fryer M, O’Flaherty E, Gray NF. Evaluating the Measurement of Activated Sludge Foam Potential. Water. 2011; 3(1):424-444. https://doi.org/10.3390/w3010424
Chicago/Turabian StyleFryer, Martin, Eoghan O’Flaherty, and Nicholas F. Gray. 2011. "Evaluating the Measurement of Activated Sludge Foam Potential" Water 3, no. 1: 424-444. https://doi.org/10.3390/w3010424