1. Introduction
In Iran, surface water is frequently used to produce potable water. However, due to droughts, the use of groundwater for the production of potable water is currently increasing. Over the past decades, seawater has become an important source of fresh water [
1] due to changing weather patterns, increased industrialization and recent population increases in areas where local supplies of high-quality fresh water are less than adequate.
A nanofiltration membrane is a type of pressure-driven membrane that has properties in between those of ultrafiltration and reverse osmosis membranes. Nanofiltration membranes have the advantages of providing a high water flux at low operating pressure and maintaining a high salt and organic matter rejection rate [
2]. The nanofiltration process has the benefits of ease of operation, reliability and comparatively low energy consumption [
3] as well as highly efficient pollutant removal. This helps to minimize scale formation on the equipment involved in both reverse osmosis and thermal desalination processes. Therefore, nanofiltration membranes have received interest worldwide.
Recently, nanofiltration membranes have been employed in pre-treatment unit operations in both thermal and membrane seawater desalination processes. This has resulted in a reduction in chemicals used in pre-treatment processes as well as a decrease in the energy consumption and water production costs and, therefore, has led to more environmentally friendly processes. To predict nanofiltration membrane performance, a systematic study on the filtration performance of selected commercial nanofiltration membranes against brackish water and seawater is required.
Schaep
et al. [
4] studied the reduction in hardness in groundwater achieved by nanofiltration membranes. In their experiments, a cross-flow filtration cell containing flat sheet membranes was used. They studied three commercial nanofiltration membranes and concluded that the performance of the UTC20 nanofiltration membrane for reducing hardness was better than that of the NF70 and UTC60 nanofiltration membranes. At 10 bar transmembrane pressure the calcium retention for UTC20 nanofiltration was 96%.
Gorenflo
et al. [
5] examined the nanofiltration of German groundwater with high hardness and natural organic matter (NOM) content. They used NF200B nanofiltration with 5.5 bar transmembrane pressure and a water recovery rate between 60% and 85%. Their results showed almost complete rejection (>95%) of NOM. Due to the high concentration of SO
42− present and presumably due to the complexation of Ca
2+ with humic substances, the rejection of Ca
2+ and Mg
2+ was unexpectedly high (~74% and >86%, respectively) compared to a pure CaCl
2 solution (R(CaC1) ~45%).
Orecki
et al. [
6] studied surface water treatment by nanofiltration. They used a composite membrane, AFC30, with cross-flow and transmembrane pressure between 10–25 bar in their experiments. They concluded that the use of nanofiltration for treating surface water can remove completely total organic carbon (TOC) and reduce the sulfate content by approximately 90–99%, the carbonate content by 82% and the monovalent salt content by approximately 40–55%. Furthermore, their study demonstrated a significant reduction in inorganic carbon (62.8%), electrical conductivity (68.4%) and total hardness (85.2%).
Ghizellaoui
et al. [
7] studied the softening of drinking water of Constantine (Algeria), city supplied by underground and surface water using NanoMax-50 nanofiltration membranes. They studied the effects of pressure, flow rate and temperature on the nanofiltration performance. The maximum transmembrane pressure was 2 bar. The results indicated that the retention of both cations and anions increased with the applied pressure. The retention of divalent cations (Ca
2+ and Mg
2+) was higher than that of monovalent cations (Na
+ and K
+).
Ghizellaoui
et al. [
8] studied the use of nanofiltration for partial softening of very hard water. Their study was based on the elimination of one aspect of the temporary hardness of Hamma underground water, which provides drinking water for Constantine City. Two techniques were used to obtain a partial softening based on applying weak pressure (0.5, 1, 2 bar) or relatively high pressure (4–16 bar) to feed water. Rates of retention reached 50% for Ca
2+ and 40% for HCO
3− at relatively high pressures and 34% for Ca
2+ and 30% for HCO
3− at low pressures.
To determine the suitability of nanofiltration as a pre-treatment unit operation in the desalination process, Hilal
et al. [
9] used three commercial nanofiltration membranes (NF90, NF270, N30F) to treat highly concentrated (NaCl) salt solutions, with concentrations ranging from 5,000 to 25,000 ppm, a salinity level similar to that of sea water. The main parameters considered were the feed pressure and salt concentration. The results showed that the rejection of NaCl and the flux for all membranes increased linearly with the trans-membrane pressure and decreased with the salt concentration. For a salinity of 5,000 ppm and a pressure of 9 bar, the experimental results showed that NF90 could achieve a salt rejection of up to 95%, whereas its rejection dropped to 41% at a salinity of 25,000 ppm and the same pressure.
Costa and de Pinho [
10] studied the performance and estimated cost of nanofiltration for surface water treatment in drinking water production. The spiral-wound Filmtec NF200B-400 membrane, with a molecular weight cutoff (MWCO) of 200 Da, was used in the nanofiltration experiments. Their nanofiltration experiments were conducted in total recirculation and concentration mode. In total recirculation mode the transmembrane pressure was 5–25 bar. Finally the 6 bar transmembrane pressure was chosen for operation of nanofiltration plant. The membrane was characterized in terms of its hydraulic permeability and solute rejection. The solutes studied were sucrose, glucose and the salts NaCl, CaCl
2 and MgSO
4. The retention coefficients for these substances were found to be 94%, 97%, 55%, 64% and 98%, respectively. Furthermore, the retention coefficient of salts for Tagus River water was found to be 86%, and sulfate ions and total organic carbon (TOC) were completely retained by this membrane.
Recently Galanakis
et al. [
11] performed nanofiltration of brackish groundwater by using a poly-piperazine membrane. They used cross flow nanofiltration module and low transmembrane pressure (6–10 bar). Their samples have hardness and salinity values up to 762 mg CaCO
3 and 1,803 mg NaCl/L, respectively. Their results showed that this nanofiltration membrane could remove 70–76% of hardness and 44–66% of salinity.
Because properties of groundwater near the coast are close to diluted sea water, in this study we attempt to produce drinking water from groundwater near the coast. Therefore the ability of a commercial nanofiltration membrane manufactured by CSM Co. (S. Korea), NE4040-90, to retain hardness and ions in three samples of diluted seawater (Persian Gulf) was studied, and the effects of the trans-membrane pressure on the permeate flux and the retention coefficient of hardness and various ions were investigated.
2. Materials and Methods
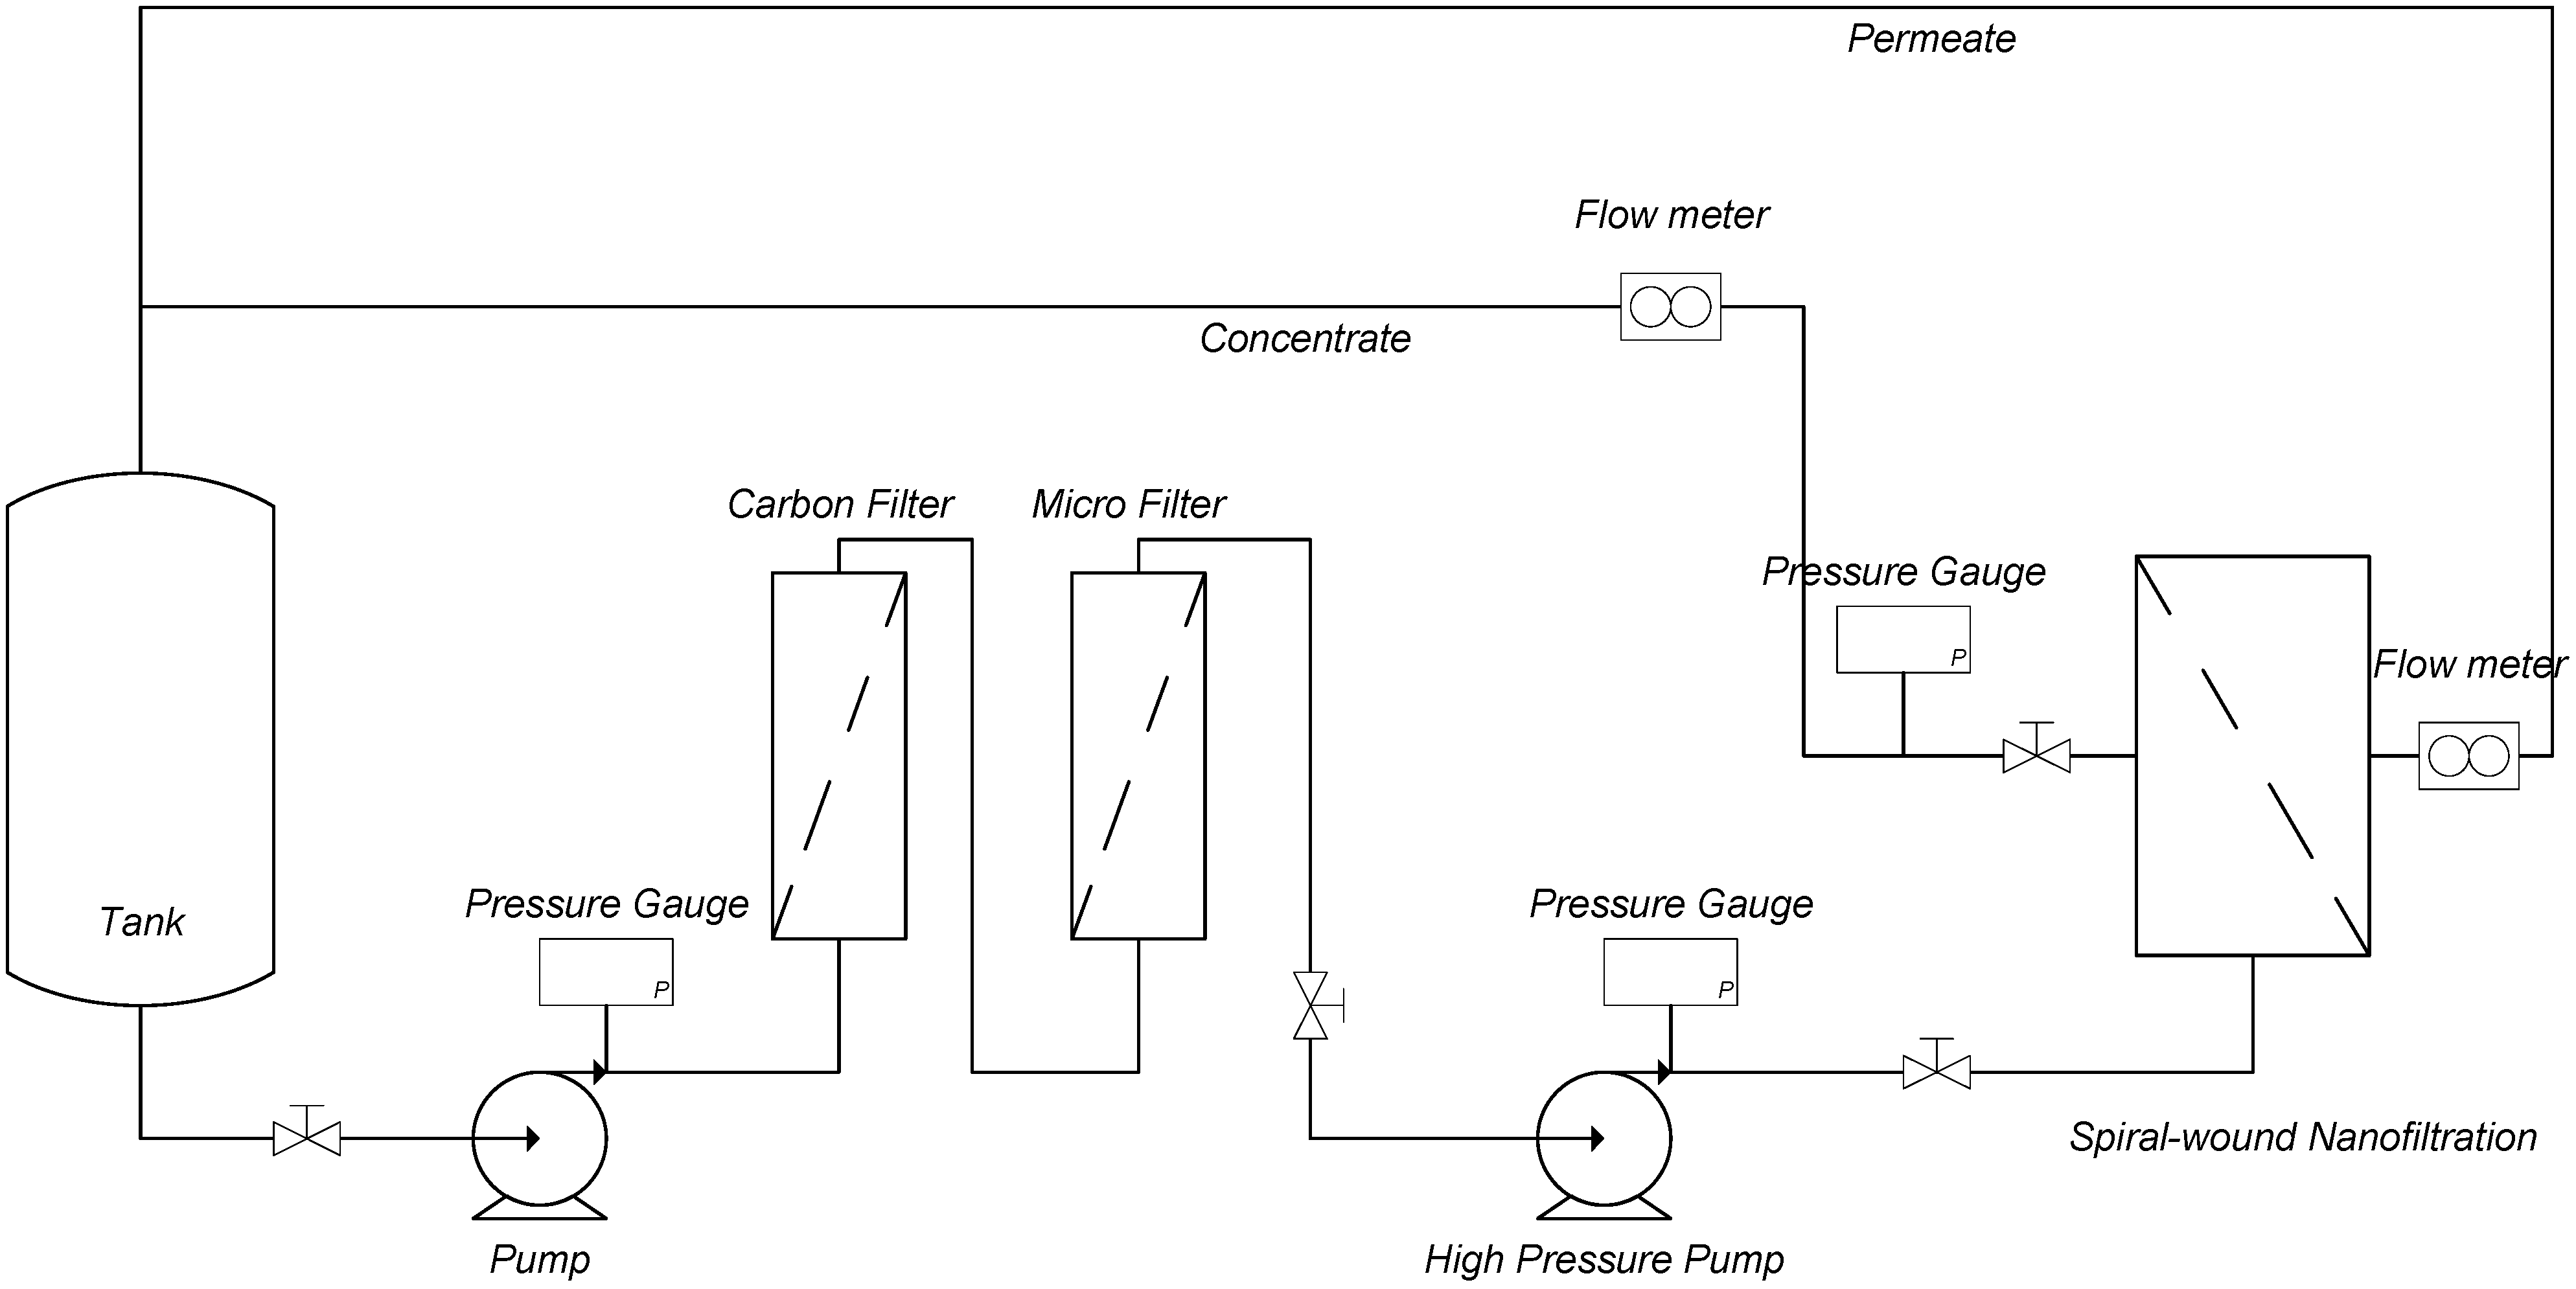
The experimental setup included a tank, a pump for feeding the sample water, a carbon filter and a micro filter for pre-treatment of the inlet water, a high-pressure pump for producing trans-membrane pressure, a high-pressure holder for the nanofiltration membrane, two flow meters for measuring the permeate and retentate, and three pressure gauges. A schematic diagram of the experimental setup is shown in
Figure 1.
Figure 1.
Schematic of the experimental setup.
Figure 1.
Schematic of the experimental setup.
A spiral-wound nanofiltration membrane manufactured by CSM Co. (Seoul, South Korea), NE4040-90, with dimensions of 10.16 × 101.6 cm (4 × 40 in), an effective membrane area of 7.9 m2 (85 ft2), a monovalent ion (NaCl) rejection rate of 85–95% and a divalent ion (CaCl2) rejection rate of 90–95% was used. The experiments were carried out at ambient temperature in total re-circulation mode, i.e., both the concentrate and the permeate streams were re-circulated into the feed tank. The volume of the feed tank was 500 liters. It was filled with about 400 liters of initial samples. The volume of water in the remainder of experimental setup was about 10 liters. Re-circulating the concentrate and the permeate streams into the feed tank maintained constant concentration of the feed. The trans-membrane pressure and volumetric flow rate were adjusted using the concentrate (reject) outlet valve.
The seawater was diluted with drinking water of Bushehr city. Its calcium and magnesium concentration were 254 mg/L and 34 mg/L. This diluted sea water was used throughout the experiments. Before beginning experiments, an initial sample was taken from the feed tank and analyzed. During the experiments, samples were taken from the permeate stream at different pressure.
All analyses on initial samples and permeates were carried out at the Bushehr Department of Water Treatment Works and Laboratory. Electrical conductivity (EC), salinity and total dissolved solid (TDS) were measured by a JENWAY conductivity meter model 4320. Ca
2+ and Mg
2+ and total hardness were indicated by titration with ethylenediaminetetraacetic acid (EDTA). Turbidity and pH were measured by Hach turbidity meter model 2100p and EcoMet P25 pH meter, respectively [
12].
3. Results and Discussion
Experiments were carried out with three samples of diluted seawater (Persian Gulf). If concentration of TDS, total hardness and salinity are higher than the values for sample 1, the transmembrane pressure must be greater than 10 bar. Because the experiments were performed at transmembrane pressures less than 10 bar, these three samples was studied.
An analysis of the initial samples and permeates at various pressures is presented in
Table 1,
Table 2,
Table 3.
Table 1.
Analysis of the feed and permeates at various pressures (Sample 1).
Table 1.
Analysis of the feed and permeates at various pressures (Sample 1).
| Analyzed Parameter | Initial | Permeate | Permeate | Permeate | Standard value for potable water |
|---|
| at 8 bar | at 9 bar | at 10 bar |
|---|
| pH | 8.07 | 8.21 | 8.38 | 8.41 | 6.5–9 |
| Electrical Conductivity (µS/cm) | 16,260 | 3,410 | 2,910 | 2,890 | – |
| TDS (mg/L) | 9,750 | 2,050 | 1,744 | 1,732 | 1,500 |
| Turbidity (NTU) | 0.8 | 0.3 | 0.4 | 0.5 | 5 |
| Total Hardness (mg/L CaCO3) | 2,940 | 104 | 68 | 76 | 500 |
| Salinity (g/L) | 7.7 | 1.5 | 1.3 | 1.3 | 0.5 |
| Ca2+ (mg/L) | 384 | 12.8 | 11.2 | 8 | 250 |
| Mg2+ (mg/L) | 475.2 | 17.28 | 9.6 | 13.44 | 50 |
Table 2.
Analysis of the feed and permeates at various pressures (Sample 2).
Table 2.
Analysis of the feed and permeates at various pressures (Sample 2).
| Analyzed Parameter | Initial | Permeate | Permeate | Permeate | Standard value for potable water |
|---|
| at 6 bar | at 8 bar | at 10 bar |
|---|
| pH | 8.06 | 8.3 | 8.26 | 8.19 | 6.5–9 |
| Electrical Conductivity (µS/cm) | 12,080 | 2,180 | 1,520 | 1,580 | - |
| TDS (mg/L) | 7,220 | 1,311 | 912 | 948 | 1,500 |
| Turbidity (NTU) | 0.51 | 0.45 | 0.34 | 0.27 | 5 |
| Total Hardness (mg/L CaCO3) | 2,180 | 56 | 52 | 48 | 500 |
| Salinity (g/L) | 5.4 | 1.1 | 0.8 | 0.9 | 0.5 |
| Ca2+ (mg/L) | 296 | 8 | 6.4 | 6.4 | 250 |
| Mg2+ (mg/L) | 345.6 | 8.64 | 8.64 | 7.68 | 50 |
Table 3.
Analysis of the feed and permeates at various pressures (Sample 3).
Table 3.
Analysis of the feed and permeates at various pressures (Sample 3).
| Analyzed Parameter | Initial | Permeate | Permeate | Permeate | Standard value for potable water |
|---|
| at 4 bar | at 6 bar | at 8 bar |
|---|
| pH | 7.69 | 7.82 | 8.01 | 8.15 | 6.5–9 |
| Electrical Conductivity (µS/cm) | 8,280 | 1,459 | 878 | 889 | - |
| TDS (mg/L) | 4,970 | 877 | 527 | 534 | 1,500 |
| Turbidity (NTU) | 0.6 | 0.28 | 0.25 | 0.21 | 5 |
| Total Hardness (mg/L CaCO3) | 1,880 | 64 | 32 | 40 | 500 |
| Salinity (g/L) | 3.6 | 0.8 | 0.6 | 0.6 | 0.5 |
| Ca2+ (mg/L) | 272 | 8 | 4.8 | 6.4 | 250 |
| Mg2+ (mg/L) | 288 | 10.56 | 4.8 | 5.76 | 50 |
As shown for Sample 1, the total hardness was 2,940 mg/L CaCO3 and the salinity was 7.7 g/L; for Sample 2, the total hardness was 2,180 mg/L CaCO3 and the salinity was 5.4 g/L; for Sample 3, the total hardness was 1,880 mg/L CaCO3 and the salinity was 3.6 g/L. The analysis performed on these samples showed that their hardness and salinity characteristics were similar to those of groundwater in the Bushehr province. As mentioned previously the sea water was diluted with drinking water, and due to high calcium level in the drinking water calcium levels in the initial samples did not drop as fast as the electrical conductivity (EC) and TDS. For Sample 1, comparison between analysis of permeate at various pressure and standard values for drinking water showed that TDS for permeate was higher than standard value. Therefore nanofiltration of Sample 1 cannot provide drinking water. For Samples 2, TDS, Ca2+ and Mg2+ level of permeate at 8 bar are less than standard values but salinity level are relatively high. For Sample 3, the results revealed that nanofiltration of this Sample can provide drinking water, although the Ca2+ concentration in the permeate was much less than standard value.
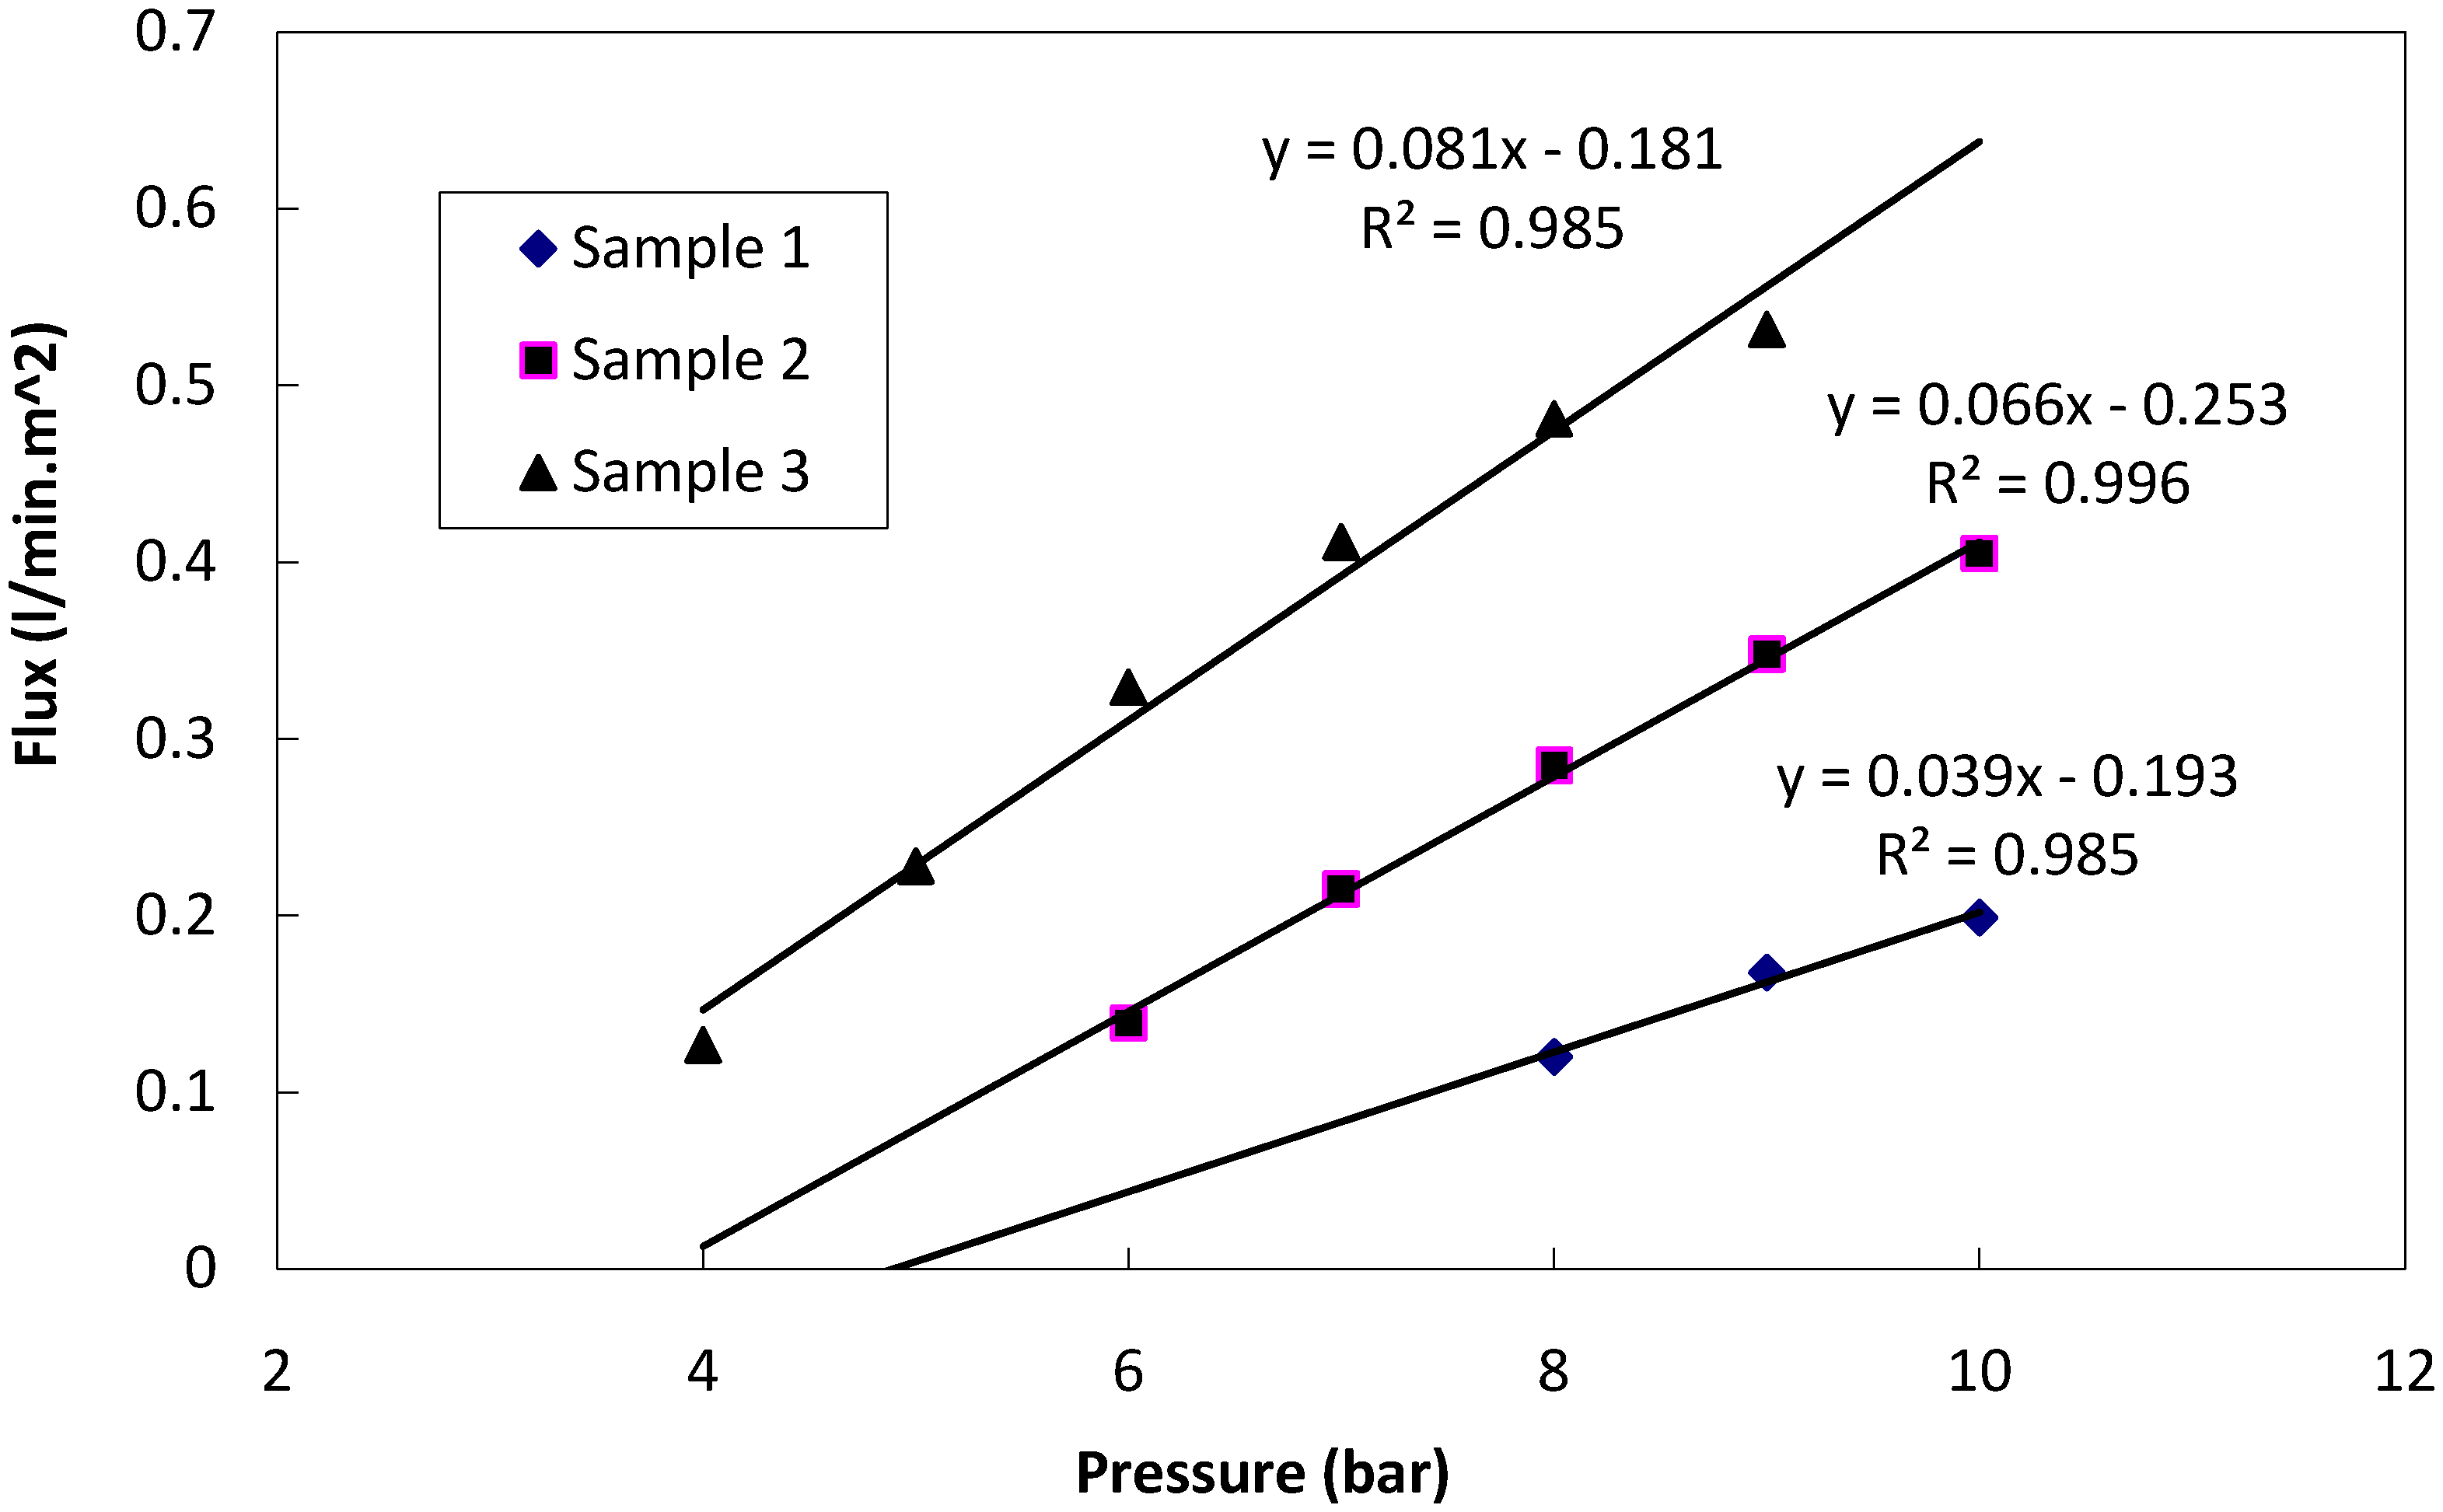
The effect of the trans-membrane pressure on the permeate flux was evaluated. The results are shown in
Figure 2. As shown in this Figure, the permeate flux changed linearly with the trans-membrane pressure, as is common in these systems.
Figure 2.
Permeate flux vs. pressure for the three samples.
Figure 2.
Permeate flux vs. pressure for the three samples.
The retention percentage of various components was calculated by the following equation [
13]:
where
CF and
CP are the concentrations in the feed and permeate, respectively. The retention percentages (%
R) of Ca
2+, Mg
2+, total hardness and TDS at various pressures for three samples are presented in
Table 4,
Table 5,
Table 6 and depicted in
Figure 3,
Figure 4,
Figure 5.
Table 4.
Retention percentage (%R) of TDS, total hardness, Ca2+ and Mg2+ at various pressures for Sample 1.
Table 4.
Retention percentage (%R) of TDS, total hardness, Ca2+ and Mg2+ at various pressures for Sample 1.
| Parameter | Percent retention | Percent retention | Percent retention |
|---|
| at 8 bar | at 9 bar | at 10 bar |
|---|
| TDS | 78.97 | 82.11 | 82.24 |
| Total Hardness | 96.46 | 97.69 | 97.41 |
| Ca2+ | 96.67 | 97.08 | 97.92 |
| Mg2+ | 96.36 | 97.98 | 97.17 |
Table 5.
Retention percentage (%R) of TDS, total hardness, Ca2+ and Mg2+ at various pressures for Sample 2.
Table 5.
Retention percentage (%R) of TDS, total hardness, Ca2+ and Mg2+ at various pressures for Sample 2.
| Parameter | Percent retention | Percent retention | Percent retention |
|---|
| at 6 bar | at 8 bar | at 10 bar |
|---|
| TDS | 81.84 | 87.37 | 86.87 |
| Total Hardness | 97.43 | 97.61 | 97.8 |
| Ca2+ | 97.3 | 97.84 | 97.84 |
| Mg2+ | 97.5 | 97.5 | 97.78 |
Table 6.
Retention percentage (%R) of TDS, total hardness, Ca2+ and Mg2+ at various pressures for Sample 3.
Table 6.
Retention percentage (%R) of TDS, total hardness, Ca2+ and Mg2+ at various pressures for Sample 3.
| Parameter | Percent retention | Percent retention | Percent retention |
|---|
| at 4 bar | at 6 bar | at 8 bar |
|---|
| TDS | 82.35 | 89.4 | 89.26 |
| Total Hardness | 96.6 | 98.3 | 97.87 |
| Ca2+ | 97.06 | 98.24 | 97.65 |
| Mg2+ | 96.33 | 98.33 | 98 |
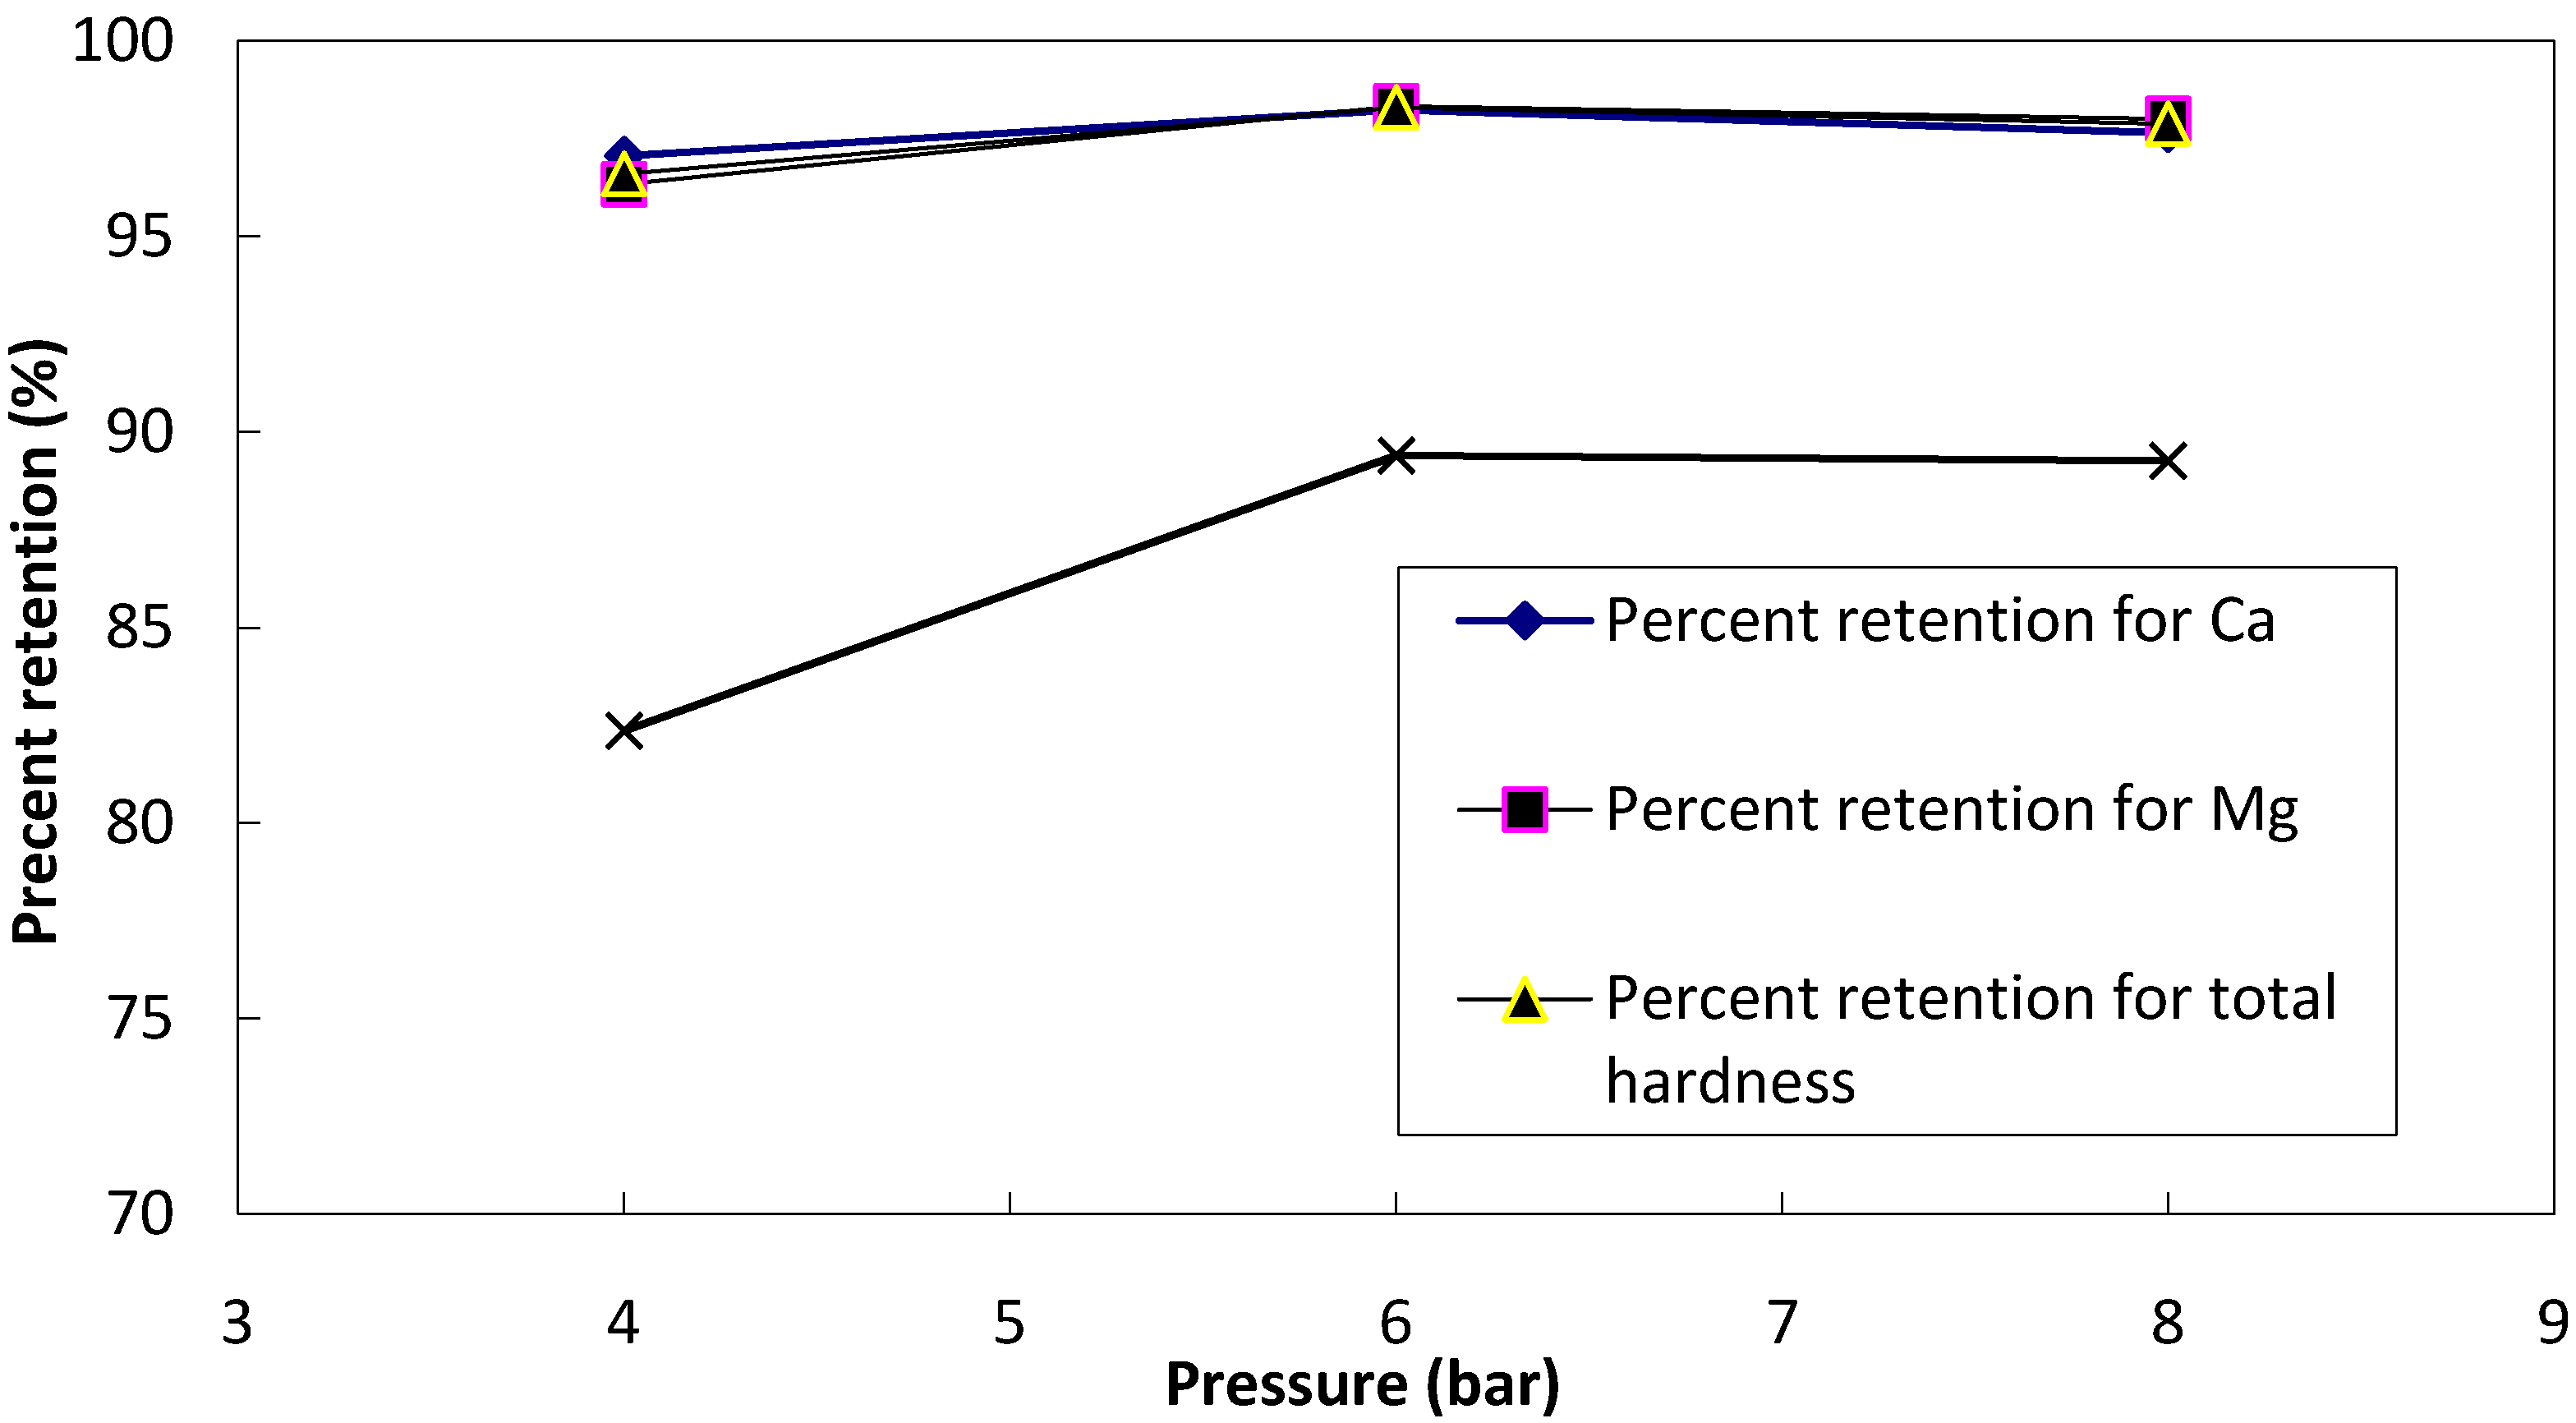
Figure 3.
Retention of Ca2+, Mg2+, total hardness and TDS vs. pressure for Sample 1.
Figure 3.
Retention of Ca2+, Mg2+, total hardness and TDS vs. pressure for Sample 1.
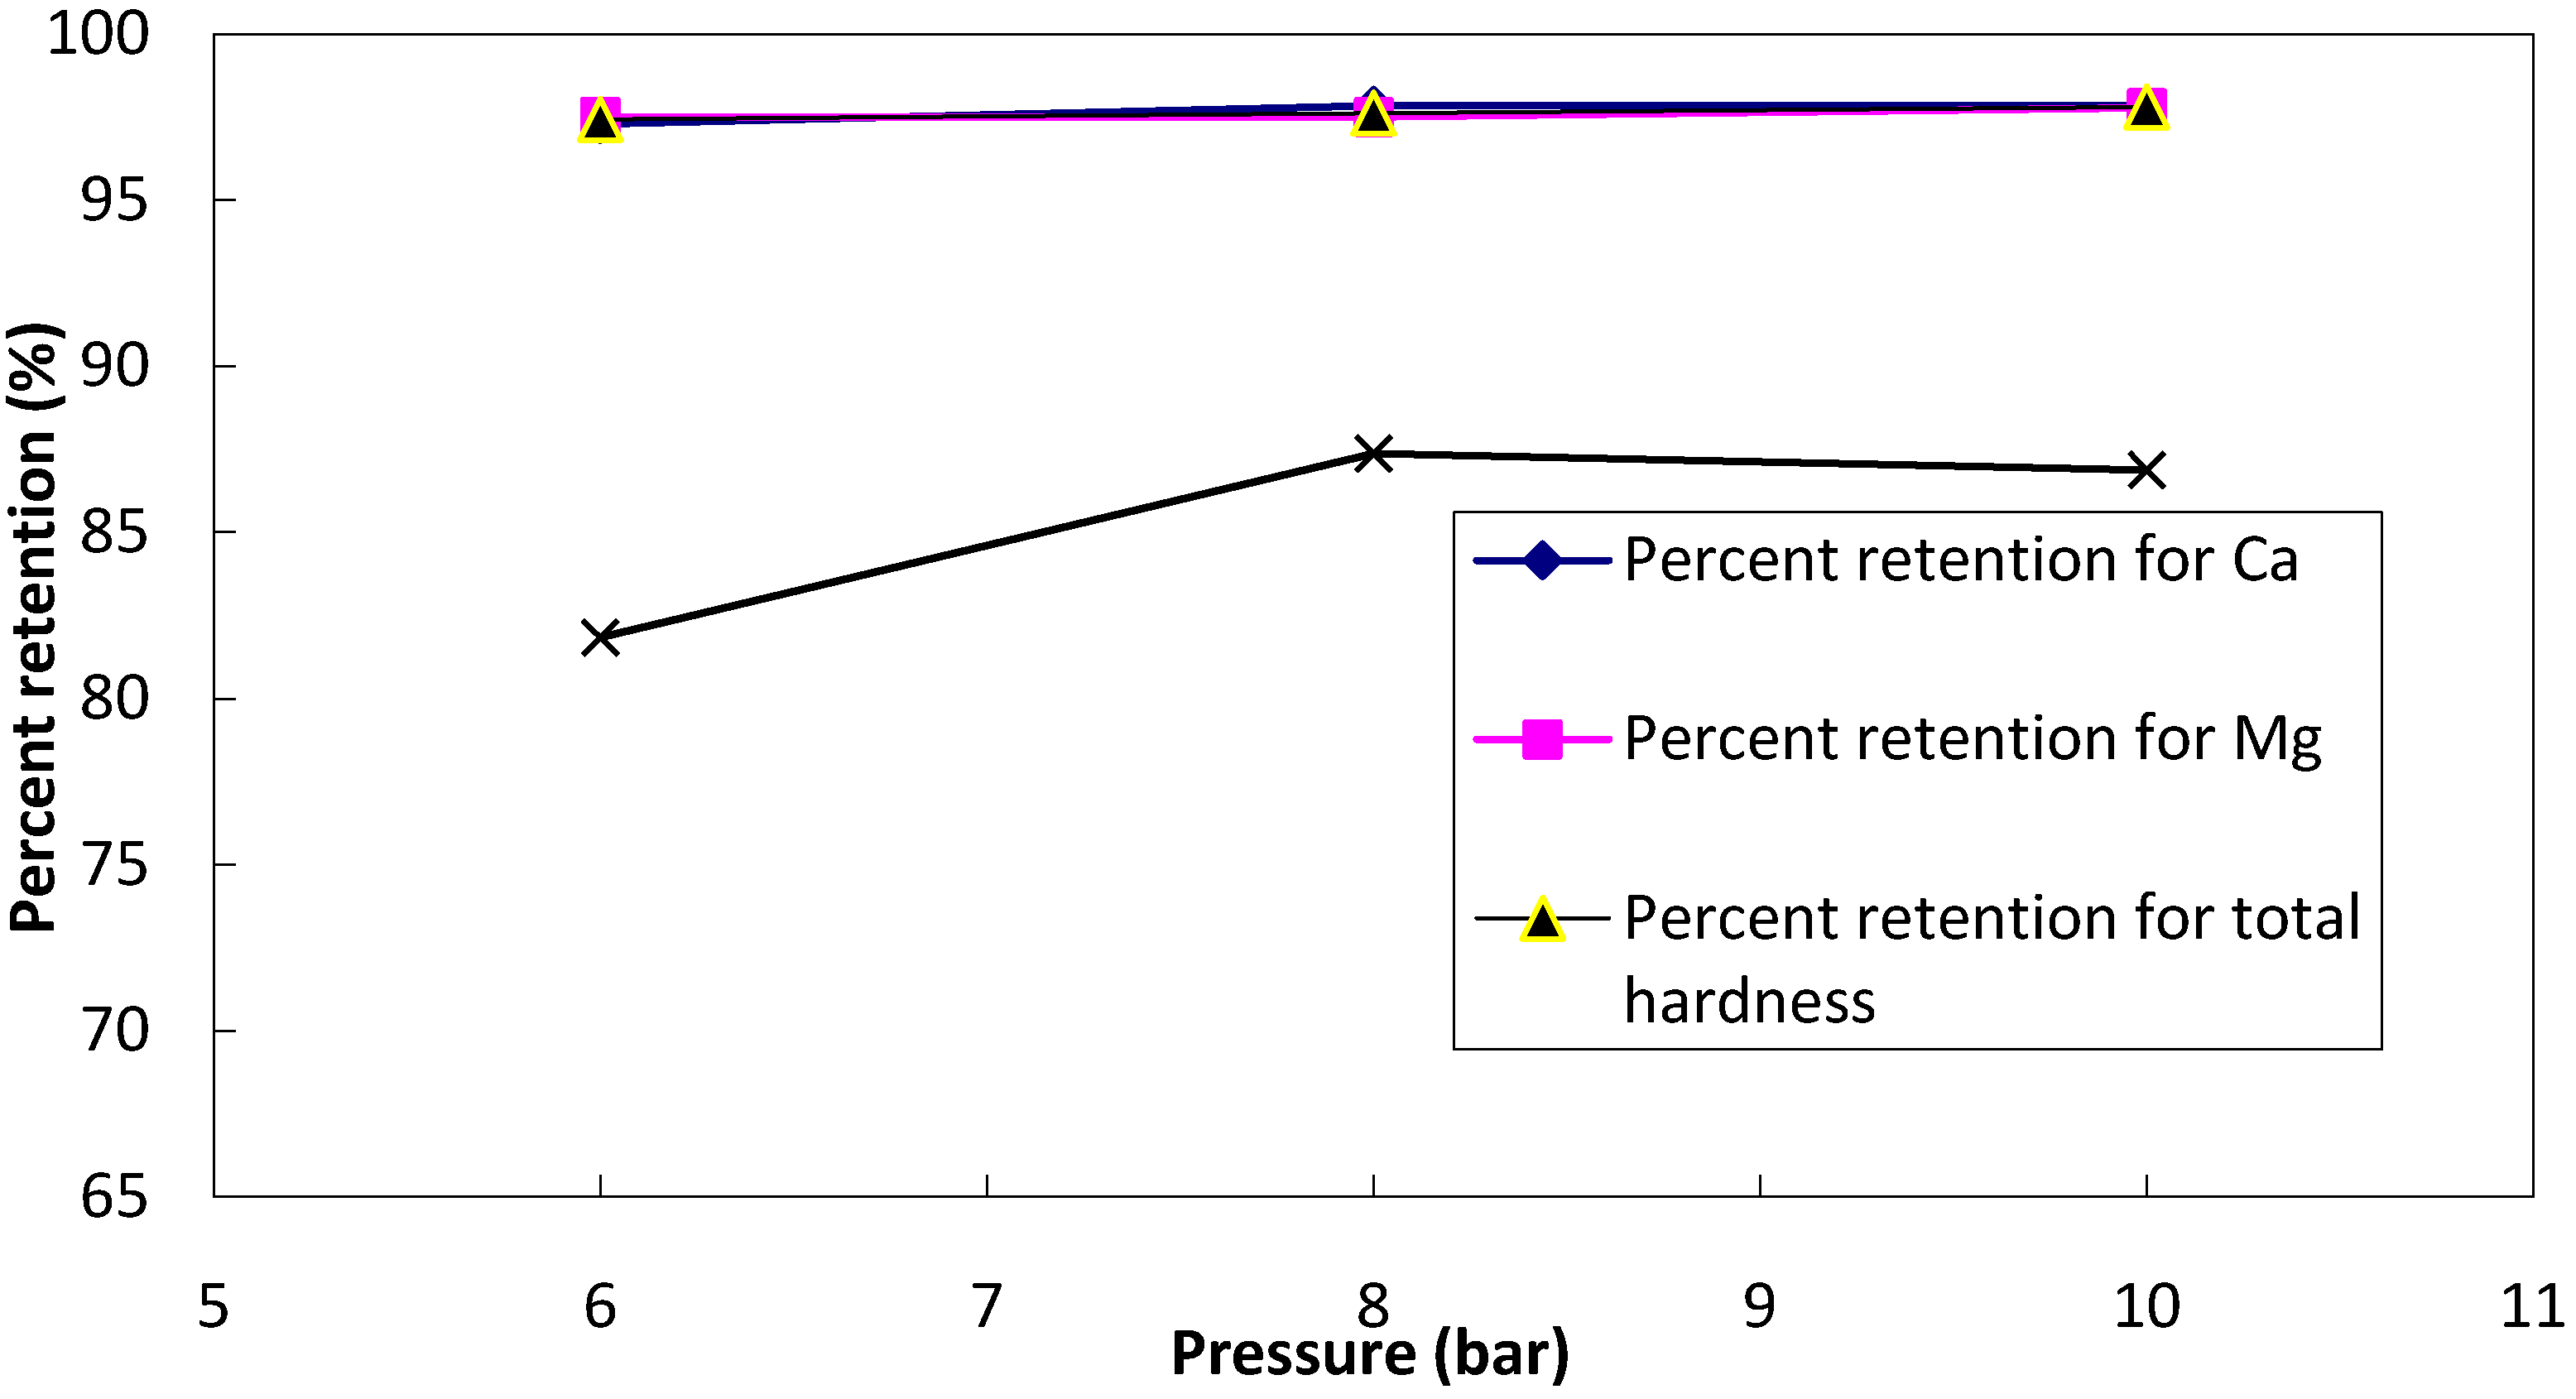
Figure 4.
Retention of Ca2+, Mg2+, total hardness and TDS vs. pressure for Sample 2.
Figure 4.
Retention of Ca2+, Mg2+, total hardness and TDS vs. pressure for Sample 2.
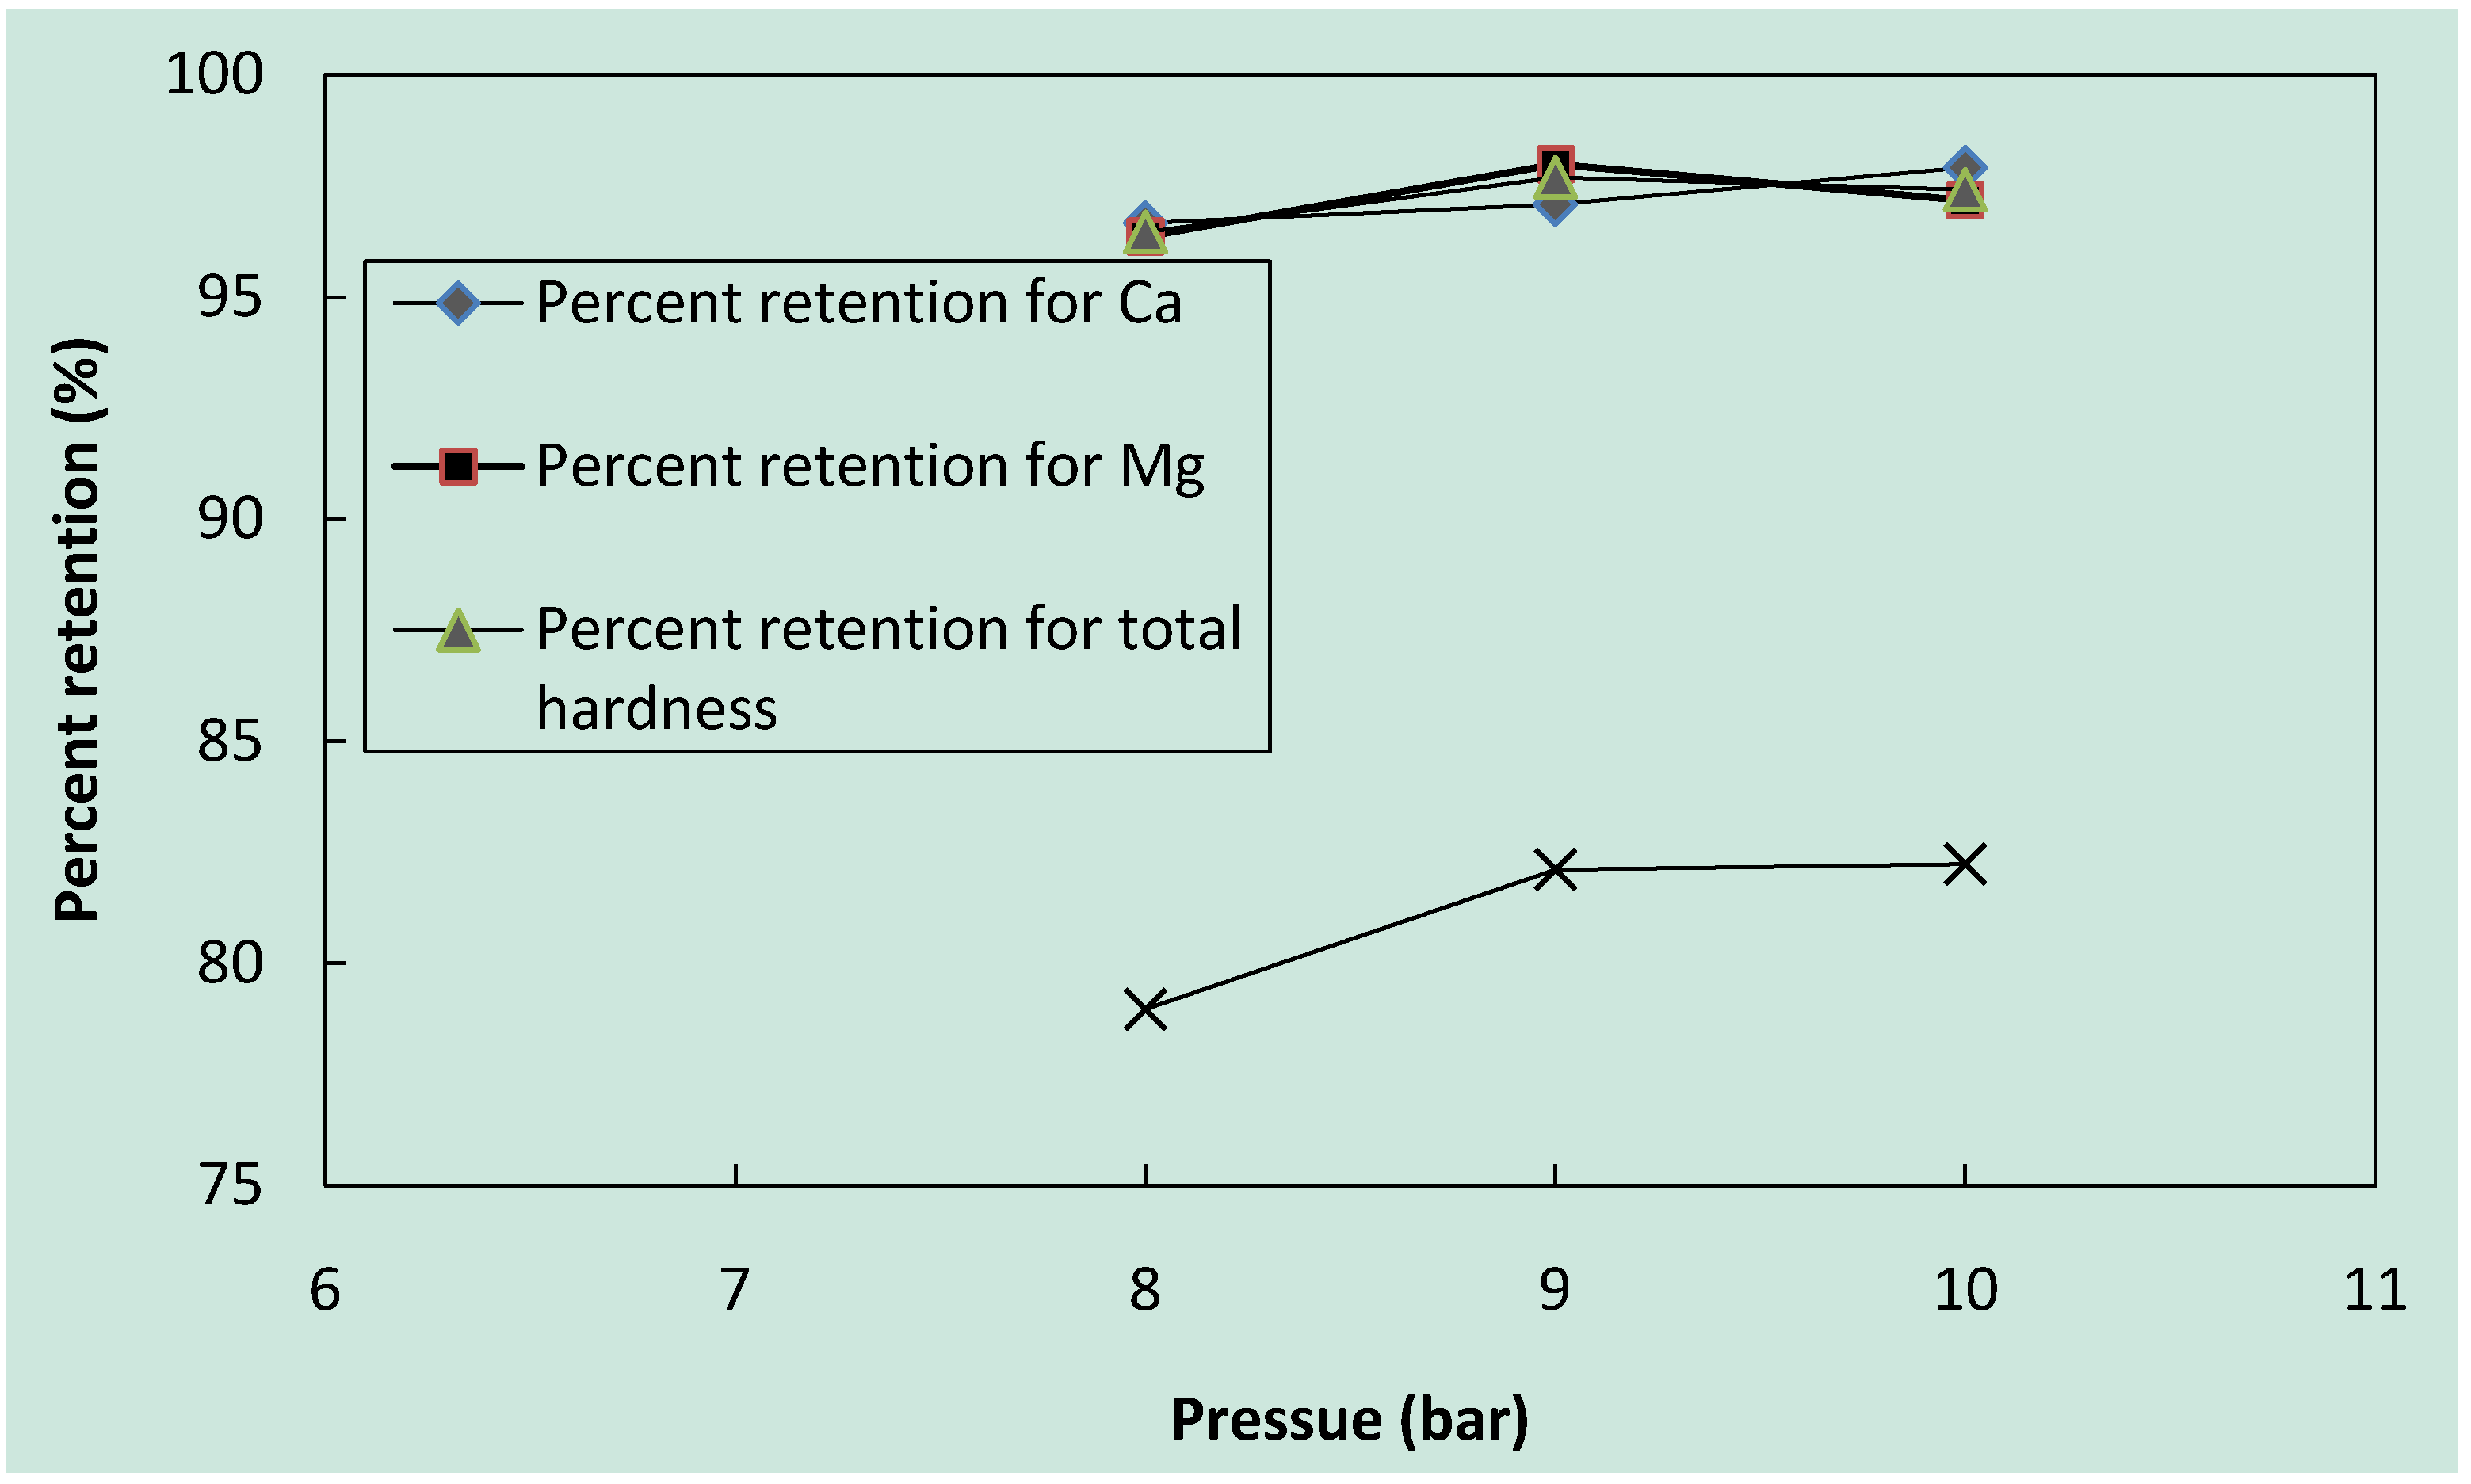
Figure 5.
Retention of Ca2+, Mg2+, total hardness and TDS vs. pressure for Sample 3.
Figure 5.
Retention of Ca2+, Mg2+, total hardness and TDS vs. pressure for Sample 3.
According to
Table 4, for Sample 1, the retention percentages of Ca
2+, Mg
2+ and total hardness at all pressures are higher than 96%, and the retention of TDS at pressures of 9 and 10 bar is higher than 82%. As shown in
Table 5, for Sample 2, the retention percentages of Ca
2+, Mg
2+ and total hardness at all pressures are higher than 97%, and the retention of TDS at pressures of 8 and 10 bar is 87% and 86%, respectively. As can be seen, with increasing pressure, the retention percentage of TDS decreases slightly. Additionally, as presented in
Table 6 for Sample 3, the retention percentages of Ca
2+, Mg
2+ and total hardness at all pressures are higher than 95%, and the retention of TDS at pressures of 6 and 8 bar is approximately 89%. Again, one can see that the retention percentage at 8 bar is slightly lower than that at 6 bar.
Comparison between %
R of Ca
2+ evaluated in this work and those obtained in the literature show that the performance of NE4040-90 nanofiltration to retentive Ca
2+ is similar to UTC20 [
4] (96% %
R of Ca
2+) and better than NF200B [
5] (74%), NanoMax50 [
8] (50%) and NF200B-400 [
10] (64%). The ability of this nanofiltration to retentive Mg
2+ (%
R is 95%) is better than NF200B [
5] (greater than 86%). The results show this nanofiltration can retain 95% of total hardness compared to those reported by Orecki
et al. [
6] 85.2% and Galanakis
et al. [
11] 70–76%.
Table 7,
Table 8,
Table 9 and
Figure 6,
Figure 7,
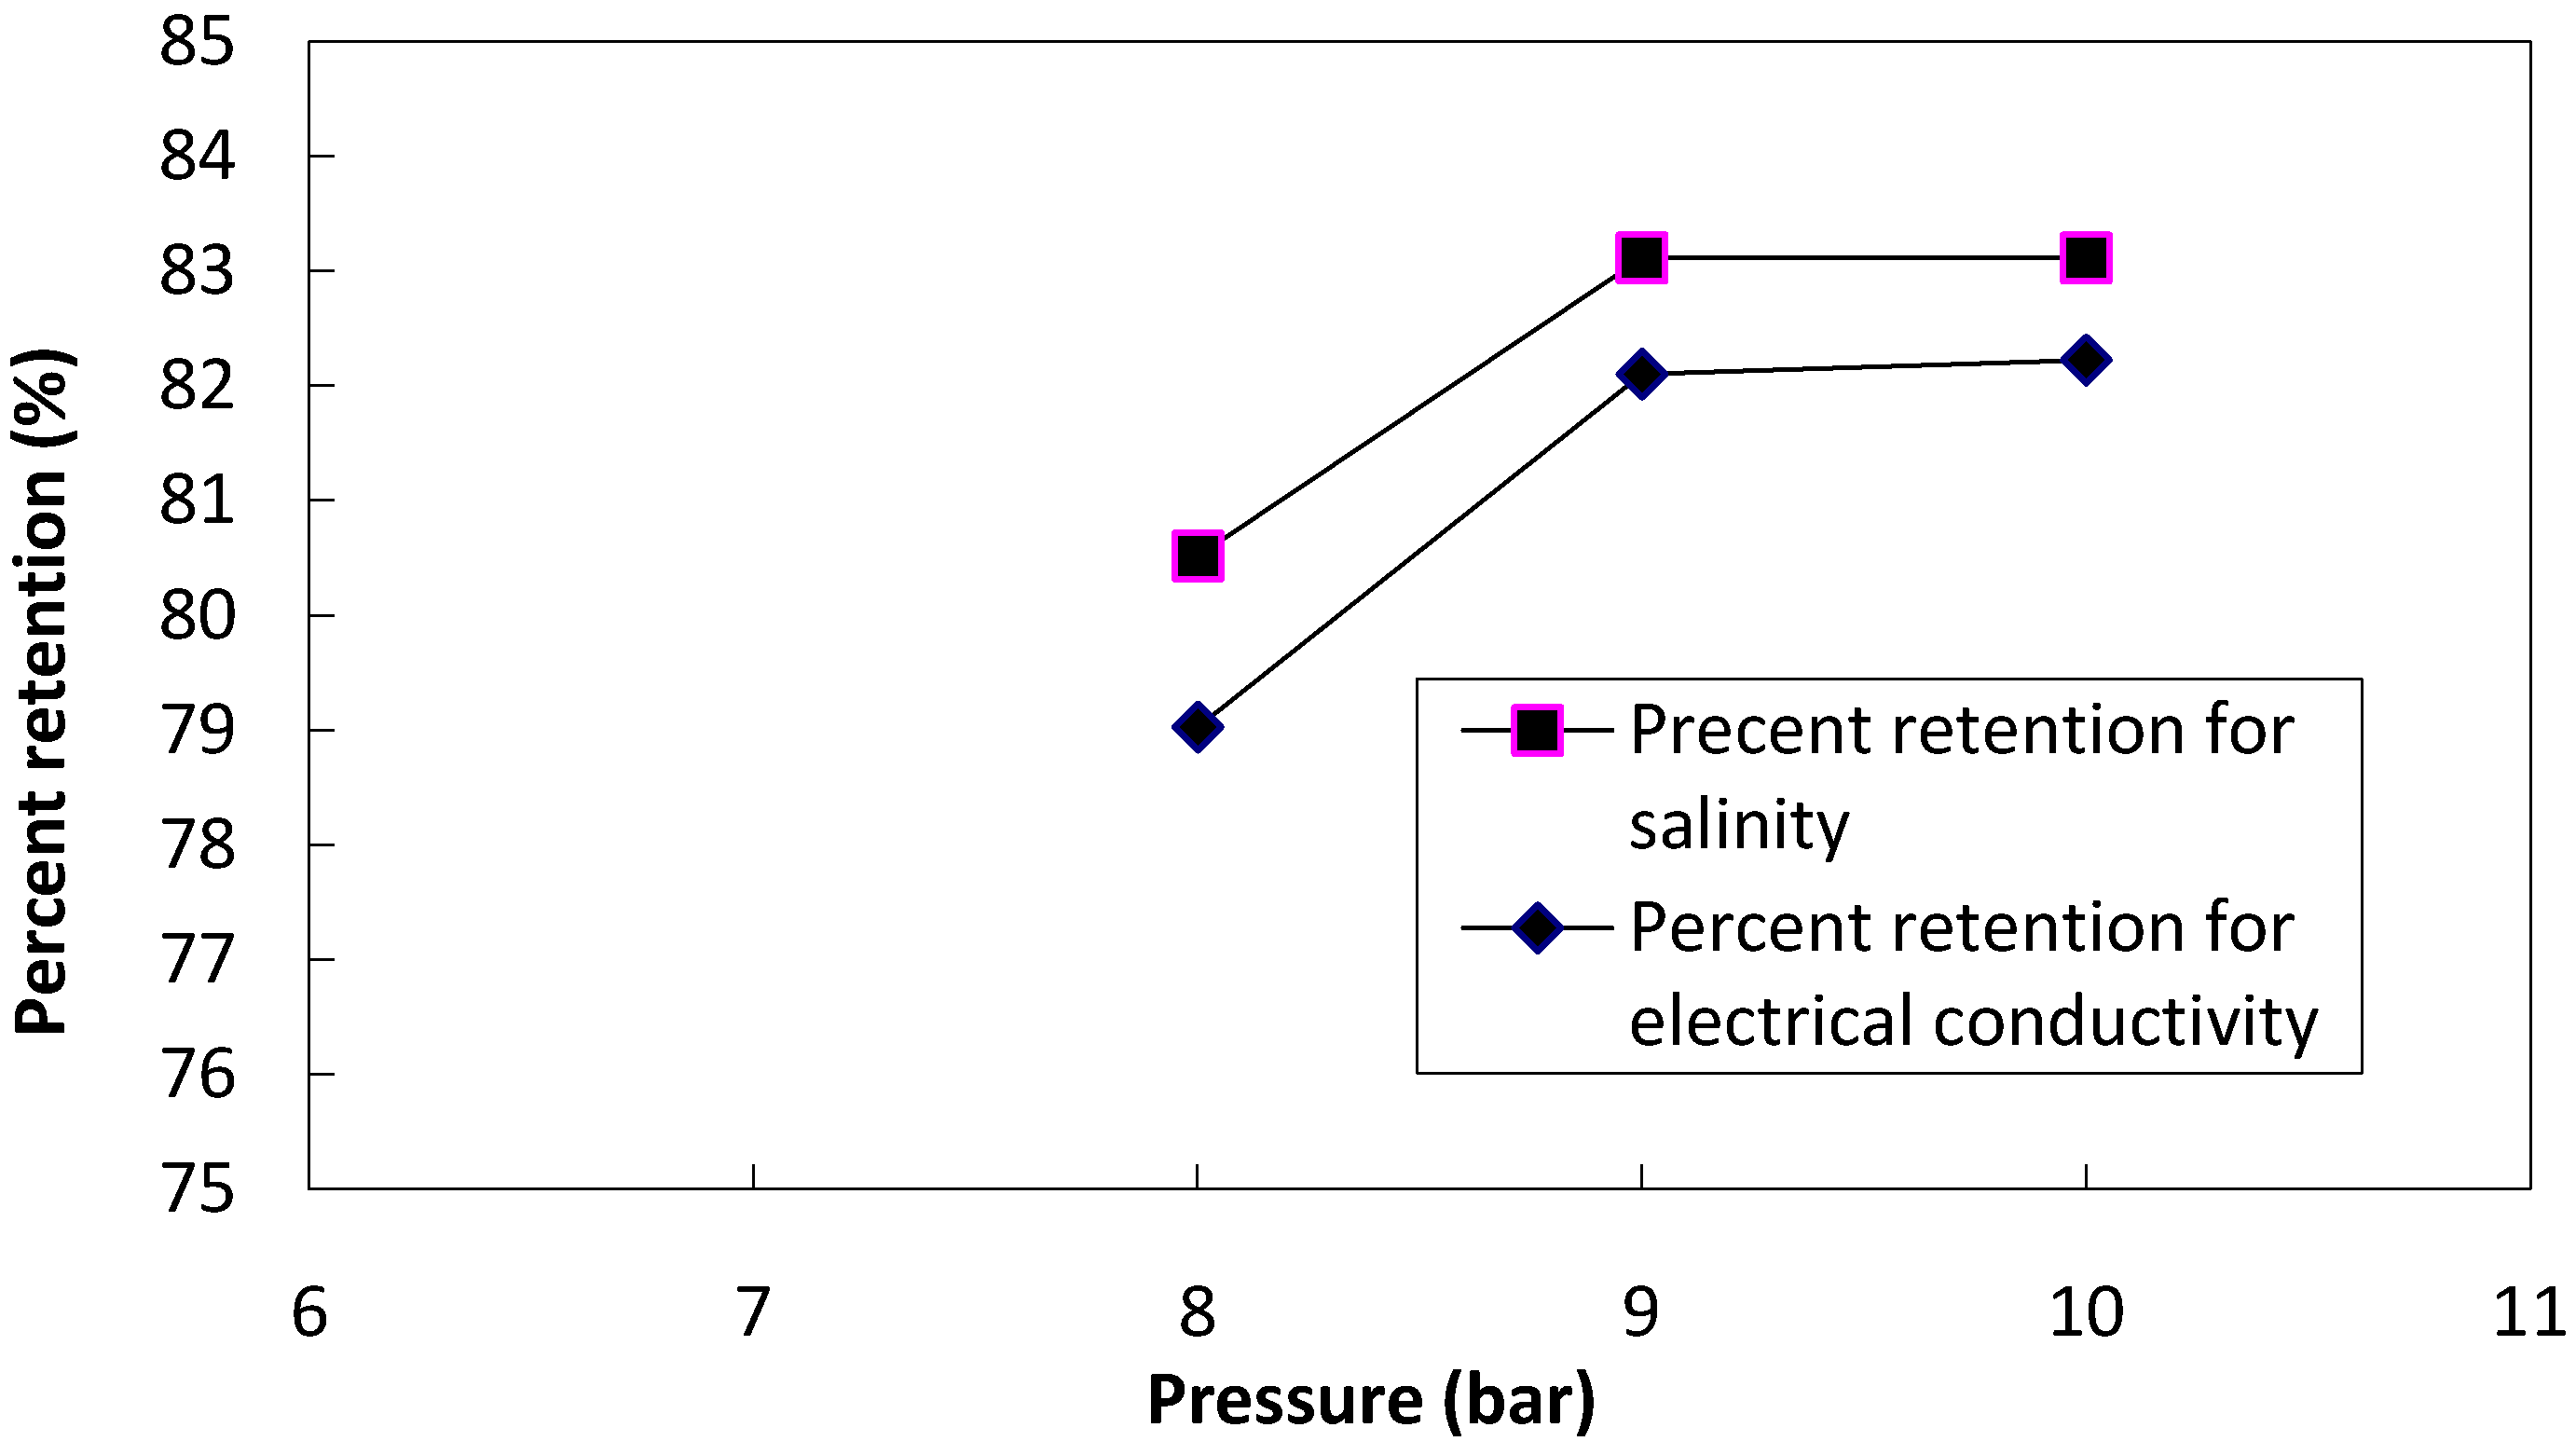
Figure 8 show the retention percentage of salinity and electrical conductivity for these samples. As presented in
Table 7, for Sample 1, the retention values of salinity and electrical conductivity at pressures of 9 and 10 bar are 83% and 82%, respectively.
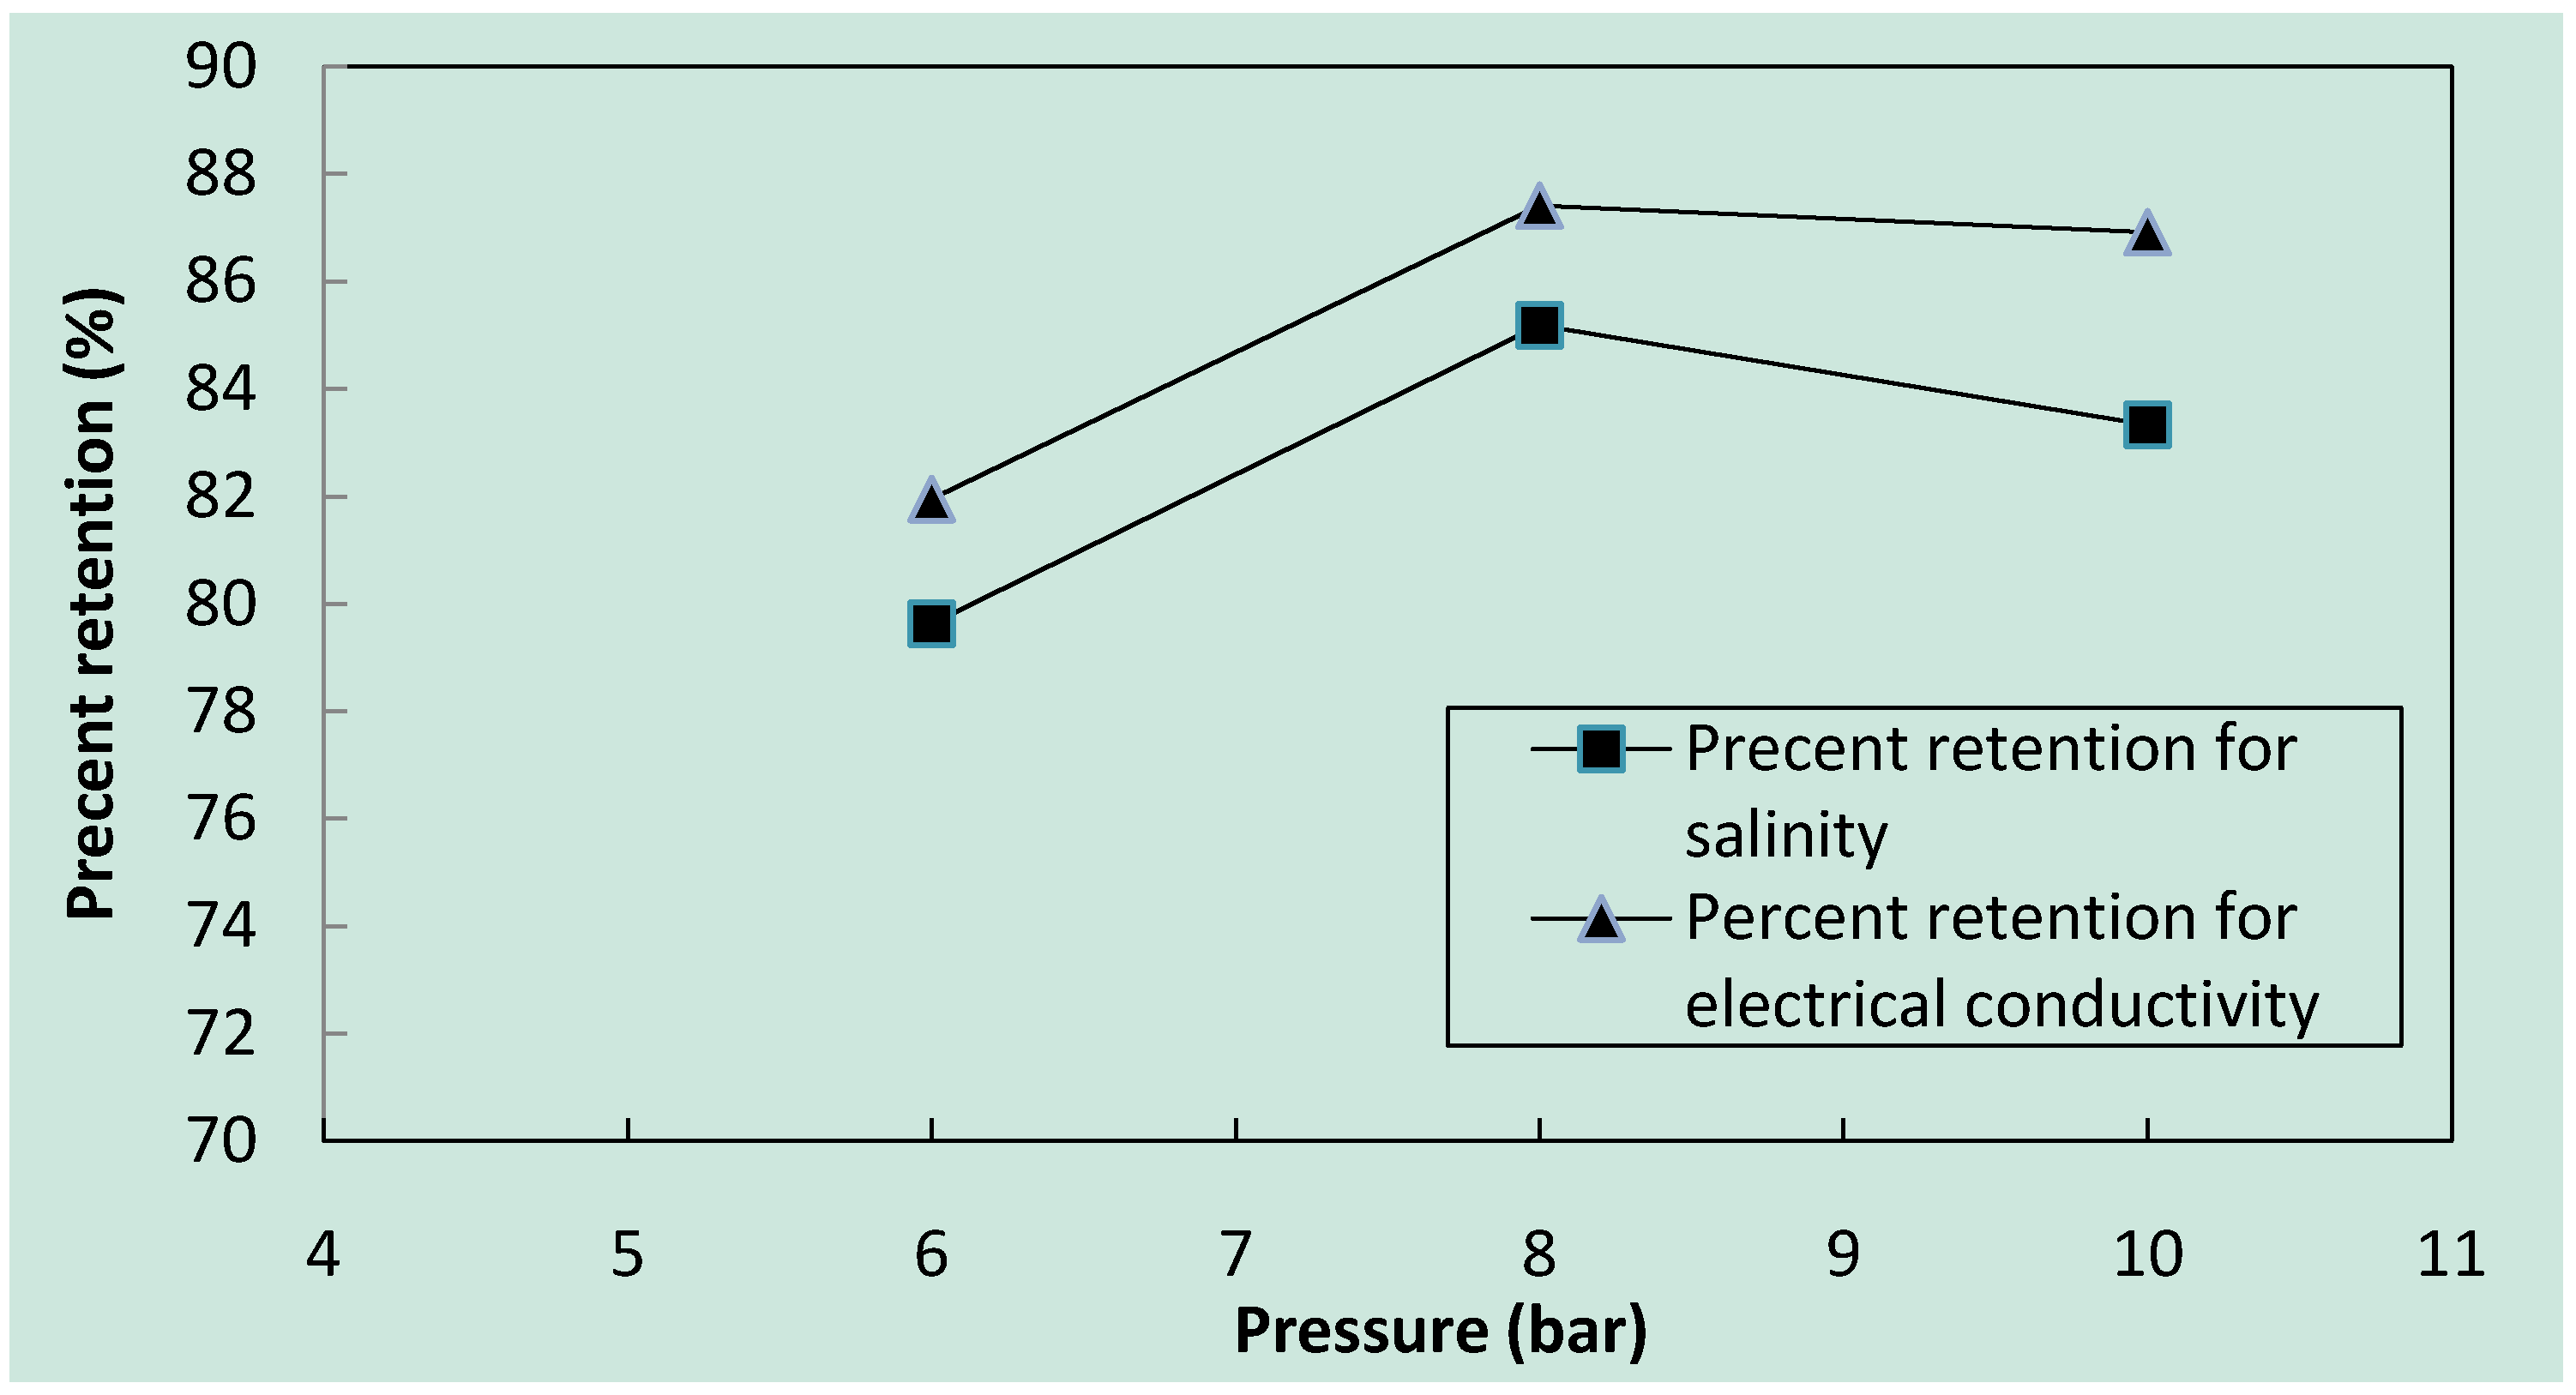
Table 8 shows that, for Sample 2, the retention values of salinity and electrical conductivity first increase with increasing pressure and then decrease. The maximum retention values of salinity and electrical conductivity for this sample are 85% and 87%, respectively, and occur at a pressure of 8 bar. Furthermore,
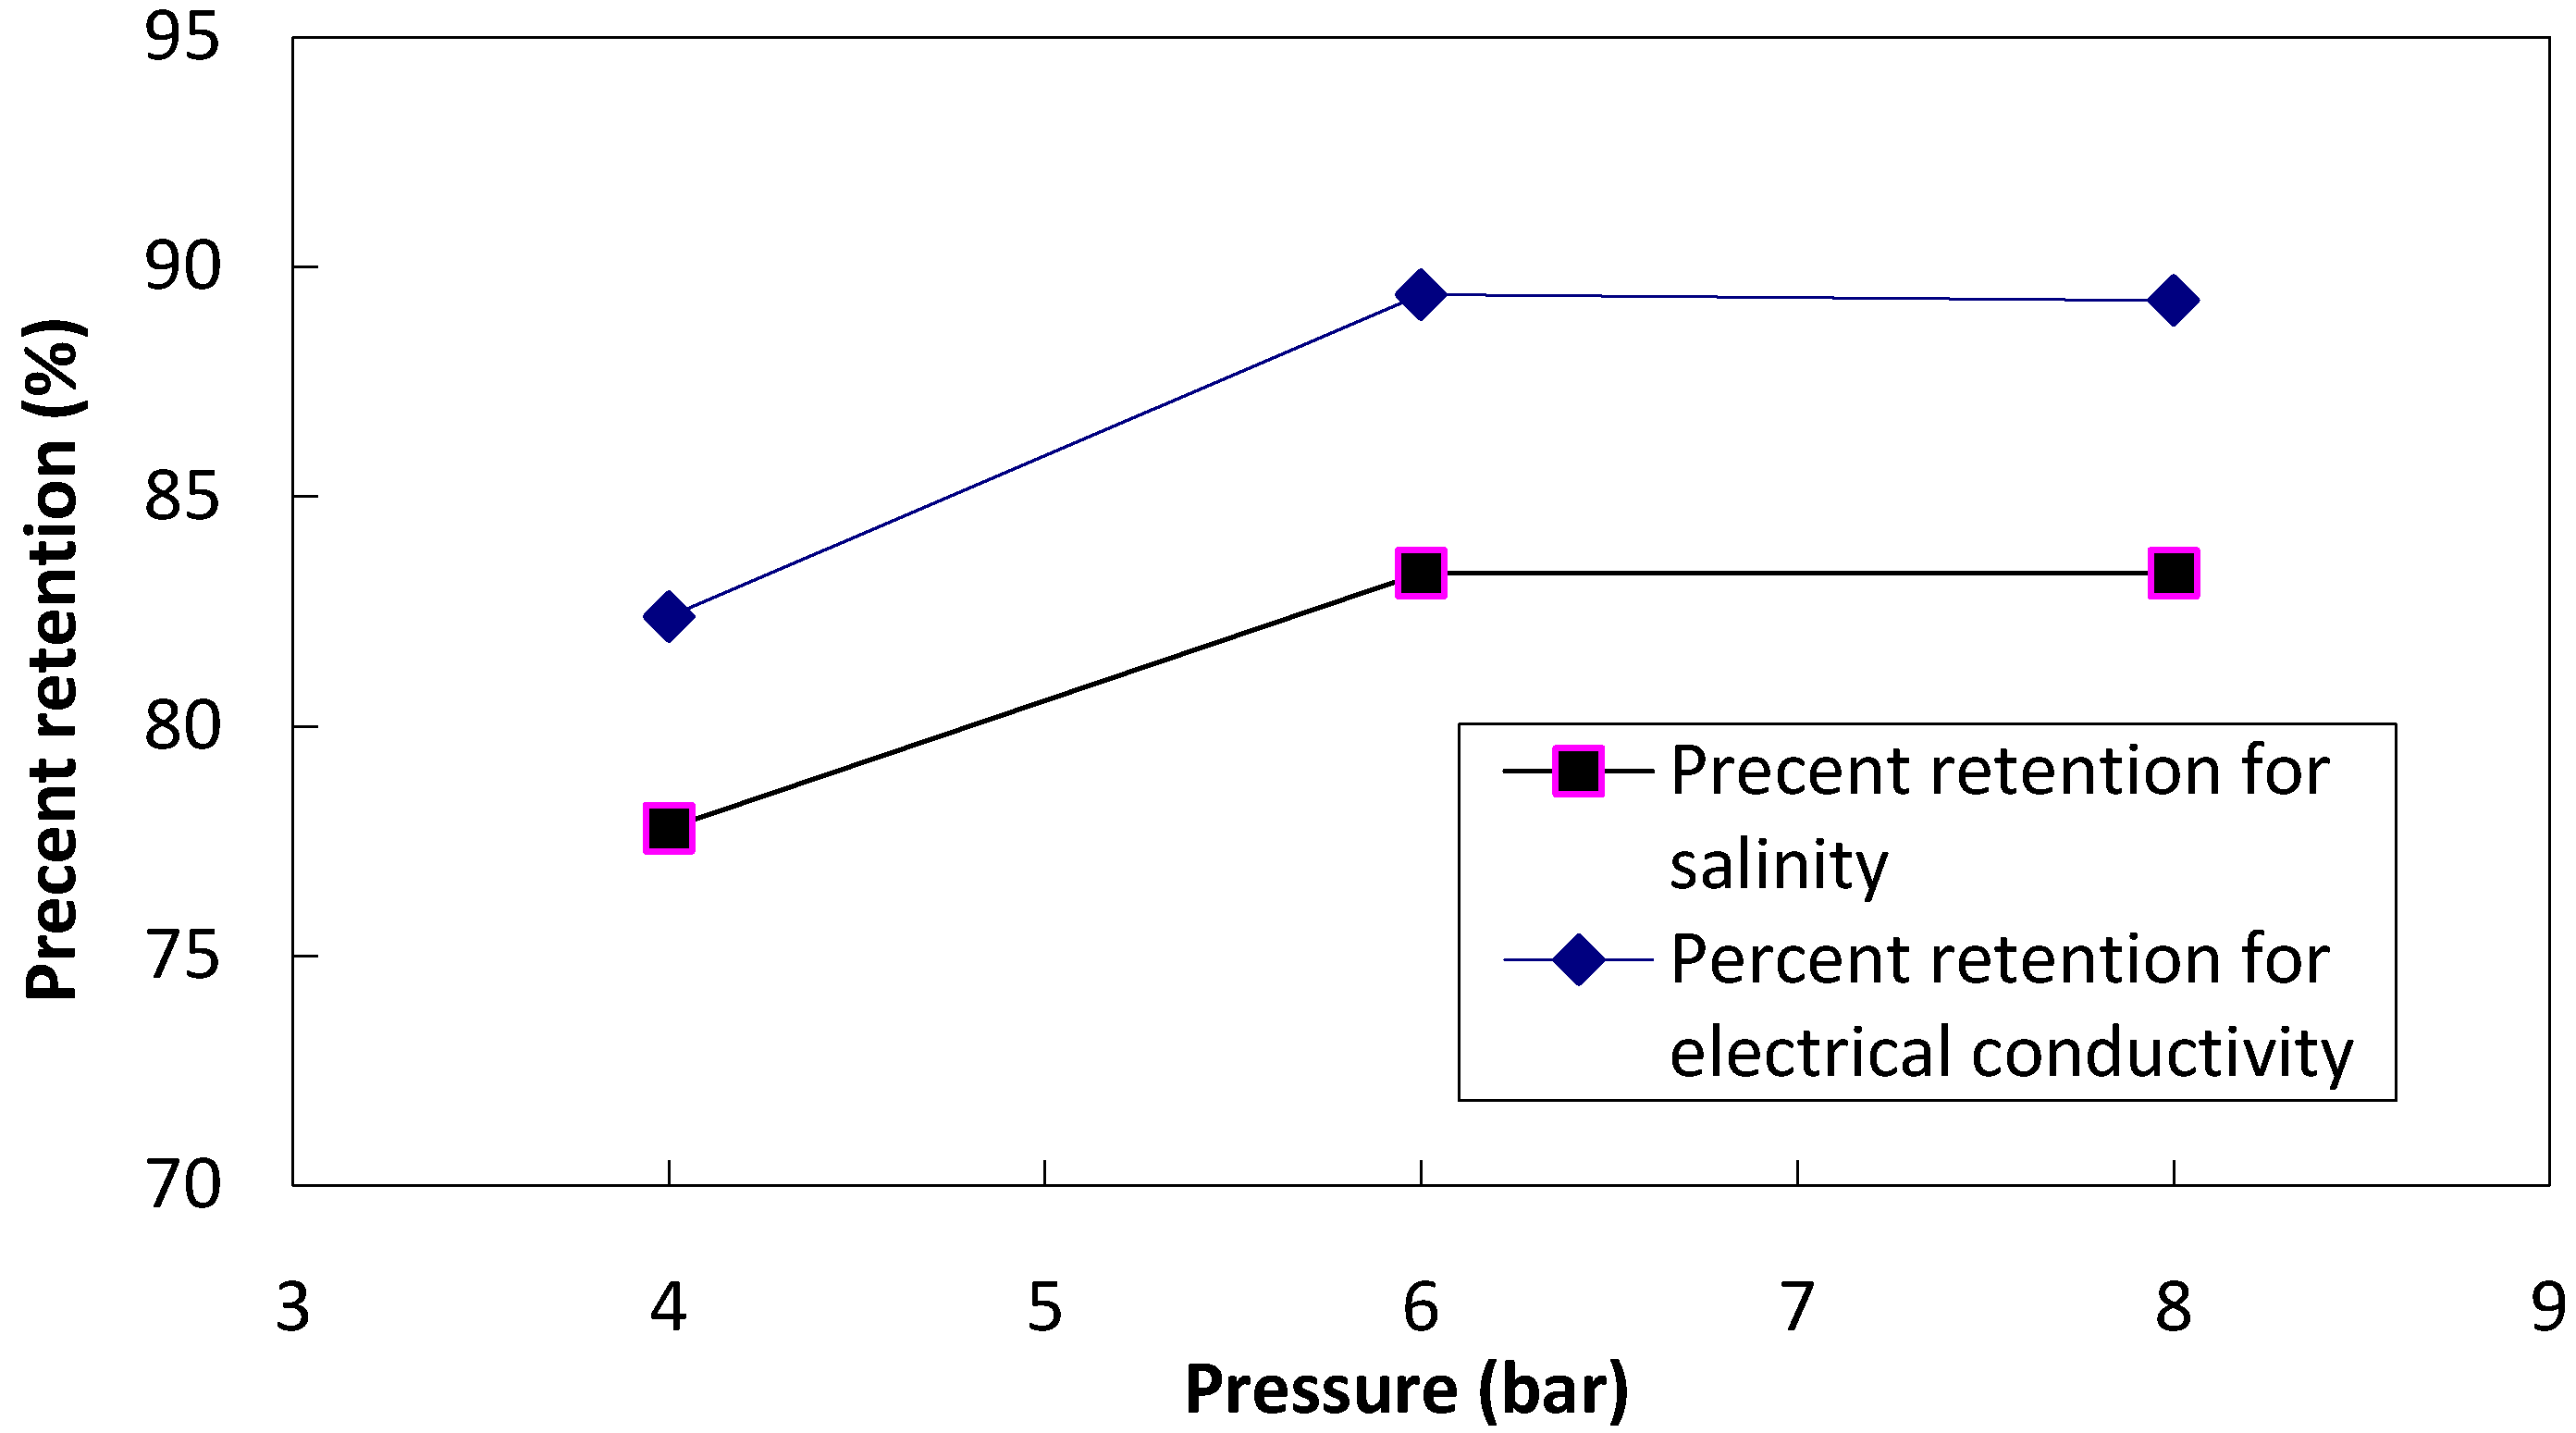
Table 9 shows a similar trend for Sample 3. The maximum retention occurs at a pressure of 6 bar, and the corresponding values for salinity and electrical conductivity are 83.33% and 89.4%, respectively. The data reported in the literature show %
R for EC is 68.4% [
6] (AFC30 nanoflitration) and %
R for salinity is between 44–66% [
11] (poly piperazine nanofiltration).
Table 7.
Retention percentage (%R) of salinity and electrical conductivity at various pressures for Sample 1.
Table 7.
Retention percentage (%R) of salinity and electrical conductivity at various pressures for Sample 1.
| Parameter | Percent retention | Percent retention | Percent retention |
|---|
| at 8 bar | at 9 bar | at 10 bar |
|---|
| Salinity | 80.52 | 83.12 | 83.12 |
| Electrical Conductivity | 79.03 | 82.1 | 82.23 |
Table 8.
Retention percentage (%R) of salinity and electrical conductivity at various pressures for Sample 2.
Table 8.
Retention percentage (%R) of salinity and electrical conductivity at various pressures for Sample 2.
| Parameter | Percent retention | Percent retention | Percent retention |
|---|
| at 6 bar | at 8 bar | at 10 bar |
|---|
| Salinity | 79.63 | 85.19 | 83.33 |
| Electrical Conductivity | 81.95 | 87.42 | 86.92 |
Table 9.
Retention percentage (%R) of salinity and electrical conductivity at various pressures for Sample 3.
Table 9.
Retention percentage (%R) of salinity and electrical conductivity at various pressures for Sample 3.
| Parameter | Percent retention | Percent retention | Percent retention |
|---|
| at 4 bar | at 6 bar | at 8 bar |
|---|
| Salinity | 77.78 | 83.33 | 83.33 |
| Electrical Conductivity | 82.38 | 89.4 | 89.26 |
Figure 6.
Retention of salinity and electrical conductivity vs. pressure for Sample 1.
Figure 6.
Retention of salinity and electrical conductivity vs. pressure for Sample 1.
Figure 7.
Retention of salinity and electrical conductivity vs. pressure for Sample 2.
Figure 7.
Retention of salinity and electrical conductivity vs. pressure for Sample 2.
Figure 8.
Retention of salinity and electrical conductivity vs. pressure for Sample 3.
Figure 8.
Retention of salinity and electrical conductivity vs. pressure for Sample 3.

