Article

Benefits of Riverine Water Discharge into the Lorian Swamp, Kenya

1
International Livestock Research Institute (ILRI), P.O. Box 30709, Nairobi 00100, Kenya
2
World Agroforestry Centre (ICRAF), P.O. Box 30677, Nairobi 00100, Kenya
3
Faculty of Geography and Geosciences, University of Trier, Universitätsring 15, Trier 54286, Germany
4
Centre for Training and Integrated Research in ASAL Development (CETRAD), P.O. Box 144, Nanyuki 10400, Kenya
*
Author to whom correspondence should be addressed.
Water 2012, 4(4), 1009-1024; https://doi.org/10.3390/w4041009
Submission received: 4 October 2012 / Revised: 4 November 2012 / Accepted: 4 December 2012 / Published: 19 December 2012

Abstract

:
Use and retention of river water in African highlands deprive communities in arid lowlands of their benefits. This paper reviews information on water use in the Ewaso Ng’iro catchment, Kenya, to evaluate the effects of upstream abstraction on the Lorian Swamp, a wetland used by pastoralists downstream. We first assess the abstractions and demands for water upstream and the river water supplies at the upper and the lower end of the Lorian Swamp. Further analysis of 12 years of monthly SPOT-VEGETATION satellite imagery reveals higher NDVI (Normalized Differential Vegetation Index) values in the swamp than nearby rainfed areas, with the difference in NDVI between the two positively related to river water discharged into the swamp. The paper next reviews the benefits derived from water entering the swamp and the vulnerability to abstractions for three categories of water: (i) the surface water used for drinking and sanitation; (ii) the surface water that supports forage production; and (iii) the water that recharges the Merti Aquifer. Our results suggest that benefits from surface water for domestic use and forage production are vulnerable to abstractions upstream whereas the benefits from the aquifer, with significant fossil water, are likely to be affected in the long run, but not the short term.

Graphical Abstract

1. Introduction

River discharge originating in humid high elevation areas traditionally provides secure surface water to downstream users and sustains forage production in many African drylands. The downstream benefits of rivers are becoming less secure due to increased human-induced upstream demand for water. When left uncontrolled, rising retention and use of water upstream deprives downstream communities from the benefits derived from their traditional sources of water.
The Ewaso Ng’iro River Basin, Kenya, is a prime example of the consequences that unplanned river basin development has on livelihoods of downstream users. The river originates in the Central Kenyan Highlands and terminates in a large wetland, the Lorian Swamp, located in the arid zone of North Eastern Kenya. Past development promoted crop and livestock production in the upper catchment [1], while more recent development initiatives aim at promoting wildlife-based tourism in the middle part of the catchment [2,3,4].
There is little insight into the effects of these developments on the availability of water to users living near the downstream Lorian Swamp. Several papers describe the effects of water use in the upper and middle parts of the catchment [1,5], and the impacts of this on the water discharge at Archer’s Post, halfway between the headwaters and the swamp. Although it is obvious that the wetland would be sensitive to retention and usage of water upstream, none of these publications considered the impacts of this on the Lorian Swamp and the ecosystem services and livelihoods dependent on this wetland.
Gaining better insight into the impacts of upstream abstractions on the hydrology and ecology of the lower parts of the catchment is complicated by the lack of records on river flow beyond Archer’s Post. In the developing world, a common feature in small and medium-sized river basins that drain into arid lands is the lack of meteorological and hydrological records [6]. In such cases, remote sensing has potential to offer information to complement the poor hydrological record.
The purpose of this paper is to describe the hydrology of the Ewaso Ng’iro River basin and compile new and existing evidence on the effect of water abstractions in the upper part of the basin on the availability of river water dependent ecosystem services in the Lorian Swamp. We used SPOT VEGETATION remote sensing imagery to analyze the degree of dependence of primary production on discharge of water from the upper part of the catchment.

2. Methods

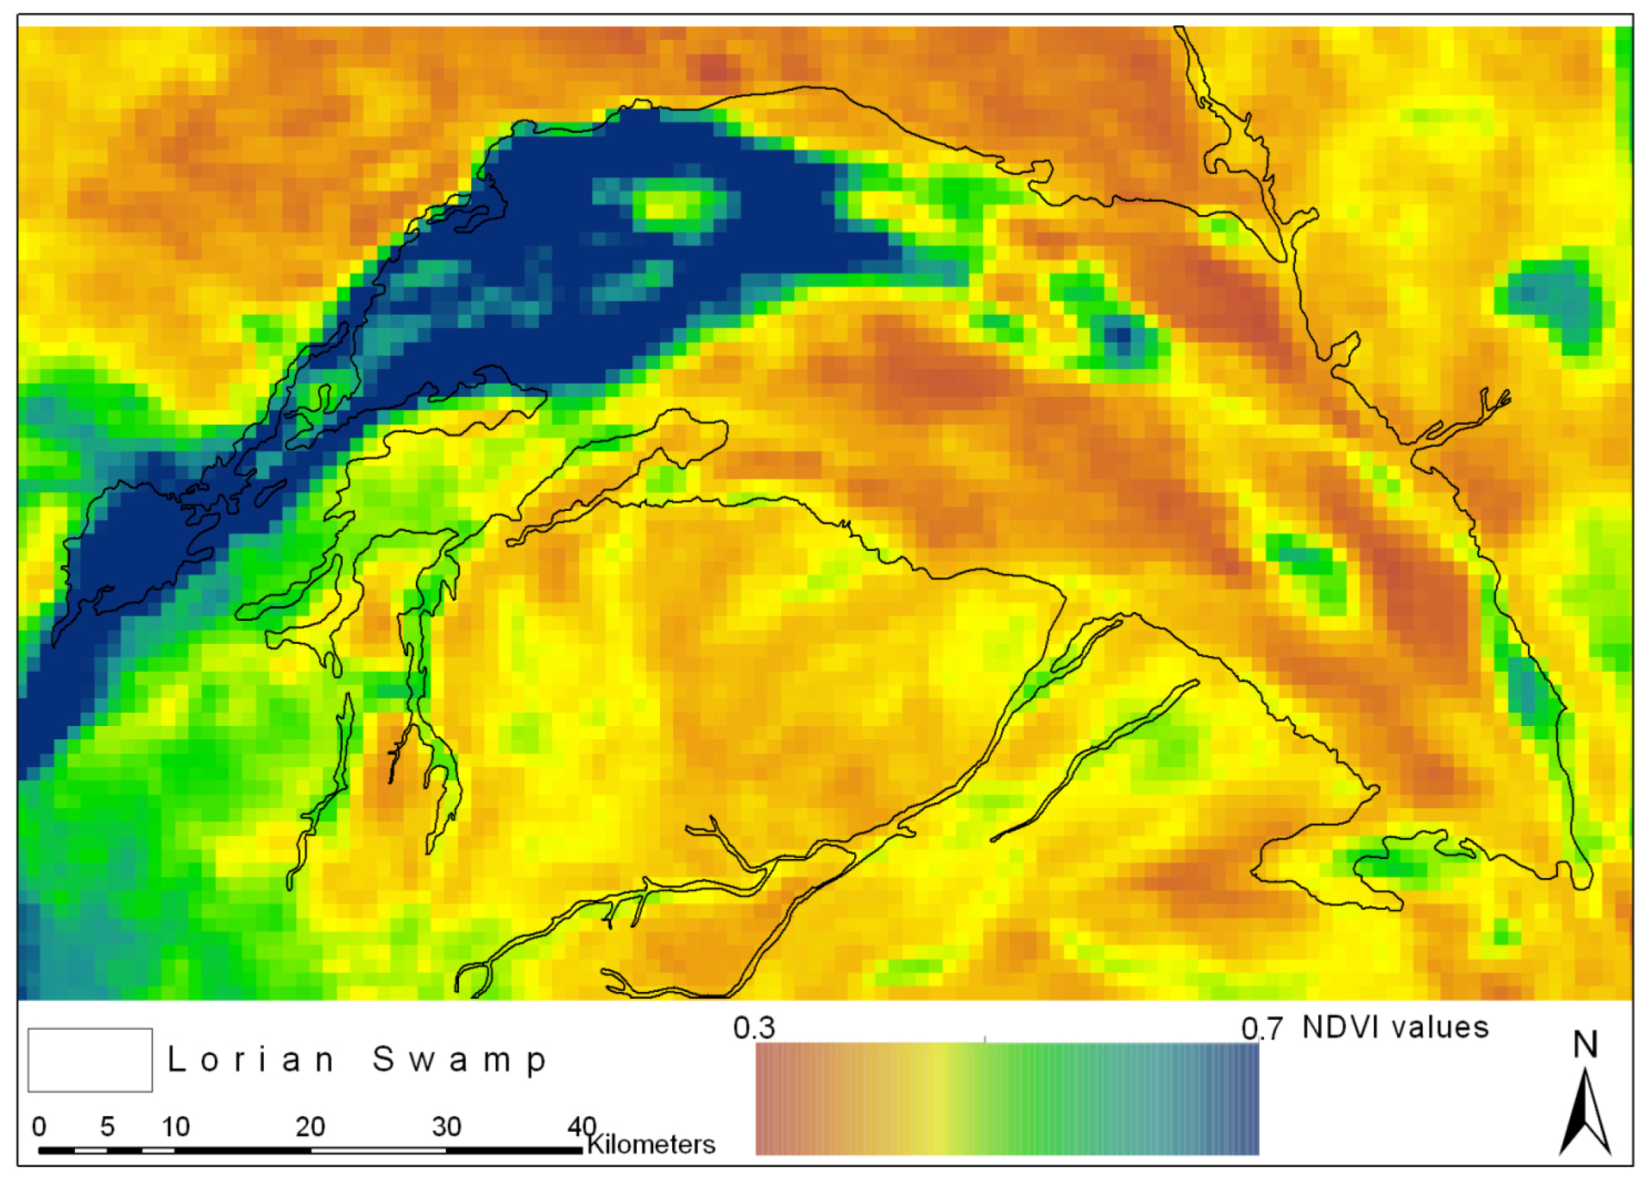
2.1. The Lorian Swamp

The Lorian Swamp in the lowlands of Isiolo District [7] in Kenya (Figure 1) receives water from the Ewaso Ng’iro River, which drains the slopes of the Aberdares Mountains and Mount Kenya [2,8]. The river passes through the Laikipia plateau and Archer’s Post beyond which it crosses an undulating plateau where it changes in an ephemeral river to discharge its waters near Merti into the Lorian Swamp. Mean annual rainfall over the swamp is 180–250 mm, but precipitation is highly variable. Several ephemeral rivers (wadis) from the SW and NW supply the swamp with additional water. The swamp is situated in a 2310 km2 depression, 196 km long and 25 km wide, yet the inundated area is smaller and expands and contracts with river discharge and rainfall over the swamp.
Figure 1. Map of the Ewaso Ng’iro River Basin, the Lorian Swamp and the Merti Aquifer. The wetlands in the lower parts of the catchment are ephemeral.
Water 04 01009 g001
The Merti Aquifer, situated in the lower part of the Ewaso Ng’iro catchment (Figure 1), has had an estimated recharge of 3.3 MCM (Million Cubic Meter) per year. The main recharge areas are not well known, but it has been suggested that significant recharge takes place in the Lorian Swamp [9]. Stable isotope analysis dated the age of the water at 30,000 years, thus classifying it as a fossil aquifer [10].
The vegetation of the swamp has three different zones; the upper Cynodon dactylon zone in briefly flooded areas, a zone with Echinochloa and Setaria spp. on more regularly inundated flood plains, and the third zone with aquatic grass and sedge species in the lowest parts of the swamp. The perennial swamp, which reduced in size from 150 km2 in the early 20th century to 39 km2 by 1960, has today been replaced by seasonal swamp vegetation [10]. The availability of water and vegetation in the swamp attracts people and livestock particularly in the dry season when the swamp provides drinking water and forage. Data on the distribution of people and of livestock and wildlife was obtained from the central Bureau of Statistics (CBS) and the Department for Resources Surveys and Remote Sensing (DRSRS). The density of livestock and wildlife is expressed in Tropical Livestock Units (TLU), an index representing an animal of 250 kg, which allows combining animals of variable body weight.

2.2. Discharge of the Ewaso Ng’iro River into the Swamp

We calculated the number of days per year when river water entered the head of the swamp, as well as the number of months when river water reached the end of the swamp as follows. Reaching the head of the swamp at Merti, 180 km downstream from Archer’s Post, requires a discharge at Archer’s Post of 0.18 MCM per day, as the river loses about 1000 m3 per day for every km length [9]. Swarzenski and Mundorff [11] reported that the water reaches Habaswein at the end of the swamp when discharge at Archer’s Post exceeds 35 to 40 MCM per month. We combined this with the recorded discharge at Archer’s Post to calculate the number of days per year with discharge below 0.18 MCM and the number of months per year with discharge above 40 MCM.
Various authors have studied the effects of abstractions upstream on the discharge of the Ewaso Ng’iro River, with some using models to predict the effects of these abstractions on downstream discharge [12]. While such models are useful to gain understanding in systems behavior, we decided to present in this paper the reported permitted abstractions and estimates of the demand for water to give an impression of the magnitude of the abstractions in the upper part of the catchment.

2.3. Delineation of the Swamp and Monitoring Vegetation Phenology

The aforementioned size of the Lorian Swamp of 2310 km2 is derived from topographic maps produced by the Survey of Kenya. The more recent Africover 2000 map [13] represents the swamp as a slightly larger area of 2918 km2. Both maps refer to the swamp as a depression, a geomorphological feature that was mapped through visual interpretation of aerial photography and satellite imagery. We used the following approach to delineate the inundated area. First we graphically displayed the average monthly SPOT VEGETATION NDVI (Normalized Differential Vegetation Index, an index based on reflectance in the red and infrared part of the spectrum, which is indicative for photosynthetic activity and biomass of green vegetation [14]). Data covering the period 1998 to 2010 was downloaded from [15] to reveal those areas within the depression with significantly higher NDVI than the surrounding rainfed areas (Figure 2).
Figure 2. Boundary of the Lorian Swamp according to Africover 2000 (black line) and average SPOT VEGETATION NDVI 1998–2010, showing frequently inundated areas with high NDVI in blue.
Water 04 01009 g002
We then screen digitized the boundary of this area with significantly higher NDVI than the surrounding uplands. This resulted in delineation of the western part of the depression as an area that is frequently flooded, and the eastern part of the depression as a rarely flooded area. We next used monthly SPOT VEGETATION NDVI data to visualize the vegetation phenology of the swamp and the surrounding areas for every month over a twelve-year period and related the contrast in NDVI between the frequently inundated part of the swamp and adjacent upland rainfed areas to the discharge of water into the swamp.

2.4. Assessment of the Importance and Vulnerability of River Water Dependent Ecosystem Services

The four categories of ecosystem services distinguished in the Millennium Ecosystem Assessment [16], namely provisioning, supporting, regulating and cultural services, include final products that benefit people and inputs and processes that support these benefits. We have used a different approach proposed by Fisher [17] who distinguished benefits to people from ecosystem services and divided the latter in intermediate services which support the final services that lead to benefits [3]. We distinguished three intermediate services of water in the swamp, namely the provisioning of surface water for drinking and sanitation, surface water that supports primary production and the recharge of ground water. We describe the final services and benefits that people derive from this, describe the importance of each of these final services in qualitative terms, and assess the vulnerability of these final services to changes in discharge in the swamp due to abstraction upstream.

3. Results

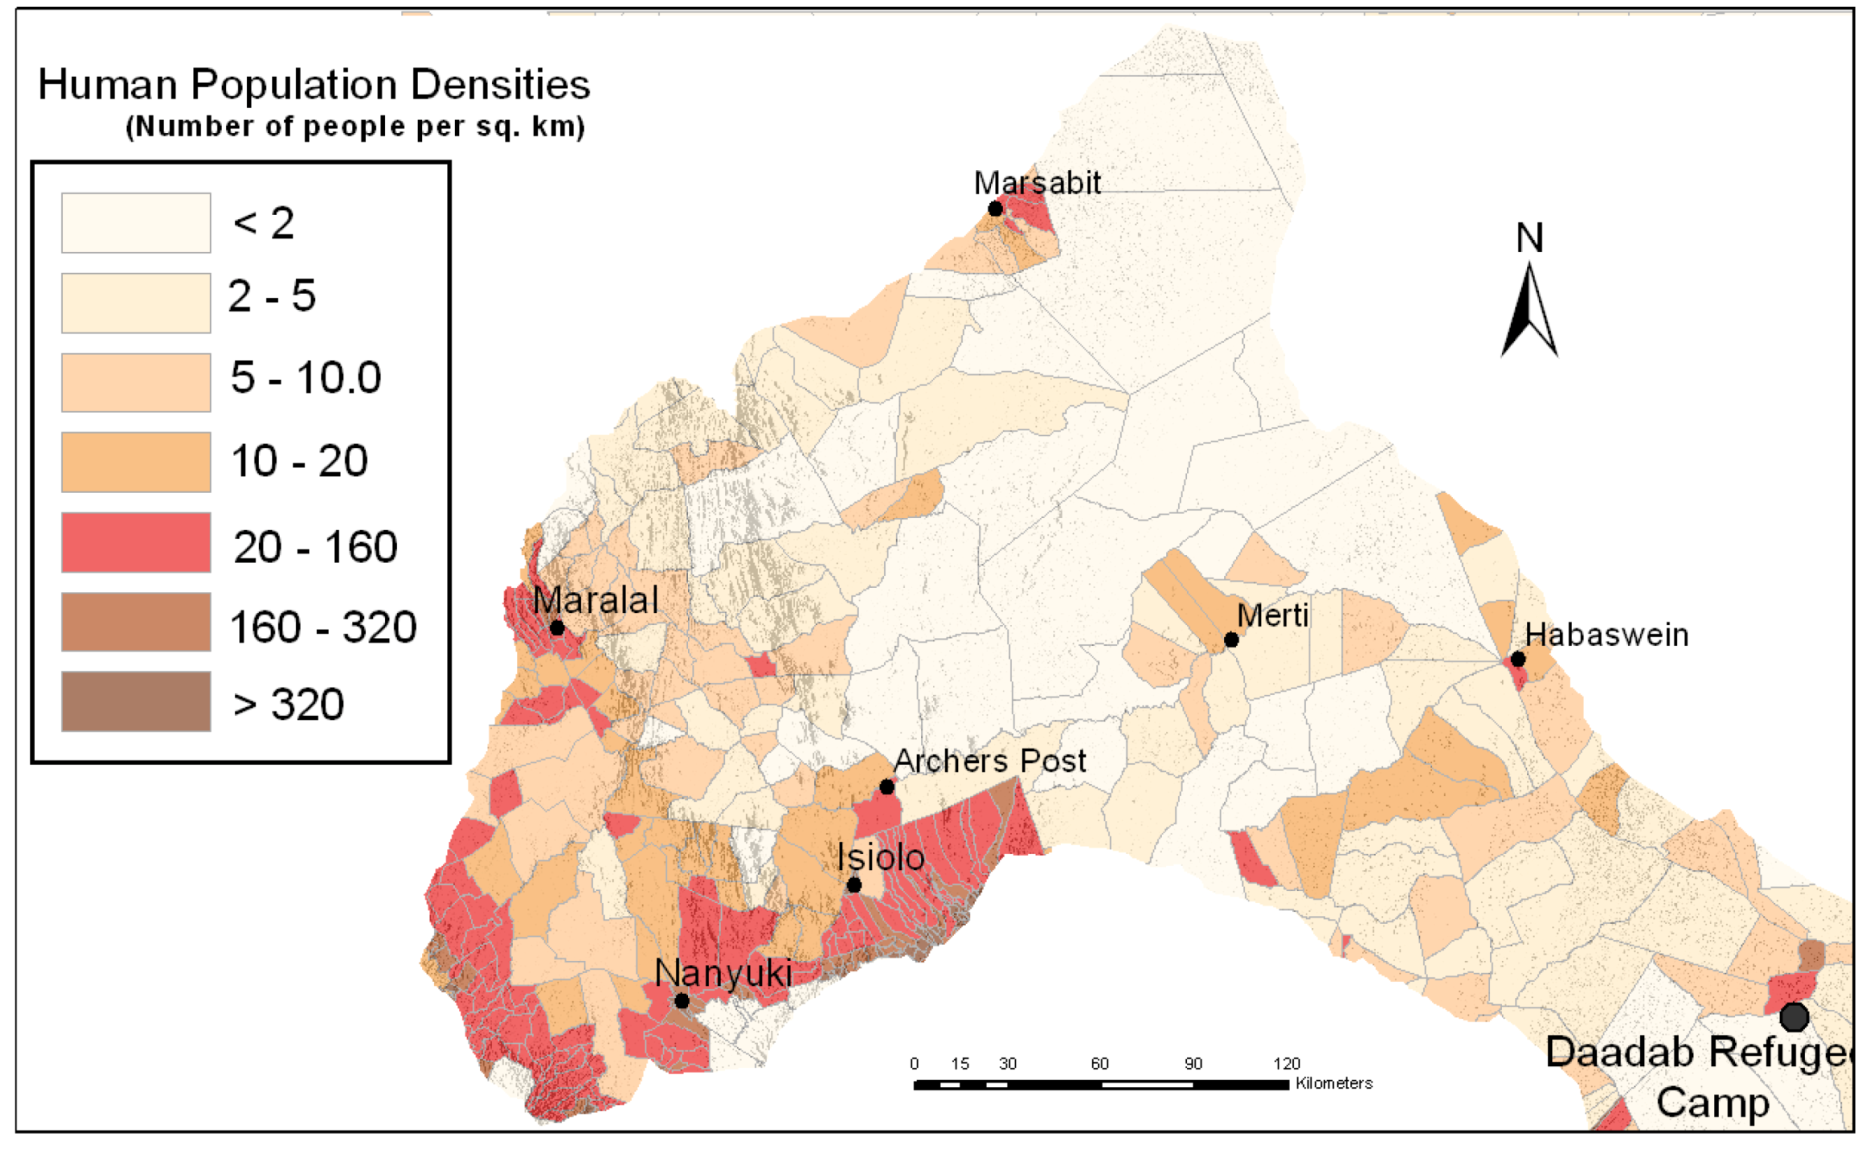
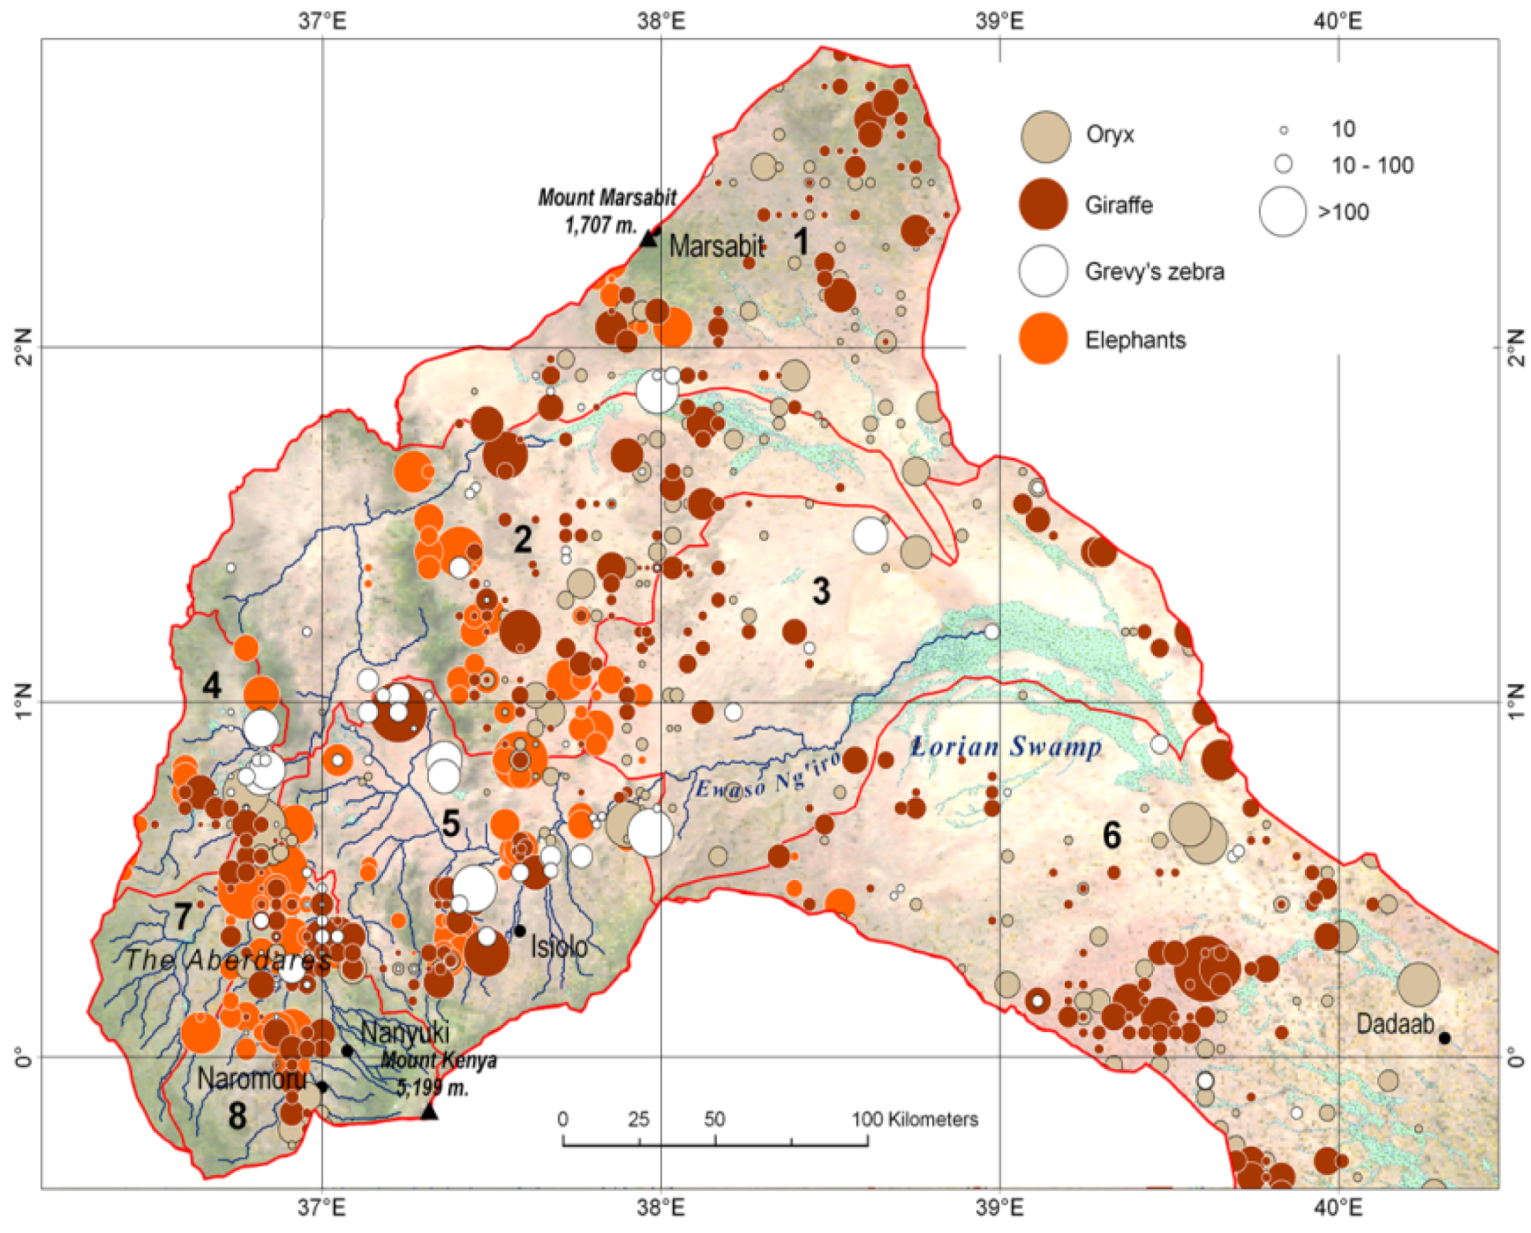
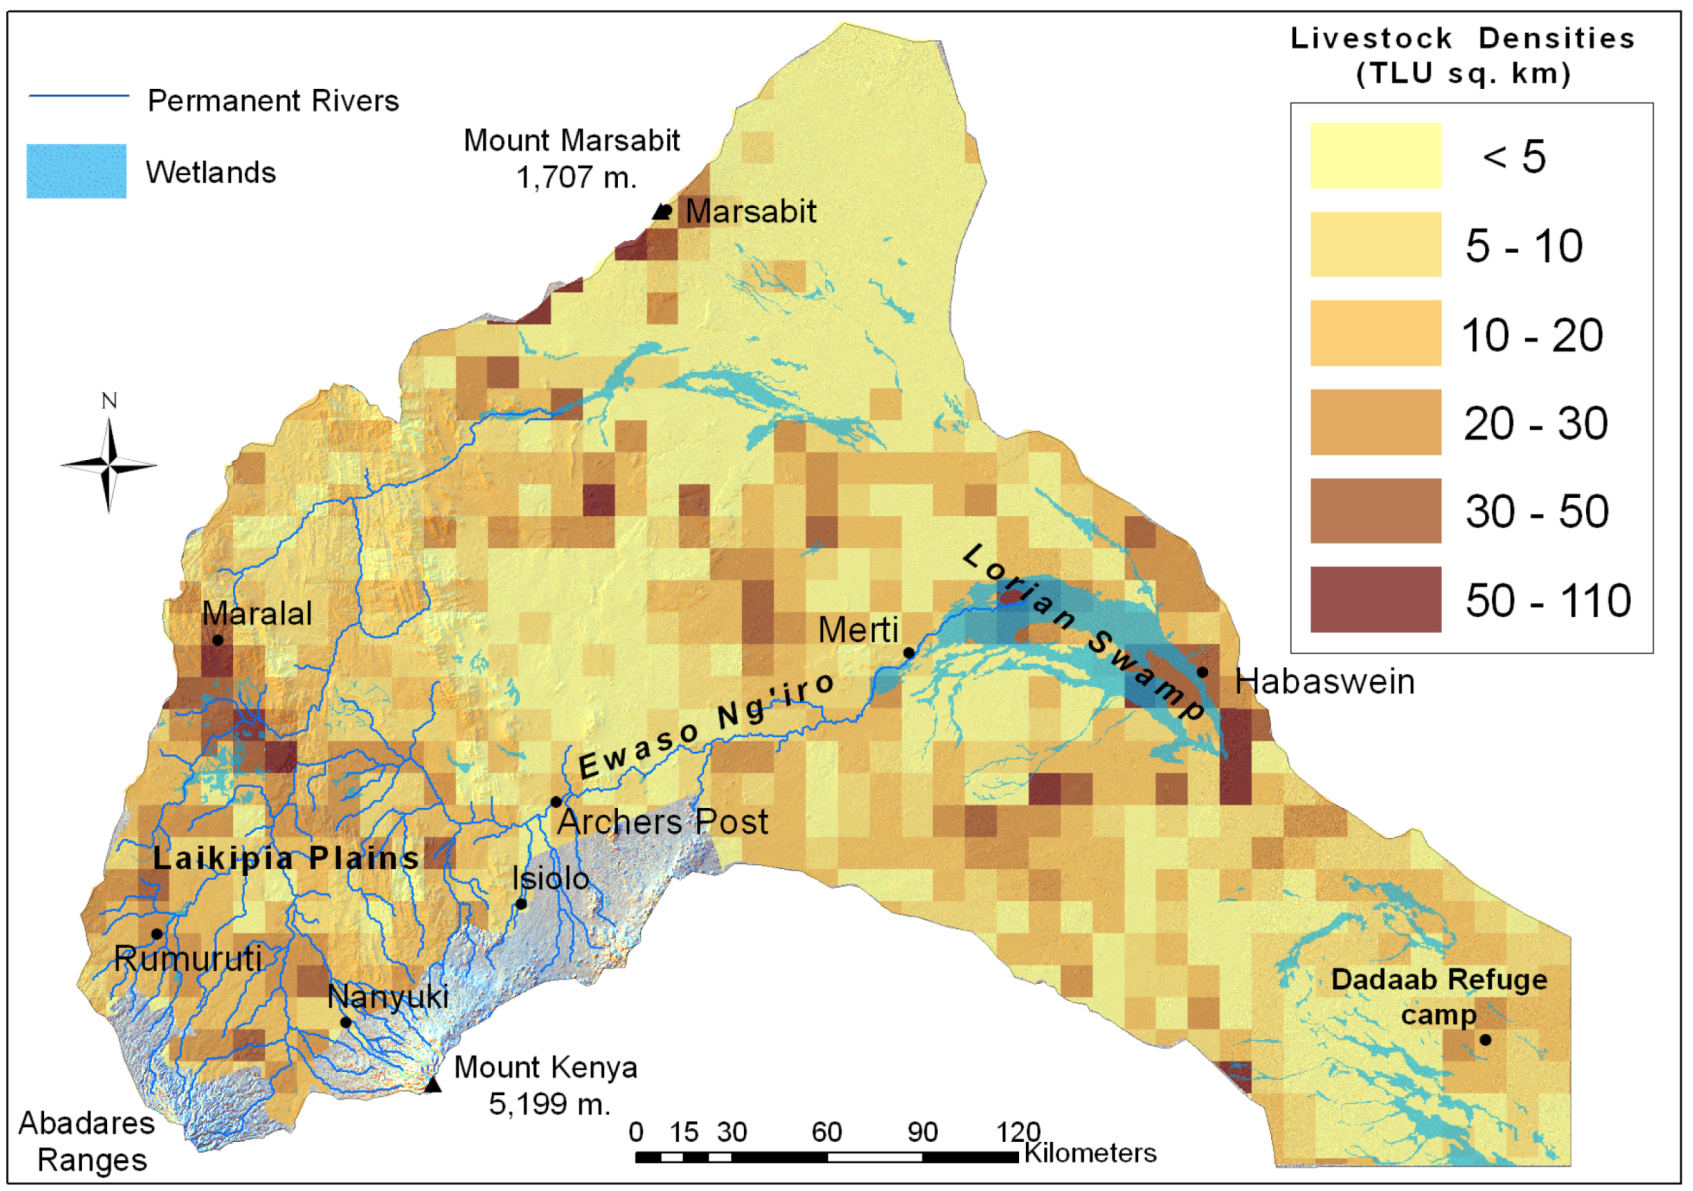
3.1. Distribution of People, Livestock and Wildlife

Population densities of 100 people per km2 and above prevail in the upper parts of the catchment, while densities of less than 10 people per km2 occur in the arid zone surrounding the Lorian Swamp (Figure 3). A pocket of high population densities exists around Dadaab, where the largest refugee camp in Africa hosted more than half a million people by the end of the 2011 drought.
Figure 3. Human population density in 2009 [2].
Water 04 01009 g003
Higher livestock densities prevailed in the upper and middle parts of the catchment (Figure 4), while comparison of Figure 4 and Figure 1 reveals that the availability of water affects the distribution of livestock in the lower part of the catchment. Herd composition varies from cattle-dominated herds in the upper and middle parts, to camel-dominated herds in the lower catchment.
Figure 4. Average livestock density 1990–2010 (TLU per km2, [2] and DRSRS).
Water 04 01009 g004
Highest wildlife densities occur in Laikipia and the Matthews range (50 to 100 km North of Isiolo), where protected areas and wildlife conservancies are concentrated (Figure 5). Less wildlife occurred in the eastern part of the catchment, particularly in the Lorian Swamp and the area directly surrounding it. Elephant and Grevy’s Zebra occur in the western part of the catchment; no elephants were recorded in the eastern part and Grevy’s were few. Little wildlife was observed in the Lorian Swamp.
Figure 5. Average observed wildlife numbers 1990–2010 (from [2] and DRSRS).
Water 04 01009 g005

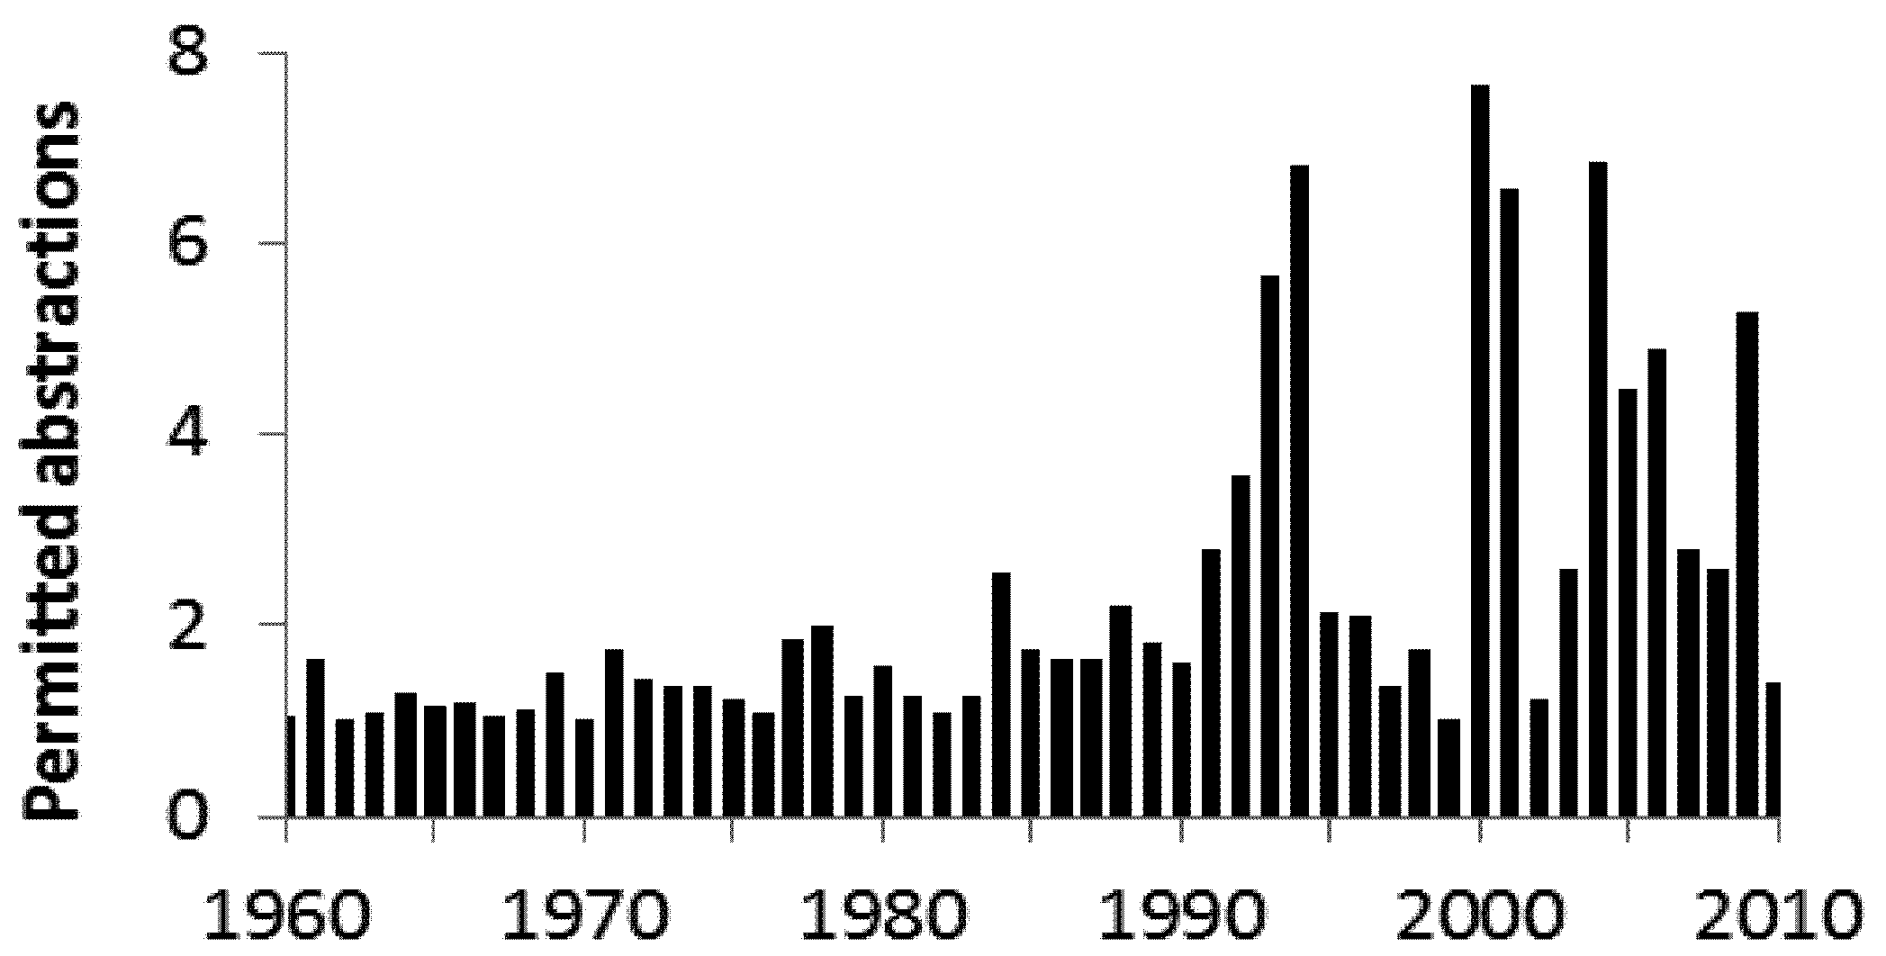
3.2. Abstractions Upstream

The permitted abstractions, which were in the order of 1 to 2 m3 s−1 (31.5–63 MCM per year) from 1960 until 1990, rapidly increased in the early 1990s to reach 7 m3 s−1 (221 MCM annually) in 1994 (Figure 6). The volume of permits issued was reduced in 1995 and subsequent years, but increased again to abstractions above 6 m3 s−1 in 2000 and 2001, at the height of a severe drought. The level of permitted abstractions has fluctuated since then between low in good rainfall years, and high during the droughts of 2004 to 2006 and in 2009.
Figure 6. Permitted abstractions (m3 s−1) in the upper catchment of the Ewaso Ng’iro River, based on the water permit authorization register of WRMA (Water Resources Management Authority).
Water 04 01009 g006

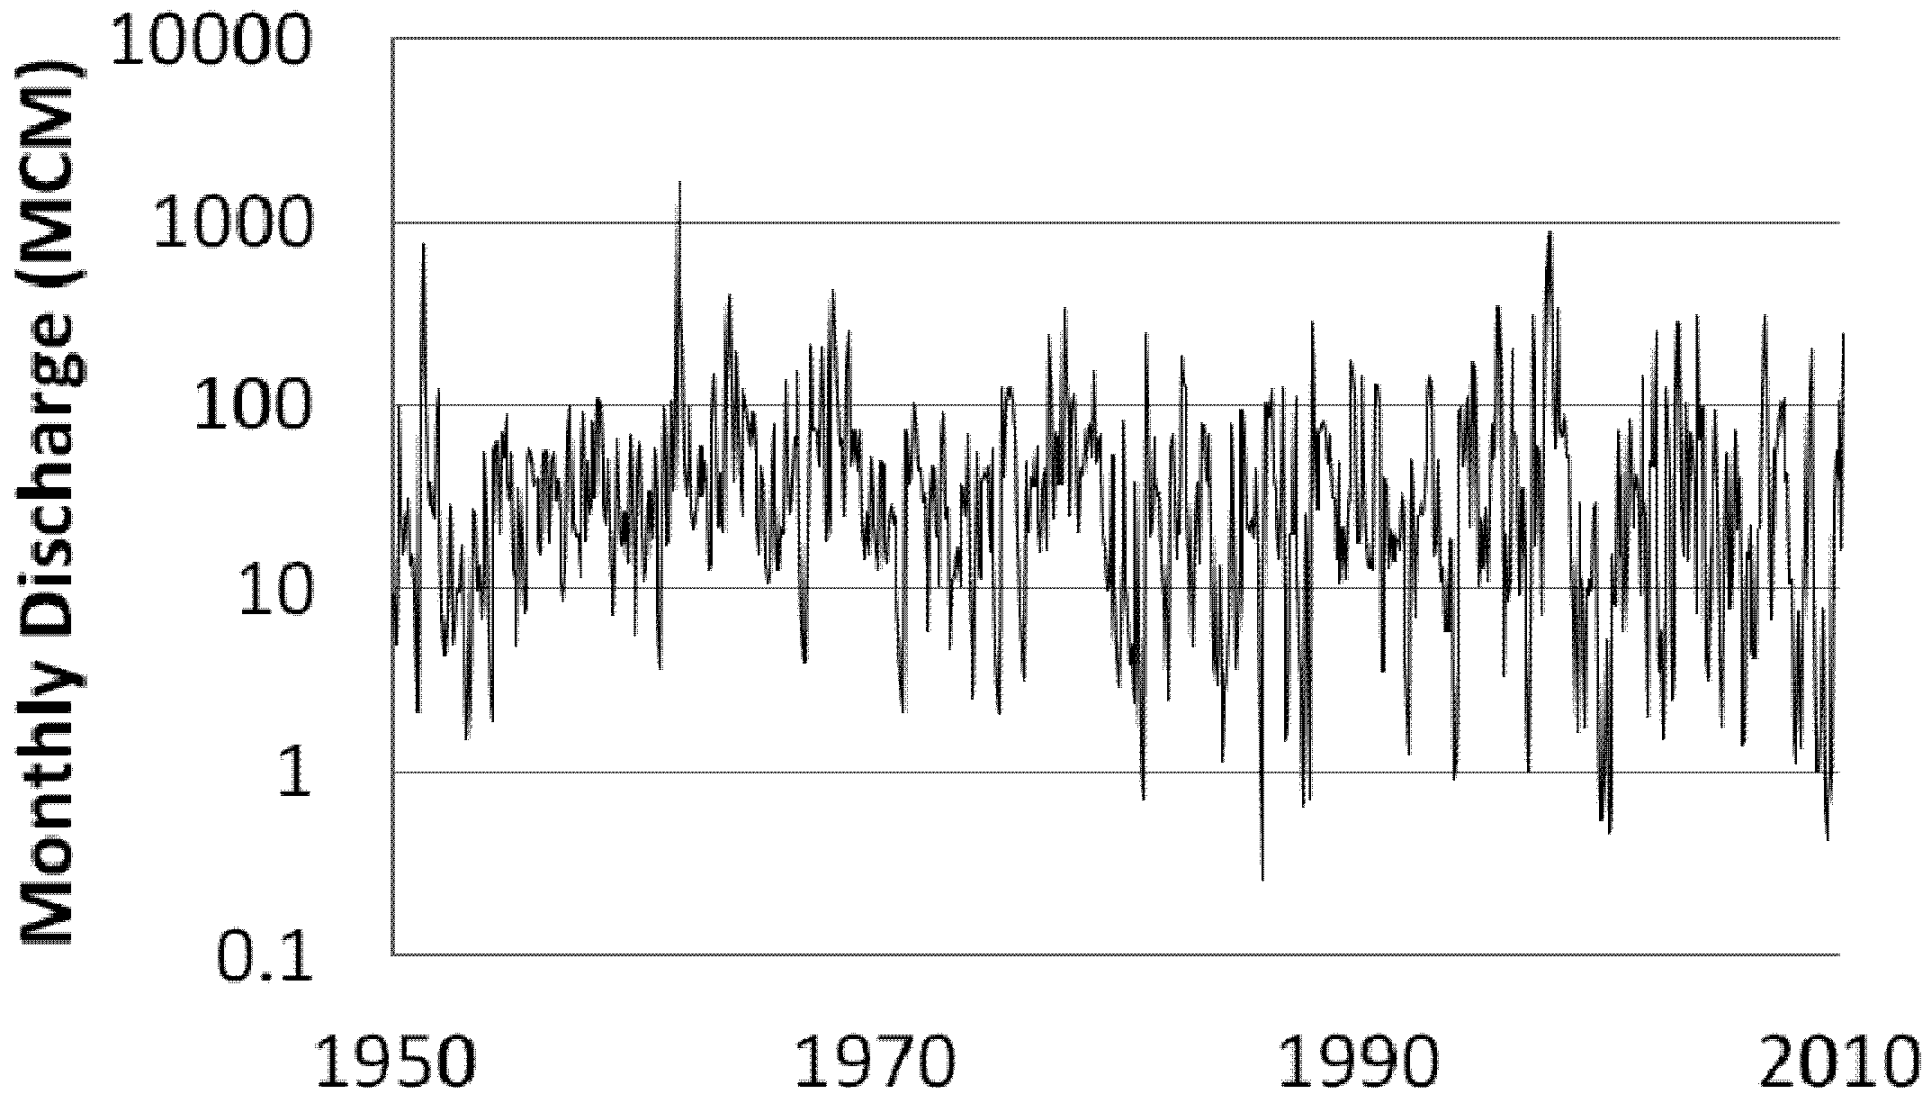
3.3. Discharge of the Ewaso Ng’iro River

What are the consequences of these abstractions on the availability of water to downstream water users? Average monthly discharge equals 52.1 MCM but there is variation among months of four orders of magnitude (Figure 7). There is a trend of increased frequency of low discharge events at Archer’s Post: discharges below 1 MCM, which were rare in the 1960s and 1970s, have become more frequent since the early 1980s. Also, the frequency and duration of periods with discharge below 10 MCM, which were low and short-lived in the 1960s and 1970s, have become more frequent and of longer duration since 1980.
Figure 7. Variation in monthly discharge of the Ewaso Ng’iro at Archer’s Post 1960–2010.
Water 04 01009 g007

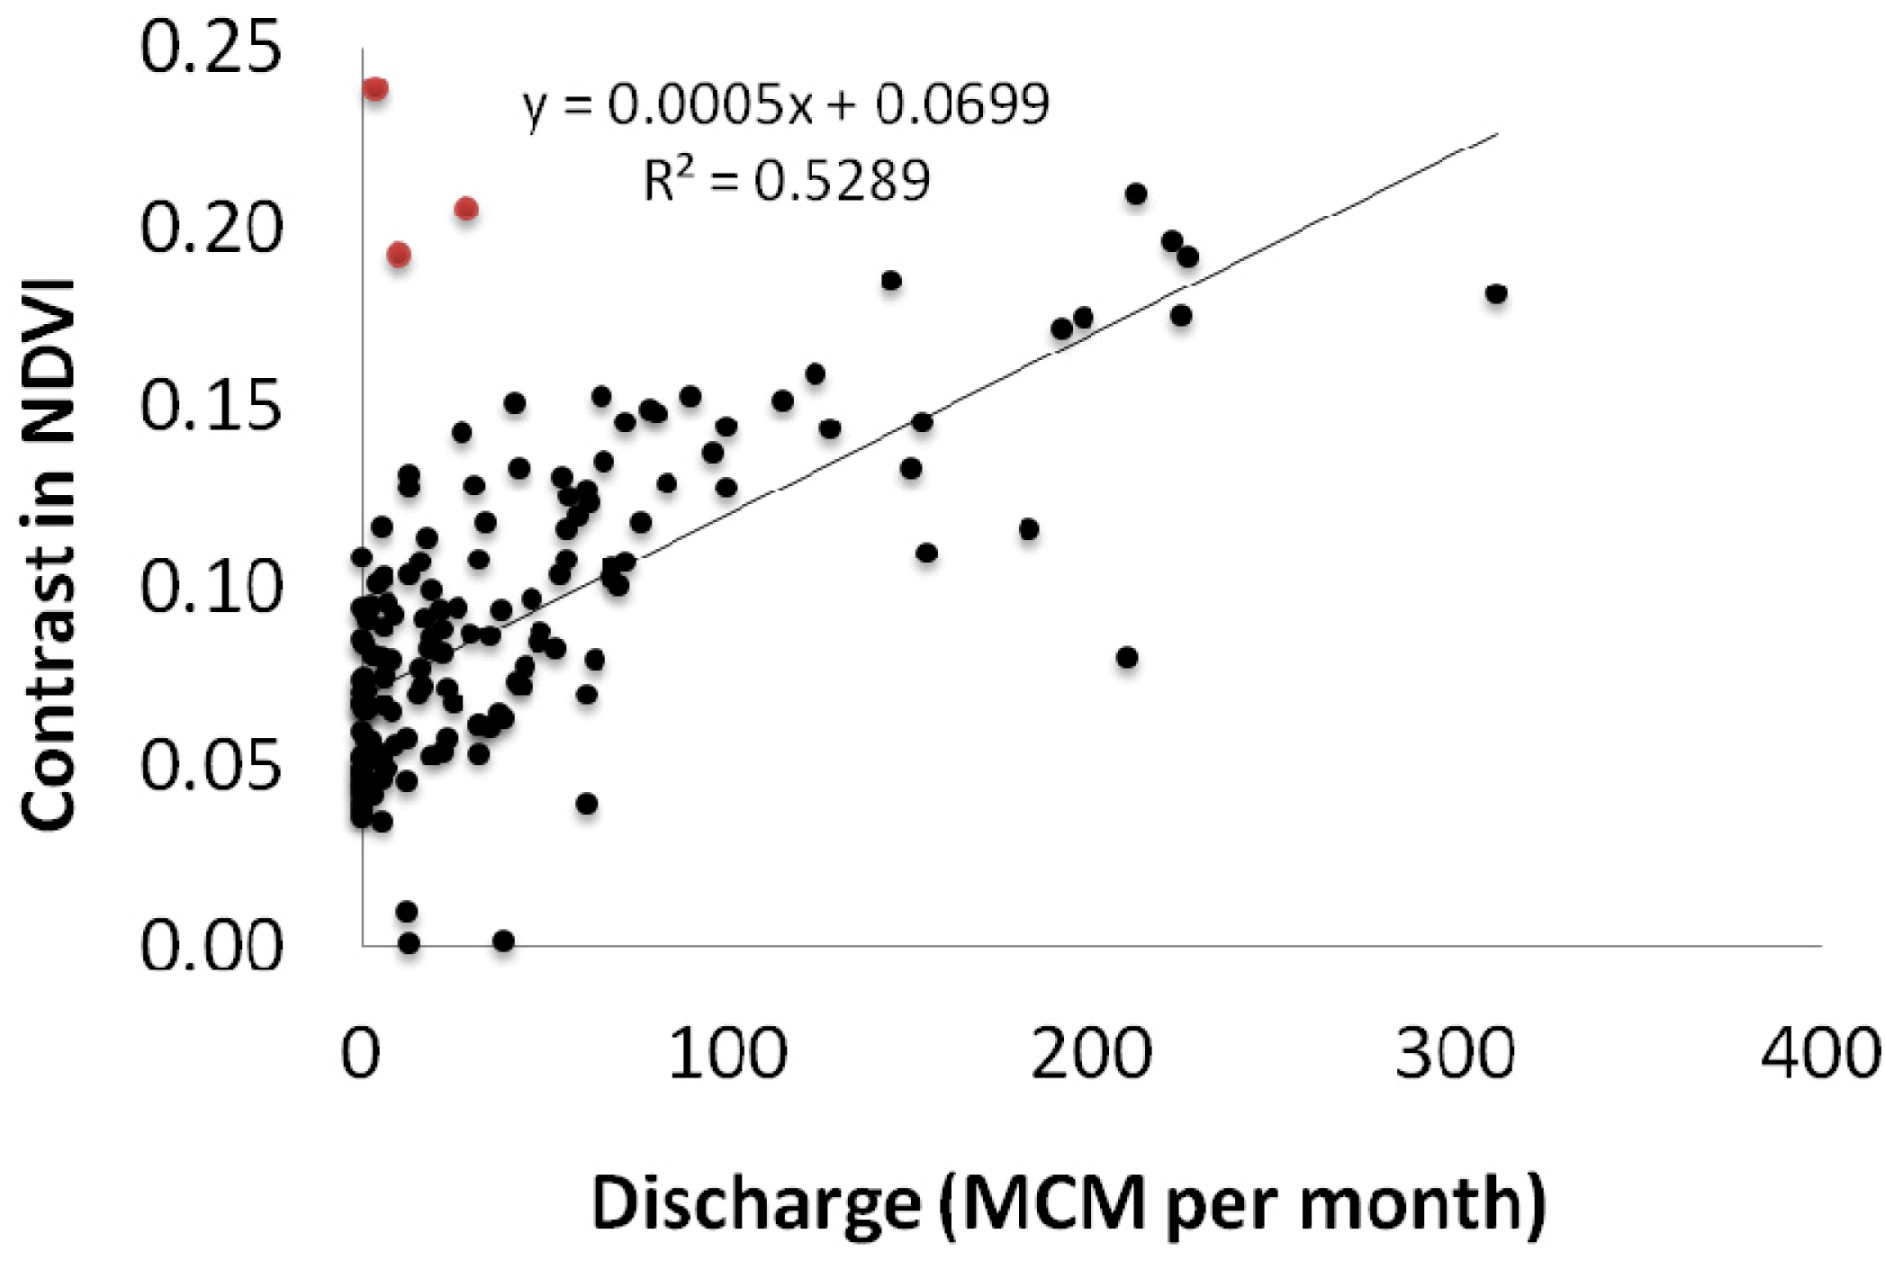
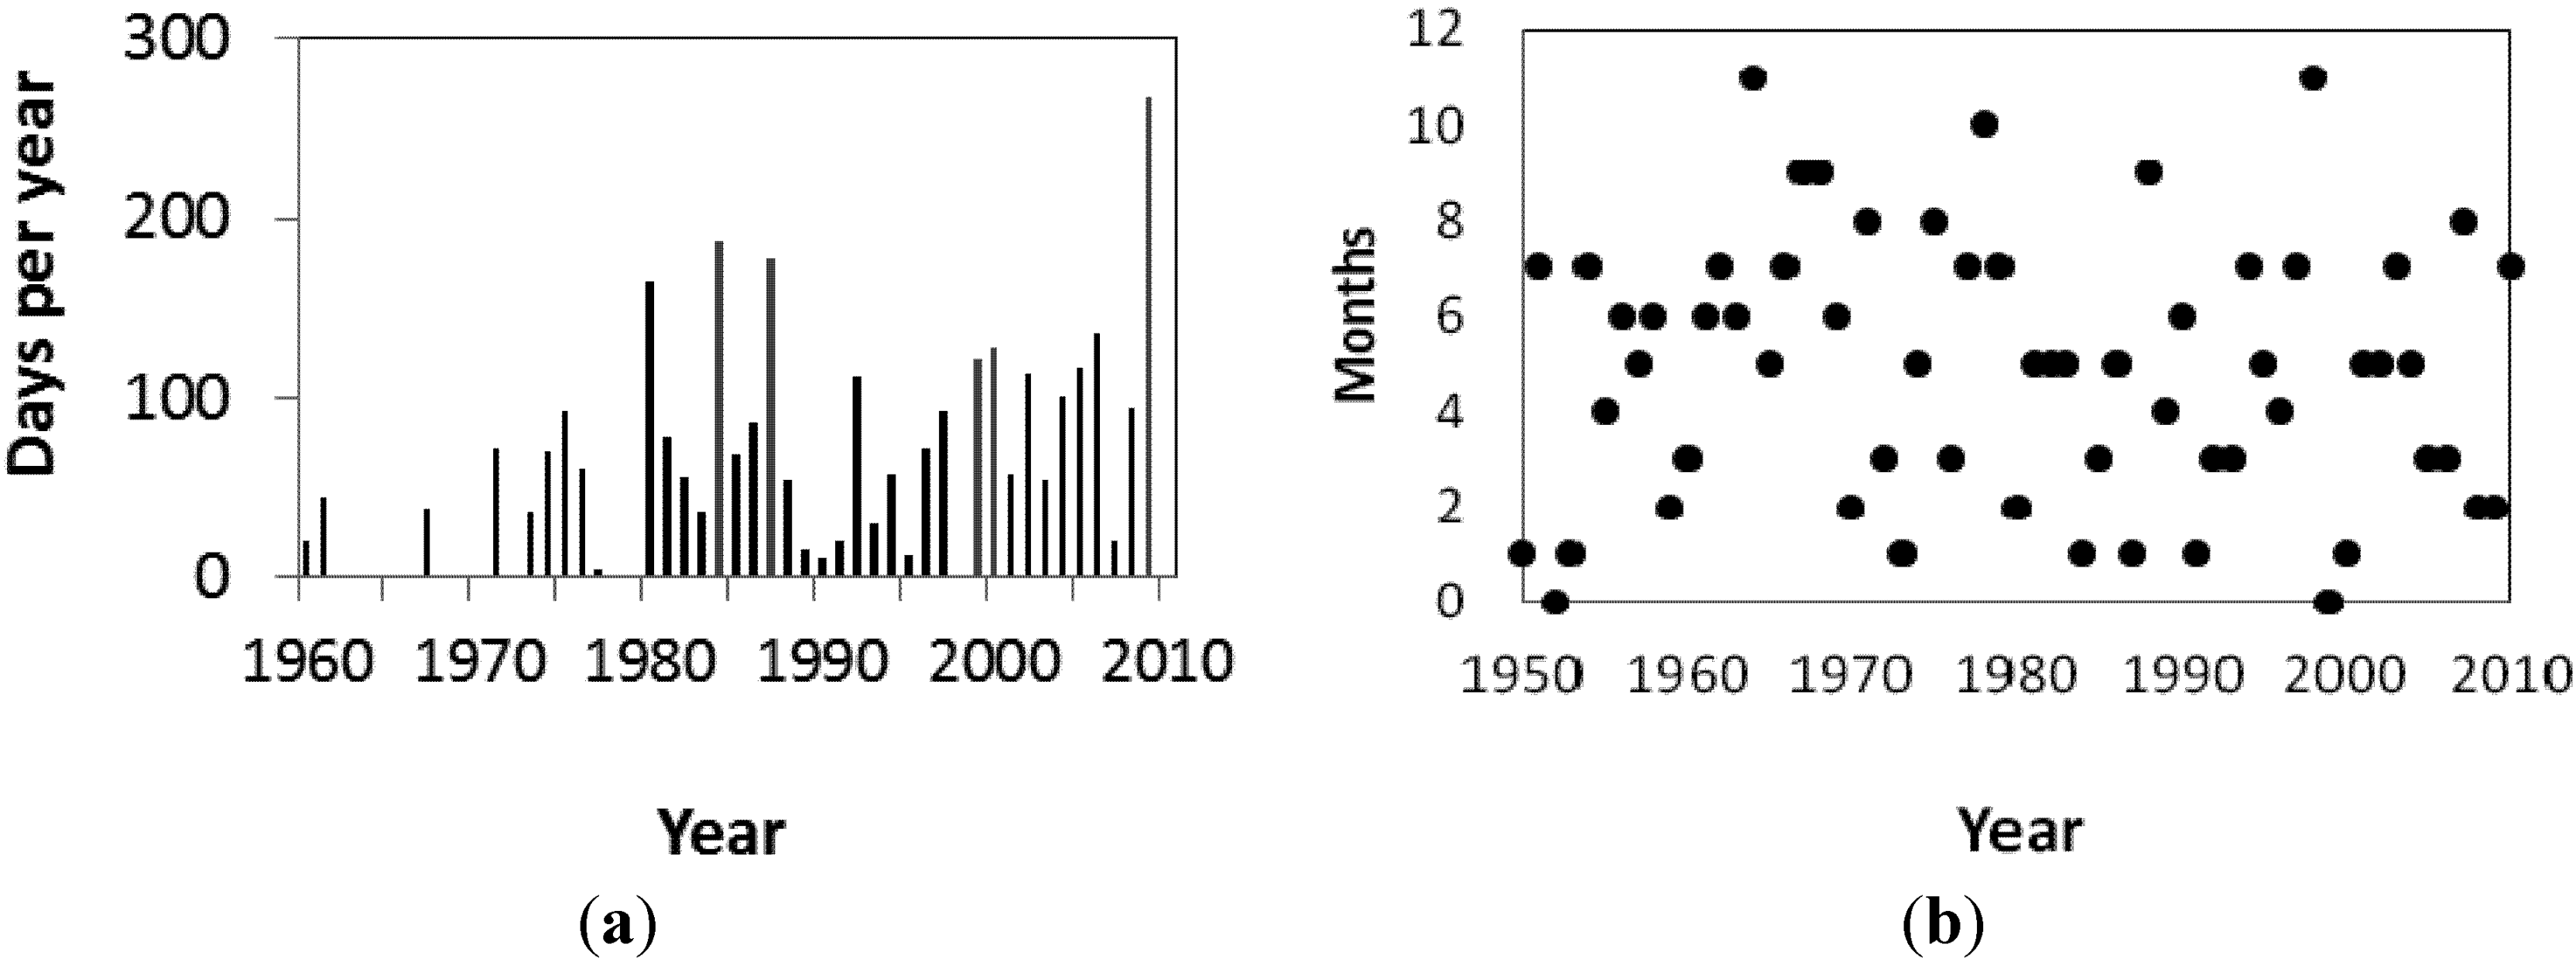
3.4. Discharge into the Lorian Swamp and Effects on Surface Water

The increased frequency and duration of low water discharge events at Archer’s Post has a significant impact on the discharge of water into the swamp (Figure 8a). The number of days per year when the river did not reach the head of the swamp in Merti was low in the 1960s and 1970s; the figure shows that the river was in fact permanent upstream from Merti in most years. This changed around 1980 when the river became ephemeral as the number of days that it did not reach Merti increased significantly, and since then, the El Nino year of 1998 was the only year with continuous flow. The number of days without water reaching the swamp is generally high during la Nina related drought years (indicated in red) like 1984, 1987, 1999, 2000 and 2009.
What is the effect of reduced water discharge on the riverine water filling the wetland and reaching Habaswein at the end of the Lorian Swamp? There is remarkable variation among years related to cycles of wet and dry years associated with the El Nino Southern Oscillation, without an obvious trend (Figure 8b).
Figure 8. (a) Number of days per year with discharge at Archer’s Post below 0.18 MCM per day, the threshold for the river to reach Merti at the head of the Lorian Swamp; red bars indicate drought years; (b) Number of months per year when discharge at Archer’s Post exceeded 40 MCM per month, the threshold for the river to reach Habaswein at the end of the Lorian Swamp.
Water 04 01009 g008

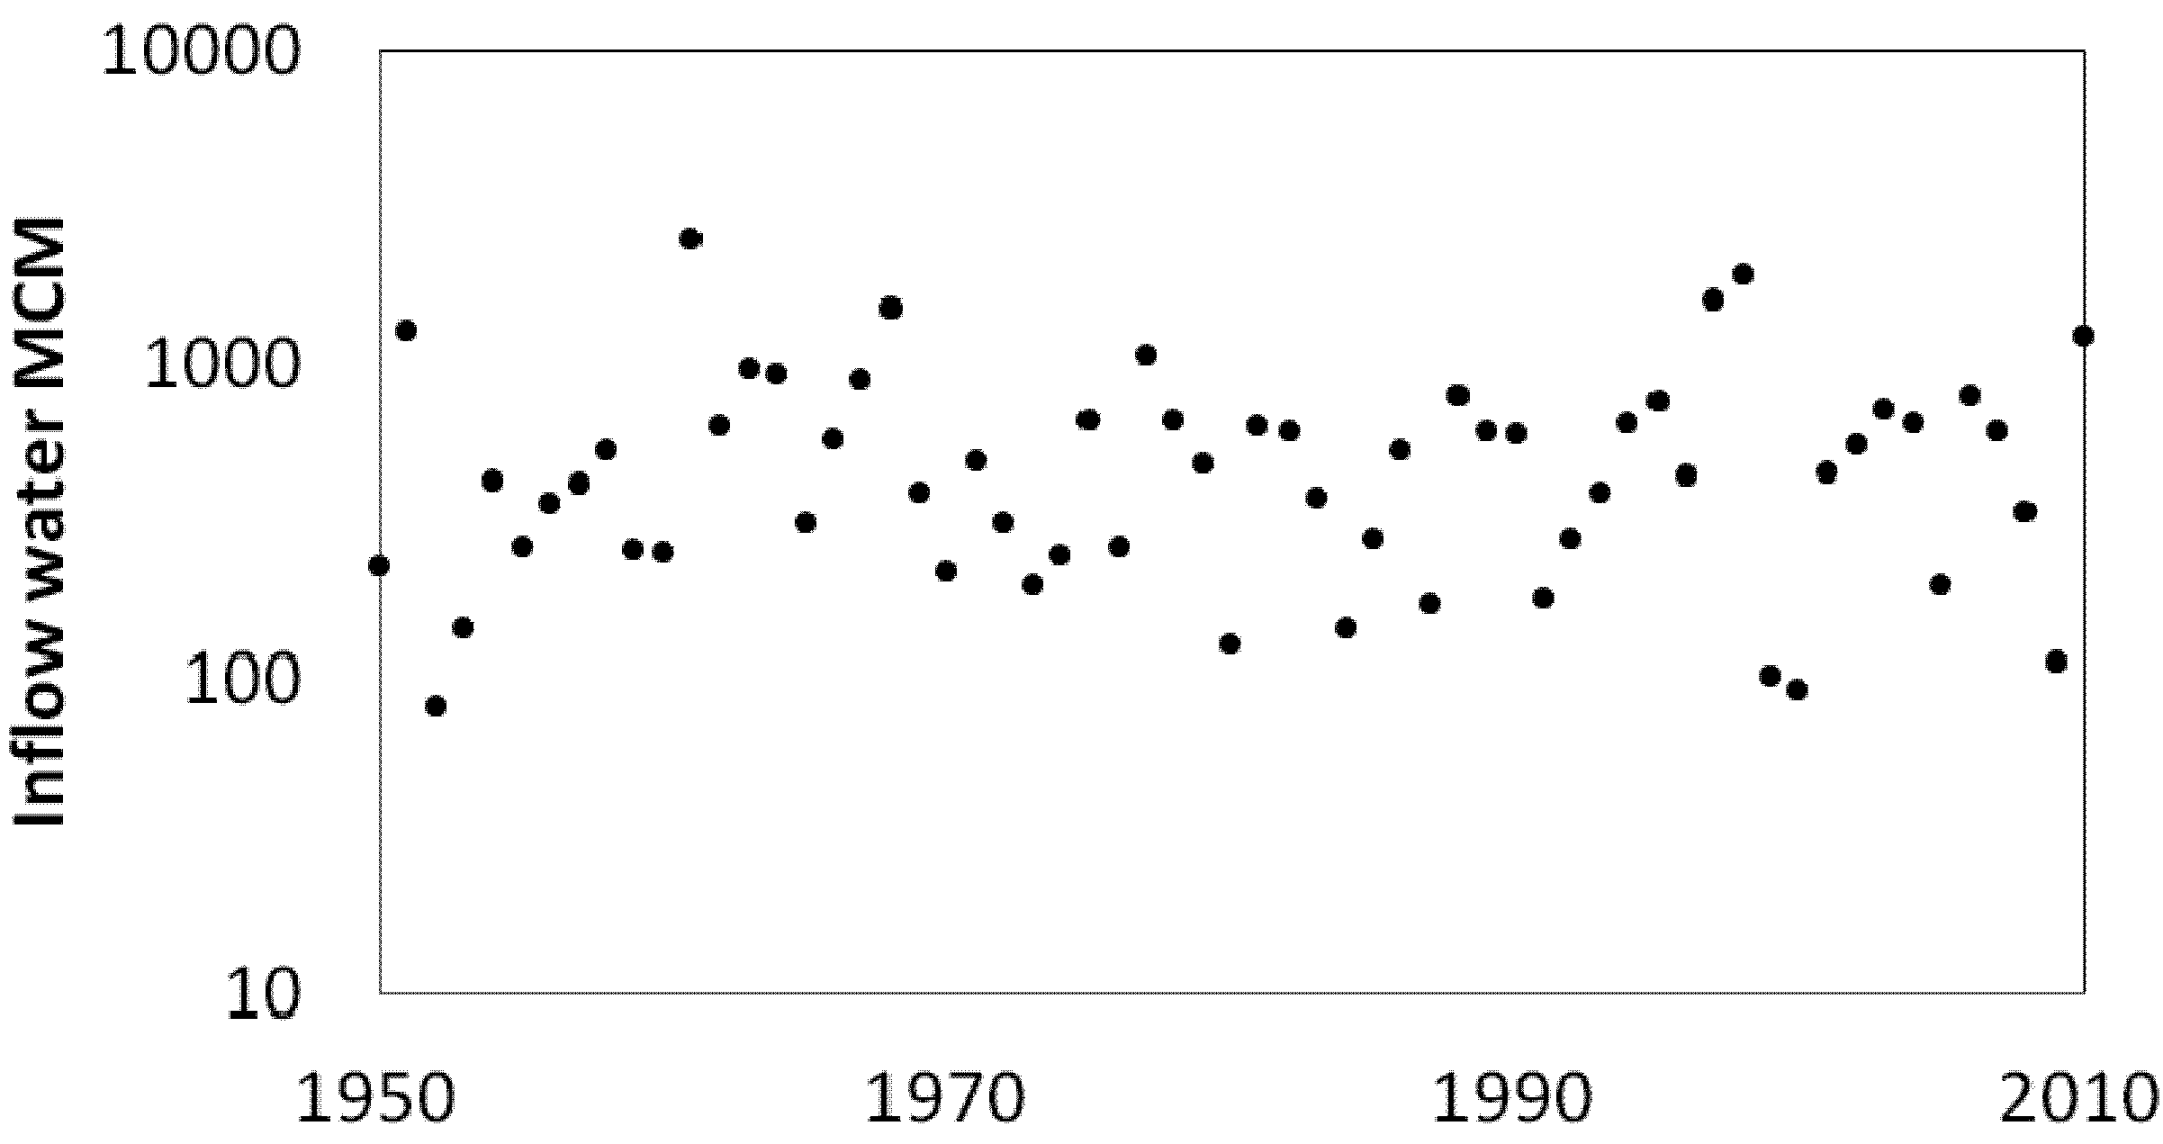
3.5. Total Annual Discharge into the Swamp and Recharge of the Merti Aquifer

Thus far, we have analyzed the effects of increased frequency of low discharge events on the availability of surface water in the Lorian Swamp. The Lorian Swamp is also considered to recharge the Merti Aquifer (Figure 1), and given this, it is relevant to assess the total volume of water entering the swamp in order to assess whether the aquifer recharge is under pressure. The Ewaso Ng’iro discharges on average 571 MCM per year in the Lorian Swamp, with significant variation between years (Figure 9). Regression analysis did not reveal a significant trend in the volume of water entering the swamp.
Figure 9. Total annual inflow (MCM) of water into the Lorian Swamp 1950–2010.
Water 04 01009 g009

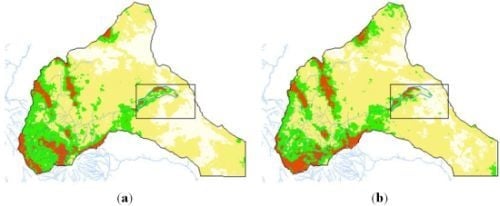
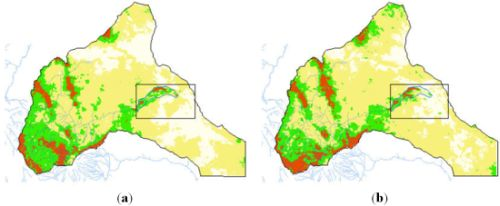
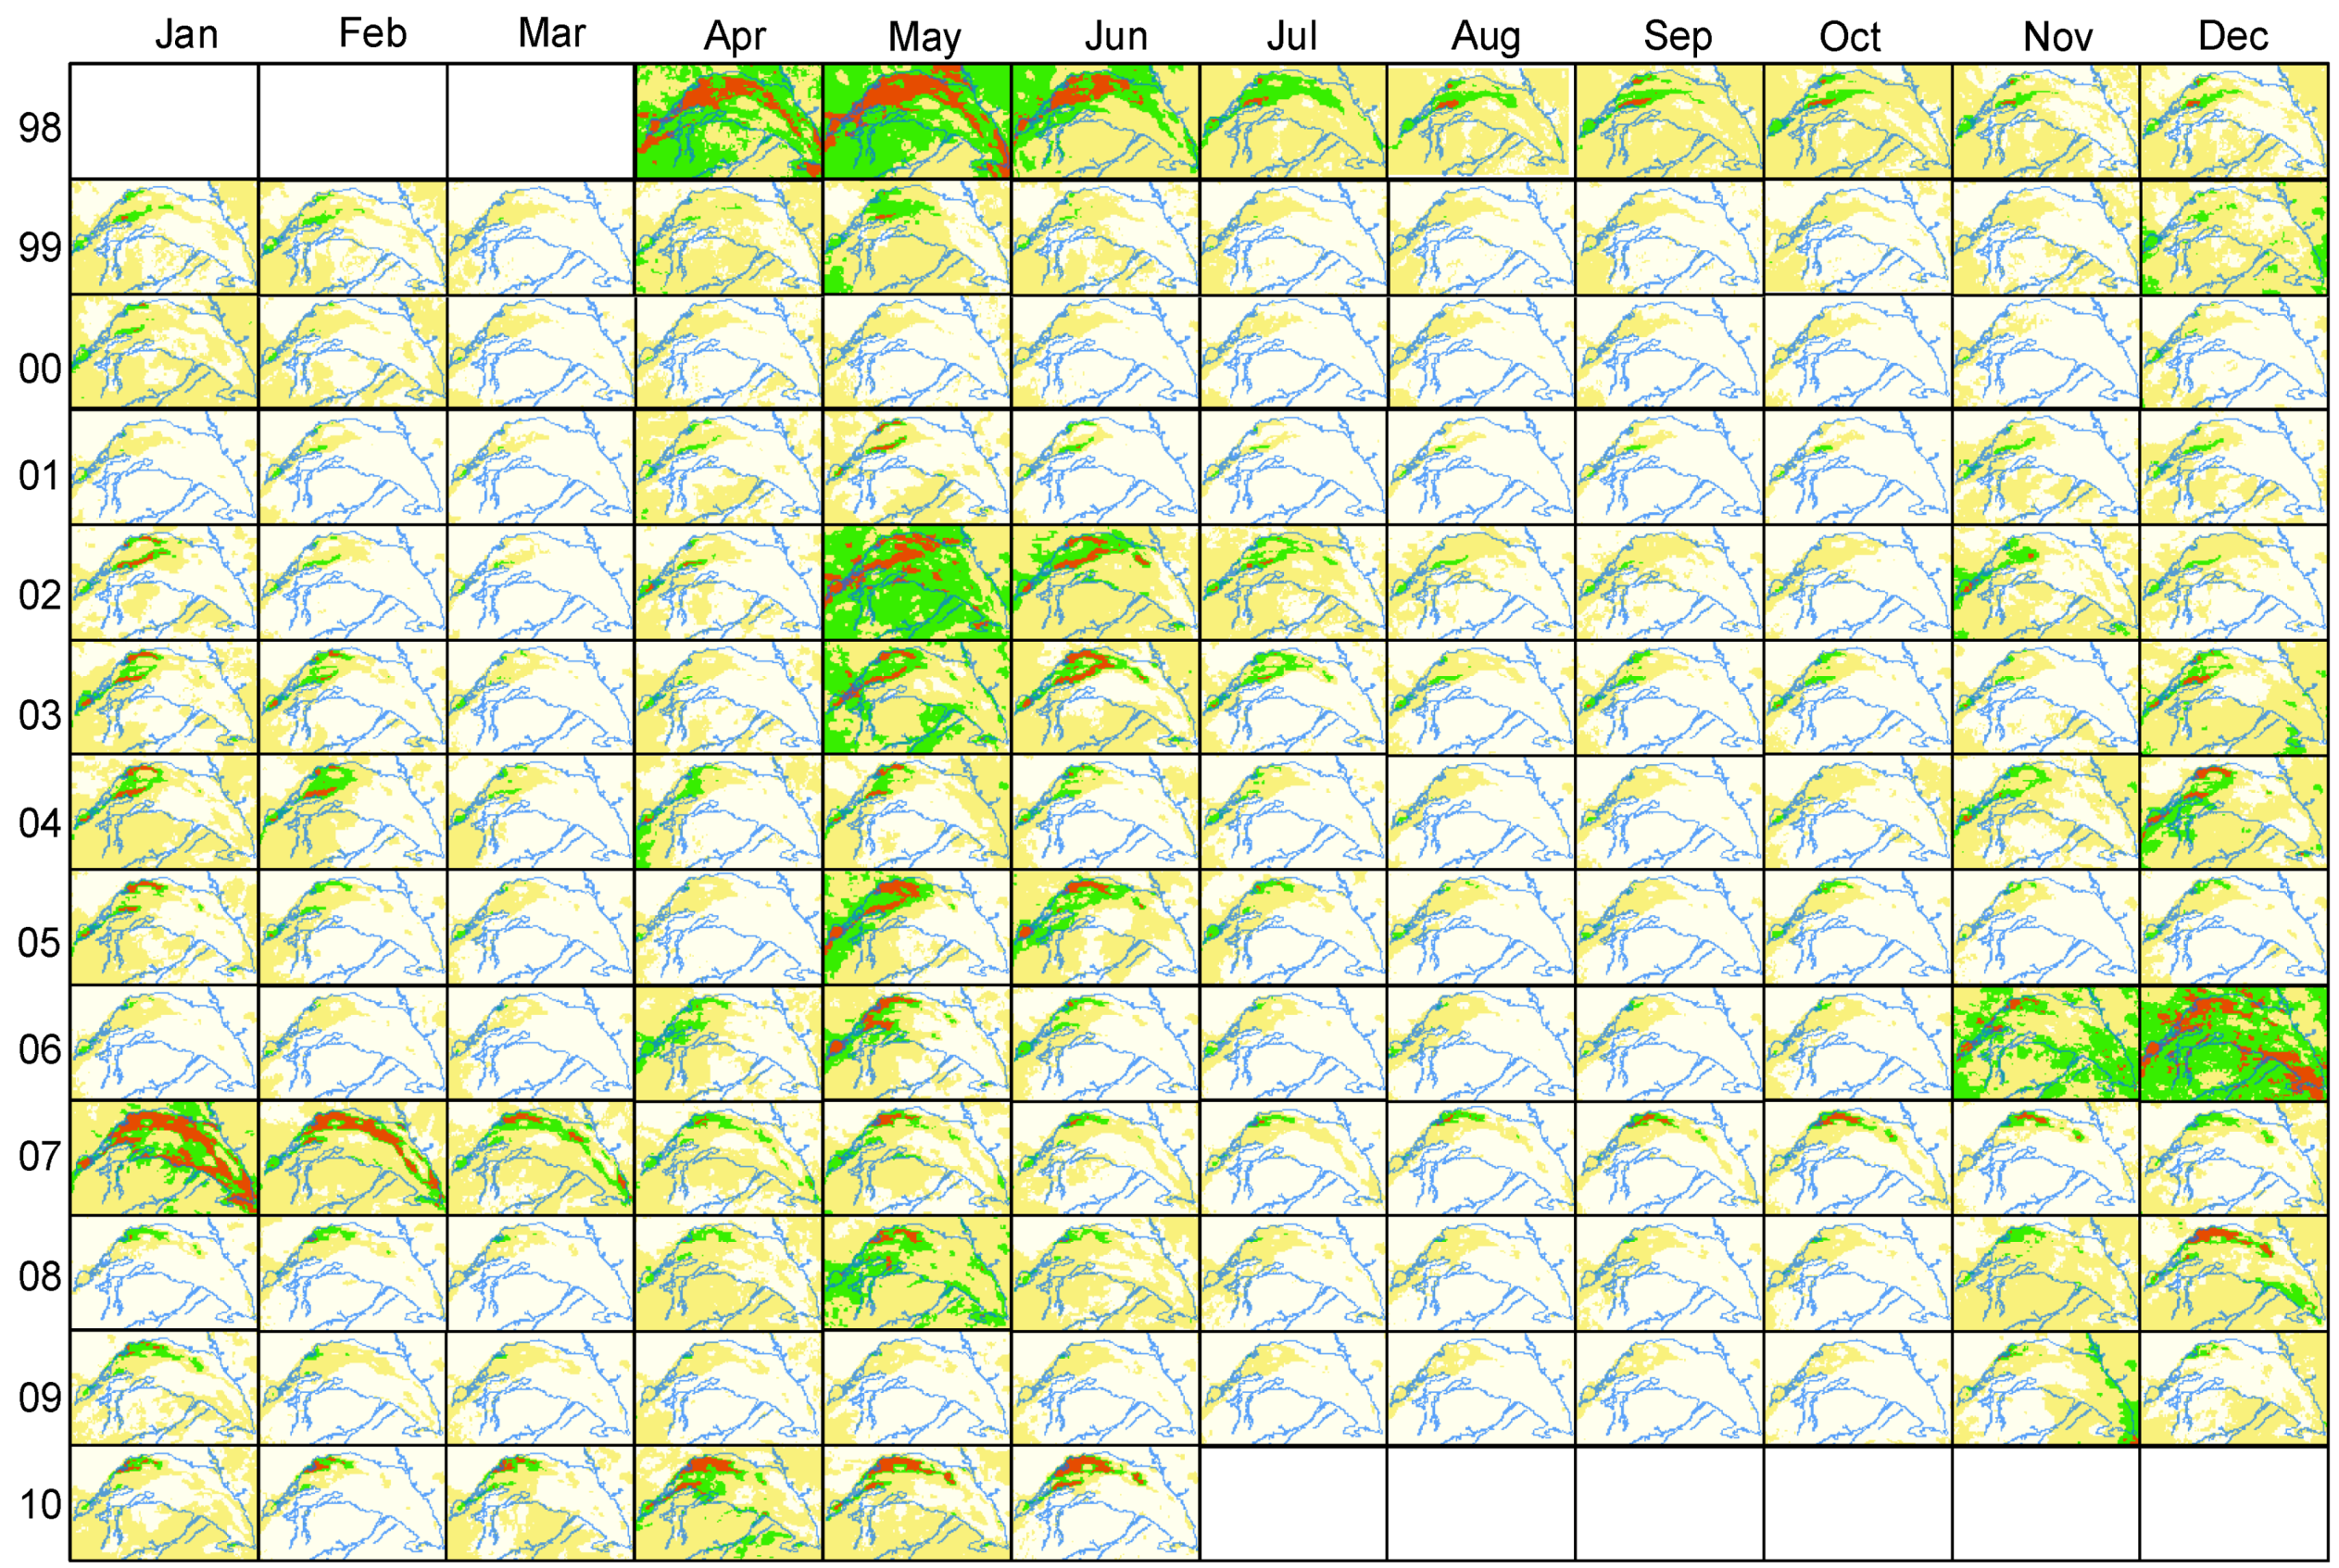
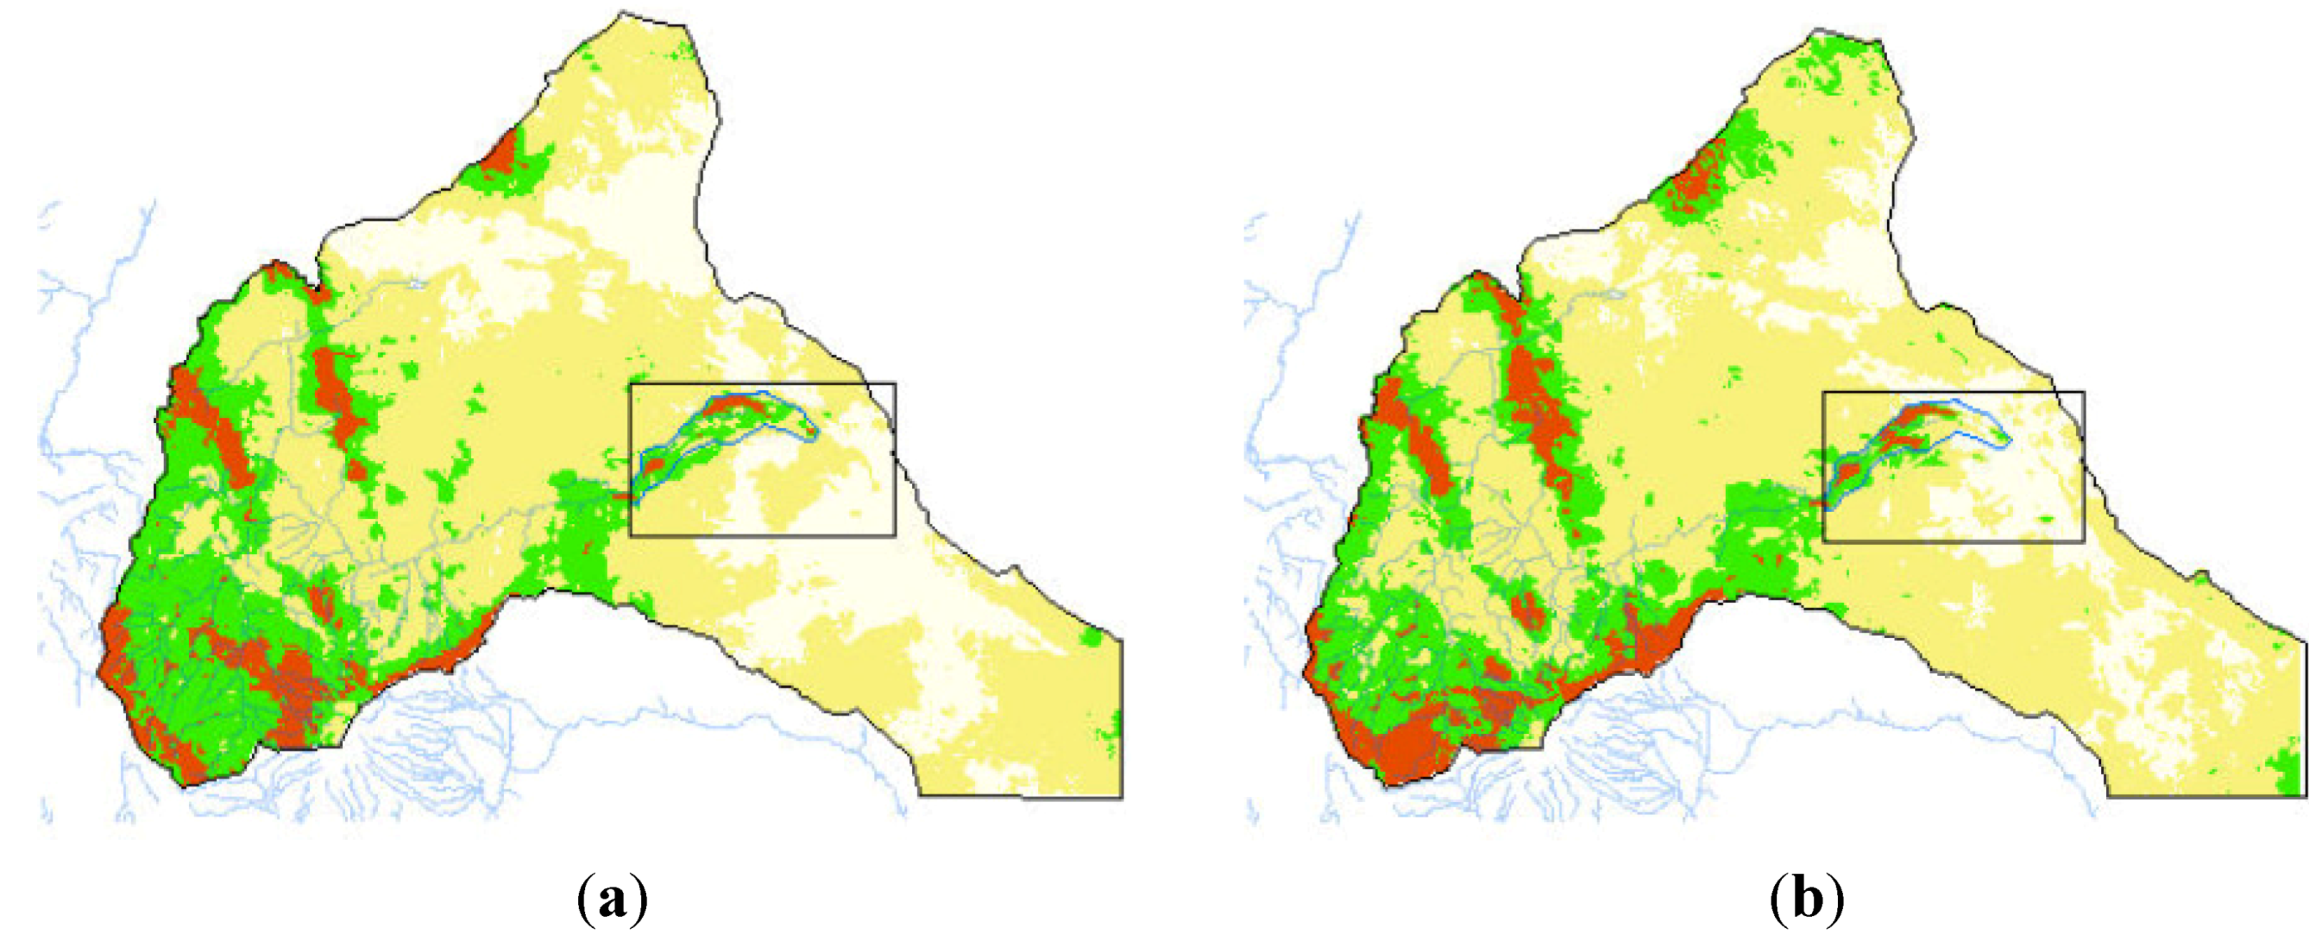
3.6. Vegetation Phenology of the Swamp and Surrounding Rainfed Areas

Given the high seasonal and inter-annual variation in the volume of water discharged into the swamp, one would expect noticeable variation in vegetation production. There is large variation in monthly NDVI for the swamp and the surrounding rainfed area (Figure 10). The rainfed vegetation shows seasonality; the vegetation greens up one month after the onset of the long rains (March to April) and short rains (October and November). This phenological pattern is highly irregular: several months of dense green vegetation occurred during the El Ninos of 1997 and 1998, and of 2006 and 2007, while vegetation was also intensely green during the long rains in 2002. However, there were many years when the rainfed vegetation did not green up at all, such as during the la Nina related droughts in 1999 to 2001 and in 2009. The vegetation of the swamp had a pattern of greening that coincided with that of the surrounding areas at some times. At other times, however, the swamp greened up while there was no change in NDVI of the rainfed vegetation.
The pattern of vegetation greenness of the swamp area and the surrounding rainfed vegetation is further expressed in Figure 11. Vegetation was greener during and after El Ninos in 1998 and 2006, while below average NDVI was observed during la Ninas in 1999 to 2001, and from 2008 to 2009. The figure further confirms the pattern of lower NDVI in the surrounding rainfed areas.
One would expect that the discharge of river water into the swamp would promote primary production and thereby increase the NDVI of the swamp above that of the surrounding rainfed areas. Such effect did indeed existed; the difference in NDVI between the swamp and its surrounding rainfed area increased significantly with the amount of water that entered the swamp over the preceding two months (Figure 12).
Three outliers in the upper left part of the graph (Figure 12) represent months (May and June 2005 and June 2006) when the swamp had an NDVI of 0.20 or more units higher than the surrounding rainfed areas, without a noticeable inflow of water from the sections of the Ewaso Ng’iro River above Archer’s Post. We visually inspected the NDVI images for the whole catchment to assess whether there were other areas of land downstream of Archer’s Post that had received rain, which could explain why the swamp was having such elevated NDVI in this period.
This was indeed the case; in both years, there was an area to the southwest of the swamp that was green (Figure 13). We suggest that runoff from these areas discharged into the Lorian Swamp and could explain why the swamp was so intensely green. We thus consider these observations as outliers and discarded them from the regression analysis. Apparently, the catchment above Archer’s Post is not the only one supplying water to the swamp; other areas below Archer’s Post do occasionally contribute, as well.
Figure 10. Monthly SPOT VEGETATION NDVI ( Water 04 01009 i001 < 0.4; Water 04 01009 i002 = 0.4-0.6; Water 04 01009 i003 =0.6-0.8; Water 04 01009 i004 > 0.8) of the Lorian Swamp and its surroundings from April 1998 until June 2010.
Water 04 01009 g010
Figure 11. Fraction (%) of the inundated part of the Lorian Swamp (a) and the surrounding rainfed area (b) classified into four NDVI categories: Water 04 01009 i001 < 0.4; Water 04 01009 i002 = 0.4-0.6; Water 04 01009 i003 =0.6-0.8; Water 04 01009 i004 > 0.8.
Water 04 01009 g011
Figure 12. Relation between average discharge (MCM per month) into the swamp over the two months preceding the capture of the satellite imagery versus the contrast in NDVI between the Lorian Swamp and the surrounding rainfed area. Red symbols indicate outliers in May and June 2005 and June 2006.
Water 04 01009 g012
Figure 13. Distribution of NDVI in the Ewaso Ng’iro catchment in (a) June 2005; and (b) May 2006, showing areas to the southwest of the swamp with high NDVI.
Water 04 01009 g013

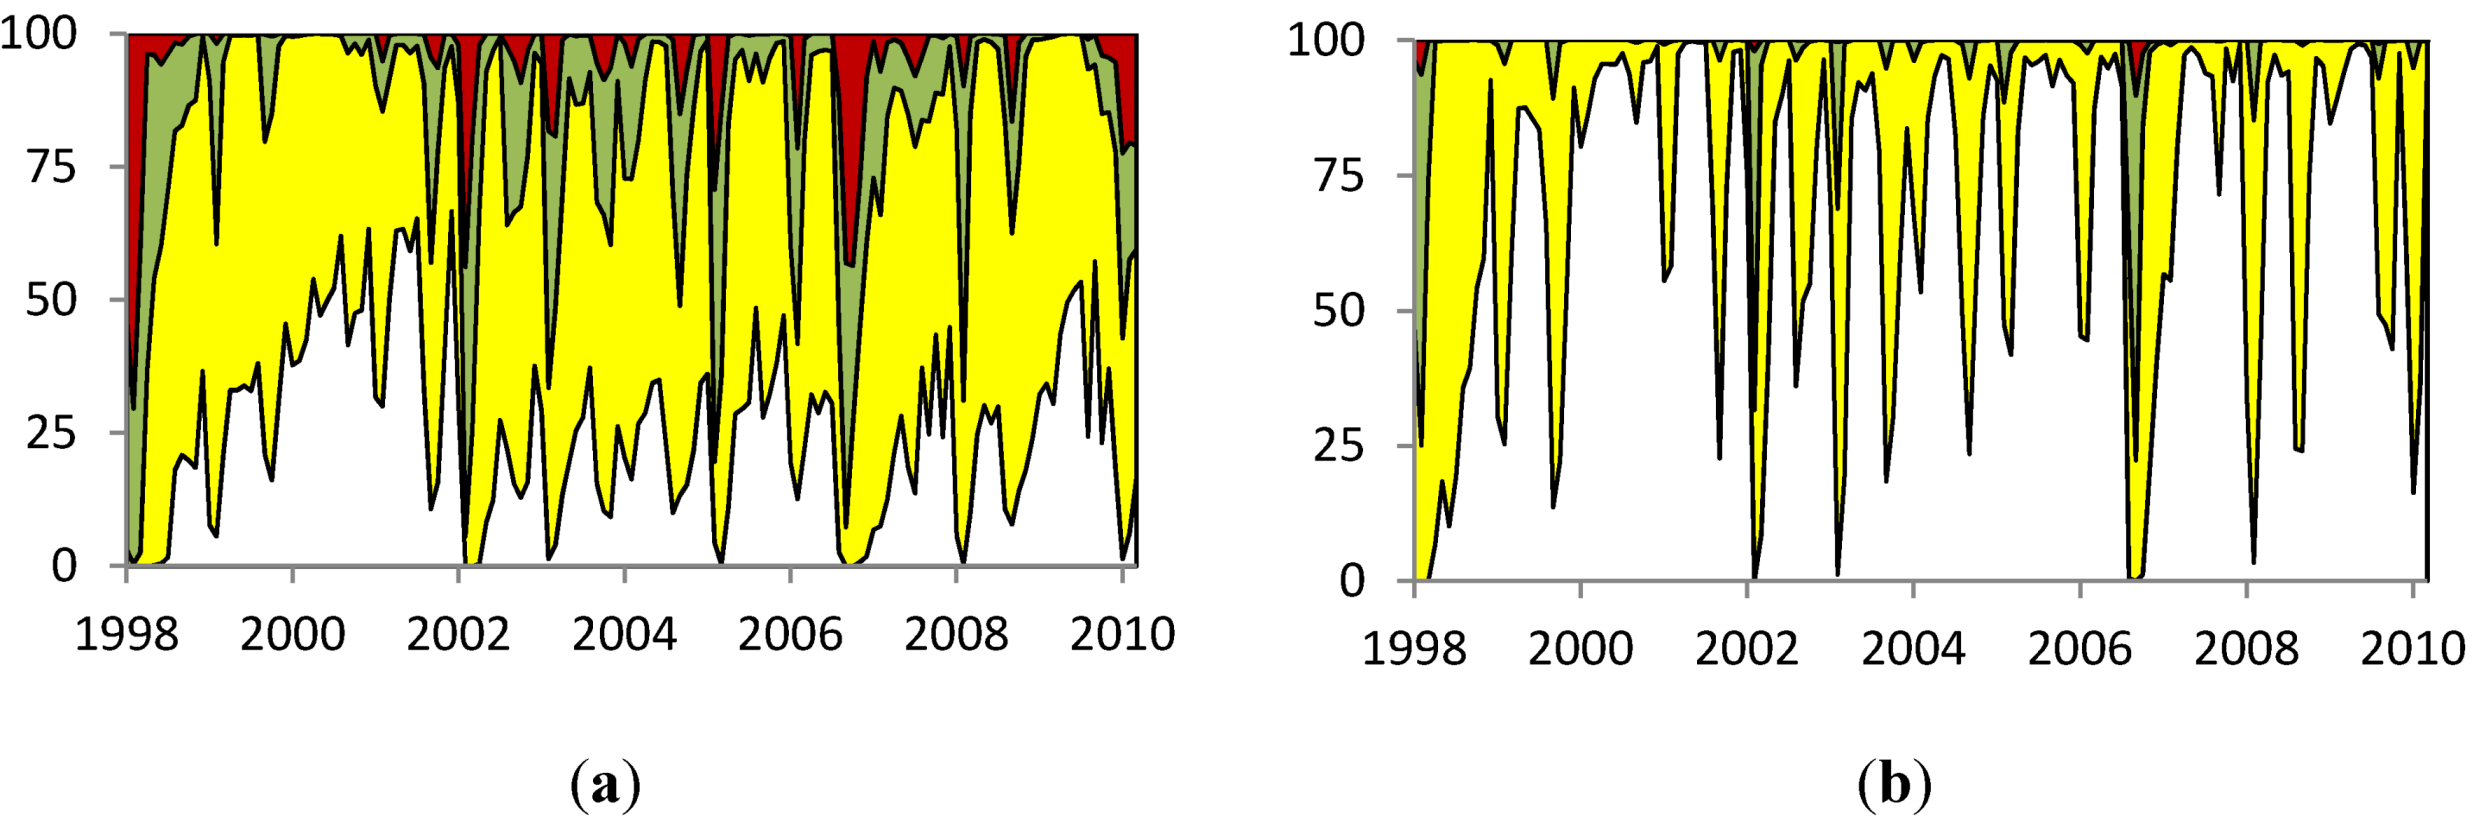
3.7 River Water Related Ecosystem Services and Benefits to People

The three categories of water, the final services delivered by these water categories and the benefits they provide to people are described in Table 1. Distinction is made between water used for primary production by plants, water used for livestock drinking, domestic use and for fish farming, and water used to recharge the Merti Aquifer.
Part of the surface water results in production of wetland vegetation, characterized by tall and stiff perennial grasses and reed beds at lower sites. This vegetation is little used by livestock and wildlife in the wet season for three reasons: first, the swamp is hard to access in that period because of muddiness; second, the animals prefer the nutritious vegetation in the rainfed uplands instead of the less nutritious wetland vegetation, and third, herders prefer to keep their animals away from water in the swamps because they are hotspots for disease transmission. This reverses during the dry season when the swamp has dry soil and a biomass quantity exceeding that in the uplands. During this period, and particularly in drought years, livestock is attracted to the swamp by the availability of surface water and forage resources.
Table 1. Ecosystem services provided by the water in the Lorian Swamp, their usage and benefits, and the estimated demand for water for provision of final ecosystem services.
Ultimate ecosystem service Final ecosystem service Demand for water in MCM per yearBenefit
Surface water underpinning primary productionLivestock production UnknownFood and asset
Wildlife conservation UnknownPublic good
Surface water used for drinking and sanitationPeople, water for drinking and domestic use 0.50 Nutrition and hygiene
Livestock production 0.76 Food and asset
Wildlife conservation 0.03 Public good
Fish productionUnknownFood
Irrigated cropsUnknownFood
Ground water used for drinking and sanitationPeople and livestock, water for drinking and domestic use5.50 Nutrition and hygiene Food and asset
The surface water in the swamp is used for livestock and domestic use. Considering a daily water requirement of 0.025 m3 per person [18], we estimate a water demand of 1375 m3 per day or 0.50 MCM per year for the 55,232 people living along the edges of the swamp, mainly in Merti, Sericho, Kinna and Garbatulla [19]. The drinking water demand from the 104,415 TLU of livestock and 4425 TLU of wildlife within 15 km reach of the swamp, an area of 8548 km2, is estimated at 2088 and 89 m3 per day or 0.76 and 0.03 MCM per year (Table 1). This demand for water by humans, livestock and wildlife is met by surface water and ground water. Surface water is finally also used to produce crops and fish, both recent innovations in this area, but further information on crop and fish production is unavailable at the moment.
The Merti Aquifer, which according to Mumma et al. [10] has an estimated recharge of 3.3 MCM per year supplies water through boreholes to an increasing number of people, for example the Dadaab refugee camp hosted 440,000 people in August 2011. The water demand of the people in the refugee camp alone would be 11,000 m3 per day or 4.02 MCM per year considering the same daily water requirement as above. Mumma et al. [10] estimated an abstraction of 5.5 MCM per year when considering the camp and other boreholes. The actual level of abstraction is likely to be still higher if we consider that the population of the camp had increased to above 500,000 by the end of the drought in 2011.

4. Discussion and Conclusions

This paper reviews the abstractions in the upper Ewaso Ng’iro catchment and the potential effects of these abstractions on the benefits people derive from water entering the Lorian Swamp, a large wetland area in the middle of an arid land environment. First we report an increase in the permitted abstractions, but it remains difficult to estimate how much water is effectively abstracted as the actual abstractions are thought to be significantly higher than the permitted ones, particularly in dry periods when 60% to 95% of the river water in the upper basin is abstracted [20,21]. Given these uncertainties, Mutiga et al. [22] followed a different approach and estimated the demand for water in the upper part of the catchment to be 113 MCM in the year 2000. They reported that water demand for irrigation of 46 km2 of cropland, which accounted for 80% of the total demand for water, peaked in the dry season from February to March, and July to September. The demand for domestic use and livestock drinking water, which accounts for 10% and 6% of the total demand for water, respectively, remains more stable throughout the year. This leads to the conclusion that abstractions in the dry season, when river discharge is low, might be significantly larger than the annual 113 MCM. The demand for water is forecasted to further increase to 220 MCM per year in 2015 [22].
How did these increased abstractions affect the discharge of the Ewaso Ng’iro River? Mutiga et al. [22] reported that the level of abstractions for irrigation and other uses in the upper reaches of the catchment was such that in February, no water reached the confluence of the rivers (located above Archer’s Post) draining the Aberdares (Ewaso Narok) and Mount Kenya. In line with this, it is not surprising that our analysis revealed an increase of the frequency of low discharge events at Archer’s Post. For the first time since the 1950s, the Ewaso Ng’iro remained dry at Archer’s Post for a full month in February 2011 [23]. Although this happened during a severe drought, abstractions are likely to have aggravated the situation. This remains speculative, however, and the relative roles of the abstractions and the drought, which occurred during la Nina, remain to be established.
We then extrapolated the historically observed discharge at Archer’s Post and demonstrate that the number of days that the river does not reach the head of the swamp increased over time, a process known as “basin closing” that we attribute to the abstractions upstream. This finding of reduced probability of water reaching the swamp appears to contrast with the finding that there is no significant trend in total annual discharge into the Lorian Swamp. However, the first analyses were based on daily discharge data, while the latter considered annual totals. Further, there is a possibility of a type II error not picking up a trend when in reality there is one, which is likely when there is high variation in the dependent variable, which was the case in this analysis. If, in reality, there were a downward trend, it might require a record of a hundred of years or more to pick up such trend. A timelier alert would be essential to support those managing the basin, and hydrological modeling forms the alternative option to analyze the effects of abstractions on the hydrology of the swamp. We recommend following such a modeling approach to reach a conclusion on the downstream effects of the abstractions upstream.
Trends in discharge will also be affected by climate change. Current Global Circulation Models (GCMs) forecast higher rainfall under climate change for East Africa [24]. However, more recent analysis of the historic rainfall record for upland Kenya (including the Aberdares and Mount Kenya) carried out by Williams and Funk [25] revealed declining annual rainfall, an observation which challenges the predictions of the current GCMs for rainfall in Eastern Africa. Williams and Funk argued that the warming of the Indian Ocean is leading to a drier, rather than a wetter, future in East Africa, an effect not considered in current GCMs. The combined effects of climate change and abstractions on discharge into the Lorian Swamp thus depend on the assumptions on the impact of climate change on rainfall. Climate change would mitigate the effects of abstractions under the current IPCC scenarios, but would strengthen the effects of abstractions towards reduced discharge into the swamp if the effects of the Indian Ocean were to be included in future GCMs.
To what extent does the reduced discharge of water into the swamp affect downstream water users? Our results suggest that the benefits from surface water are sensitive to abstractions upstream, as increases in abstractions result in higher frequency of the river running dry. This forces the populations living along the river and at the fringe of the swamp to turn to boreholes to secure the water they need for domestic uses, watering of their animals, and the production of fish. As for the water used in primary production, we employed satellite imagery to compile evidence for a link between the Ewaso Ng’iro and the vegetation in the Lorian Swamp. We demonstrated that the Ewaso Ng’iro River contributes significantly to the greening up and biomass production of the swamp. The abstractions are thus likely to affect both surface water dependent ecosystem services, but the effects on the well-being of communities remain largely unknown.
The Lorian Swamp and other similar wetlands are not just important as local entities. Certainly, they do provide water and feed for livestock in the dry season, but, equally important, is that their presence in vast areas of arid lands enables herders to effectively use these rangelands during the wet season. Without the wetlands, the drier uplands would have more limited value because herders would not have the nearby feed and water reserves to accommodate them during the dry season. The loss of the wetlands would imply a concomitant loss of access to the drylands, unless herders are willing and able to trek larger distances to alternate places in dry seasons. Considering the wetlands in isolation of adjacent uplands underestimates their value, and diversion of upstream river water potentially has the impact of not only decreasing the value of the wetlands, but also of the adjacent upland grazing areas because their use becomes less profitable when the dry season wetland reserves are lost.
Our results revealed that the Lorian Swamp is poor in mammalian wildlife, which contrasts with the richness of large mammal species reported in the early twentieth century [8]. The absence of wildlife in the swamp, however, fits in with an earlier reported pattern of the distribution of wildlife in Northern Kenya, of wildlife being less frequently recorded in the proximity of water and livestock [26]. The seasonal inundation during winter in the northern hemisphere makes the wetlands of the Lorian Swamp a potentially attractive habitat for migrant bird species. Yet information on avian biodiversity is scant and we are not aware of any studies analyzing the significance of the swamp to global biodiversity conservation. Given the change in catchment hydrology, we suggest it may be timely to undertake biodiversity surveys and assess the impact of hydrological change on the biodiversity of the Lorian Swamp.
The impact of abstractions on ground water related benefits are low at this moment, but may increase in the medium to long term, particularly when the mining of the aquifer continues to increase. Mumma et al. [10] acknowledge that the current rates of abstraction of 5.5 MCM per year exceed the recharge rate of 3.3 MCM per year. They argue, however, that the aquifer is rich in fossil water and consider that this, combined with recharge, has the capacity to continue supplying water at current abstraction levels for another 600 years [10]. This estimate may be optimistic, as it does not consider more recent increases of abstractions due to enlargement of the human population in the refugee camp and plans to extract water from the Merti Aquifer at Habaswein to supply the city of Wajir with drinking water through a 114 km long pipeline [27]. Furthermore, GIBB [9] considered the estimated volume and recharge rate of the aquifer highly uncertain, and additional research is needed to more accurately quantify it. Given these developments and uncertainties, it may be wise to improve the management of the abstractions from the Merti Aquifer. This requires far better information on basic hydrological parameters, such as the stock of water stored in the aquifer and the level of abstractions and recharge.
In summary, an effective water use regulation and management plan in the Ewaso Ng’iro basin is needed to ensure a fair, sustainable and productive temporal and spatial allocation of water resources among the diverse human and ecosystem users, both upstream and downstream. This will also ensure that water users that depend on the Lorian Swamp in the dry season and during droughts are not rendered vulnerable because of unregulated upstream abstractions [28].

Acknowledgments

This research was supported by the CGIAR research program on Water, Land and Ecosystems (CRP 5) and a research grant received from DANIDA to the World Resources Institute and ILRI.

References

  1. Mungai, D.N.; Ong, C.K.; Kiteme, B.; Elkaduwa, W.; Sakthivadivel, R. Lessons from two long-term hydrological studies in Kenya and Sri Lanka. Agric. Ecosyst. Environ. 2004, 104, 135–143. [Google Scholar] [CrossRef]
  2. Ericksen, P.; Said, M.; de Leeuw, J.; Silvestri, S.; Zaibet, L.; Kifugo, S.; Sijmons, K.; Kinoti, J.; Ng’ang’a, L.; Landsberg, F.; Stickler, M. Mapping and Valuing Ecosystem Services in the Ewaso Ng’iro Watershed; International Livestock Research Institute (ILRI): Nairobi, Kenya, 2011. [Google Scholar]
  3. Ericksen, P.; Said, M.; de Leeuw, J.; Sylvestri, S.; Zaibet, L. Mapping ecosystem services in the Ewaso Ng’iro catchment. Int. J. Biodivers. Sci. Ecosyst. Serv. Manag. 2012, 8, 122–134. [Google Scholar] [CrossRef]
  4. Georgiaides, N.J. Introduction: Conserving Wildlife in Kenya’s Ewaso landscape. 2011, Smithsonian Digital Repository. Available online: http://si-pddr.si.edu/jspui/handle/10088/16705 (accessed on 4 December 2012).
  5. Liniger, H.P.; Weingartner, R.; Grosjean, M. Mountains of the World: Water Towers for the 21st Century—A Contribution to Global Freshwater Mountain Agenda; Institute of Geography, University of Berne: Berne, Switzerland, 1998. Available online: http://www.cde.unibe.ch/CDE/pdf/Mountains1998.pdf (accessed on 4 December 2012).
  6. Buytaert, W.; Friesen, J.; Liebe, J.; Ludwig, R. Assessment and management of water resources in developing, semi-arid and arid regions. Water Resour. Manag. 2012, 26, 841–844. [Google Scholar] [CrossRef]
  7. Herlocker, D.J.; Shaabani, S.B.; Wilkes, S. Isiolo distric. In Range Management Handbook of Kenya; Ministry of Agriculture, Livestock development and Marketing, Range Management Division and GTZ: Nairobi, Kenya, 1993; Volume II.5. [Google Scholar]
  8. Dracopoli, I.N. Through Jubaland to the Lorian Swamp, an Adventurous Journey of Exploration and Sport in the Unknown African Forests and Deserts of Jubaland to the Unexplored Lorian Swamp; Seeley Ltd.: London, UK, 1914. [Google Scholar]
  9. GIBB Africa Ltd. Study of the Merti Aquifer Final Report, Volume I—Main Report, GIBB Africa Ltd.: Nairobi, Kenya, 2004.
  10. Mumma, A.; Lane, M.; Kairu, E.; Tuinhof, A.; Hirj, R. Kenya, Groundwater Governance Case Study; Water Papers; Worldbank: Washington, DC, USA, 2011. Available online: http://water.worldbank.org/water/sites/worldbank.org.water/files/GWGovernanceKenya.pdf (accessed on 4 December 2012).
  11. Swarzenski, W.V.; Mundorff, M.J. Geo-Hydrology of North Eastern Province, Kenya; USGS Water Supply Paper 1757-N; USGS (U.S. Geological Survey): Reston, VA, USA, 1977. [Google Scholar]
  12. Mutiga, J.K.; Su, Z.; T. Woldai, T. Impacts of agricultural intensification through upscaling of suitable rainwater harvesting technologies in the upper Ewaso Ngiro North basin, Kenya. Hydrol. Earth Syst. Sci. Discuss. 2011, 8, 2477–2501. [Google Scholar] [CrossRef]
  13. Africover Project. Available online: http://www.africover.org/africover_initiative.htm (accessed on 4 December 2012).
  14. Bannari, A.; Morin, D.; Bonn, F.; Huete, A.R. A review of vegetation indices. Remote Sens. Rev. 1995, 13, 95–120. [Google Scholar] [CrossRef]
  15. SPOT-VEGETATION Programme. Available online: http://www.vgt.vito.be/ (accessed on 4 December 2012).
  16. Millennium Ecosystem Assessment. Available online: http://www.maweb.org/en/index.aspx (accessed on 4 December 2012).
  17. Fisher, B.; Turner, R.K.; Morling, P. Defining and classifying ecosystem services for decision making. Ecol. Econ. 2009, 68, 643–653. [Google Scholar] [CrossRef]
  18. Christensen, M.L. Kenya Briefing: IWRM and Trans-Boundary Water Resources Management in Kenya. 2009, Docstoc. Available online: http://www.docstoc.com/docs/49140183/Kenya---1-Kenya-and-Water (accessed on 11 December 2012).
  19. Kenya National Bureau of Statistics, 2009 Kenya Population and Housing Census; Kenya National Bureau of Statistics: Nairobi, Kenya, 2010.
  20. Kiteme, B.P.; Gikonyo, J. Preventing and resolving water use conflicts in the Mount Kenya highland-lowland system through water users associations. Mt. Res. Dev. 2002, 22, 332–337. [Google Scholar] [CrossRef]
  21. Notter, B.; MacMillan, L.; Viviroli, D.; Weingartner, R.; Liniger, H.P. Impacts of environmental change on water resources in the Mount Kenya region. J. Hydrol. 2007, 343, 266–278. [Google Scholar] [CrossRef]
  22. Mutiga, J.K.; Mavengo, S.T.; Su, Z.; Woldai, T.; Becht, R. Water allocations as a planning tool to minimize water use conflicts in the upper Ewaso Ng’iro North Basin, Kenya. Water Resour. Manag. 2010, 24, 3939–3959. [Google Scholar] [CrossRef]
  23. Ericksen, P. ILRI (International Livestock Research Institute), Nairobi, Kenya. Personal Communication, 2011. [Google Scholar]
  24. IPCC (Intergovernmental Panel on Climate Change), Fourth Assessment Report: Climate Change; IPCC: Geneva, Switzerland, 2007.
  25. Williams, A.P.; Funk, C. A Westward Extension of the Tropical Pacific Warm Pool Leads to March through June Drying in Kenya and Ethiopia; U.S. Geological Survey Open-File Report 2010-1199; USGS: Reston, VA, USA, 2010. [Google Scholar]
  26. De Leeuw, J.; Waweru, M.; Onyango, O.; Maloba, M.; Nguru, P.; Said, M.; Aligula, H.M.; Reid, R. Distribution and diversity of wildlife in Northern Kenya in relation to livestock and permanent water points. Biol. Conserv. 2001, 100, 297–306. [Google Scholar] [CrossRef]
  27. Kenya Wajir Habaswein Water Supply Project. Available online: http://www.agentschapnl.nl/en/onderwerp/orio-project-wajir-habaswein-water-supply-project (accessed on 4 December 2012).
  28. Mati, B.M.; Muchuri, J.M.; Njenga, K.; de Vries, P.F.; Merrey, D.J. Assessing Water Availability under Pastoral Livestock Systems in Drought-Prone Isiolo District, Kenya; IWMI Working Paper 106; IWMI (International Water Management Institute): Battaramulla, Sri Lanka, 2005. [Google Scholar]

