Article

Climate-Driven or Human-Induced: Indicating Severe Water Scarcity in the Moulouya River Basin (Morocco)

1
Department of Geography and Geology, University of Greifswald, Friedrich-Ludwig-Jahn-Str.16, D-17487 Greifswald, Germany
2
Potsdam Institute for Climate Impact Research, Telegraphenberg A31, D-14412 Potsdam, Germany
3
Department of Geo- and Environmental Sciences, University of Potsdam, Am Neuen Palais 10, D-14469 Potsdam, Germany
*
Author to whom correspondence should be addressed.
Water 2012, 4(4), 959-982; https://doi.org/10.3390/w4040959
Submission received: 28 September 2012 / Revised: 15 November 2012 / Accepted: 16 November 2012 / Published: 3 December 2012

Abstract

:
Many agriculture-based economies are increasingly under stress from climate change and socio-economic pressures. The excessive exploitation of natural resources still represents the standard procedure to achieve socio-economic development. In the area of the Moulouya river basin, Morocco, natural water availability represents a key resource for all economic activities. Agriculture represents the most important sector, and frequently occurring water deficits are aggravated by climate change. On the basis of historical trends taken from CRU TS 2.1, this paper analyses the impact of climate change on the per capita water availability under inclusion of population trends. The Climatic Water Balance (CWB) shows a significant decrease for the winter period, causing adverse effects for the main agricultural season. Further, moisture losses due to increasing evapotranspiration rates indicate problems for the annual water budget and groundwater recharge. The per capita blue water availability falls below a minimum threshold of 500 m3 per year, denoting a high regional vulnerability to increasing water scarcity assuming a no-response scenario. Regional development focusing on the water-intense sectors of agriculture and tourism appears to be at risk. Institutional capacities and policies need to address the problem, and the prompt implementation of innovative water production and efficiency measures is recommended.

1. Introduction

Globally, water resources are increasingly under pressure [1]. The rapidly accelerating exploitation of natural water resources caused by population growth, the intensification of agricultural production, and changing lifestyles associated with an increase of consumption represent the key reasons to cause severe environmental degradation [2,3,4,5]. Many populations are aware of the limited carrying capacities of the resources they use, but the complexity of challenges arising from increasing demands and associated environmental impacts does not allow for simplistic solutions [2,6]. Therefore, only minor progress is achieved when fostering economic growth while guaranteeing environmental sustainability [1,7]. Currently, most countries follow the paradigm of economic growth to ensure food security, employment and societal progress. The excessive exploitation of natural resources still represents the standard procedure to achieve socio-economic development. In this context, water plays a key role: the access and the ability to harness water has always been the prerequisite for human progress throughout history [8,9,10]. Increasingly, in recent decades, water resources have reached or already exceeded physical limits in many locations worldwide due to steadily increasing consumption rates [11,12,13]. Despite this growing demand at already critical water states, the lack of awareness and inaction, respectively, exacerbates the water situation [14]. The inadequate and excessive usage of available water resources is now threatening development, as any kind of economic activity requires a certain amount of water [3,9]. Next to (existing) technical know-how, an effective water resource management depends on supporting and enabling governance structures and on the enforcement of policy frameworks [15]. But, strategies for the protection of water resources and to safeguard future availability taken to date are still insufficient to account for challenges that result from the water demand of growing populations [4,16].
Additionally, water resources are particularly pressured by recent climate change in terms of interannual shifts of precipitation patterns, decreasing precipitation amounts and increasing temperatures [12]. Thus, the combination of growing water demand and increasingly limited water availability will lead to severe water supply problems if not compensated by innovative approaches [3,12,17].
One region seriously affected by increasing water scarcity is semi-arid North Africa [4,8]. As part of the Middle East and North Africa (MENA) countries, it is among the driest regions of the world, with only 1% of the world’s freshwater resources [5]. More than 20 years ago, Falkenmark [8] drew attention to the “massive water problem” in the region, stressing the natural finiteness of water resources and the absence of proactive approaches in order to avoid severe consequences. Falkenmark identified the human negligence of the negative feedback mechanisms of the physical environment, caused by the human exploitation of water resources, as the root cause for an alarming increase of regional water scarcity [18]. Further, North Africa has been classified as being a “key hotspot” of climate change, thus implying a further aggravation of the already critical water situation [4,19,20]. Due to the currently high economic dependency on the sufficiency of water, increasing water scarcity can lead to development failure (cf. the Millennium Development Goals) [9].
In the case study region of this analysis, the Moulouya river basin in north-eastern Morocco (Figure 1), water scarcity has long been a problem [21]. The average annual precipitation is markedly below 400 mm and is strongly concentrated in the cooler half of the year. Despite limited availability, water represents the core resource for the regional economy, which is predominantly agriculture-based [22]. The agricultural sector employs approximately 40% of the regional population and currently consumes ca. 87% of mobilized water resources (groundwater and surface water), thus, the socio-economic situation depends to a large extent on sufficient water availability [22,23]. Precipitation is the main hydrological variable, as non-conventional water production plays only a minor role and groundwater resources show alarming rates of degradation, e.g., salinization [22,24]. Due to the fragile water situation, climate change pronounced as decreasing or shifting precipitation will create additional pressures in particular for the fulfillment of agricultural water needs [22,25]. Problems will occur if governmental plans fostering regional development by placing emphasis on the extension of the water-consuming sectors of agriculture (“Plan Maroc Vert”: production increase) and tourism (“Plan Azur”: expansion of luxury tourism at the coastlines) do not include water compensation and efficiency measures [26,27]. At present, development objectives do not explicitly consider the problematic water situation as a critical barrier for the realization of targeted economic pathways [28]. Additionally, further pressures on water resources, such as regional population growth and population shifts towards urbanizing coastal areas, will amplify water demands. Hence, water is at the core of regional development processes, while at the same time its availability is highly insecure [19,22].
Figure 1. The Moulouya river basin located in North-Eastern Morocco.
Water 04 00959 g001
The following analysis focuses on relevant drivers for regional water scarcity in the Moulouya river basin. Currently, water management is mainly based on blue water availability (blue water: the amount of rainfall directly exceeding the soil’s storage capacity forming the total surface water runoff groundwater recharge, equivalent to the natural water resources) [29]. Innovative approaches, such as the inclusion of green water (refers to the fraction of rainfall infiltrated and stored in the soil, supporting primary productivity of natural and agricultural systems through evapotranspiration; thus, it is crucial for biomass production and rain-fed agriculture), into the regional water budget calculation are not yet pursued vigorously enough [29,30]. However, the main purpose of the article is to increase awareness, that adequate and innovative water management is essential for the region’s development and, further, to deliver an argument for promptly needed investments in water technologies. A set of quantitative indicators for climatic and human-caused pressures is used to assess the potential per capita water availability for 2005–2040. The use of indicators to determine the extent of a problematic situation is a frequently used tool in environmental assessments [10]. For this purpose, the Water Poverty Index (WPI) would represent a comprehensive tool to support effective water management [31]. The link between water demand and availability can reveal certain unsustainable patterns of water usage and, thus, support effective water management [31]. However, the lack of regional data represents a major constraint on the application of the WPI. Therefore, as a starting point of analysis and as a guiding framework, the “levels of water stress”, as defined by the Falkenmark Index, are used as threshold values for the minimum water availability needed for development. Several approaches analyze water scarcity, and the original Falkenmark Indicator is criticized for its simplicity. Therefore, the most popular approaches are described and discussed regarding whether they prove adequate for the purposes intended by this analysis. Climate trends are analyzed for 1971–2005 (reference baseline 1936–1970), and the regional water situation is depicted by calculating the Climatic Water Balance (CWB), used as an indicator for potential water availability. The analysis of physical drivers is supplemented by the socio-economic driver of population growth. A linear trend is derived based on current demand and supply figures, coupled with regional climate and population trends. The potential per capita water availability, the per capita demand-supply gap at 500 m3/1000 m3, and the influence of population trends on the potential per-capita availability are calculated.
Regional decision-making relies on area-specific information; hence data on drivers indicating adverse effects to water availability is important. A major problem for decision-making and the adjustment of water management strategies is the lack of understandable information on local climate trends regarding water availability. The Moulouya river basin, similar to many river basins worldwide, is already overexploited [21,22,32]. Thus, the results of this analysis aim to contribute to the stock-taking of regional climate information, with particular focus on the regional water situation. The main causes for the increasingly problematic water situation are highlighted. Potential adjustments of water usage behavior with regards to the adequacy of current water-based development pathways are discussed, and potential adjustments are emphasized.

2. Contextual Background

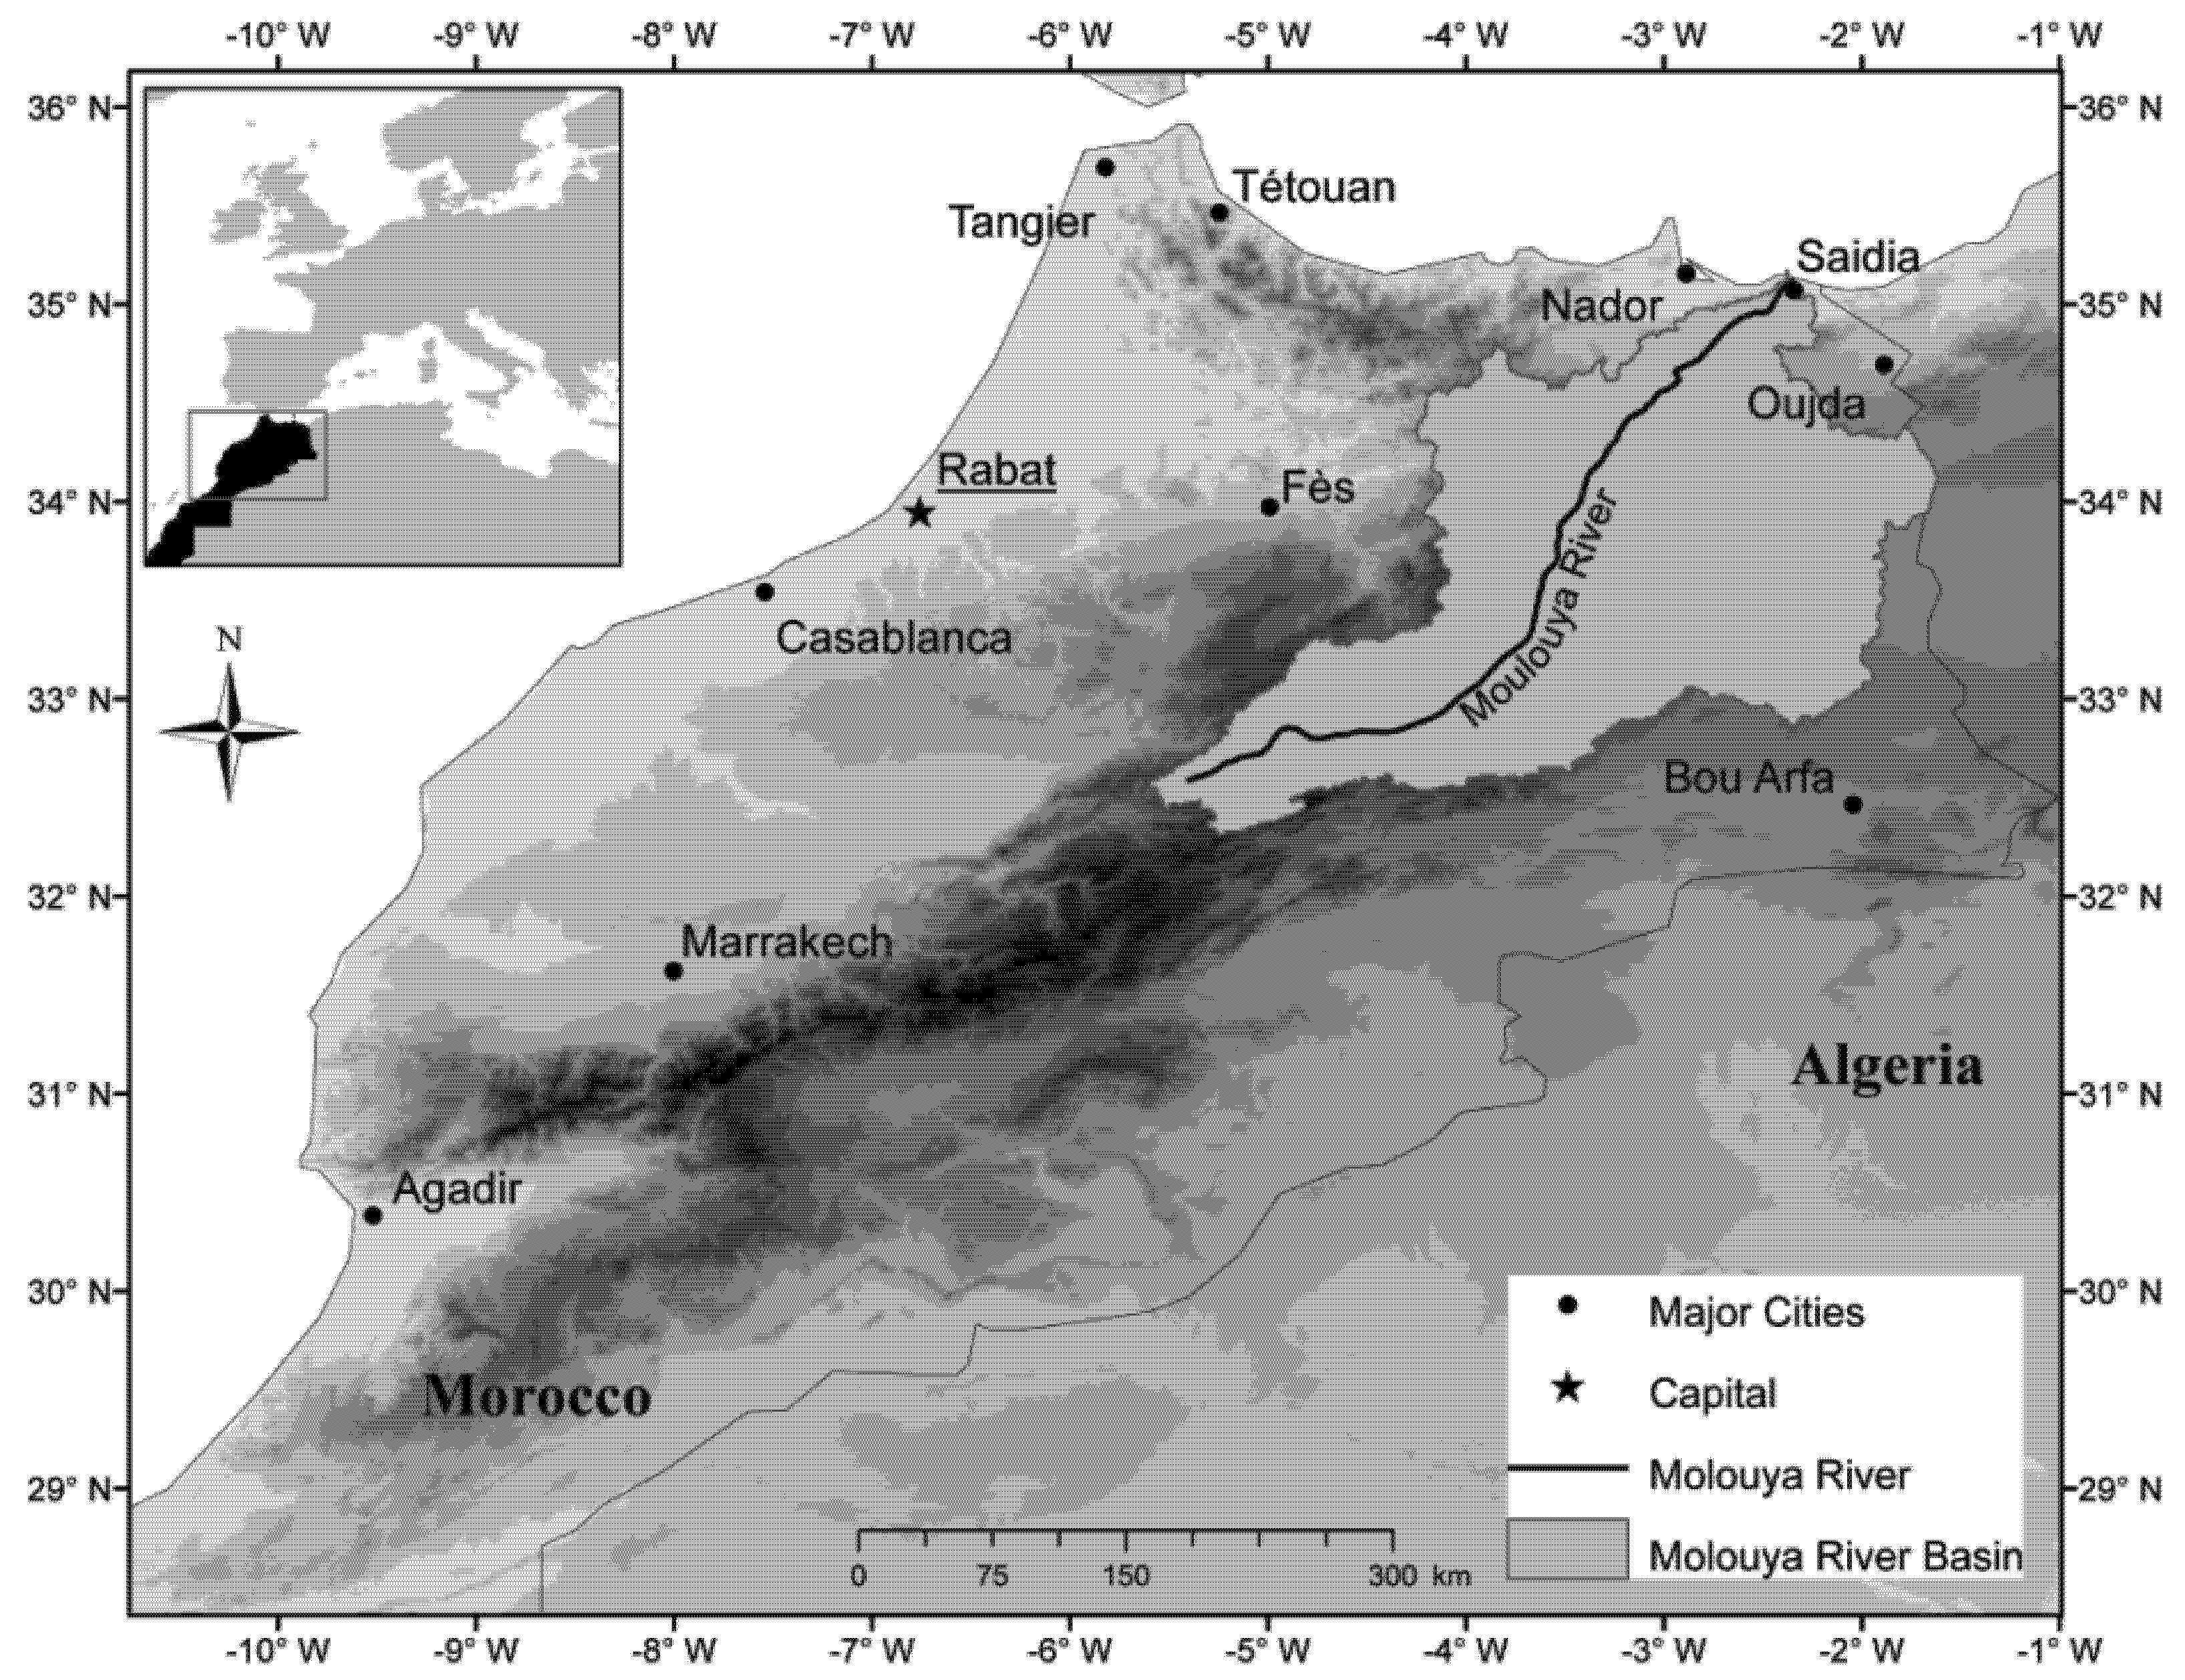
2.1. The Case Study Area—Moulouya River Basin in North-Eastern Morocco

The Moulouya river basin represents the spatial delimitation for the analysis of the regional water situation. The Basin represents a natural geographical and hydrological unit, and the regional water management operates in this frame [21].
The basin surface area covers ca. 54,000 km2 and is the largest river basin in North Africa [21,33]. The river itself has a length of ca. 600 km, supplies the region with freshwater and, thus, determines environmental conditions and human activities from its source in the High Atlas Mountains to its low-lying river mouth at the Mediterranean shoreline near the city of Saidia (Figure 1). The area belongs to the driest regions in Morocco, with an irregular average annual rainfall of 330 mm [33,34]. The climate regime can be classified semi-arid: warm temperate climate with winter precipitation [35]. Along its course, the Moulouya River is partly dammed to ensure regional all-year water supply, mainly for agricultural production. The main agricultural production areas can be found in the north-eastern part of the basin, with irrigation schemes supplied by river freshwater (gravity and sprinkler irrigation) [21,36]. Water storage is mainly secured by a large dam in the Moulouya hinterland (Mohammed V, in operation since 1967). Increasing sediment accumulation and the subsequent loss of storage capacity represents a severe problem for the future functionality of the Moulouya dams [21,36]. This is one reason for a dramatically deteriorating water situation. Further, groundwater resources have already reached capacity limits due to intensive withdrawal and decreasing groundwater recharge rates [21,37]. In the coastal zones, groundwater salinization caused by saltwater intrusion poses a serious problem for water quality and is a further limitation of freshwater resources [21,37]. The River Basin’s deltaic plain is a designated Ramsar (RAMSAR Convention on Wetlands) site, emphasizing the ecological importance, its sensitivity to disturbances and its worth to be protected [38].
With an average total renewable per capita water availability of less than 500 m3/year, water scarcity in the Moulouya river basin represents not an exceptional, but a common situation [21]. However, the particular influence of climate change and population growth on the overall regional water availability has not yet been assessed to the best knowledge of the authors [22]. The awareness regarding the regional vulnerability to water scarcity and water shortage situations is very high, and water management is a policy priority in Morocco [22]. As a reaction towards increasing water demand large-scale water infrastructures were built, e.g., large dams and reservoirs [39]. Under changing climate conditions, these solutions might no longer be sufficient, due to high losses of renewable water resources, e.g., due to higher evapotranspiration rates, groundwater recession and reduced run-off [40,41].

2.2. Measuring Water Scarcity—Indicators, Approaches, Limitations and Critique

Water represents a key limiting factor for food production, while water scarcity is mainly caused by food production [19]. The true nature of water scarcity is as complex as the physical flows and dynamics of the resource itself [19]. Global freshwater scarcity induced by rapidly increasing demand requires solutions, thus representing a particular challenge for science and water governance [42]. Mainly since the past two decades, different approaches have been concerned with the capturing of relevant aspects of pressures on water resources and with the characterization and measurement of water scarcity [43,44]. The description of water scarcity by using more or less complex indicators involves difficulties and uncertainties, thus there is no consensus on a standardized measurement [43].
A particular weakness of current indicators is the focus on water withdrawal instead of actual water consumption [45]. Further, they do not include environmental flow requirements and temporal variation. Thus, they do not represent a comprehensive tool for the assessment of water scarcity situations, but, however, support the indication of disequilibrium of water abstraction and water availability.
The most common approaches are the Falkenmark Water Stress Index [8], the Social Water Stress Index (SWSI) [46], the Water Resources Vulnerability Index (Criticality Ratio) [47], the Physical and Economical Scarcity Indicators [11] and the Water Poverty Index [31] (see Table 1 for a comparison of approaches).
Table 1. Comparison of most popular approaches to measure water scarcity based on [19,48,49].
Index (year)Approach and benefitsLimitations
Falkenmark Water Stress Index (1989) [8]● Total annual renewable water resources available to the population (per cap/year freshwater availability).
● Determines thresholds for minimum per capita water requirements.
● Data most often available as well on regional or smaller scales.
● Easy to apply and intuitively understandable.
● Focus on blue water stress only, omits green water.
● Excludes main drivers for water scarcity, e.g., demand, efficiency, management and lifestyles.
● Societal adaptive capacity is not included.
● Assumes that all countries globally use or need the same amount of water for development.
Social Water Stress Index (2000) [46]● Builds on the Falkenmark indicator and applies the UNDP’s Human Development Index (HDI) to depict the social dimension of water scarcity.
● Contextualizes water stress with a low social adaptive capacity.
● The HDI does not include ecological factors and focuses mainly on economic criteria [50].
● The HDI does not depict intra-national differences, as the data applied is country-based only.
Water Resources Vulnerability Index (criticality ratio) (2000) [47]● Withdrawal-Ratio of human water use to total renewable water resources.
● Comparison of country-specific water demand and availability.
● Scarcity: proportion of total withdrawals relative to total available resources.
● Role of non-natural resources (e.g., desalinization), recycled or re-used water is not considered.
● Omits behavioral change as a reaction towards lowering water capacities, e.g., the implementation of new technologies.
Physical and Economical Scarcity Indicators (2007) [11]● Accounts for all renewable water resources available for primary supply under future scenarios of improved water management policies, e.g., infrastructure development and irrigation efficiency.
● Physical scarcity: countries being unable to meet future demands despite future adaptive capacity (e.g., investments in water infrastructures).
● Economical scarcity: countries unable to meet future water demand without investments in water infrastructures despite sufficient renewable resources.
● Measuring of indicator is very complex and time-consuming.
● Data requirements difficult to meet, thus it’s mainly based on expert judgments.
● Omits ability to adapt by virtual water imports (food) or water saving devices.
● Partly green and blue water are summed up, providing too high potential availability values.
● Country-based aggregated analysis.
Water Poverty Index (2003) [31]● Determines water security at household and community level based on income and wealth.
● Measures and aggregates five dimensions: level of access to water; water quantity, quality and variability; water used for domestic, food, and productive purposes; capacity for water management; environmental aspects.
● Focuses on limitations of the Falkenmark Index.
● Comprehensive amounts of data required.
● Approach of high complexity.
● Lacks intuitive understanding.
● Suited for smaller rather than national scales.
The original concept, the Falkenmark Index from 1989, concentrated solely on blue water availability, leaving aside green water [19]. The Falkenmark Index is often criticized for being too simplistic, as:
  • It does not differentiate between countries regarding their specific water stress thresholds (one country might be able to handle a 500 m3 per capita annual availability; another might be experiencing severe water problems at that level);
  • It focuses on natural freshwater availability only and does not include man-made freshwater sources (e.g., desalinization) or the accessibility of water;
  • It does not consider regional differences of the water use of countries (e.g., urban areas often have higher consumption rates than rural areas) [11,19,43,44,48,49].
The introduction of the green water concept by Falkenmark [29] in 1995 represented a milestone regarding the evaluation of available freshwater resources and water use efficiency [19,30]. The importance of green water is often underestimated, considering that global food production for the most part relies on rain-fed irrigation (up to 60%, including grazing for meat production or forests for wood production) [44]. However, most water scarcity indices build upon and complement each other, trying to overcome presumed limitations and to increase the predictive validity [43]. The majority of approaches affirms a crucial role towards the (re)adjustment of water management and water governance in order to react adequately upon a seriously deteriorating water situation [19,48].
Next to the criticism regarding some indicators for being too simplistic, in particular addressing the Falkenmark Index, there is as well a critique that sophisticated approaches can be too complex for practitioners and decision-makers [19]. For the latter, simple approaches may be more appropriate to raise awareness regarding the prior causes of a deteriorating water situation. Further, as is the case for the Moulouya river basin, water management currently relies on sufficient blue water availability. The Falkenmark Index is a comprehensible tool to raise awareness regarding the finiteness of blue water resources necessary for food production, taking into account that green water significantly changes the picture of the potential water availability. However, the optimal use and exploitation of rainwater requires a re-oriented water strategy and institutional changes. Thus, as a first step, on the basis of the Falkenmark Index, it can be very well depicted that building on blue water without efficiency increase leads to a problematic impasse.

Indicating Water Stress with the Falkenmark Index (FI)

As a baseline, in order to assess the dimension of the problematic water situation in the case study, threshold values of the Falkenmark Water Stress Index (resource to population index) are referred to as indicators for regional water stress levels [8]. Falkenmark compiled and classified the per capita water usage in multiple countries and deduced social water stress levels as the fraction of the total annual renewable water resources available for human usage (Table 2) [8,51]. The index is widely used to indicate water stress and to emphasize the interrelationship between limited water per capita availability and implications for development. Falkenmark [51] categorizes water conditions, and describes index thresholds with regard to water resource management problems. As the index focuses on the (minimum) human water availability needs as a basic requirement for development, it can thus serve as a landmark for the adaptation needs of water management, depending on the water needs of development trajectories [52].
Table 2. Water stress levels and definitions, based on [8,48,51].
Water availability (per capita in m3)aLevel of water stressWater resource management problems and constraints
>1700Occasional or local water stressNo or limited problems
1700–1000Regular water stressHeavy pressures on water resources, general management problems
1000–500Chronic water scarcityChronic water shortages/limitation to economic development and human health and well-being
<500Absolute water scarcityBeyond availability limit; beyond the water barrier of manageable capability, main constraint to life
Note: a refers to renewable and usable water.

3. Methodology

3.1. Data

Data gaps on water availability are common in North African countries, where instrumental coverage and the compiling of long-term records and data series are not well established [53]. Ideal data would be spatially well-resolved and show continuity [48]. Water usage data is especially hard to find; agricultural water use or groundwater withdrawals are rarely measured. This is also the case for the Moulouya river basin, where empirical data on sector-comprehensive water demand and availability is neither available nor accessible or very fragmented [54]. To nevertheless enable the assessment of potential implications for the regional water situation, statistical data was obtained from several sources. Missing measured data for the case study area were filled by a consecutive monthly climate proxy data series for temperature and precipitation for 1971–2005 (reference baseline 1936–1970) from the gridded and interpolated climatology at a 0.5° × 0.5° scale of the Climate Research Unit, CRU TS2.1 [55,56]. Out of this, 20 data points covering the margins of the Moulouya river basin were chosen. For precipitation, the corrected and homogenized “CRU/PIK” data set was used [57]. For the purpose of a small-scale historical trend, the “CRU/PIK” precipitation data so far provides the best applicable data under acknowledgement of the generally very limited regional water data situation.
Reference values for regionally mobilizable water (groundwater considered to be potentially usable) and water demand are taken from Snoussi [21] and Imassi [58] as well as Moulouya basin-specific population data for 2004. Data on exploitable natural water resources and mobilized groundwater resources for Moulouya river basin were obtained from FAO/AQUASTAT [24,59] and UN-Water/Africa [60]. The last population census for Morocco was conducted in 2004 [23]. Therefore, to achieve an approximate picture, population trends and projections were scaled down from national population dynamics at a medium variant obtained from United Nations Population Division [61], combined with the official population census of Morocco of 2004 [62]. However, current extrapolations of population dynamics involve uncertainties and do not capture accelerating coastal urbanization trends. The latter is essential to estimate local water demand in urbanizing areas and to adjust infrastructure capacities accordingly.

3.2. Indicators for Regional Water Availability in the Moulouya River Basin

In order to describe the blue water situation in Moulouya, to determine drivers for regional water stress and to project foreseeable problems regarding per capita water availability, the following gradual analysis steps are performed: a trend analysis of the mean annual and seasonal regional precipitation for 1971–2005 (reference baseline 1936–1970); a trend detection of the potential evapotranspiration (Pot.ET) for 1971–2005 as calculation baseline for the regional CWB (denoting the potential blue water availability); and the projection of the regional supply gap as a result of the imbalance between per capita water demand and natural water availability for 2005–2040 (linear trend extrapolation based on the current mobilization rate and the regional population trend). Calculations are performed for each of the 20 CRU data grid point in the basin, then seasonally or monthly aggregated.

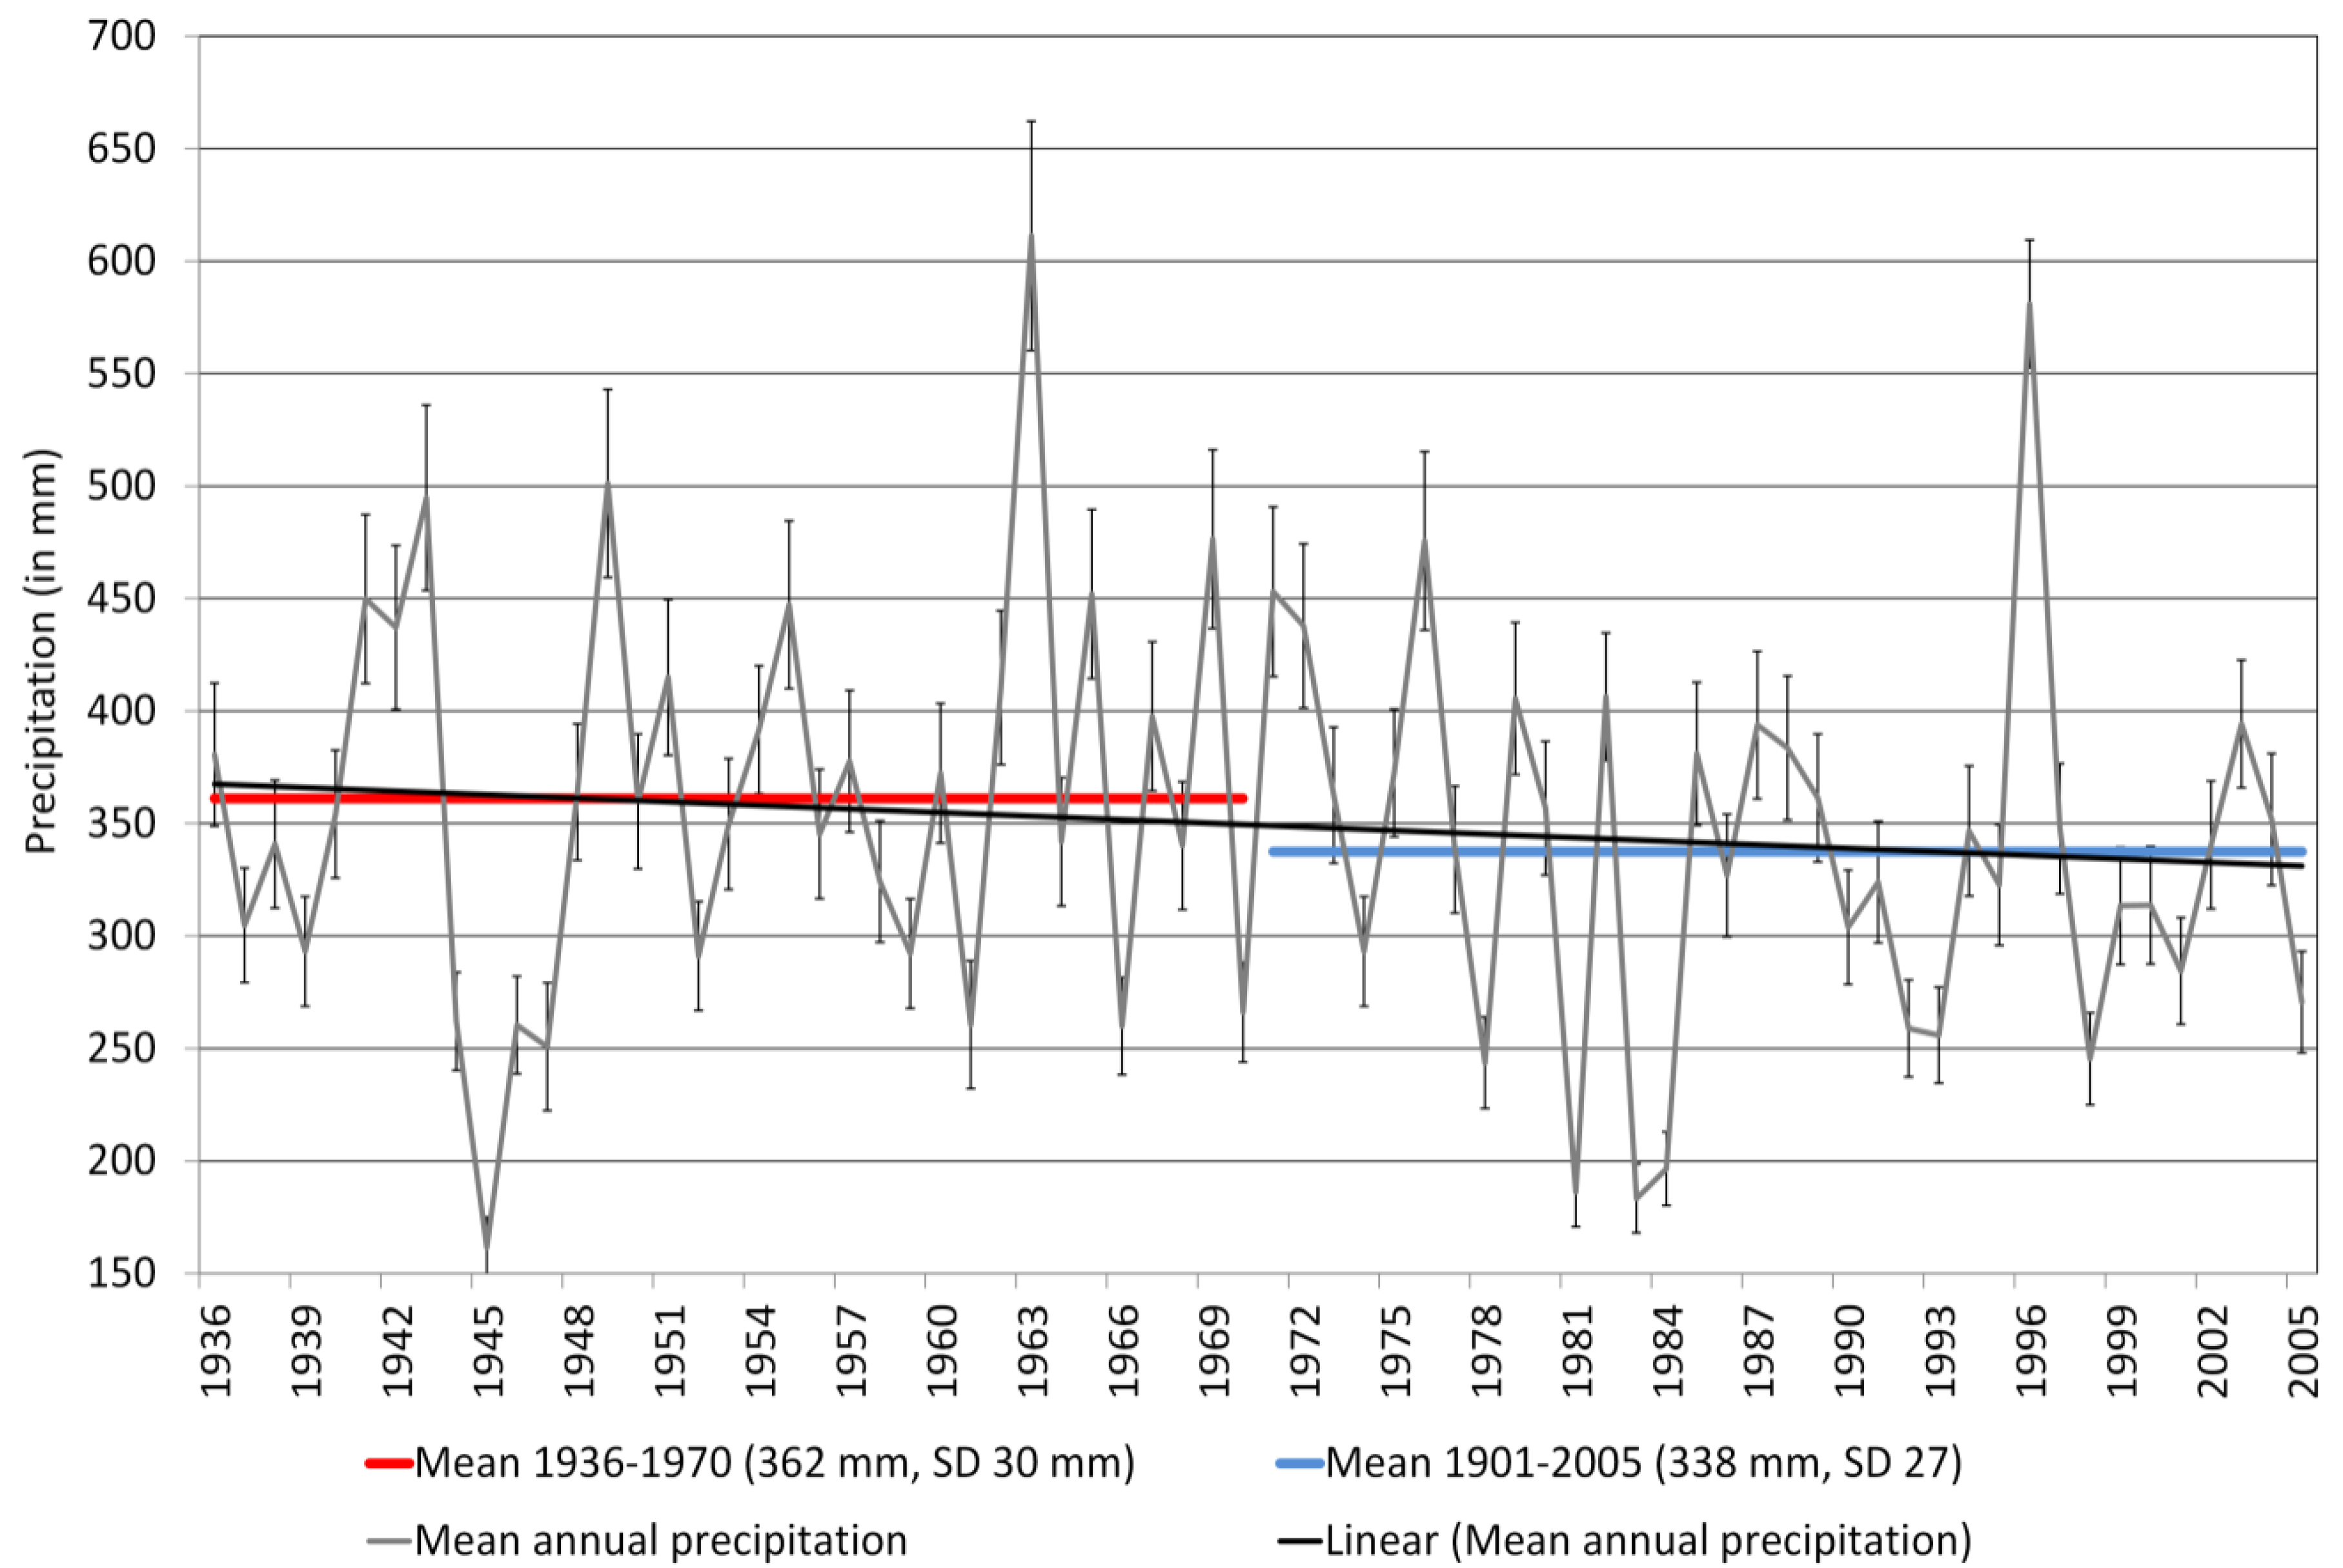
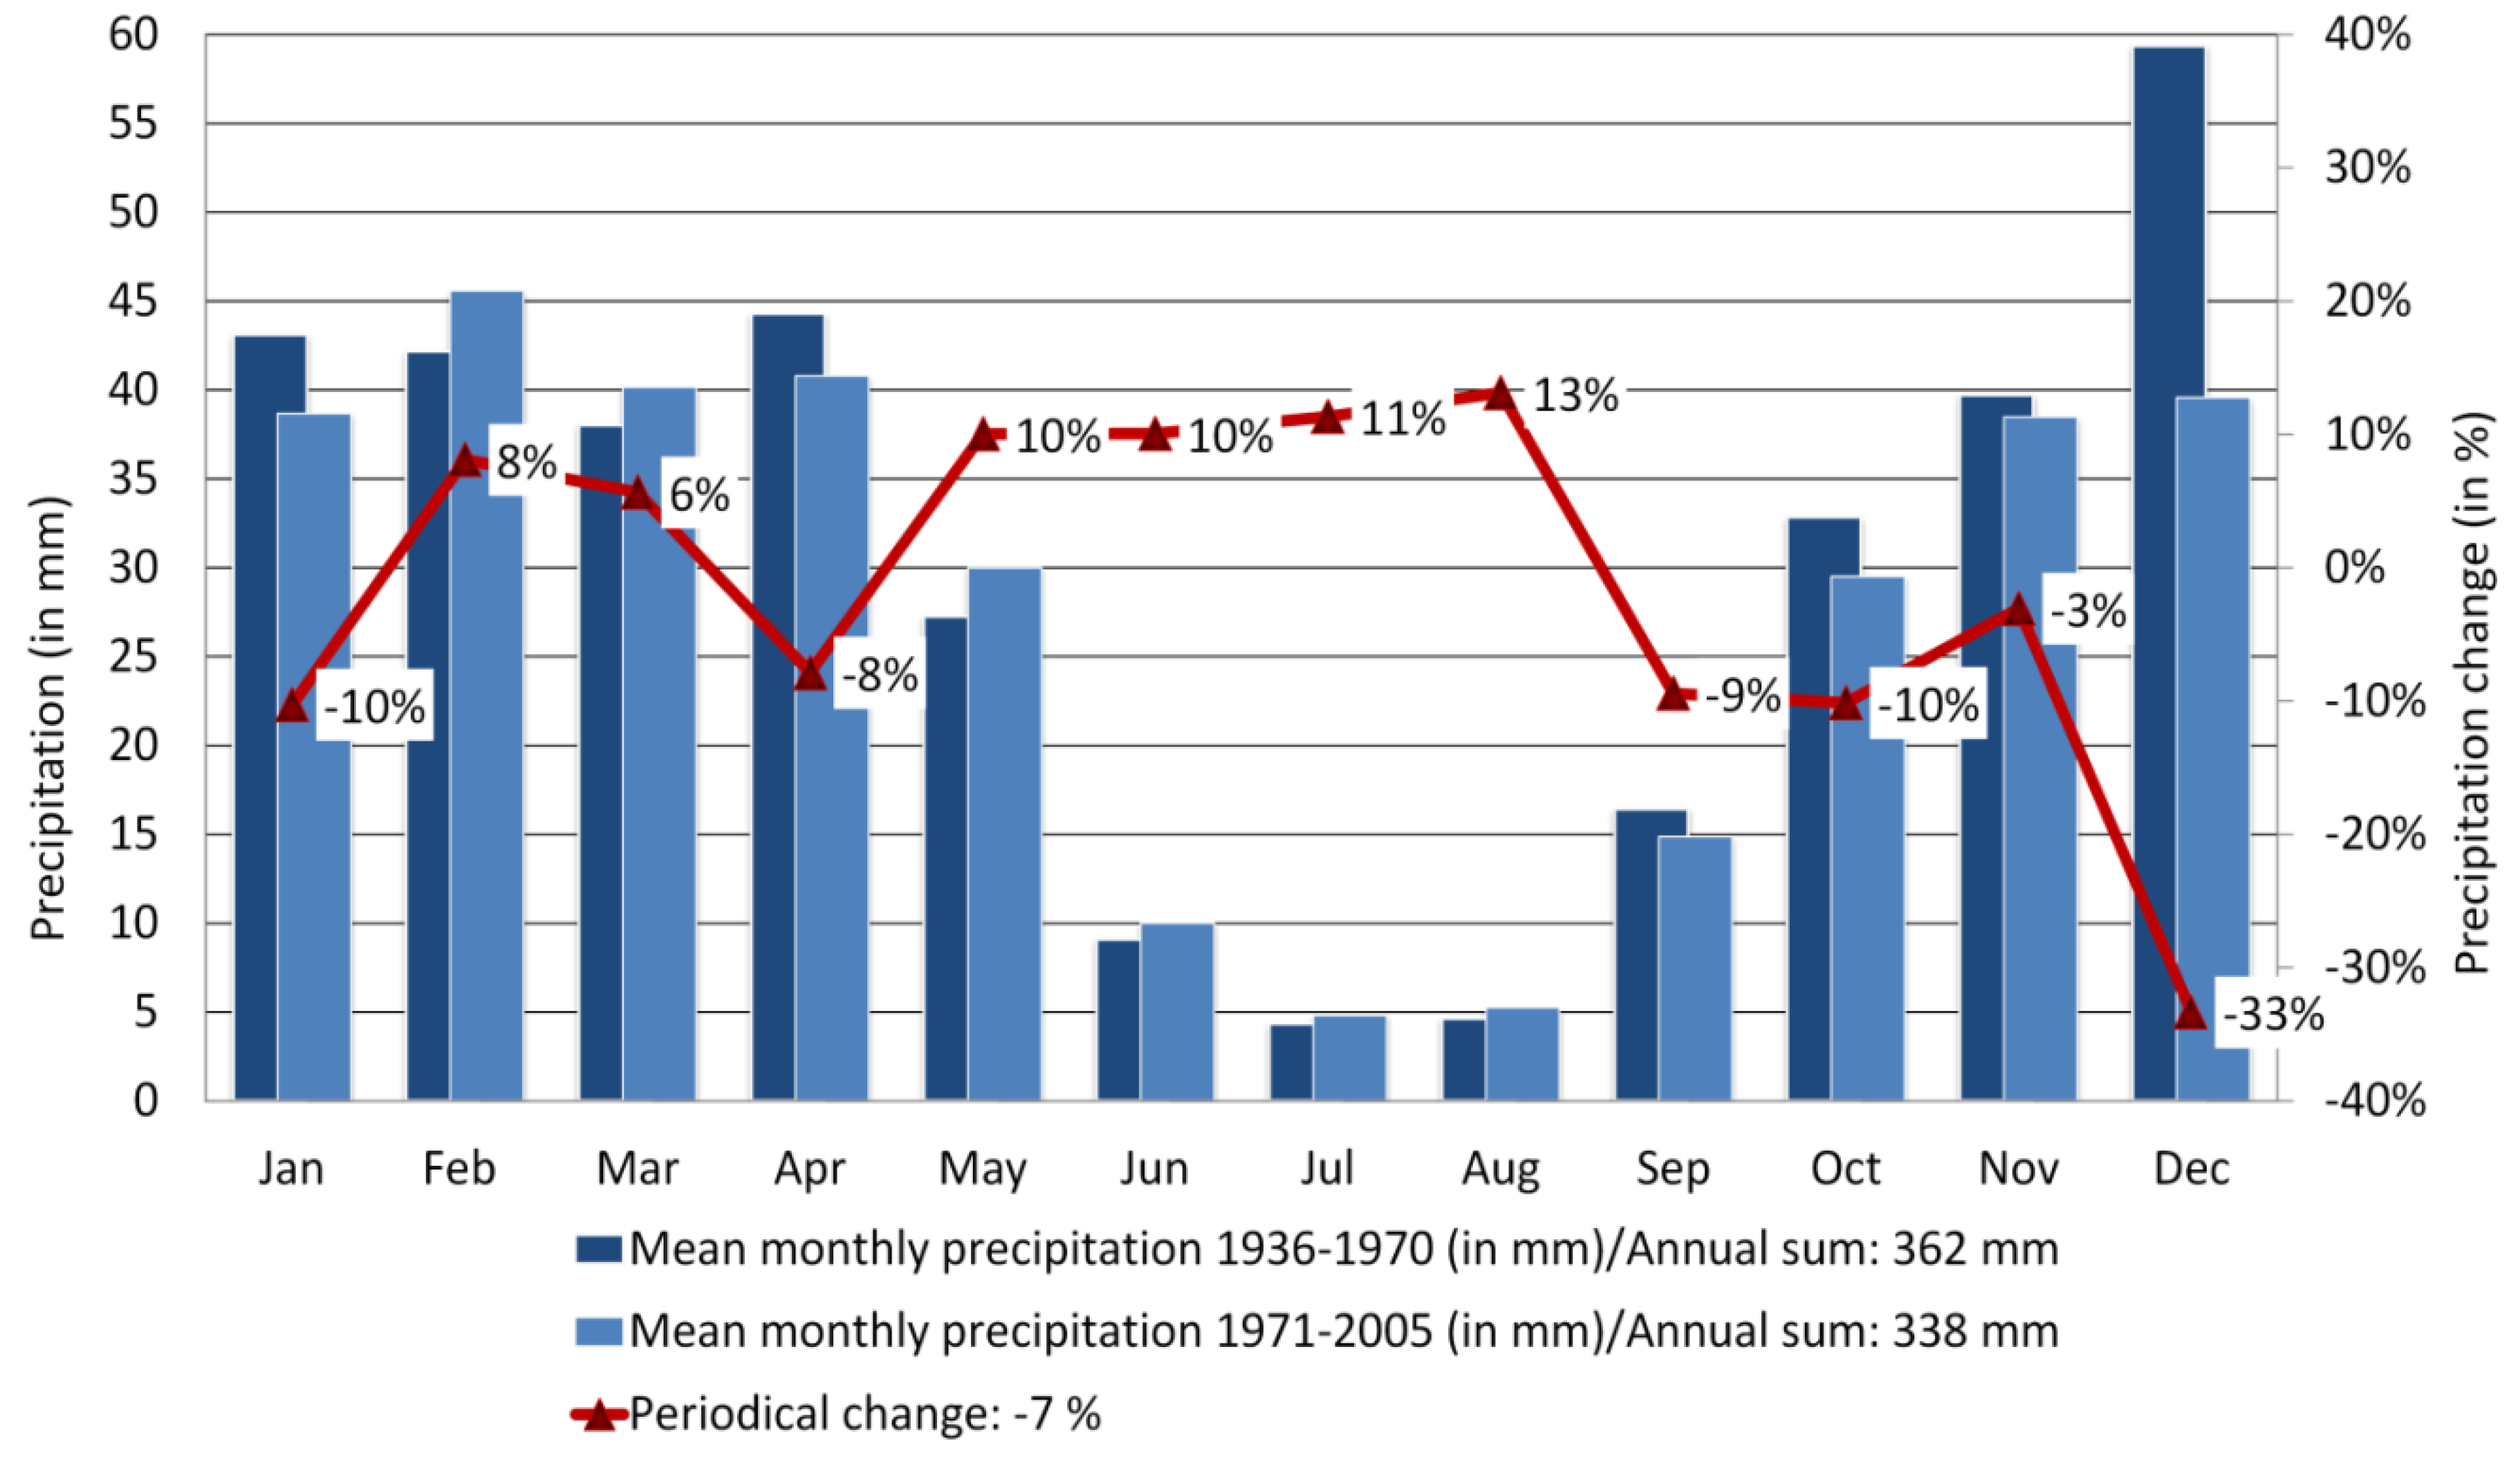
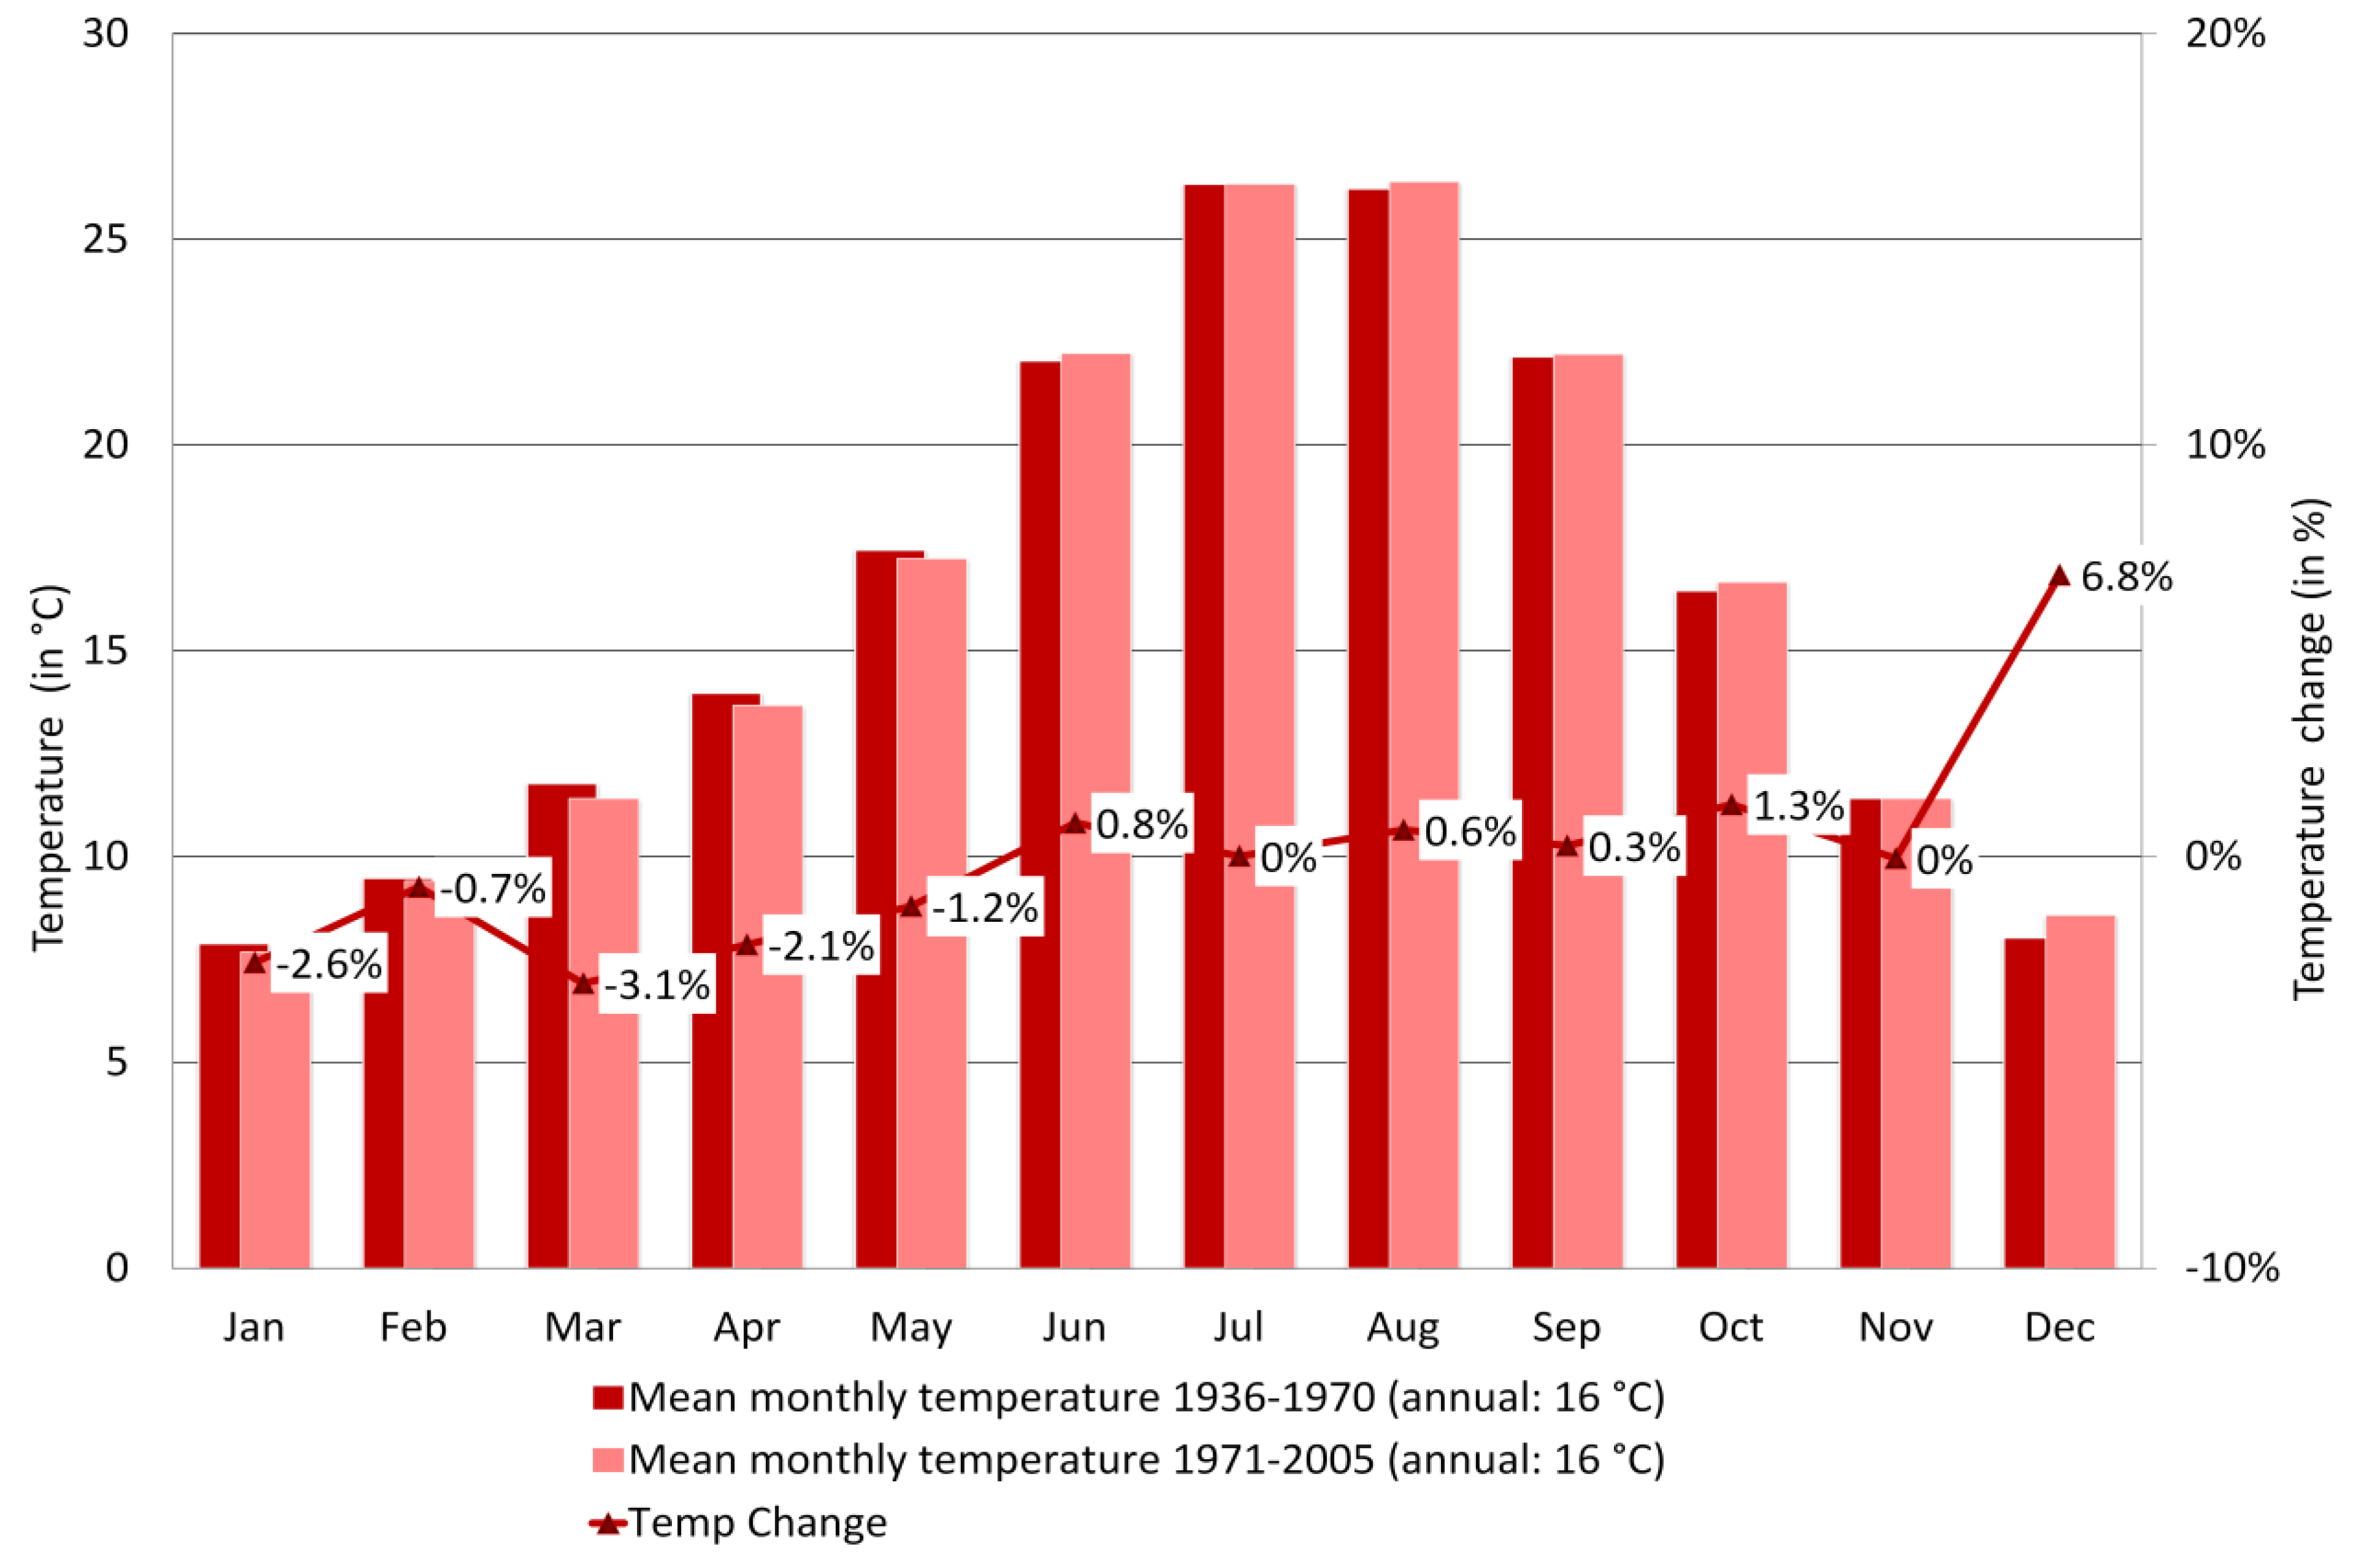
3.2.1. Precipitation and Temperature Trends

The relative long-term trend (1936–2005) of the spatial-temporal climatology was analyzed using a linear trend method of minimum squares. The region is characterized by a high inter-annual variability, very dry summer and wet winter periods. Potential shifts and/or a decline of winter precipitation would be detrimental for the agricultural cultivation period, which starts in autumn and ends with the harvesting period in spring [59]. Precipitation for rain-fed production is thus needed between autumn and spring, and the cultivation period is adjusted accordingly. Significance testing of precipitation trends was performed by an independent two-sample t-test for the seasonal time series: DJF (December, January, February); MAM (March, April, May); JJA (June, July, August); and SON (September, October, November) for 1971–2005 (reference baseline 1936–1970). The assessed data records span 35 years, considered appropriate to deliver a valid statistical mean, as the minimum time series for precipitation should not be below 30 years (classical period, as defined by the World Meteorological Organization WMO).

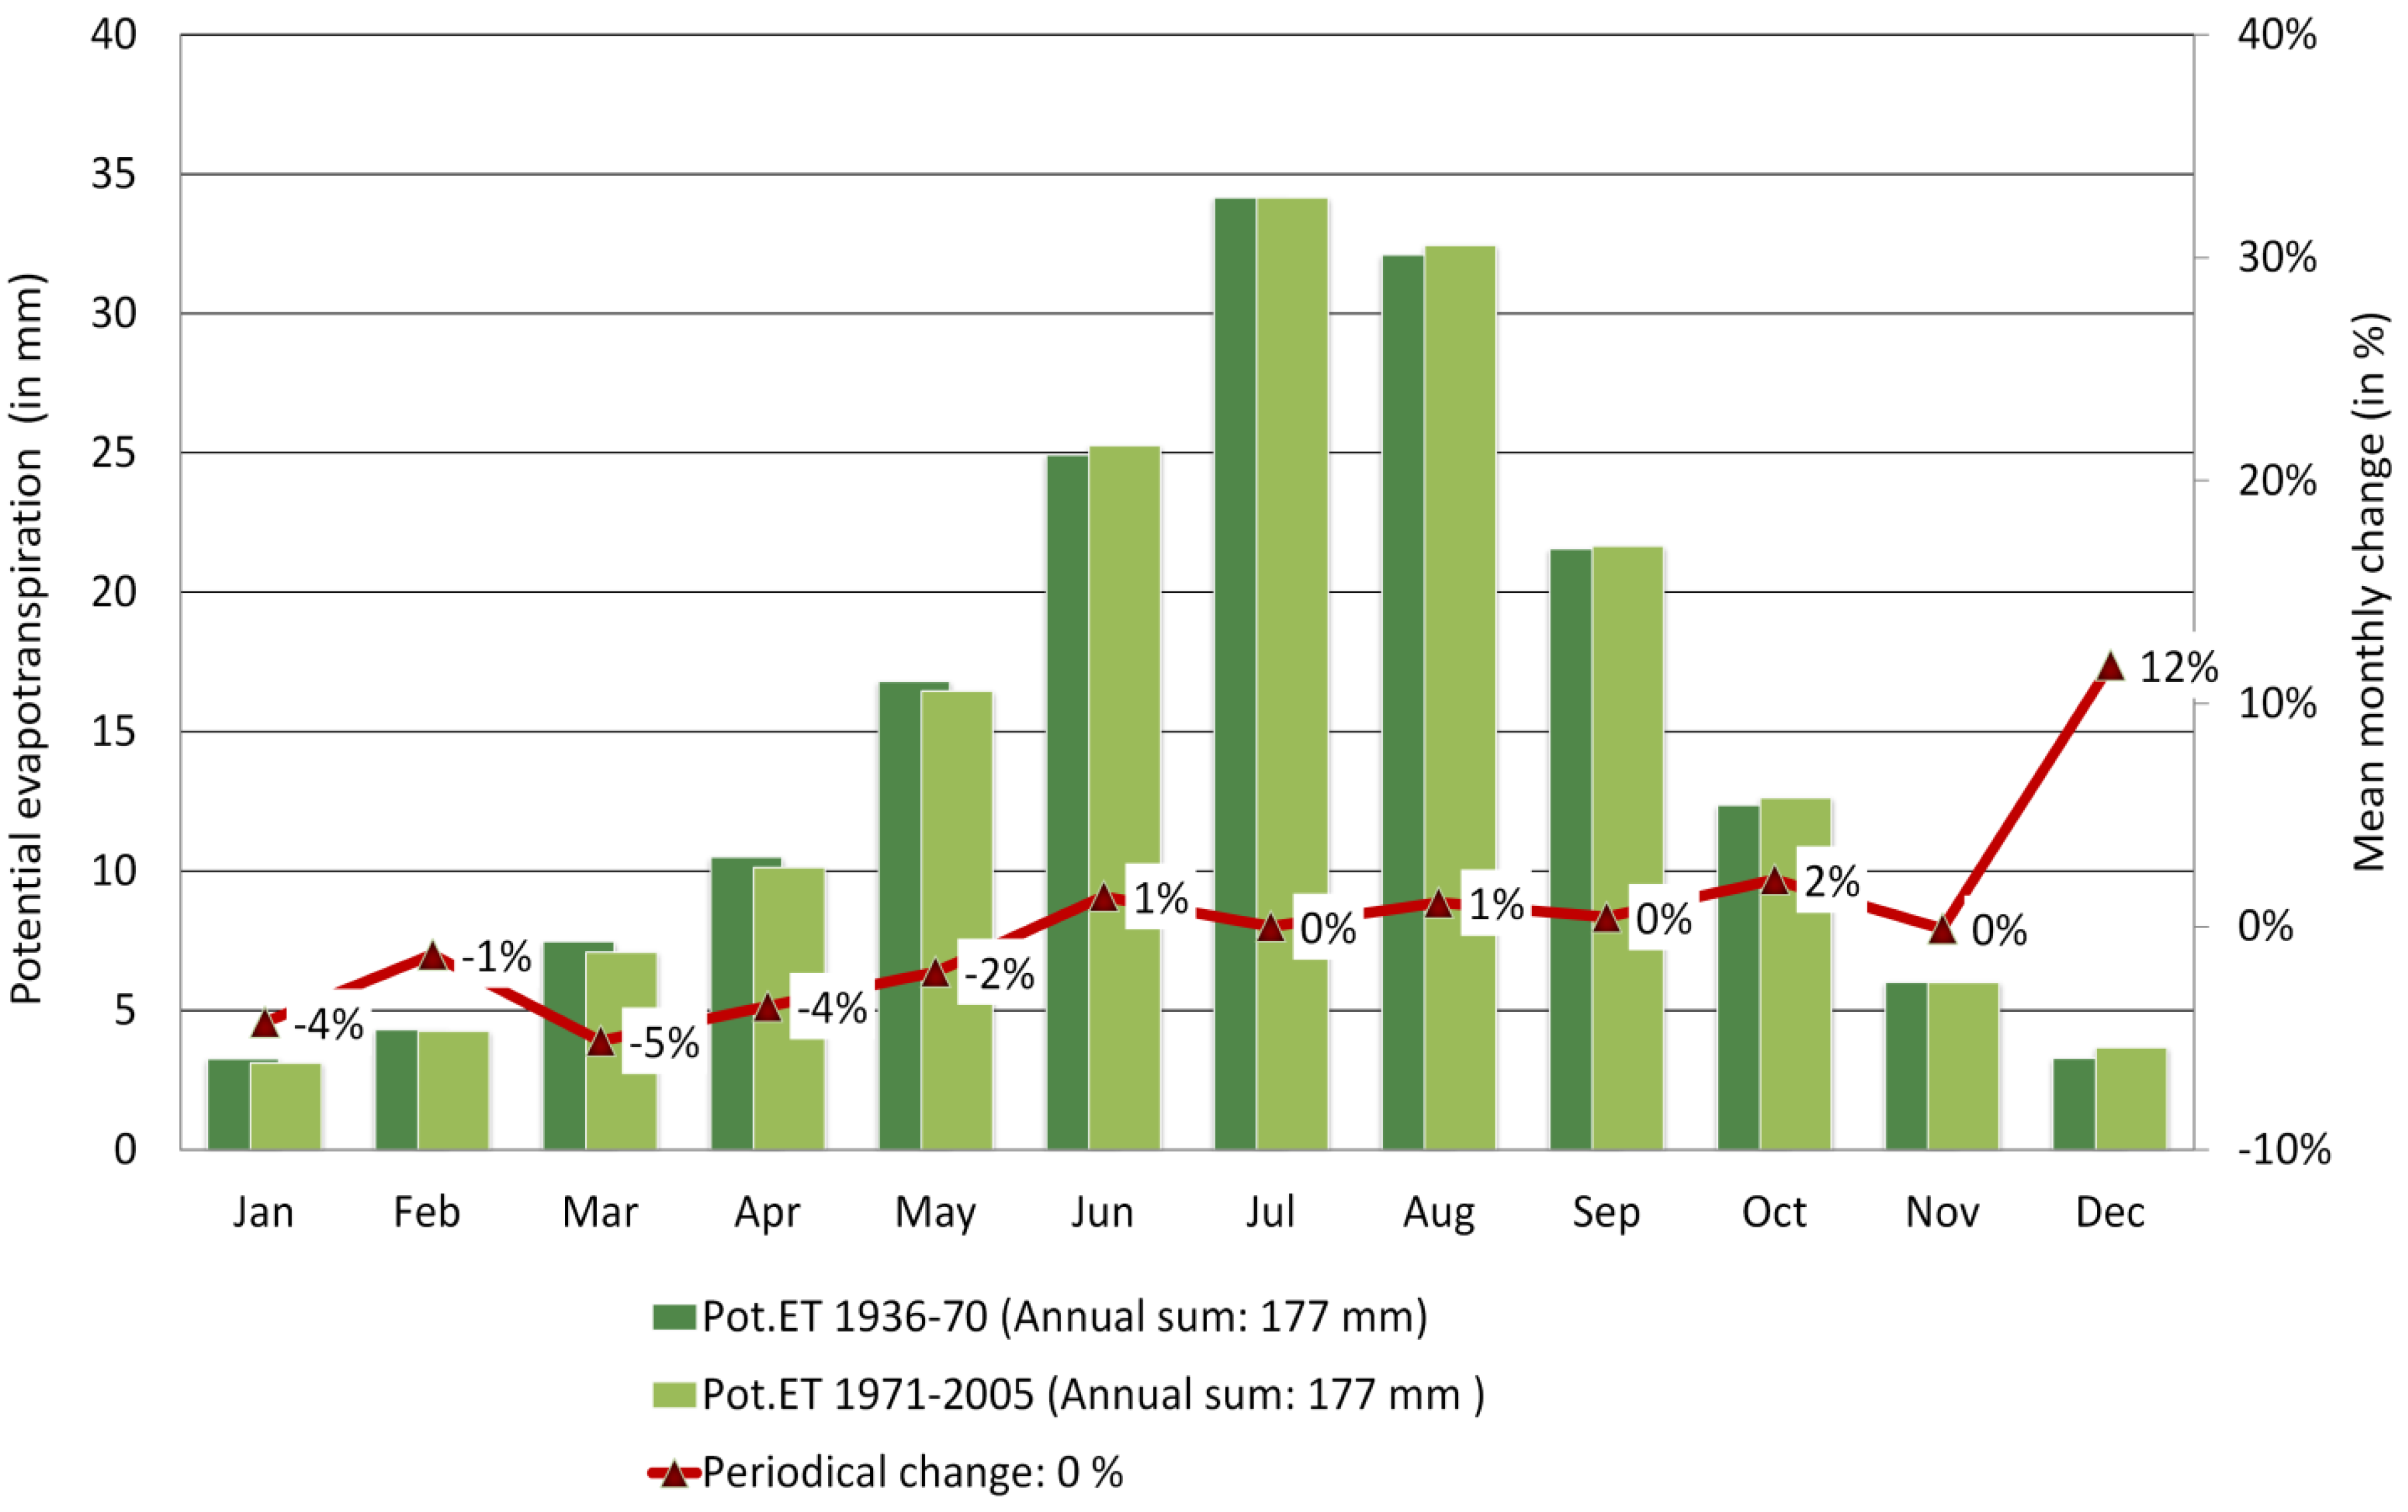
3.2.2. Potential Evapotranspiration (Pot.ET) in the Moulouya River Basin

In north-eastern Morocco, winter rainfall is crucial for the water balance. Precipitation is not equal to later water availability from run-off or groundwater. The influence of temperature on evapotranspiration is essential; cooler temperatures can impede moisture losses and, thus, have the potential to partly compensate for declining rainfall budgets. The Pot.ET substantially determines the CWB and indicates the extent of evapotranspiration under the assumption of a continuously wet surface, based on the empirical relationship between potential evapotranspiration and mean temperatures [63]. Changes in evapotranspiration rates are an important indicator for water stress situations. Increasing evapotranspiration may substantially impair run-off rates and soil moisture. Here, to identify a long-term annual and monthly trend the Thornthwaite formula [63] was applied. The Thornthwaite formula is a temperature-based Pot.ET model and requires only few meteorological variables for its calculation: mean monthly temperatures over the annual cycle and the average daylight hours. The Thornthwaite method is often criticized for its limited applicability due to minimum input variables and due to estimation inaccuracies. Given a sufficient data situation, newer approaches can deliver more accurate results [64]. Based on the CRU data points with temperature and rainfall as the only variables, a parameterization according to the FAO-standard method, the Penman-Monteith formula, lacks necessary input data (air temperature, relative humidity, wind velocity and net radiation) [64]. Here, the Pot.ET after Thornthwaite is intended to function as an input variable for the calculation of the regional Climatic Water Balance. To increase its validity, the correction factor for mean daylight values is adjusted according to the geographical coordinates of the river basin.
In Equation (1), Pot.ET is the potential evapotranspiration in mm per month; C is the daylight coefficient (mean possible duration of monthly sunlight in the latitudes of Moulouya river basin; Tm is the mean monthly temperature; I is the heat index and depends on 12 mean monthly temperatures (Equation (2)); and α (Equation (3)) is a function of the heat index for semi-arid locations [63,65].
Water 04 00959 i001
Water 04 00959 i002
Water 04 00959 i003

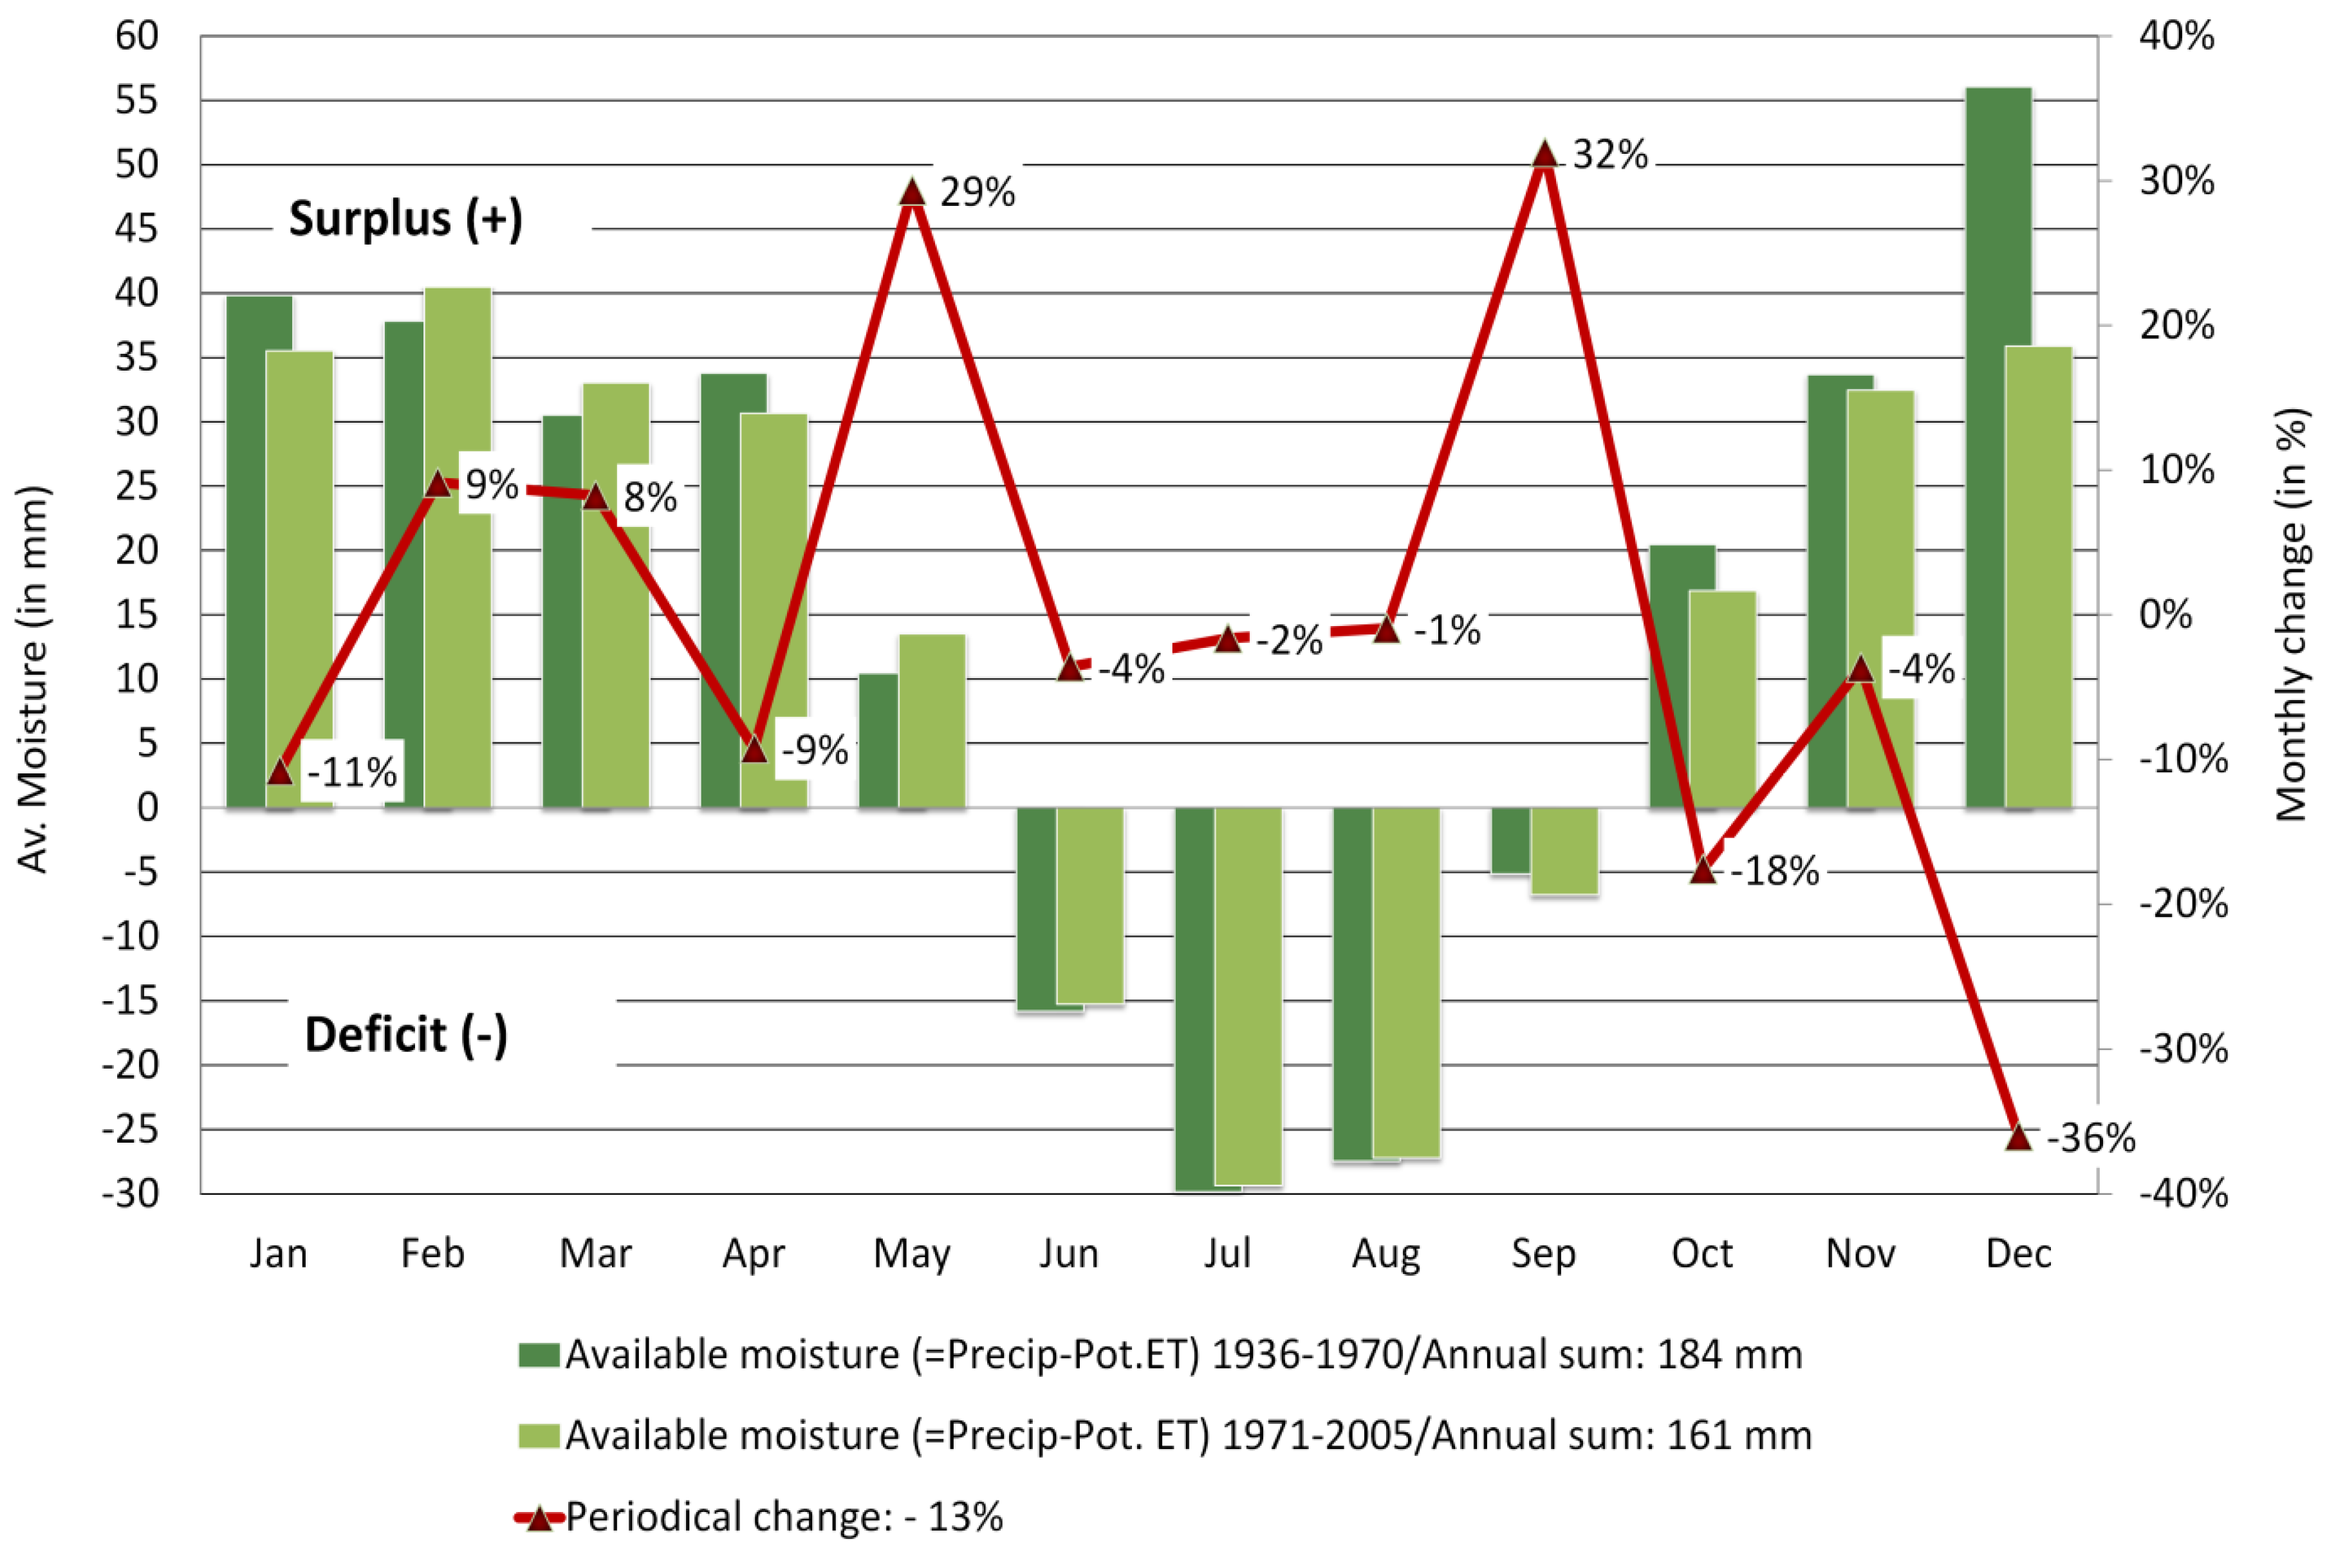
3.2.3. The Climatic Water Balance (CWB) in the Moulouya River Basin

Based on the prior results of precipitation and temperature trends and the Pot.ET, the CWB is calculated for 1936–1970 and 1971–2005 to indicate a long-term trend change for each month. The CWB denotes the difference of the average monthly precipitation (P) minus the potential evapotranspiration (CWB = P − Pot.ET) in order to indicate annual precipitation deficits and interannual shifts of relevant precipitation periods (e.g., for groundwater recharge).

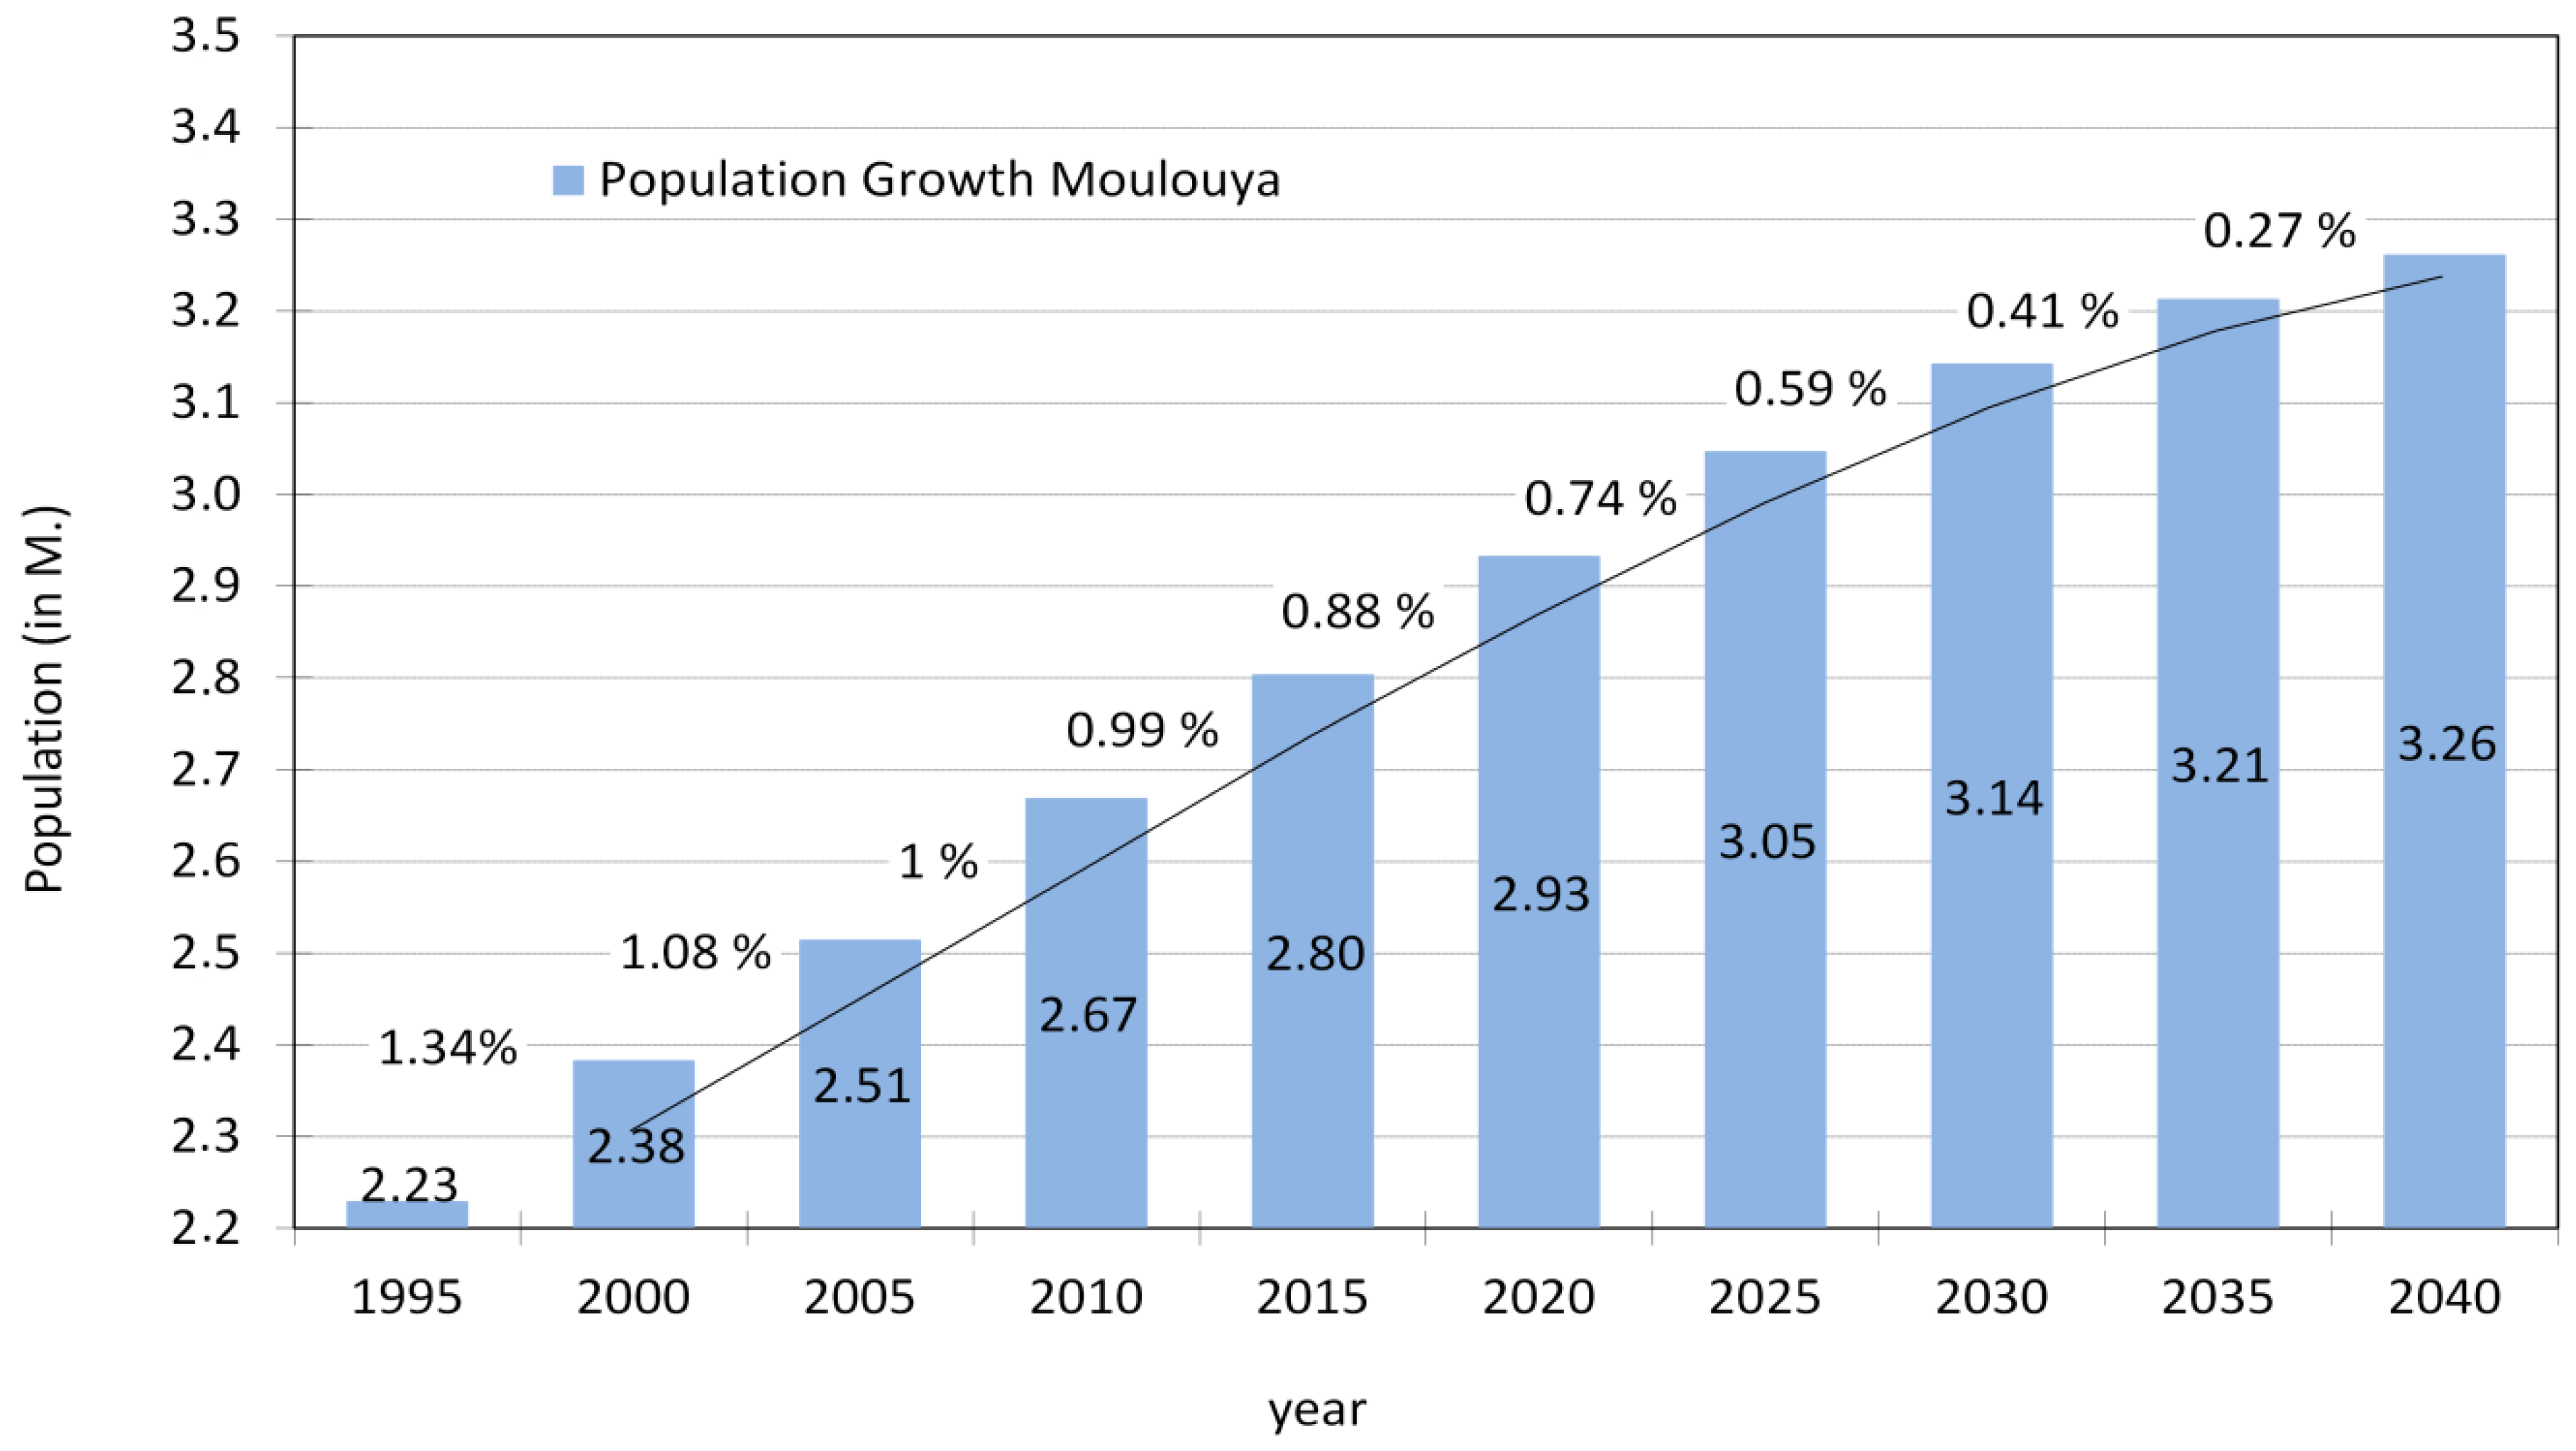
3.2.4. Regional Population Trend

Population growth represents a main driver for water stress, if not accompanied by measures for capacity increase [31]. The projected population trend for Morocco at medium term was derived from United Nations Population Division [61] and scaled down based on regional population data taken from the official Moroccan 2004 population census [62]. The UN population growth rate was applied to the regional population based on values from 1995 to deduce estimates for population development until the year 2040.

3.2.5 Calculation of Regional Per Capita Water Availability for 2006–2040

The detected trend for the regional CWB serves as the basis of calculation to statistically derive the trend for future water availability (projection period 2006–2040) by applying a linear regression based on the comparison of the periodical values (1971–2005 with 1936–1970 as reference baseline). Reference values for the per capita mobilizable blue water (technically and economically exploitable) and per capita water demand (baseline 2004) are included to assess the potential deficit or surplus under the driving forces of population growth and climate change [21,66]. The combination of population and climate trends delivers projections for the potential per capita availability or the extent of water scarcity, respectively.
The calculation is based on the linear trend of the CWB of 1971–2005/1936–1970 as total mobilizable surface- and ground-water (blue water) in relation to the regional population growth. Two water scarcity levels are taken into account: available water at a hypothetical average regional water demand of 500 m3 and 1000 m3, respectively.

4. Results

4.1 Climate Impacts on the Water Regional Budget

Relevant precipitation for the regional water budget falls between September and May. An annual decrease of ca. 7% is observed for 1971–2005 (reference baseline 1936–1970) (Figure 2). The mean values of the periodical standard deviations (SD) related to mean precipitation show no significant modification. Thus, the probability of an abnormal precipitation situation is quite low. The regional climate regime is undergoing an established precipitation loss, in particular in the cooler half of the year. Water accumulation in the summer months is greatly reduced due to high evapotranspiration rates. Negative trends between October and March are considered to be detrimental for the annual water balance, for groundwater replenishment, as well as for the winter-based agricultural cultivation period. Losses cannot be compensated by precipitation increases in summer. For the basin area, a consecutive decrease of mean monthly precipitation is found in the rain relevant months between October and January and further in April, with a highly significant trend for the winter season DJF (−21%) (Figure 3, Table 3). Thus, next to an overall negative annual precipitation trend, the hydrological important winter season underwent a significant moisture loss. Further, the formerly typical gradual precipitation increase between September and December (precipitation maximum) has weakened substantially.
Table 3. Significance testing (two-sample t-test) of seasonal precipitation change in the Moulouya river basin.
SeasonDJFMAMJJASON
Seasonal mean in mm 1971–2005 (reference baseline 1936–1970)145 (124)110 (111)18 (20)89 (83)
Trend (change)−21%02%−6%
Statistical significance (α = 0.05)0.0240.770.130.096
Significance levelHighly significantnotnotSlightly significant
Sources: Downscaled precipitation data for basin area based on [55,57]; basin area [33,36].
Figure 2. Mean annual precipitation in the Moulouya river basin: long-term trend and periodical change 1971–2005 (reference baseline 1936–1970).
Water 04 00959 g002
Figure 3. Mean monthly precipitation change and periodical change in the Moulouya river basin 1971–2005 (reference baseline 1936–1970) and the monthly difference in %.
Water 04 00959 g003
The temperature parameter is essential for the calculation of the Pot.ET; increasing temperatures impede moisture losses and lead to the decline of water budgets. In Moulouya river basin, the annual temperature progression shows a gradual increase between January, reaching the maximum in June/July, and decrease thereafter, with the lowest temperatures in December/January. While the mean annual temperature remains nearly unchanged (16 °C), a significant increase can be observed for the month December (+6.8%) (Figure 4). This trend can impinge on the winter water amount and cause lower recharge rates.
Figure 4. Mean monthly temperatures and periodical change in the Moulouya river basin 1971–2005 (reference baseline 1936–1970) and the monthly difference in %.
Water 04 00959 g004
The Pot.ET calculated after Thornthwaite [63] revealed a gradual increase from January onwards reaching its maximum in July, and it’s minimum between December/January (Figure 5). In general, increasing temperatures lead to higher Pot.ET rates given an unchanged amount of water or moisture to evaporate. In the case of precipitation decrease, the Pot.ET lowers accordingly, if temperatures are not increasing. The annual sum of Pot.ET remains unchanged in the case study area, while a decrease is observed in the first half of the year and an increase thereafter. The significant higher monthly temperature in December (+6.8%) causes an annually exceptional increase of the Pot.ET rate (+12%) and indicates a strong loss of moisture.
The mean monthly change of the regional CWB for 1971–2005 (reference baseline 1936–1970) is calculated based on the difference of the sums of Pot.ET (Figure 6). Results show the annual distribution of precipitation surpluses or deficits, indicating the month of positive water budgets and the historical change. As is normally the case in this climate zone, a situation of water deficiency is common during the hot summer months between June and September (deficit period). Surpluses of precipitation (precipitation > potential evapotranspiration) can be found in the remaining months (surplus period). The potential annual water availability reduces considerably from 184 mm down to 161 mm (−13%), mainly between October and January (Figure 6). This statistically significant negative trend for the winter period outbalances the increases of other months.
Figure 5. Change of mean monthly evapotranspiration rate (Pot.ET after Thornthwaite) in Moulouya river basin 1971–2005 (reference baseline 1936–1970) and the monthly difference in %.
Water 04 00959 g005
Figure 6. Change of mean monthly CWB in the Moulouya river basin 1971–2005 (reference baseline 1936–1970) and the monthly difference in %.
Water 04 00959 g006

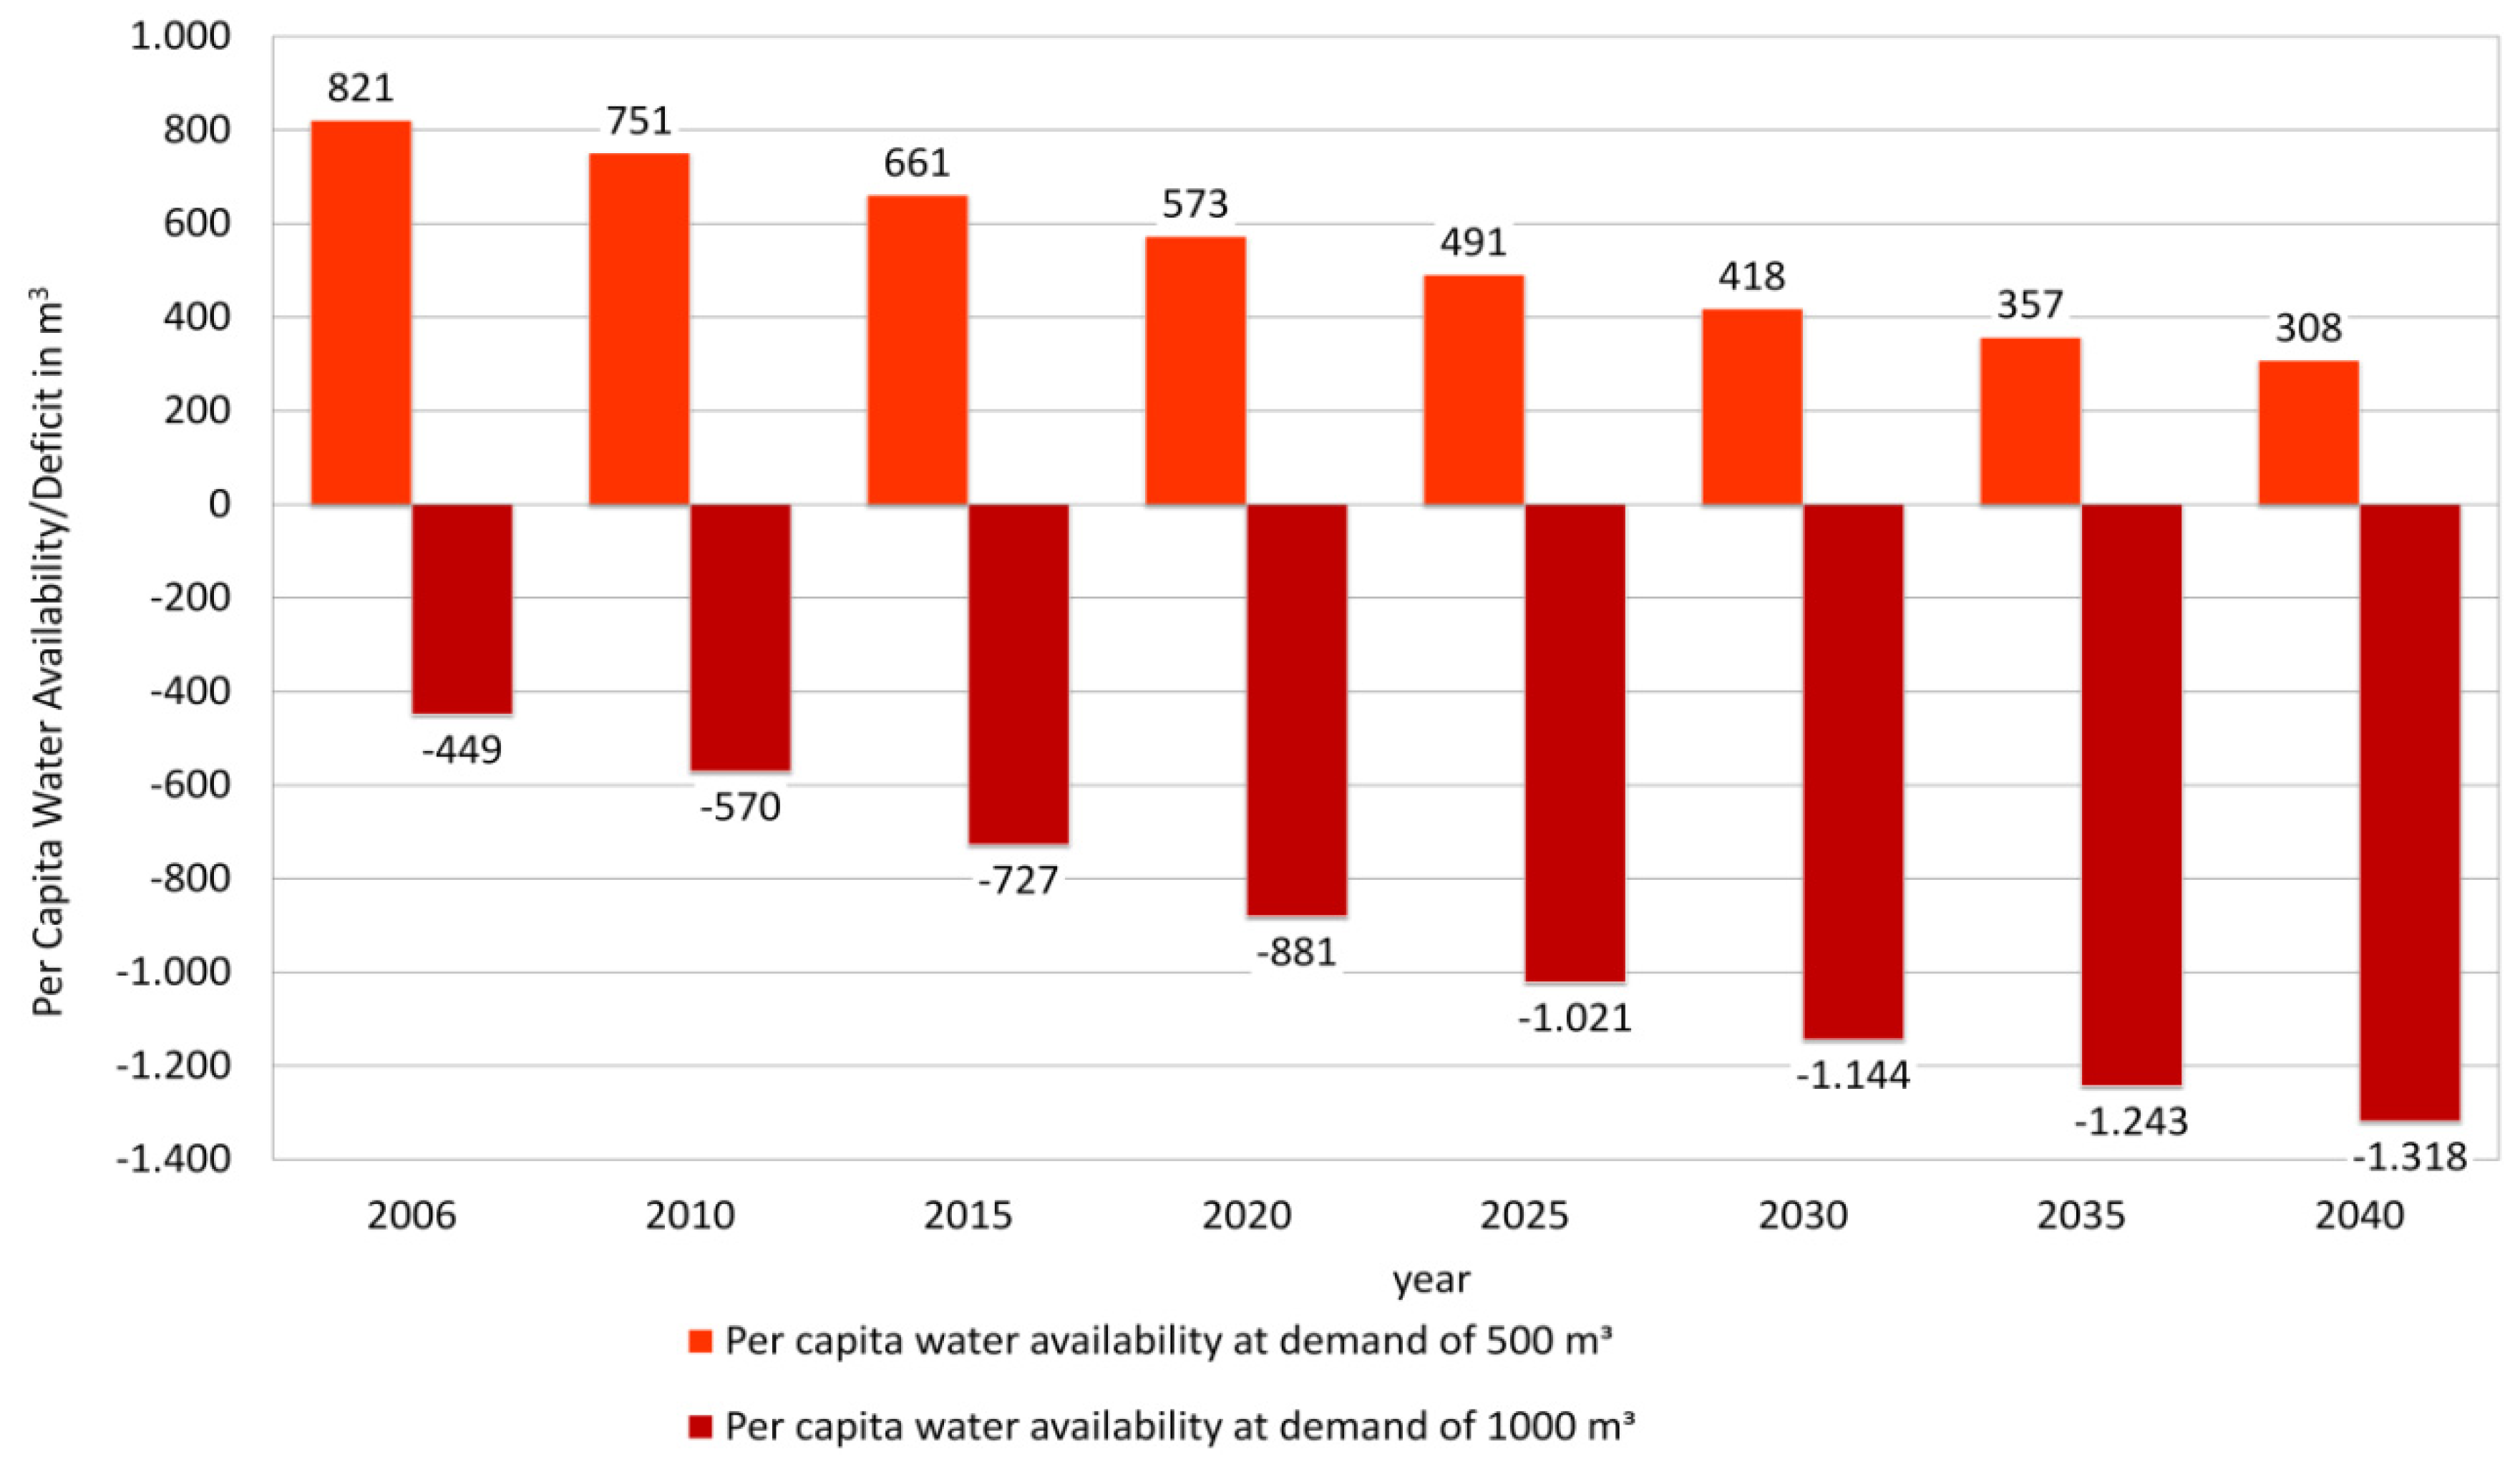
4.2 Impacts for Regional Per Capita Water Availability

The peak of projected population growth in Morocco will be reached in 2020 [61]. The national population development projection at a medium variant is transferred to the case study area, based on regional population figures (Figure 7). Even under a weakening population growth scenario, the region will have to supply a considerable amount of additional water to consumers. Further, additional growth can be expected due to hinterland migration towards the urbanizing coastal areas.
Figure 7. Population projections for the Moulouya river basin (1995–2040). Values in bars refer to the potential population in the respective 5-year segments based on the UN population growth rate for Morocco [61].
Water 04 00959 g007
Under the inclusion of regional population projections and potential water availability, two scenarios are derived for 2006–2040 to depict the human water supply situation if no compensatory measures are taken (Figure 8). According to Falkenmark per capita water availability between 1000 m3–1700 m3 denotes “regular water stress” [51]. Below a 1000 m3 per capita availability, a situation of “chronic water scarcity” marks a critical barrier for any economic activity and seriously limits economic development [51]. The real situation is alarming: the already markedly below-average regional supply capacity (442 m3 per capita in 2006) does not fit the actual demand (508 m3 per capita in 2006) [21]. Under the assumption of a decreasing CWB reinforced by pressures resulting from population growth, the regional per capita availability of blue water will fall below the critical value of 500 m3, even under an average low-demand assumption of 500 m3. Assuming a minimum water demand of 1000 m3, the overall availability will predominantly range in negative margins. Figure 8 shows the per capita water availability at an average water demand of 500 m3 and 1000 m3, respectively. Both values indicate considerable problems for development (Table 2), while a per capita availability of lower than 500 m3 denotes—according to Falkenmark [8,18,51]—that socio-economic development is virtually impossible without capacity improvements of water infrastructures and water usage behavior. The combined trends of the regional CWB and population growth show the risk of severe water deficits or total shortfalls for both scenarios. This is not only problematic for human supply and agricultural production, but could as well be detrimental for the natural environment (e.g., increases of droughts, increase of wild fires, canopy loss, increasing erosion). These figures point out that relying on blue water resources only will not suffice to achieve the targeted development objectives.
Figure 8. Scenarios for per capita water deficit/availability for 2006–2040 at two demand rates.
Water 04 00959 g008

5. Discussion

The very limited data availability and quality for the case study area poses a challenge for adequate water management and for decision makers. Discussions with stakeholders in the context of the ACCMA (Adaptation to Climate Change in Morocco) project revealed that climate change is feared to additionally enhance the pressure on water resources. Further, there was broad consensus that the current routines of water usage need to be improved and to become more efficient. This is particularly because regional development targets are concentrated on the expansion of water-intense sectors, namely agricultural production and luxury tourism at the coastline (city of Saidia, Figure 1). Insufficient blue water availability thus limits regional development and economic growth unless appropriate counteraction. As there is a discernible human influence on the scarcity situation, an important aspect of this analysis was to emphasize the human influence on the increasing scarcity of water availability. The water problem is not a novel phenomenon; but still water infrastructures are insufficient to fulfill the increasing demand. Under climate change and population growth, the need to innovatively restructure and adapt water management is a crucial task. Otherwise, the deterioration in living conditions caused by massive water scarcity may give rise to, inter alia, new migration streams or water conflicts.
The stepwise analysis of the increasingly problematic water situation in the area of the Moulouya river basin focused on two main drivers: regional climate change and population growth. Indications of climate change refer to changing average weather conditions within a considerable period of time (35 years). The assessment of historical climate trends shows a deterioration of the water situation. The CWB was used as a core indicator for declining water availability and calculated on the basis of aggregated climate data taken from CRU TS2.1 and “CRU/PIK” data sets. For the analysis of climate drivers we have found:
  • A mean annual precipitation decrease for 1971–2005 (−7%);
  • A significant decrease of winter precipitation (−21%);
  • A slightly significant drying trend for autumn 1971–2005 (−6%);
  • A significant temperature increase for December 1971–2005 (+6.8 °C); and
  • A 13% decrease of the regional CWB for 1971–2005.
Thus, there is a clear indication of decreasing winter precipitation, which is a vitally important hydrological variable for the overall regional water balance. The resulting consequences can be serious: reduced productivity and yields in the agricultural sector, and the possibility of revenue losses in the newly established tourism sector in case water capacities will run short. Combined with population projections for the region, we assume:
  • A very likely increase of regional water demand due to population growth;
  • A reinforcing trend of the critical per capita water supply situation (below 500 m3); and
  • A very likely establishment of a permanent water deficit situation.
Insufficient water availability is a principal obstacle to achieving regional development objectives. A per capita availability of below the 500 m3 threshold represents a “main constraint to life” [8,48,51]. Considering the per capita water deficit projected for the region, there is no other option than to implement innovative water production techniques (e.g., desalinization) [67] combined with an efficiency increase (waste water treatment, modern sewerage systems) to create stable conditions for water supply for human consumption or irrigation. Regional water policies have to be adjusted accordingly to safeguard future water demands. Further, development targets have to take into consideration limited resource capacities and competitive water sectors. The planning of large tourism facilities, which require an all-year continuous water supply (e.g., for garden and golf areas, and pools), such as in the coastal zone of Saidia (Figure 1), must be equipped with internal water treatment systems. The agricultural sector is the largest regional water consumer, with withdrawal rates of about 87% [59]. Under dryer conditions and rising temperatures in the agriculturally important winter period, supplementary irrigation will be indispensable. If water for irrigation cannot be guaranteed, the loss of cultivated land will be a consequence with complex socio-economic impacts, such as productivity losses, spread of poverty and increasing migration processes [68].

Implications for Regional Water Management

Regional stakeholder workshops with farmers and local decision makers in the context of the ACCMA project revealed high awareness regarding the problematic water situation. Particular problems referred to include the increase of water supply problems, increasing dryness and an associated reduction in agricultural productivity with the result of economic stagnation. The detected climate trends of this analysis support these perceptions and observations. However, it delivers a strong argument for a water resource management that takes into account both the aggravating climate conditions and the improvement of natural resources management, including water-use efficiency.
Currently, in many MENA countries, policy changes most often are a result from severe water crisis, affecting a critical mass of the population [4]. The Moroccan development plans “Plan Azur” and “Plan Bleu” presuppose water availability despite increasingly poor water conditions in some of the targeted regions [26,27]. Considering the growing water demand and the decreasing water budget, it is therefore important, above all, to strengthen water conservation, to improve water efficiency and to take innovative approaches aimed at ensuring a sufficient supply of water [4]. For example, water resources in the Moulouya basin suffer from degradation due to water pollution of industrial and agricultural origin [33]. Wastewater collection and treatment plays only a minor role in Morocco (less than 10%), and accurate data on wastewater volumes produced are not available [33]. The potential of wastewater resource exploitation is a neglected feature in the public water budget calculations of the regional water management, even if wastewaters in the Moulouya basin are partially used by farmers for irrigation, in particular in drought periods [69]. As well, taking into consideration the increasing urbanization rate in the lower basin area and the implementation of large tourism facilities, to relieve the pressure on blue water resources, regional water management could strengthen the focus on urban water reuse, e.g., by wastewater treatment plants located close to the place of use, and could further stipulate small-scale water cycles for water-intensive industrial production or tourism facilities. As regards water efficiency and to address water scarcity in agriculture, the potential of green water exploitation should be included as an essential part of the overall regional water resource calculations [19,44]. However, temporal variation and irregularity of rainfall leads to different amounts of available water and limits the possibilities of rain-fed agriculture [21]. Blue water will thus be essential for irrigation during low-precipitation periods [21].
To avoid water shortages in times of water demand peaks, and to avoid the usage of water from resources already under pressure, the Integrated Water Resource Management strategy in the region (effected by Agence du Bassin Hydraulique de Moulouya, see [70]) could consider a water management concept that focuses on the optimal valorization of water resources [45,71]. For example, the incremental value per m3 water deployed in the tourism sector might result in higher net gain than the same amount of water used for crop production. The emerging concepts of virtual water trade and the water footprint can support decision-making in water-short regions/countries by linking water consumption and production with a market-oriented approach for improving water demand management and by the identification of areas with inefficient water use [42,45]. It is thus imperative to improve the skills of water managers to adjust to future challenges and to pursue innovative trajectories for a sustainable water demand and supply management, instead of focusing on large-scale technical solutions as key objective in water scarce regions [4,19,44,48]. However, to be effective, water-resource related management strategies must consider specific local circumstances and should be in line with superordinate water policies and within a supportive political framework [15,48].

6. Conclusions

The analysis looked at different aspects to indicate the vulnerability of the Moulouya river basin to increasing water scarcity. Based on the simple and intuitively understandable Falkenmark Index and its water stress thresholds, the region’s exposure to water stress are analyzed and depicted. Climate change in terms of a decreasing natural water budget combined with water-based development objectives and population growth will enhance the pressures on water resources. A decreasing availability will have negative impacts, as the dependency on natural water availability in the region is very high. A main purpose of the analysis was to emphasize the need for societal and institutional responses. The degree of impacts associated with climate change impacts and population growth can be lowered by the prioritization and prompt implementation of water efficiency measures that also include innovative approaches, such as green water, crucial for rain-fed food production, the water footprint or virtual water trade approach to valorize water.
However, natural resources are fundamental to the physical and economic survival of the region’s population. Despite existent awareness, local technical capacities for efficient water usage are inappropriate [67]. Further, climate trends revealing the significant increase of dryer winters and autumns, coinciding with the cultivation period, are expected to severely interfere with the agricultural production. Very recently, the tourism sector represents an additional regional water consumer, causing seasonal demand peaks in the high summer season. This might lead to problems for the start of the following cultivation period in autumn, if water originally stored for this purpose is depleted.
Development targets can only be achieved if water conservation measures are implemented as a reaction towards increasing demand rates caused by population growth and the expansion of water-intense sectors. The analysis found a severe imbalance between potential water availability and minimum per capita water needs. The per capita blue water availability will fall markedly below the 500 m3 thresholds in the near term. The minimum per capita need of 1000 m3 in order to push economic development is considered as being impossible to be achieved on the basis of blue water [51]. Dry winters and an increased evapotranspiration rate will limit the natural water recharge and lead to a reduced annual water budget. In general, the water budget will not at all be sufficient to serve the targeted course of socio-economic development. Additional pressures, such as increasing siltation rates of existing dams of the Moulouya River, already cause high costs for maintenance [21]. This supports the argument that water management based on blue water resources only is not an appropriate measure of cost-effective water management. Given that water availability represents the key resource to achieve development targets, institutional capabilities and policies need to address the serious degradation, and financial and technical support is urgently required [68,69]. Once a certain threshold of water degradation is exceeded, the compensatory costs for alternative water resources might by far exceed the costs of promptly taken measures to adjust regional water capacities. Finally, the ecological value of water resources is inter alia expressed in the designation of the River Moulouya deltaic plains as RAMSAR wetlands. Not only is the regional water supply at risk, but also a unique ecosystem and wildlife habitat of international importance.

Acknowledgments

This work was supported by the project “ACCMA—Adaptation to Climate Change in Morocco” as part of the program “Adaptation aux Changements Climatiques en Afrique (ACCA)” of the International Development Research Centre Canada (IDRC) and the UK Department for International Development (DFID). The authors would like to gratefully thank Susanne Stoll-Kleemann (University Greifswald) and three anonymous reviewers for their valuable and constructive comments on this manuscript.

References

  1. Arnell, N.W. Climate change and global water resources: SRES emissions and socio-economic scenarios. Glob. Environ. Chang. Hum. Policy Dimens. 2004, 14, 31–52. [Google Scholar] [CrossRef]
  2. Pratt, J.; Taylor, J.; Catton, W. Carrying capacity and sustainable resource use. In Human Ecology, Environmental Education and Sustainable Development; The 9th Commonwealth Conference on Development and Human Ecology; Daysh, Z., Carley, M., Ekehorn, E., Philipps-Howard, K., Waller, R., Eds.; The Commonwealth Human Ecology Council: London, University of Edinburgh: Edinburgh, UK, 1991; Volume 1, pp. 92–96. [Google Scholar]
  3. Bogardi, J.J.; Dudgeon, D.; Lawford, R.; Flinkerbusch, E.; Meyn, A.; Pahl-Wostl, C.; Vielhauer, K.; Vörösmarty, C. Water security for a planet under pressure: Interconnected challenges of a changingworld call for sustainable solutions. Curr. Opin. Environ. Sustain. 2012, 4, 35–43. [Google Scholar] [CrossRef]
  4. Sowers, J.; Vengosh, A.; Weinthal, E. Climate change, water resources, and the politics of adaptation in the Middle East and North Africa. Clim. Chang. 2011, 104, 599–627. [Google Scholar] [CrossRef]
  5. García-Ruiz, J.M.; López-Moreno, J.I.; Vicente-Serrano, S.M.; Lasanta-Martínez, T.; Beguería, S. Mediterranean water resources in a global change scenario. Earth Sci. Rev. 2011, 105, 121–139. [Google Scholar] [CrossRef] [Green Version]
  6. Stafford-Smith, M.; Gaffney, O.; Brito, L.; Ostrom, E.; Seitzinger, S. Interconnected risks and solutions for a planet under pressure—Overview and introduction. Curr. Opin. Environ. Sustain. 2012, 4, 3–6. [Google Scholar] [CrossRef]
  7. Schellnhuber, H.J.M.; Leggewie, C.; Leinfelder, R.; Nakicenovic, N.; Rahmstorf, S.; Schlacke, S.; Schmid, J.; Schubert, R. World in Transition—A Social Contract for Sustainability; German Advisory Council on Global Change (WBGU): Berlin, Germany, 2011. [Google Scholar]
  8. Falkenmark, M. The massive water scarcity now threatening Africa—Why isn’t it being addressed. Ambio 1989, 18, 112–118. [Google Scholar]
  9. Beyond Scarcity: Power, Poverty and the Global Water Crisis; United Nations Development Program Human Development Report 2006; United Nations: New York, NY, USA, 2006. Available online: http://hdr.undp.org/en/media/HDR06-complete.pdf (accessed on 13 September 2012).
  10. Sullivan, C.A. Quantifying water vulnerability: A multi-dimensional approach. Stoch. Environ. Res. Risk Assess. 2011, 25, 627–640. [Google Scholar] [CrossRef]
  11. Molden, D. Water for Food, Water for Life: A Comprehensive Assessment of Water Management in Agriculture; Earthscan: London, UK; International Water Management Institute (IWMI): Colombo, Sri Lanka, 2007. [Google Scholar]
  12. Bates, B.C.; Kundzewicz, Z.W.; Wu, S.; Palutikof, J.P. Climate Change and Water; IPCC Technical Paper VI; IPCC Secretariat: Geneva, Switzerland, 2008. Available online: http://www.ipcc.ch/pdf/technical-papers/climate-change-water-en.pdf (accessed on 20 August 2012).
  13. Alcamo, J.M.; Vorösmarty, C.J.; Naiman, R.J.; Lettenmaier, D.P.; Pahl-Wostl, C. A grand challenge for freshwater research: Understanding the global water system. Environ. Res. Lett. 2008, 3, 1–6. [Google Scholar]
  14. Fereres, E.; Orgaz, F.; Gonzalez-Dugo, V. Reflections on food security under water scarcity. J. Exp. Bot. 2011, 62, 4079–4086. [Google Scholar] [CrossRef]
  15. Muller, M. Fit for purpose: Taking integrated water resource management back to basics. Irrig. Drain. Syst. 2010, 24, 161–175. [Google Scholar] [CrossRef]
  16. Vörösmarty, C.J.; Green, P.; Salisbury, J.; Lammers, R.B. Global water resources: Vulnerability from climate change and population growth. Science 2000, 289, 284–288. [Google Scholar]
  17. Jackson, R.B.; Carpenter, S.R.; Dahm, C.N.; McKnight, D.M.; Naiman, R.J.; Postel, S.L.; Running, S.W. Water in a changing world. Ecol. Appl. 2001, 11, 1027–1045. [Google Scholar] [CrossRef]
  18. Falkenmark, M. Global water issues confronting humanity. J. Peace Res. 1990, 27, 177–190. [Google Scholar] [CrossRef]
  19. Rijsberman, F.R. Water scarcity: Fact or fiction? Agric. Water Manag. 2006, 80, 5–22. [Google Scholar] [CrossRef]
  20. Diffenbaugh, N.S.; Pal, J.S.; Giorgi, F.; Gao, X.J. Heat stress intensification in the Mediterranean climate change hotspot. Geophys. Res. Lett. 2007, 34, L11706:1–L11706:6. [Google Scholar]
  21. Snoussi, M. Review of Certain Basic Elements for the Assessment of Environmental Flows in the Lower Moulouya; IUCN International Union for Conservation of Nature: Gland, Switzerland, 2004. Available online: http://cmsdata.iucn.org/downloads/morocco.pdf (accessed on 20 August 2012).
  22. Kadi, M.A. From water scarcity to water security in the Maghreb Region: The Moroccan Case. In Environmental Challenges in the Mediterranean 2000–2050; NATO Science Series IV; Marquina, A., Ed.; Kluwer Academic Publisher: Dordrencht, The Nertherlands, 2004. [Google Scholar]
  23. Haut Commissariat au Plan du Maroc Web Page. Recensement Général de la Population et de L’habitat 2004. Available online: http://www.hcp.ma/Recensement-general-de-la-population-et-de-l-habitat-2004_a633.html (accessed on 20 August 2012).
  24. FAO/AQUASTAT. Information System on Water and Agriculture, Water Resources and Irrigation in Africa. Available online: http://www.fao.org/nr/water/aquastat/main/index.stm (accessed on 20 August 2012).
  25. Born, K.; Fink, A.H.; Paeth, H. Dry and wet periods in the northwestern Maghreb for present day and future climate conditions. Meteorol. Z. 2008, 17, 533–551. [Google Scholar] [CrossRef]
  26. Royaume du Maroc. Plan Azur: Référentiel Développement Durable Pour les Nouvelles Zones Touristiques à Horizon 2010—Principes de Développement Touristique Durable cas Marocain. In SMAP III TA Regional Workshop on Sustainable Tourism, Istanbul, Turkey, 19-21 February 2008.
  27. Plan Maroc Vert: Premières Perspectives sur la Stratégie Agricole; Ministère de l’Agriculture: Rabat, Morocco, 2008. Available online: http://www.europarl.europa.eu/meetdocs/2009_2014/documents/dmag/dv/dmag20100505_13_/dmag20100505_13_fr.pdf (accessed on 20 August 2012).
  28. Khrouz, D.; Hajji, A.; Boussetta, M. The development research environment in Morocco: Situation and prospects. Rached, E.; Craissati, D. IDRC International Development Research Centre: Ottawa, Canada, 2000, 2000; pp. 161–185. Available online: http://archive.idrc.ca/books/focus/930/16khrouz.html (accessed on 20 August 2012).
  29. Falkenmark, M. Coping with water scarcity under rapid population growth. In Proceedings ofConference of SADC Ministers, Pretoria, South Africa, 23-24 November 1995.
  30. Willaarts, B.A.; Volk, M.; Aguilera, P.A. Assessing the ecosystem services supplied by freshwater flows in Mediterranean agroecosystems. Agric. Water Manag. 2012, 105, 21–31. [Google Scholar] [CrossRef]
  31. Sullivan, C.A.; Meigh, J.R.; Giacomello, A.M.; Fediw, T.; Lawrence, P.; Samad, M.; Mlote, S.; Hutton, C.; Allan, J.A.; Schulze, R.E.; et al. The water poverty index: Development and application at the community scale. Nat. Resour. Forum 2003, 27, 189–199. [Google Scholar]
  32. Hoff, H.; Bonzi, C.; Joyce, B.; Tielbörger, K. A water resources planning tool for the Jordan River Basin. Water 2011, 3, 718–736. [Google Scholar] [CrossRef]
  33. Melhaoui, M. Integration of Biodiversity in the Decision-Making Process: Lessons Learnt from the Moulouya Projects; Centre for Mediterranean Cooperation, International Union for Conservation of Nature: Gland, Switzerland, 2010. Available online: http://cmsdata.iucn.org/downloads/.
  34. Tekken, V.; Costa, L.; Kropp, J.P. Assessing the regional impacts of climate change on economic sectors in the low-lying coastal zone of Mediterranean East Morocco. J. Coast. Res. 2009, 1, 272–276. [Google Scholar]
  35. Köppen, W. Das geographische system der klimate. In Handbuch der Klimatologie; Köppen, W.P., Geiger, R.H., Eds.; Gebrüder Borntraeger: Berlin, Germany, 1936. [Google Scholar]
  36. Snoussi, M.; Haida, S.; Imassi, S. Effects of the construction of dams on the water and sediment fluxes of the Moulouya and the Sebou Rivers, Morocco. Reg. Environ. Chang. 2002, 3, 5–12. [Google Scholar] [CrossRef]
  37. Carneiro, J.F.; Boughriba, M.; Correia, A.; Zarhloule, Y.; Rimi, A.; Houadi, B.E. Evaluation of climate change effects in a coastal aquifer in Morocco using a density-dependent numerical model. Environ. Earth Sci. 2010, 61, 241–252. [Google Scholar] [CrossRef]
  38. RAMSAR Wetlands International. The Ramsar Sites Database. Available online: http://ramsar.wetlands.org/Database/Searchforsites/tabid/765/Default.aspx (accessed on 20 August 2012).
  39. National Plan against Global Warming; Royaume du Maroc: Rabat, Morocco, 2009.
  40. Arnell, N.W. Climate change and global water resources. Glob. Environ. Chang. Hum. Policy Dimens. 1999, 9, S31–S49. [Google Scholar] [CrossRef]
  41. Alcamo, J.; Florke, M.; Marker, M. Future long-term changes in global water resources driven by socio-economic and climatic changes. Hydrol. Sci. J. 2007, 52, 247–275. [Google Scholar] [CrossRef]
  42. Hoekstra, A.Y.; Mekonnen, M.M.; Chapagain, A.K.; Mathews, R.E.; Richter, B.D. Global monthly water scarcity: Blue water footprints versus blue water availability. PLoS ONE 2012, 7, e32688:1–e32688:9. [Google Scholar]
  43. White, C. Understanding water scarcity: Definitions and measurements; GWF Discussion Paper 1217. Global Water Forum: Canberra, Australia, 2012. Available online: http://www.globalwaterforum.org/ 2012/05/07/understanding-water-scarcity-definitions-and-measurements/ (accessed on 7 October 2012).
  44. Savenije, H.H.G. Water scarcity indicators; The deception of the numbers. Phys. Chem. Earth Part B Hydrol. Ocean. Atmos. 2000, 25, 199–204. [Google Scholar] [CrossRef]
  45. Hoekstra, A.Y. Virtual water trade. In Proceedings of the International Expert Meeting on Virtual Water Trade, Delft, The Netherlands, 12–13 December 2002.
  46. Ohlsson, L. Water conflicts and social resource scarcity. Phys. Chem. Earth Part B Hydrol. Ocean. Atmos. 2000, 25, 213–220. [Google Scholar] [CrossRef]
  47. Alcamo, J.; Henrichs, T.; Rosch, T. World Water in 2025: Global Modeling and Scenario Analysisfor the World Commission on Water for the 21st Century; Centre for Environmental Systems Research, University of Kassel: Kassel, Germany, 2000; pp. 1–49. [Google Scholar]
  48. Gleick, P.H.; Chalecki, E.L.; Wong, A. Measuring water well-being: Water indicators and indices. In The World’s Water, 2002–2003: The Biennal Report on Freshwater Resources; Gleick, P.H., Ed.; Island Press: Washington, DC, USA, 2002; pp. 87–112. [Google Scholar]
  49. Brown, A.; Matlock, M.D. A Review of Water Scarcity Indices and Methodologies; The Sustainability Consortium,University of Arkansas: Fayetteville, AK, USA, 2011. Available online: http://www.sustainabilityconsortium.org/wp-content/themes/sustainability/assets/pdf/whitepapers/ 2011_Brown_Matlock_Water-Availability-Assessment-Indices-and-Methodologies-Lit-Review.pdf (accessed on 7 October 2012).
  50. Sagar, A.D.; Najam, A. The human development index: A critical review. Ecol. Econ. 1998, 25, 249–264. [Google Scholar] [CrossRef]
  51. Falkenmark, M.; Widstrand, C. Population and water resources: A delicate balance. Popul. Bull. 1992, 47, 2–36. [Google Scholar]
  52. Vorösmarty, C.J.; Douglas, E.M.; Green, P.A.; Revenga, C. Geospatial indicators of emerging water stress: An application to Africa. Ambio 2005, 34, 230–236. [Google Scholar]
  53. Taylor, R.G.; Koussis, A.D.; Tindimugaya, C. Groundwater and climate in Africa—A review. Hydrol. Sci. J. 2009, 54, 655–664. [Google Scholar] [CrossRef]
  54. Eurostat/European Commission. MEDSTAT II: “Water and Tourism” Pilot Study; Office for Official Publications of the European Communities: Luxembourg, 2009. Available online: http://epp.eurostat.ec.europa.eu/cache/ITY_OFFPUB/KS-78-09-699/EN/KS-78-09-699-EN.PDF (accessed on 20 August 2012).
  55. New, M.; Lister, D.; Hulme, M.; Makin, I. A high-resolution data set of surface climate over global land areas. Clim. Res. 2002, 21, 1–25. [Google Scholar] [CrossRef]
  56. Mitchell, T.D.; Jones, P.D. An improved method of constructing a database of monthly climate observations and associated high-resolution grids. Int. J. Climatol. 2005, 25, 693–712. [Google Scholar] [CrossRef]
  57. sterle, H.; Gerstengarbe, F.-W.; Werner, P.C. Homogenisierung und aktualisierung des klimadatensatzes der climate research unit der Universität of East Anglia, Norwich, UK. Terra Nostra 2003, 6, 326–329. [Google Scholar]
  58. Imassi, S. Variabilité Hydroclimatique et Impacts des Activités Anthropiques sur les Resources en eau de la Basse Moulouya (Maroc Oriental). Ph.D. thesis, Mohammed V University at Agdal, Rabat, Morocco, 2007. [Google Scholar]
  59. L’irrigation en Afrique en Chiffres. FAO Rapports Sur L’eau 29. Food and Agriculture Organization: Rome, Italy, 2005. Available online: ftp://ftp.fao.org/agl/aglw/docs/wr29_fre.pdf (accessed on 20 August 2012).
  60. UN-Water/Africa, African Water Development Report 2006; UN-Water/Africa, Economic Commission for Africa: Addis Ababa, Ethiopia, 2006.
  61. United Nations Population Division. World Population Prospects: The 2010 Revision Population Database; UN Department of Economic and Social Affairs of the United Nations Secretariat: New York, NY, USA, 2011. Available online: http://esa.un.org/wpp/unpp/panel_population.htm (accessed on 20 August 2012).
  62. Le Maroc des Régions 2005; Direction De La Statistique; Haut Commissariat Au Plan: Rabat, Morocco, 2005.
  63. Thornthwaite, C.W. An approach toward a rational classification of climate. Geogr. Rev. 1948, 38, 55–94. [Google Scholar] [CrossRef]
  64. Bautista, F.; Bautista, D.; Delgado-Carranza, C. Calibration of the equations of Hargreaves and Thornthwaite to estimate the potential evapotranspiration in semi-arid and subhumid tropical climates for regional applications. Atmosfera 2009, 22, 331–348. [Google Scholar]
  65. Leichenko, R.; O’Brien, K.; Aandahl, G.; Tompkins, H.; Javed, A. Mapping Vulnerability to Multiple Stressors: A Technical Memorandum; CICERO: Oslo, Norway, 2004. [Google Scholar]
  66. World Water Assessment Programme (WWAP), The United Nations World Water Development Report 4: Managing Water Under Uncertainty and Risk; UNESCO Publishing: Paris, France, 2012.
  67. Trieb, F.; Muller-Steinhagen, H.; Kern, J.; Scharfe, J.; Kabariti, M.; Al Taher, A. Technologies forlarge scale seawater desalination using concentrated solar radiation. Desalination 2009, 235, 33–43. [Google Scholar] [CrossRef]
  68. Sullivan, C.A.; Huntingford, C. Water resources,climate change and human vulnerability. Proceedings of 18th World IMACS Congress and MODSIM09 International Congress on Modelling and Simulation, Cairns, Australia, 13-17 July 2009; pp. 2377–2383. Available online: http://www.mtnforum.org/sites/default/files/pub/5034.pdf (accessed on 20 August 2012).
  69. Qadir, M.; Bahri, A.; Sato, T.; Al-Karadsheh, E. Wastewater production, treatment, and irrigation in Middle East and North Afria. Irrig. Drain. Syst. 2010, 24, 37–51. [Google Scholar] [CrossRef]
  70. Agence du Bassin Hydraulique de la Moulouya Home Page. Available online: http://www.abhm.ma (accessed on 22 November 2012).
  71. Etude du Plan Directeur d’Aménagement Intégré des Ressources en Eau du Bassin de la Moulouya (PDAIRE); Agence du Bassin Hydraulique de la Moulouya: Oujda, Morocco, 2009. Available online: http://www.eaumoulouya.ma/TermReferPDAIREMoulouyal.htm (accessed on 22 November 2012).

