Article

Modeling and Optimization of New Flocculant Dosage and pH for Flocculation: Removal of Pollutants from Wastewater

1
Environmental Engineering Department, School of Environmental Studies, China University of Geosciences, Wuhan 430074, China
2
College of Engineering, University of Basrah, Karmat Ali, Basrah 42001, Iraq
*
Author to whom correspondence should be addressed.
Water 2013, 5(2), 342-355; https://doi.org/10.3390/w5020342
Submission received: 22 January 2013 / Revised: 8 March 2013 / Accepted: 19 March 2013 / Published: 26 March 2013
(This article belongs to the Special Issue Sustainable Wastewater Treatment and Pollution Control)

Abstract

:
In this paper, a new ferric chloride-(polyvinylpyrrolidone-grafted-polyacrylamide) hybrid copolymer was successfully synthesized by free radical polymerization in solution using ceric ammonium nitrate as redox initiator. The hybrid copolymer was characterized by Fourier transform infrared spectroscopy (FTIR) and scanning electron microscopy (SEM). Response surface methodology (RSM), involving central composite design (CCD) matrix with two of the most important operating variables in the flocculation process; hybrid copolymer dosage and pH were utilized for the study and for the optimization of the wastewater treatment process. Response surface analyses showed that the experimental data could be adequately fitted to quadratic polynomial models. Under the optimum conditions, the turbidity and chemical oxygen demand (COD) removal efficiencies were 96.4% and 83.5% according to RSM optimization, whereas the optimum removals based on the genetic algorithm (GA) were 96.56% and 83.54% for the turbidity and COD removal models. Based on these results, wastewater treatment using this novel hybrid copolymer has proved to be an effective alternative in the overseeing of turbidity and COD problems of municipal wastewater.

1. Introduction

Coagulation-flocculation is one of the chemical treatment processes commonly used for water and wastewater. It has a wide range of application in water and wastewater facilities because it is efficient and simple to operate [1,2]. Domestic wastewater usually contains pathogens, suspended solids, nutrients and some other organic materials [3]. The benefit of wastewater treatment is to satisfy the requirements of discharging treated water into the environment. Aluminum and iron salts are widely used as coagulants in the conventional coagulation/flocculation processes and their mode of action is usually explained by two mechanisms: charge neutralization of negatively charged colloids by cationic hydrolysis products and incorporation of impurities in an amorphous hydroxide precipitate [4]. The efficiency of the coagulation/flocculation process depends on the type and dosage of coagulants/flocculants, wastewater pH, and mixing speed.
The addition of inorganic salts to organic flocculants was suggested as the main method of preparing hybrid-flocculants [5,6]. In this method, the enhancement of flocculants by aggregation power increased the ratio of effective component and positive charge of the flocculants [7].
The traditional method of experimentation involves changing one factor at a time. This conventional method of experimentation requires many experiments, which are not only time-consuming, but also lead to low efficiency of optimization. To find a solution to this problem, design of experiment (DOE) has been employed to study the effect of variables and their responses using a minimum number of experiments. Response surface methodology (RSM) is a collection of statistical and mathematical methods which are useful for developing, improving, and optimizing processes [8,9].
Genetic algorithm (GA) is defined as a search technique used in computing to find out the exact or estimated solution in order to optimize and investigate the problem. GA-based optimization is a stochastic search method that involves random generation of positional design solutions which it systematically evaluates and refines until a stopping criterion is met [10]. Through genetic operators and natural selection as well as by mutation and crossover, the best fitness is found.
In this research, the hybrid copolymer ferric chloride-(polyvinylpyrrolidone-grafted-polyacrylamide) (FeCl3-(PVP-g-PAM)) was successfully synthesized by free radical polymerization and characterization of the novel hybrid copolymer was carried out using Fourier transform infrared spectroscopy (FTIR) and scanning electron microscopy (SEM). Moreover, the possible effectiveness of utilizing the hybrid copolymer was investigated as an alternative flocculent in wastewater treatment to remove turbidity and chemical oxygen demand (COD) from that water. This paper also targeted the use of a genetic algorithm with RSM to find the optimal parameters and to investigate the promoted effectiveness of predication for removal of pollutants from wastewater.

2. Materials and Methods

2.1. Materials

Acrylamide (AM) was purchased from Amresco (Solon, OH, USA). Ferric chloride (FeCl3) was provided by Shanghai Chemicals Reagent Corp. (Shanghai, China). Polyvinylpyrrolidone (PVP) was obtained from Shanghai Zhanyun Chemical Co., Ltd (Shanghai, China). Ammonium cerium (IV) nitrate (CAN) was supplied by Sinopharm Chemicals Reagent Co. Ltd (Beijing, China). Acetone used was of analytical regent grade.

2.2. Preparation of Hybrid Copolymer

The hybrid copolymer was synthesized by a ceric ion-induced redox initiation method according to the following steps: One gram of polyvinylpyrrolidone (PVP) was dissolved in 100 mL of distilled water at ambient temperature in a 500 mL three-necked flask, stirred with a mechanical stirrer and equipped with a thermostatic water bath, nitrogen line, a reflex condenser, and a rubber septum gap. After that, the system was purged with nitrogen for 30 min to remove the dissolved oxygen from the solution. Then, 0.1 mol of acrylamide and 0.55 mmol of ammonium cerium (IV) nitrate were added to the polymerization system under atmospheric nitrogen. The polymerization reaction was carried out for 2 h at 60 °C. To this, a solution, 1 M of ferric chloride (prepared in 50 mL of distilled water) was added to the polymerization flask at 60 °C and mixed with constant stirring under a nitrogen atmosphere for 3 h. Finally, the produced gel was cooled to ambient temperature, precipitated in acetone, and dried in a vacuum oven at 60 °C to constant weight.

2.3. Characterization of Hybrid Copolymer

The Fourier transform infrared (FTIR) spectra were measured on a Nexus FTIR spectrophotometer (Thermo Fisher Scientific Inc., Waltham, MA, USA) using the KBr pellet method. The IR spectra were recorded within the range of 4000–400 cm−1. The morphology of the hybrid copolymer surface was investigated using scanning electron microscope (SEM) images with different magnification obtained from a QUANTA 200 scanning electron microscope (FEI Company, Hillsboro, OR, USA).

2.4. Wastewater Source

The samples of wastewater in this study were collected from the sewer system network in the east campus at the China University of Geosciences (Wuhan). The wastewater samples were transported to the laboratory within 20 min and then characterized there for turbidity, COD and pH. The measured values of the wastewater sample for the flocculation experiments were as follows: Turbidity 305 NTU, COD 368 mg/L, and pH 7.4.

2.5. Wastewater Flocculation

The jar test used in our experiments was a programmable apparatus (TA6, Wuhan, China). It consisted of six paddles on a bench. The paddles were connected to each other by a gear mechanism, and all of these paddles were simultaneously rotated by the same motor at a controlled speed and time.
Wastewater samples of 1000 mL each, were transferred to the jars and then pH adjusted using 0.5 M HCl or 0.5 M NaOH solutions. The required dose of FeCl3-(PVP-g-PAM) hybrid copolymer was added to each beaker. Directly after the addition of the hybrid copolymer dosage, the wastewater sample in the jar was stirred rapidly at a paddle speed of 120 rpm for 2 min then stirred slowly at a paddle speed of 30 rpm for 20 min, and finally, the treated wastewater was allowed to settle for 30 min.
The removal of the pollutants (COD and turbidity) was calculated according to the following formula:
Water 05 00342 i001
where, Ci and Cf are the initial and final concentrations of the pollutants.

2.6. Response Surface Methodology

Response surface methodology is a statistical method frequently used in designing experimental, building models, for evaluating the effects of several factors and to find the optimum conditions for desirable responses as well as to reduce the number of experiments [11,12]. Design-expert software version 8, was used to optimize the major operating factors which were FeCl3-(PVP-g-PAM) hybrid copolymer dosage and wastewater pH. In this study, RSM used the common form of center composite design (CCD) which is called center composite face design (CCFD) that consists of 2k factorial points (k means factors = 2), 2k axial points and two replicated at the center point to provide estimation of the experimental error variance. The turbidity removal and COD removal were selected as the dependent variables, while the hybrid copolymer dosage and wastewater pH were selected as independent variables.
Total number of experiments = (2k) + (2k) + 2 = 10 experiments
The independent variables (factors) were hybrid copolymer dosage (denoted by X1) and wastewater pH (denoted by X2). These factors have three levels as follows: low level (−1), center level (0), and high level (+1) as shown in Table 1. The actual values of the coded levels for these factors were selected and based on preliminary experiments. These codes are also included in Table 1.
Table 1. Experimental factor levels for independent variables.
Variables (Factors)SymbolReal values of coded levels
Low level (−1)Center level (0)High level (+1)
Dose (mg/L)X150100150
pHX2579
The second order polynomial equation is used to prove the relationship between the factors (X1 and X2) and the investigated response (Y).
Water 05 00342 i002
where Y is the response model (turbidity removal and COD removal); β0 is the constant coefficient; βi is the coefficient of the linear term; βii is the coefficient of the square term; βij is the coefficient of the quadratic term; k is the number of independent variables; Xi and Xj are the coded values of the independent variables.

3. Results and Discussion
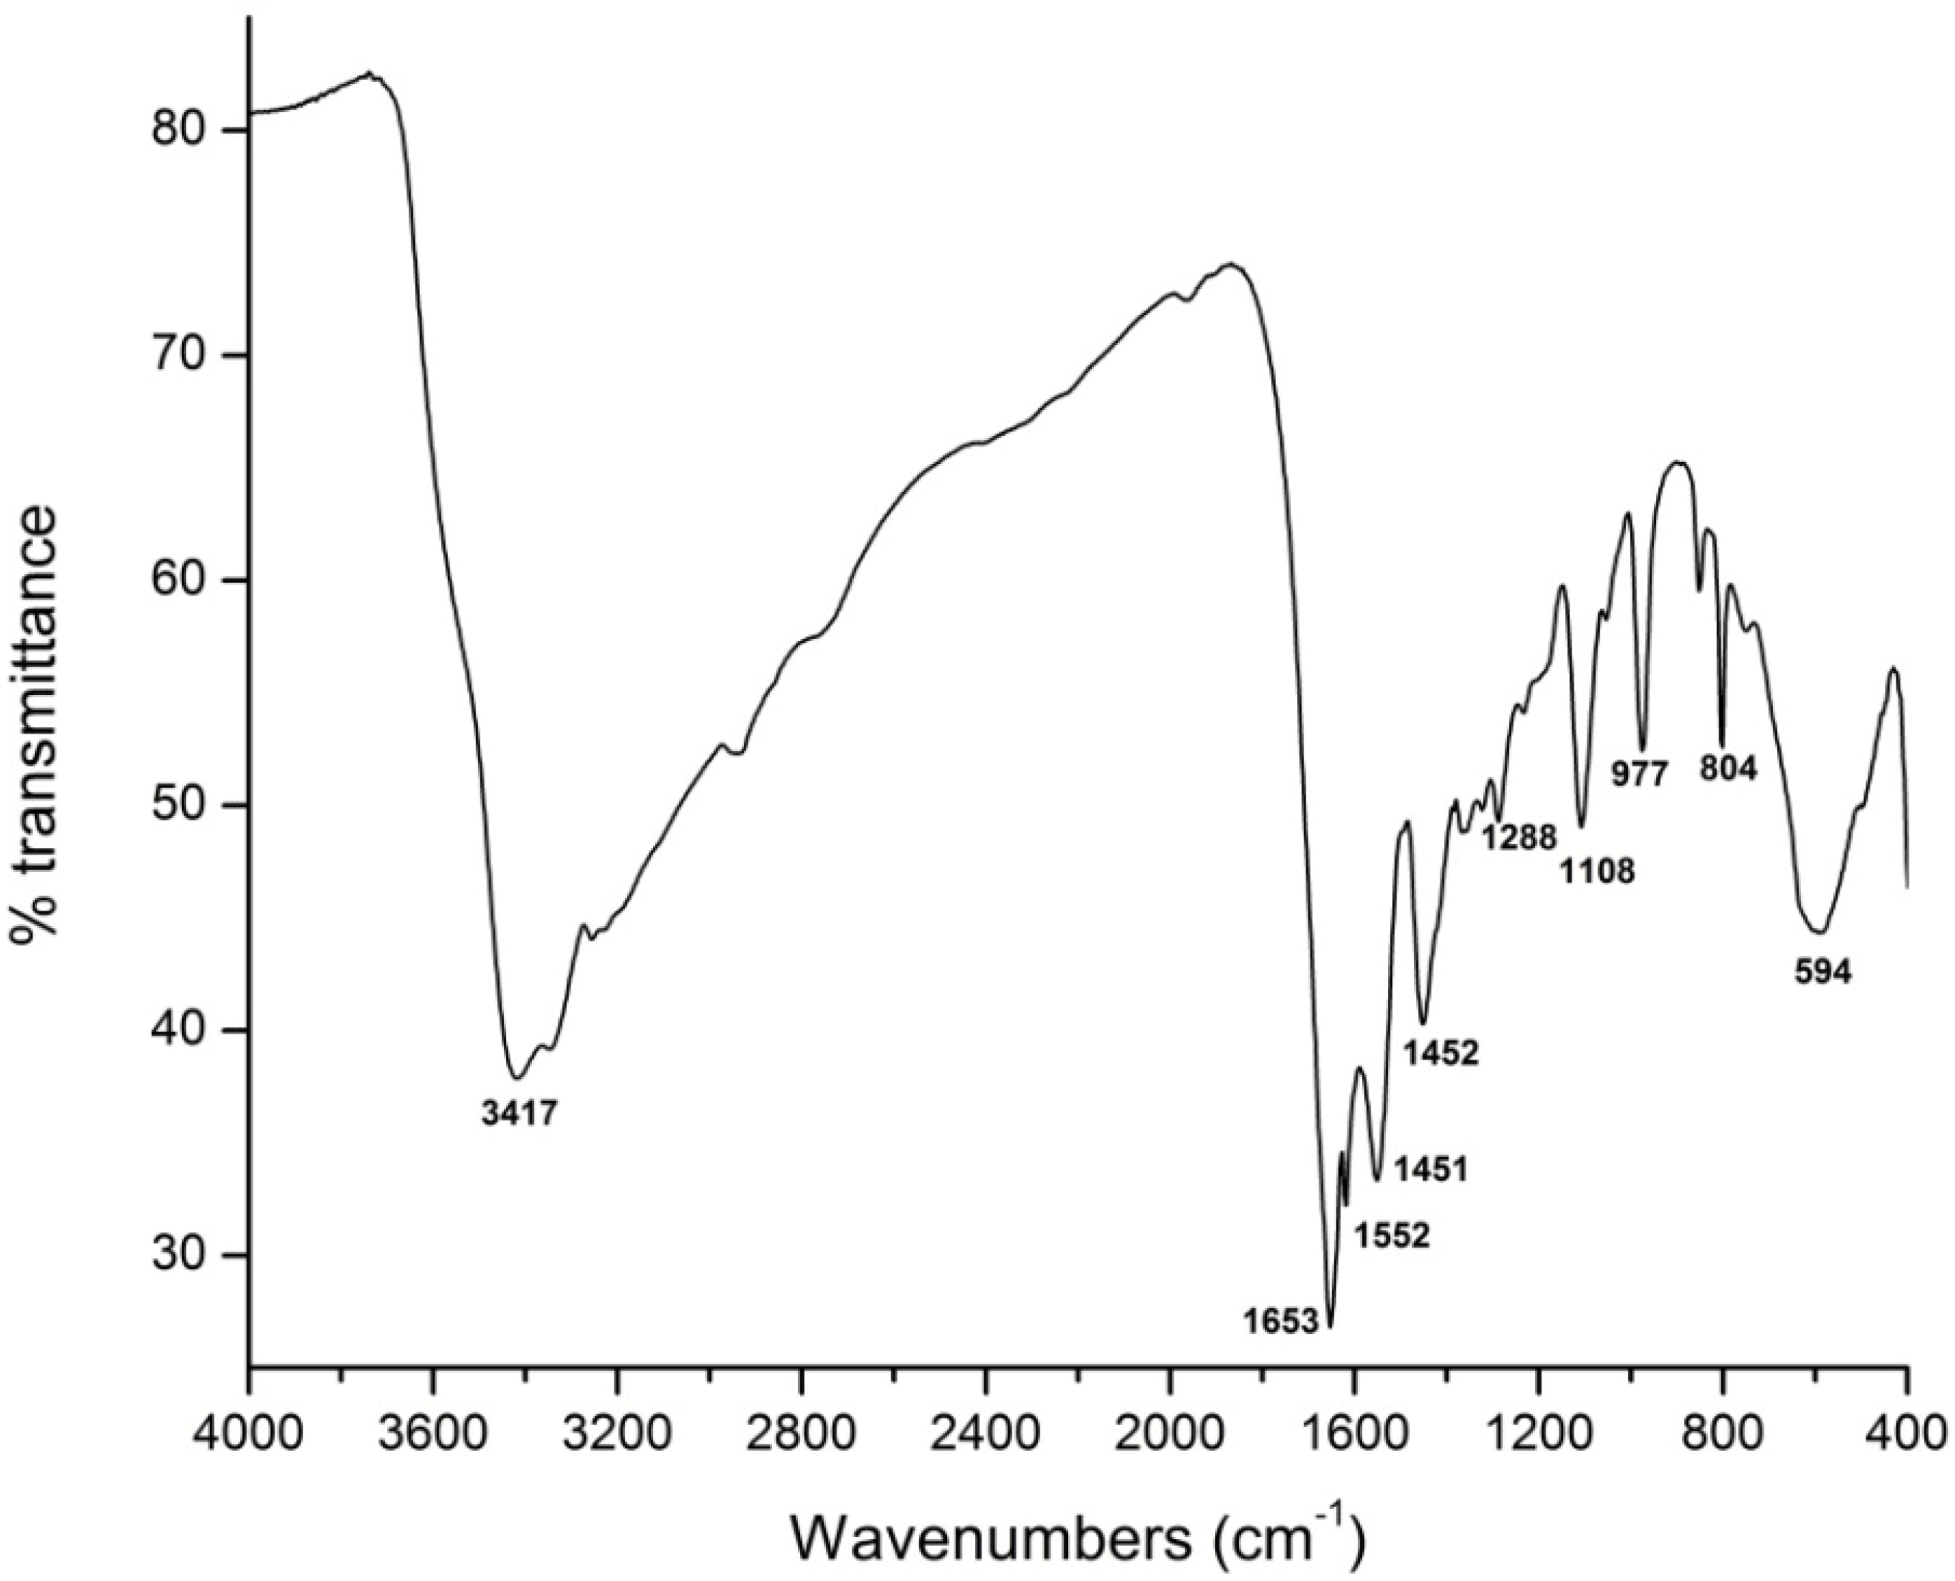
3.1. FTIR Spectra

The IR spectra of the hybrid copolymer are shown in Figure 1. The spectra were characterized by the following bands: band at 3417 cm−1 attributed to OH; band at 1653 cm−1 attributed to amide II; band at 1552 cm−1 attributed to amide I; band at 1451 cm−1 attributed to CH; band at 1108 cm−1 corresponding to -C-NH2; band at 594 cm−1 corresponding to C-Cl [13]. The above analysis results show that the new hybrid copolymer has inorganic and organic components, and hence it is an inorganic-organic complex.
Figure 1. Fourier transform infrared spectroscopy (FTIR) spectra of the ferric chloride-(polyvinylpyrrolidone-grafted-polyacrylamide)(FeCl3-(PVP-g-PAM)) hybrid copolymer.
Water 05 00342 g001

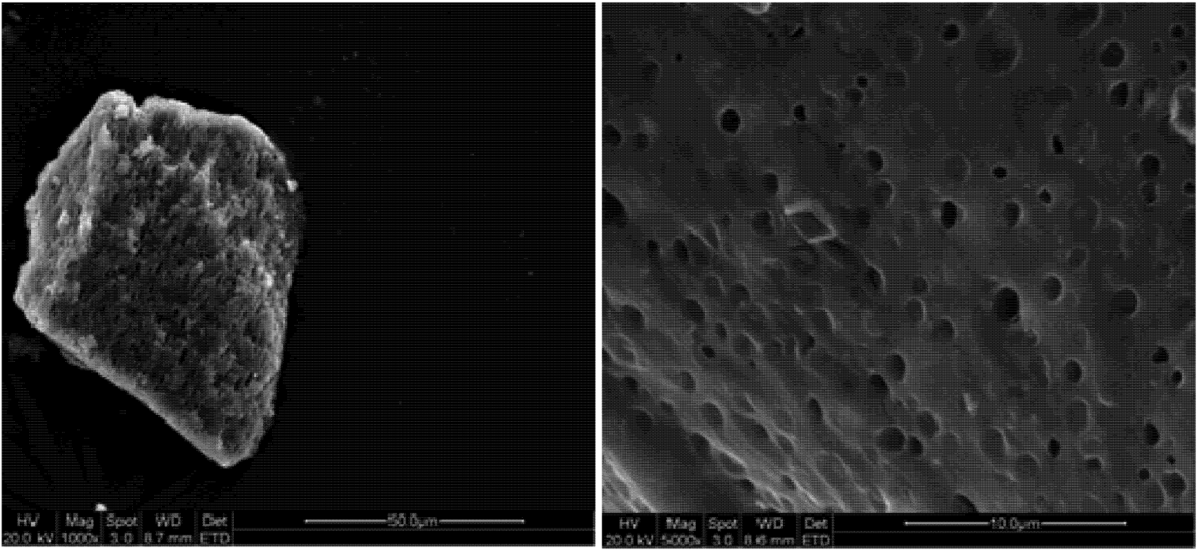
3.2. Morphological Analysis

The technique used for studying the surface morphology of the polymers is scanning electron microscopy (SEM). The SEM images obtained for the FeCl3-(PVP-g-PAM) hybrid copolymer as shown in Figure 2 indicated that the surface of the hybrid copolymer has a porous surface and that this type of surface may have some influence on the flocculation process.
Figure 2. Scanning electron microscopy (SEM) images for FeCl3-(PVP-g-PAM) at different magnification.
Water 05 00342 g002

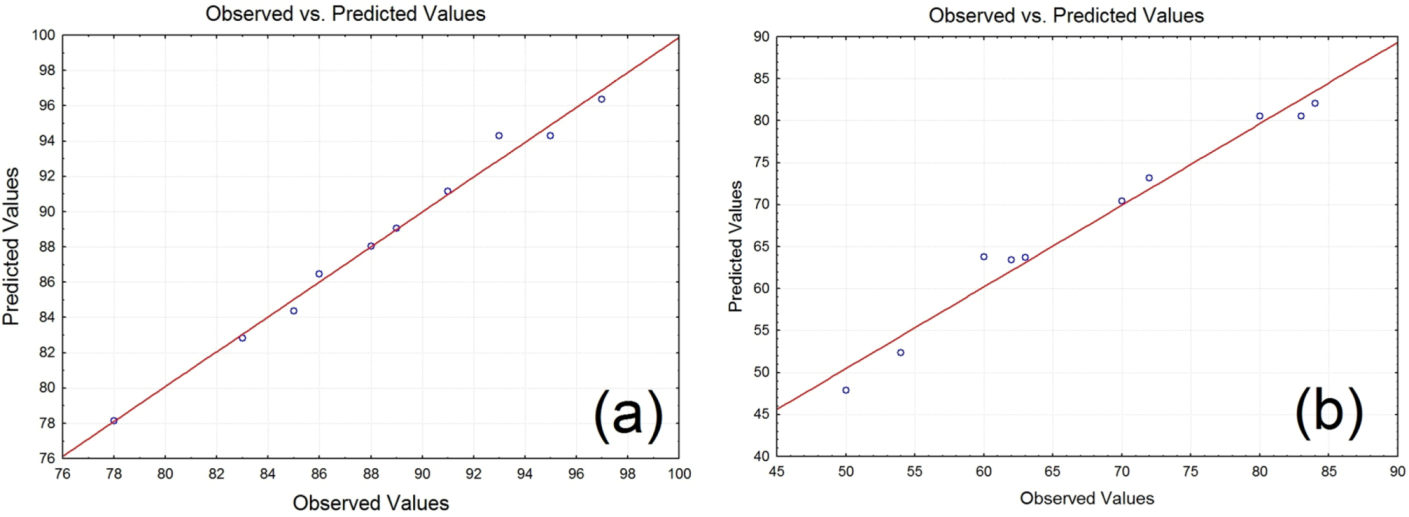
3.3. Statistical Analysis

Response surface methodology was used to determine the relationship between the flocculation process responses (turbidity and COD removals) with the most important variables (hybrid copolymer dosage and wastewater pH). A total of ten experiments was carried out as mentioned before and their results are shown in Table 2. There are several response models that can be derived, such as linear, interactive, quadratic and cubic models. These models may be correlated with the experimental data, but significant selection of the best model is required because the selected model correlates with the experimental data depending on the adequacy of that selected model. Thus, according to the experimental data, the quadratic model was suggested to represent the correlation between experimental data and all responses, because it has the lowest standard deviation and p value, as well as the highest coefficient of determination (R2) , adjusted R2 and predicted R2 values. However, the cubic model was not recommended in this study because it had insufficient points to estimate the coefficients of the model.
Table 2. Experimental variables and results for wastewater flocculation.
Run No.Coded variablesReal variablesResults
DosepHDose (mg/L)pHTurbidity Removal (%)COD Removal (%)
11−115059172
2−115097850
30010079383
4−1−15058354
50−110058970
61015079784
71115098663
80110098562
9−105078860
100010079580

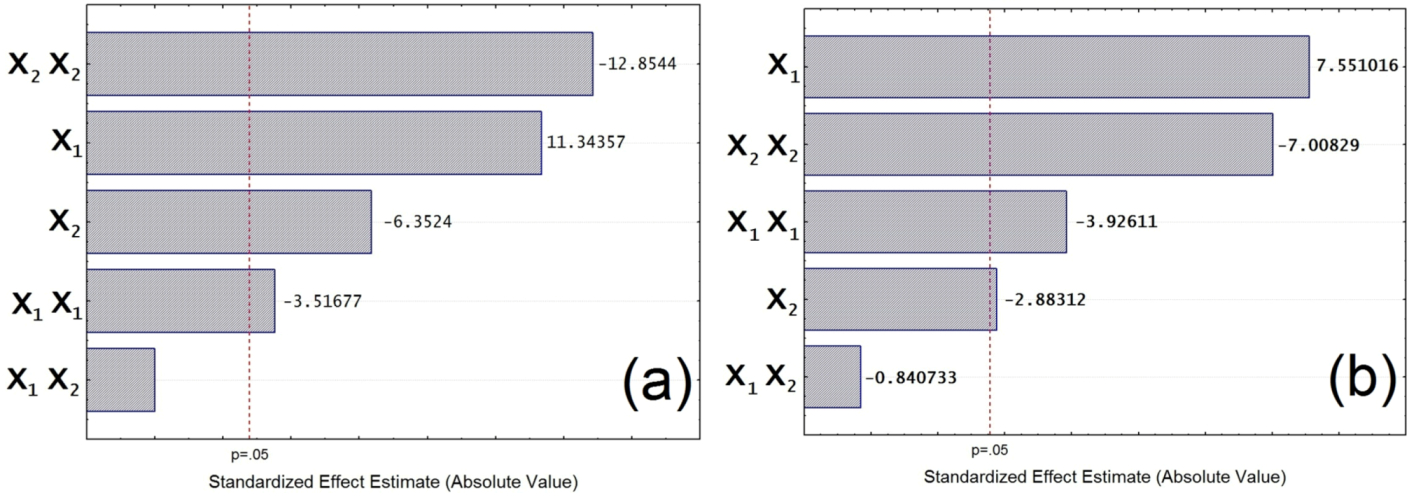
3.4. Analysis of Variance (ANOVA)

Analysis of variance (ANOVA) with an alpha (α) level of 0.05 was employed to determine the statistical significance of all analyses. The final quadratic model for each response in terms of coded levels is shown (Equations 3 and 4) which represent the final quadratic model for the pollutants removal. These equations have some statistically non-significant terms containing the lowest F value. Therefore, it is necessary to eliminate these non-significant terms from the response equations as shown below:
Water 05 00342 i003
Water 05 00342 i004
Table 3 shows the probability (p value) of the quadratic model for turbidity and COD removals that were 0.0005 and 0.0032 respectively. The p value in each pollutant removal model implies that the model is significant.
Table 3. Analysis of variance (ANOVA) results showing the terms in each response quadratic model.
ResponseSourceSum of SquaresdfF valuep valueRemark
Turbidity removalX1104.171128.680.0003significant
X232.67140.350.0031significant
X1X20.00010.001.0000not significant
X1X110.01112.370.0245significant
X2X2133.761165.240.0002significant
COD removalX1504.17157.020.0016significant
X273.5018.310.0449significant
X1X26.2510.710.4478not significant
X1X1136.30115.410.0172significant
X2X2434.30149.120.0022significant
Notes: X1: first variable, dose (mg/L); X2: second variable, pH; df: degree of freedom.
To evaluate the quality of the model developed, the coefficient of determination (R2) was used which gave the proportion of total variance in the response predicted by the model. The closer R2 is to 1, the better the model predicts the response [14]. The coefficient of determination values for turbidity and COD removals were 0.9892 and 0.9726 respectively. This indicates that there is high dependence and correlation between the observed and predicted values of the response [15]. The adjusted R2 for turbidity and COD removals were 0.9758, and 0.9383 respectively, so they are very close to the R2 value in each of the response equations. Thus the predication of experimental data is considered to be satisfactory [16].
As shown in Table 4, the values of adjusted R2 for the pollutants removal models suggested that the total variation was 98% and 97% for turbidity and COD removals respectively. This can be attributed to the independent variables and there is only about 2% and 3% of the total variation respectively that cannot be explained by these models.
Table 4. ANOVA results for response models.
ResponseProbabilityR2Adj. R2Pred. R2Adeq. precisionCV%
Turbidity removal0.00050.98920.97580.946626.1691.02
COD removal0.00320.97260.93830.746914.8594.39
Notes: R2: coefficient of determination; Adj. R2: adjusted R2; Pred. R2 : predicted R2 ; Adeq. precision: Adequate precision; CV: coefficient variation.
The measures of the adequate precision for the response models were 26.169 and 14.859 for the turbidity and COD removal models. These values represent the measures of the signal to noise ratio [17]. A ratio greater than four is desirable. Hence, in this study the adeq. precision values for both the turbidity removal model and the COD removal model were more than four. This indicates the quadratic model equation can be used within the range of factors in the design space. The coefficient of variance (CV), represents the ratio of the standard error of estimate to the mean value of the observed model (represented as %). The model can be normally considered reproducible when its CV value is less than 10% [18]. The low CV values of the models of 1.02% and 4.39% indicate that the precision and reliability of the experiments is good. To judge the suitability of the model, a diagnostic plot i.e., observed vs. predicted values was used (Figure 3). These diagnostic plots provide sufficient agreement between the experimental data and the values obtained from the models for turbidity and COD removals. To understand the effect of each factor on the final response of pollutants removal, Pareto graphics can be used. Pareto graphics have positive and negative bars (Figure 4). The positive bars suggest that by varying the factor the response increases. When it increases the X1, response will also increase. While, the negative bars suggest that by varying the factor the response decreases.
Figure 3. (a) Predicted vs. observed values plot for turbidity removal model; and (b) Predicted vs. observed values plot for COD removal model.
Water 05 00342 g003
Figure 4. (a) Pareto graphics for hybrid copolymer dose and pH for turbidity removal model; and (b) Pareto graphics for hybrid copolymer dose and pH for COD removal model.
Water 05 00342 g004

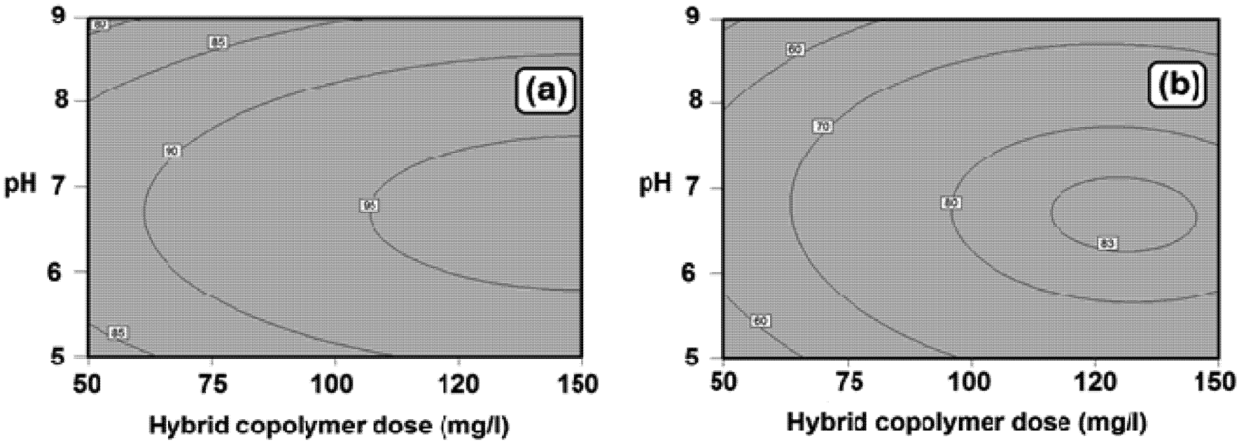
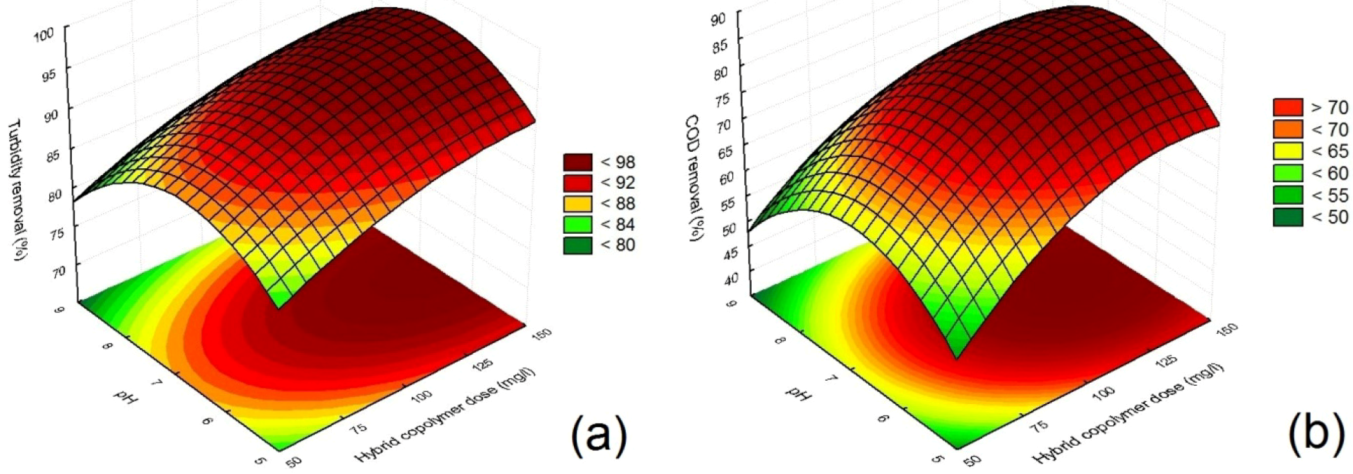
3.5. Analysis of Flocculation Process

The 3D surface plots for each model show the responses of experimental variables and these graphs can be used to identify the major interaction between the variables. The 3D surface plot and contour plot for the turbidity removal model (Figure 5a, Figure 6a), show that a maximum turbidity removal of more than 95% occurs at pH range (6–7.5) with a hybrid copolymer dosage more than 110 mg/L. This maximum removal occurs due to the fact that the hybrid polymer FeCl3-(PVP-g-PAM) becomes ionized, and the ionized Fe3+ can easily neutralize the residual charge on particles and expand the chain on the bridge. It is observed that an increase in pH beyond the maximum range will lead to a decrease in the flocculation process efficiency. This decrease in the removal process is due to the start Fe(OH)3-(PVP-g-PAM) complexes in the alkaline region leading to adsorption of Fe(OH)3-(PVP-g-PAM) onto wastewater particles.
Figure 5. 3D surface plot for (a) turbidity removal; and (b) for COD removal.
Water 05 00342 g005
Figure 6. 2D contour plot for (a) turbidity removal; and (b) for COD removal.
Water 05 00342 g006
The common turbidity removal mechanism ensues by neutralizing the negative charge of particles and the positive charge of metal hydrolysis species followed by the aggregation of destabilized particles. There are other mechanisms for turbidity removal that take place by forming flocs composed of metal hydroxide precipitates accompanied or followed by sweep flocculation of colloidal particles [19].
The 3D surface plot and contour plot for the COD removal model (Figure 5b, Figure 6b), show that the maximum COD removal was 83% in the pH range (6.3–7) with the hybrid copolymer dosage range (120–145 mg/L). As is shown in the figures, high dosage of the hybrid copolymer does not contribute to a noticeable increase in COD removal [20]. This phenomenon is due to the increase of Fe(OH)3-(PVP-g-PAM) complexes that start to form because ferric hydroxide precipitates when alkaline and any increase in Fe3+ ion or OH ion also increases the solubility constant of the ferric hydroxide. The maximum removal of COD is at the pH value when almost all ferric ions are converted into perceptible hydroxide [21]. Beyond that optimum pH value, the COD removal decreases probably due to the increase in solubility of the ferric precipitate.

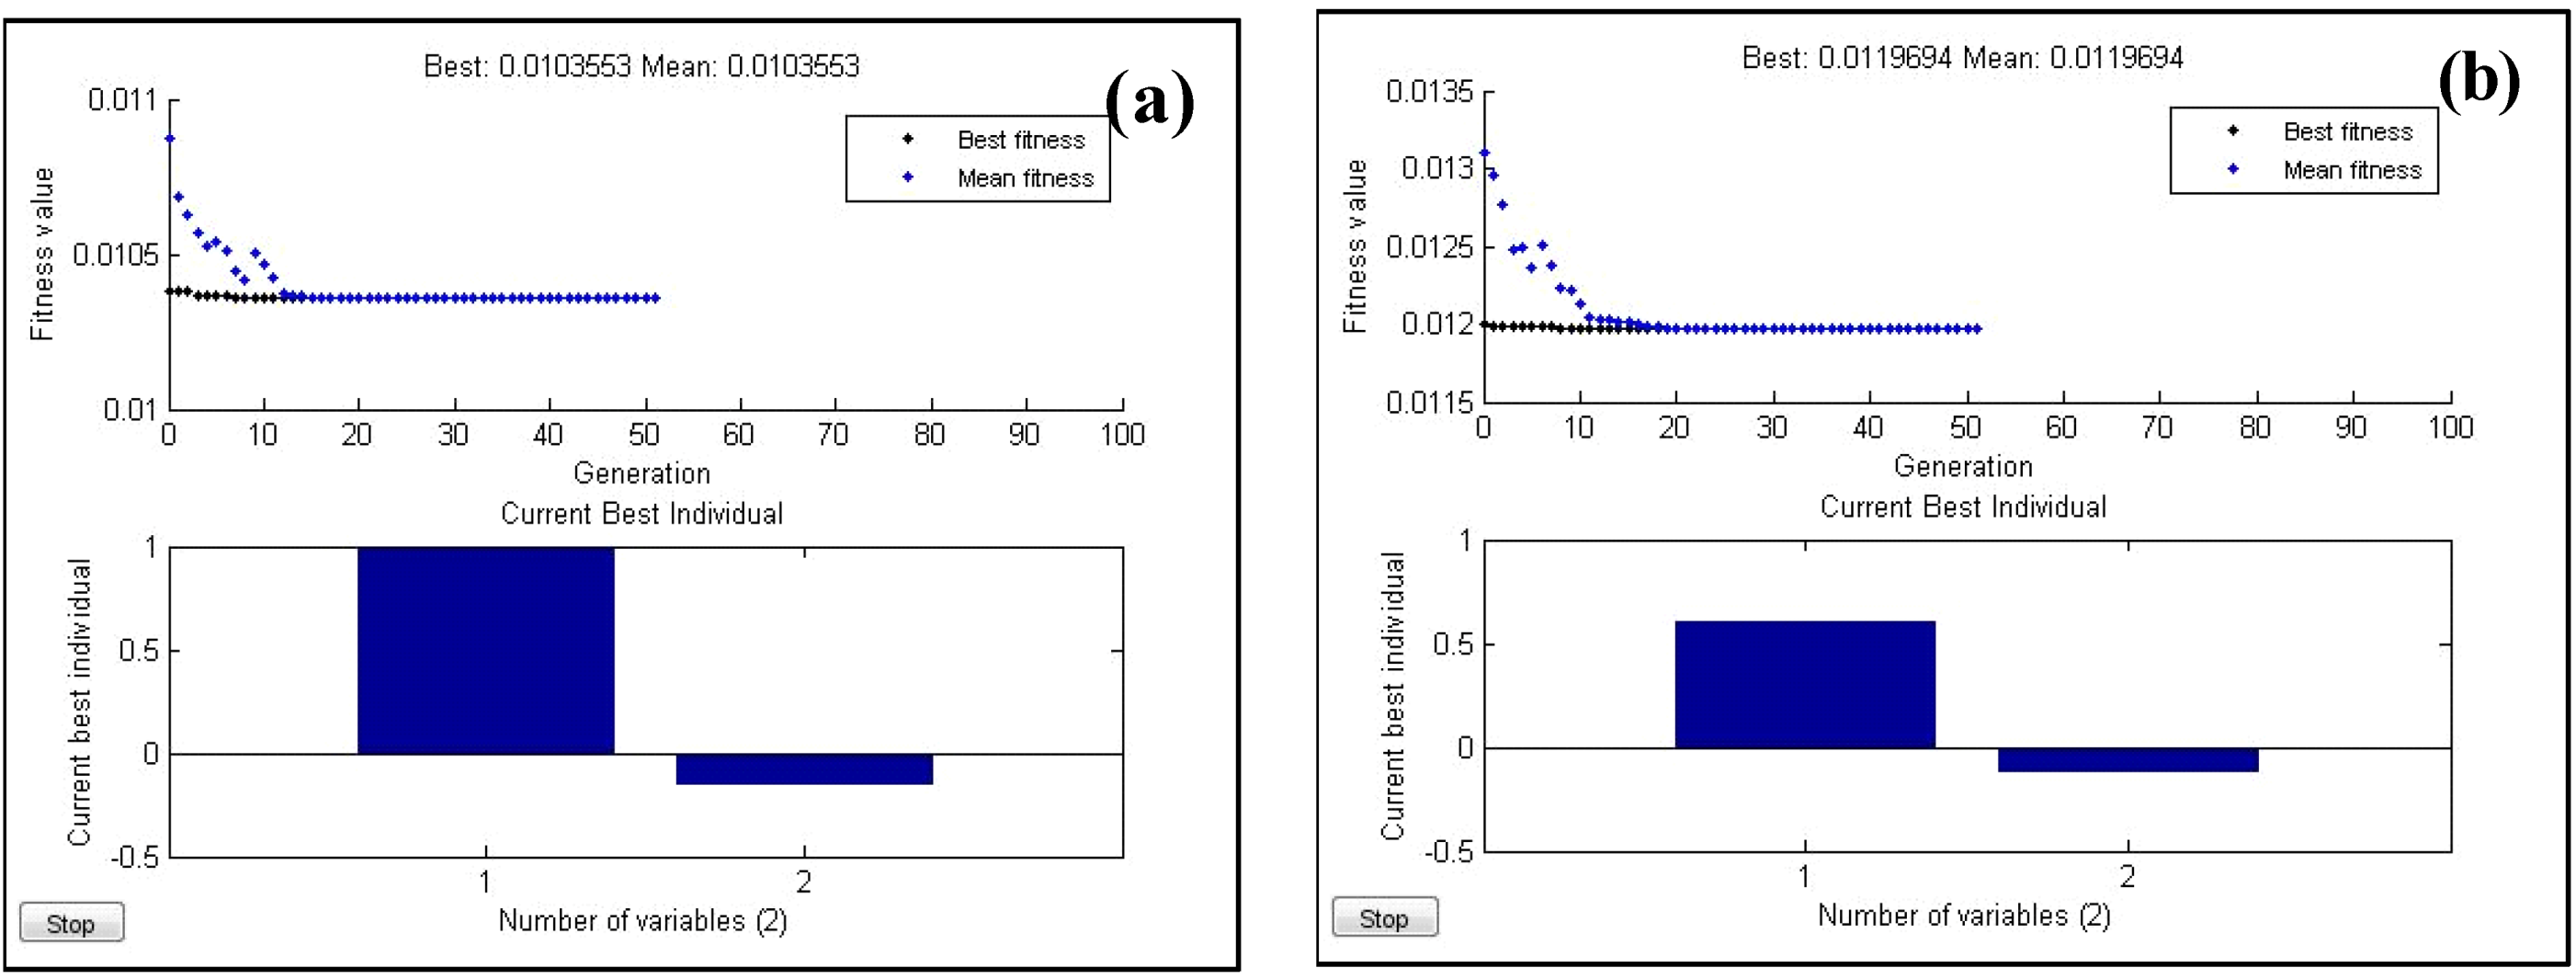
3.6. Optimization Conditions and Verification

The optimal conditions for maximum turbidity and COD removals were determined by the response model obtained from the experimental data. A desirable function was used to find the optimum condition for the two variables, of hybrid copolymer dosage and wastewater pH, in the study of the flocculation process of wastewater. In RSM, the desirability function was set as follows: maximum process removal with the range of hybrid copolymer dosage and within the pH range (5–9). By assay of 39 results of starting points in the optimization of RSM, the best optimum removal efficiency for turbidity and COD removal was 96.4% and 83.5% respectively. This optimum removal was acquired at the desirability function of 0.978 with the design variables as follows: hybrid copolymer dosage of 137 mg/L at wastewater pH 6.68.
Using an optimization technique from the Matlab optimization toolbox, GA was applied to the quadratic equations for turbidity and COD removal models to optimize the variables and responses. The removal optimization can be stated as follows:
  • Find: (Dose and pH)
  • Maximize removal process = f (Dose and pH)
  • Subjected to the constraint: removal process ≤ 100%
  • Parameter ranges: −1 ≤ Dose ≤ +1 and −1 ≤ pH ≤ +1
where −1 is the low level of the factor Dose or factor pH in the quadratic model equations [Equations (3) and (4)]; +1 is the high level of the factor Dose or factor pH in the quadratic model equations (Equations 3 and 4).
Figure 7a shows the results of the optimum coded factors X1 = 1 and X2 = −0.154 in GA optimization for turbidity removal. Based on Table 1, the real value of the coded factor X1 was 150 mg/L while the real value of the coded factor X2 was 6.69. The results of the GA optimization show that the turbidity removal efficiency was 96.56%. Meanwhile, the optimum results of the coded factors in GA optimization for COD removal were X1 = 0.6 and X2 = −0.128 (Figure 7b). Thus, the real value of the coded factor X1 was 130 mg/L and the real value of the coded factor X2 was 6.74. The optimized COD removal efficiency that depends on these optimized factors was 83.54%.
Figure 7. Plot of fitness value vs. generation for the variables in GA optimization for (a) turbidity removal; and (b) COD removal.
Water 05 00342 g007
To select the best optimum removal efficiency with the lowest cost, a comparison of optimization between the desirable function in RSM and the GA results in terms of variables and the optimum removal efficiency is shown in Table 5. It is clear that the final best predicted values were almost the same in both optimization techniques but the optimum dosage of the hybrid copolymer required for the best optimized turbidity removal in GA is more than that in the RSM optimized method. While the optimum dosage of the hybrid copolymer required for achieving the best optimum COD removal according to the GA technique was lower than that required in RSM optimization by the desirable function.
The optimized hybrid copolymer dosage of (137 mg/L) for the best predicted turbidity removal can be contributed to a predication of 96.4% for the turbidity removal according to the desirable function in RSM optimization. Whereas, the optimized hybrid copolymer dosage of (130 mg/L) for best predicted COD removal can be contributed to a predication of 83.54% for COD removal based on GA optimization.
Table 5. Comparison between the desirable function and GA optimization techniques for optimum variables and predication for pollutants removal.
ModelOptimized TechniqueOptimal Dose (mg/L)Optimal pHBest predicted Removal (%)
Turbidity removalDesirable function1376.6896.40
Genetic algorithm1506.6996.56
COD removalDesirable function1376.6883.50
Genetic algorithm1306.7483.54
Finally, three extra experiments were conducted under the optimum condition to confirm the validity of the statistical experimental strategies. The obtained removal results of these three experiments were close to those estimated by using response surface methodology. These validation experiments proved that the developed models could be considered to be accurate and reliable.

4. Conclusions

Physical-chemical methods are fast wastewater treatment processes. One such physical-chemical method is flocculation in which many types of commercial and conventional flocculants can be used. In this study, a new hybrid copolymer was synthesized, characterized and employed in wastewater treatment. The novel hybrid copolymer was accomplished by focusing on the influence of two important operating variables: hybrid copolymer dosage and wastewater pH. The experiments of the flocculation process were utilized by RSM. The results were arrived at by applying RSM modeling that had been verified by conducting analysis of variance (ANOVA). The effects of both hybrid copolymer dosage and wastewater pH on the optimal operational conditions are discussed according to the desirable function and GA optimization techniques. Under these optimized conditions, the removal efficiencies according to RSM optimization using the desirable function were 96.4% and 83.5% for turbidity and COD removal models respectively. The optimized desirability function was 0.978. GA optimization established the best prediction of 96.56% for turbidity removal and 83.54% for COD removal.

Acknowledgments

The financial support for this work from China University of Geosciences (Wuhan, China) is gratefully acknowledged.

References

  1. Wang, J.P.; Chen, Y.Z.; Ge, X.W.; Yu, H.Q. Optimization of coagulation–flocculation process for a paper-recycling wastewater treatment using response surface methodology. Colloid. Surf. A 2007, 302, 204–210. [Google Scholar] [CrossRef]
  2. Zheng, H.; Zhu, G.; Jiang, S.; Tshukudu, T.; Xiang, X.; Zhang, P.; He, Q. Investigations of coagulation–flocculation process by performance optimization, model prediction and fractal structure of flocs. Desalination 2011, 269, 148–156. [Google Scholar] [CrossRef]
  3. Devi, R.; Dahiya, R. COD and BOD removal from domestic wastewater generated in decentralised sectors. Bioresour. Technol. 2008, 99, 344–349. [Google Scholar] [CrossRef]
  4. Duan, J.; Gregory, J. Coagulation by hydrolysing metal salts. Adv. Colloid Interface Sci. 2003, 100, 475–502. [Google Scholar] [CrossRef]
  5. Lee, K.E.; Teng, T.T.; Morad, N.; Poh, B.T.; Mahalingam, M. Flocculation activity of novel ferric chloride–polyacrylamide (FeCl3-PAM) hybrid polymer. Desalination 2011, 266, 108–113. [Google Scholar] [CrossRef]
  6. Yang, W.; Qian, J.; Shen, Z. A novel flocculant of Al(OH)3-polyacrylamide ionic hybrid. J. Colloid Interface Sci. 2004, 273, 400–405. [Google Scholar] [CrossRef]
  7. Tang, H.; Shi, B. The characteristics of composite flocculants synthesized with inorganic polyaluminium and organic polymers. In Chemical Water and Wastewater Treatment VII, Proceedings of the 10th Gothenburg symposium 2002, Gothenburg, Sweden, June 17–19, 2002; IWA Publishing: London, UK, 2002; pp. 17–28. [Google Scholar]
  8. Kasiri, M.; Khataee, A. Photooxidative decolorization of two organic dyes with different chemical structures by UV/H2O2 process: Experimental design. Desalination 2011, 270, 151–159. [Google Scholar] [CrossRef]
  9. Omar, F.M.; Rahman, N.N.N.A.; Ahmad, A. COD reduction in semiconductor wastewater by natural and commercialized coagulants using response surface methodology. Water Air Soil Poll. 2008, 195, 345–352. [Google Scholar] [CrossRef]
  10. Woon, S.; Querin, O.; Steven, G. Structural application of a shape optimization method based on a genetic algorithm. Struct. Multidiscip. Opitm. 2001, 22, 57–64. [Google Scholar] [CrossRef]
  11. Mason, R.L.; Gunst, R.F.; Hess, J.L. Statistical Design and Analysis of Experiments: With Applications to Engineering and Science; Wiley-Interscience: Hoboken, NJ, USA, 2003; Volume 356752. [Google Scholar]
  12. Yang, Y.; Li, Y.; Zhang, Y.; Liang, D. Applying hybrid coagulants and polyacrylamide flocculants in the treatment of high-phosphorus hematite flotation wastewater (HHFW): Optimization through response surface methodology. Sep. Purif. Technol. 2010, 76, 72–78. [Google Scholar] [CrossRef]
  13. Pretsch, E.; Bühlmann, P.; Badertscher, M. Structure Determination of Organic Compounds: Tables of Spectral Data; Springer: Berlin, Germany, 2009. [Google Scholar]
  14. Ghafari, S.; Aziz, H.A.; Isa, M.H.; Zinatizadeh, A.A. Application of response surface methodology (RSM) to optimize coagulation–flocculation treatment of leachate using poly-aluminum chloride (PAC) and alum. J. Hazard. Mater. 2009, 163, 650–656. [Google Scholar] [CrossRef]
  15. Sharma, P.; Singh, L.; Dilbaghi, N. Optimization of process variables for decolorization of Disperse Yellow 211 by Bacillus subtilis using Box–Behnken design. J. Hazard. Mater. 2009, 164, 1024–1029. [Google Scholar] [CrossRef]
  16. Wantala, K.; Khongkasem, E.; Khlongkarnpanich, N.; Sthiannopkao, S.; Kim, K.W. Optimization of As(V) adsorption on Fe-RH-MCM-41-immobilized GAC using Box-Behnken design: Effects of pH, loadings, and initial concentrations. Appl. Geochem. 2011, 5, 1027–1034. [Google Scholar]
  17. Tripathi, P.; Srivastava, V.C.; Kumar, A. Optimization of an azo dye batch adsorption parameters using Box–Behnken design. Desalination 2009, 249, 1273–1279. [Google Scholar] [CrossRef]
  18. Ahmadi, M.; Vahabzadeh, F.; Bonakdarpour, B.; Mofarrah, E.; Mehranian, M. Application of the central composite design and response surface methodology to the advanced treatment of olive oil processing wastewater using Fenton’s peroxidation. J. Hazard. Mater. 2005, 123, 187–195. [Google Scholar] [CrossRef]
  19. Trinh, T.K.; Kang, L.S. Response surface methodological approach to optimize the coagulation–flocculation process in drinking water treatment. Chem. Eng. Res. Design 2011, 89, 1126–1135. [Google Scholar] [CrossRef]
  20. Stephenson, R.J.; Duff, S.J.B. Coagulation and precipitation of a mechanical pulping effluent—I. Removal of carbon, colour and turbidity. Water Res. 1996, 30, 781–792. [Google Scholar]
  21. Tan, B.H.; Teng, T.T.; Omar, A. Removal of dyes and industrial dye wastes by magnesium chloride. Water Res. 2000, 34, 597–601. [Google Scholar] [CrossRef]

