Article

Quantitative Assessment of Water Use Efficiency in Urban and Domestic Buildings

by
Thorsten Schuetze
1,* and
Vicente Santiago-Fandiño
2
1
Department of Architecture, Sungkyunkwan University, 2066 Seobu-ro Jangan-gu, Suwon-si, Gyeonggi-do 440-746, Korea
2
El Curbiellu 28, Peón 33314, Villaviciosa-Asturias, Spain
*
Author to whom correspondence should be addressed.
Water 2013, 5(3), 1172-1193; https://doi.org/10.3390/w5031172
Submission received: 22 May 2013 / Revised: 20 July 2013 / Accepted: 22 July 2013 / Published: 6 August 2013

Abstract

:
This paper discusses the potential of water savings at property, household and urban levels, through the application of environmentally sound technologies (ESTs), as well as their quantification using the software Wise Water. Household centered measures are identified that allow for significant reduction of drinking water consumption with comparatively small effort, and without limitation of comfort. Furthermore, a method for the estimation of water recycling, for rainwater harvesting and for the utilization potential as locally available renewable freshwater is presented. Based on this study, the average drinking water consumption in urban households of industrialized countries could be reduced by approximately one third, without significant investment costs, either within the framework of new constructions or by the remodeling of water and sanitation systems in residential buildings. By using a secondary water quality, the drinking water demand could even be reduced by 50%. In the case of an area-wide application, the overall fresh water demand of cities and the exploitation of fresh water resources could be significantly reduced. Due to the comparability of the domestic water use of the investigated households, the findings are internationally transferable, for example to countries in Europe, Asia, and also the USA.

1. Introduction

Many of the world’s cities are expected to face fresh water shortages in the future due to a growing population and the related rise in water consumption as well as the decline in renewable freshwater resources caused by the effects of climate change. The urban and domestic domain contributes significantly to the exploitation of global fresh water resources. Particularly in cities, households contribute to the greatest part of drinking water consumption. Households, therefore, have a significant impact on the natural water balance, the overexploitation of renewable freshwater resources and the watersheds of their hinterlands. In the United States of America, for example, the public water supply is responsible for 21% of freshwater withdrawal [1], and private households consume more than 50% of the public water supply [2]. In the Netherlands, this percentage is 66% [3], and in Seoul, the capital of South Korea, public households are responsible for approximately 70% of the public water supply [4].
Due to multiple factors, such as climate change and population growth, particularly in urban areas, it is expected that in general water stress will increase significantly worldwide by the middle of this century, particularly in Africa, Asia, Australia, New Zealand, and Southern Europe, as well as in Latin and North America [5]. Since the 1970s, it has been demonstrated that good water management is possible, financially feasible, and practicable within urban low-income areas when considering the use and applications as well as the approaches of appropriate technologies that are known today as Environmentally Sound Technologies (ESTs). However, the improvement of local governance is also crucial to improve overall water management to further bring benefits to low-income groups [6]. The awareness of policy and decision makers regarding efficient water use by means of applying ESTs in the urban and domestic environment is crucial to reduce freshwater demands, while at the same time it is important to provide access to clean drinking water and proper sanitation [7].
The objective of this paper is to discuss water savings and their quantification at the property, household and urban levels through the application of ESTs; likewise it also discusses the importance of the provision of alternative renewable water sources to increase or complement the water supply while reducing the water footprint.

2. Methodology

This paper discusses the results from the authors’ own investigation into the identification and application of ESTs for water use efficiency in the domestic environment (household and property level), while also taking into consideration the water cycle. Based on this research, and the analysis of published research findings, policies as well as criteria for the selection of ESTs, and a comprehensive number of technology fact sheets were developed. Different sections of the water cycle considered include, for example, efficient water supply and water use, safe disposal of used water, water storage and reuse, as well as the augmentation of freshwater bodies. Based on the research findings, an Excel-based model entitled “Wise Water” [8] was designed to assist users in analyzing the application potential of different ESTs at household and property levels, considering water demand, water consumption, water saving, water supply, as well as the use of alternative water resources such as recycled wastewater and rainwater.
Insights from case studies, mainly based on the efficient use of drinking water as well as on the separation of sewage streams with different properties, decentralized purification and reuse, were assessed to prove their applicability and efficiency. Data on average water consumption and user behavior were applied to calculate savings in domestic drinking water consumption.
The fact that water use at the household level depends on the type of applications and user behavior is important, but the quantitative assessment of water use efficiency in this paper is based on the assumption that the application of specific technologies for efficient water use does not influence user behavior, insofar as that the operation of water saving technologies is comfortable and the quality of water use is similar to conventional technologies for water use. In light of this, rebound effects do not occur, since they are caused by approaches causing less satisfying water use experiences.

3. Results and Discussion

Cities around the world have different water demands due to a variety of reasons, including availability, costumes, technologies, use purpose, etc. For example in Seoul (South Korea) the average domestic drinking water consumption (without pipeline losses of the public supply network) is 208 L per person per day [9], while it is 117 L in the city of Hamburg in Germany [10]. Dutch households in general have a slightly higher water demand than Hamburg (of 127.5 L per capita per day). A domestic level analysis for the Netherlands, City of Seoul in Korea, and the city of Hamburg in Germany is presented in Table 1. From this table it can be seen that in the Netherlands, Hamburg and Seoul, the water use of applications for which drinking water is required accounts for a percentage of only 50% to 55%, approximately, of the total water consumption. This is independent of the total average water consumption of households. Therefore, the drinking water demand of households could be reduced by 45%–50% if, for example, other sources of water were provided, i.e., secondary water quality, such as rainwater or recycled wastewater. Nonetheless, the total freshwater consumption would remain the same.
Table 1. Domestic water use for different applications in the Netherlands [11], Hamburg (Germany) [10], and Seoul (South Korea) [9], in L per capita per day, and percentages of total water consumption.
Country/CityDomestic water consumption in L per capita per day (high quality standards)Service water quality sufficient (low water quality standards)TotalService water sufficientDrinking water required
PurposeCooking and drinkingWashing (kitchen)Bath and showerLaundryCleaning and wateringToilet flushing
The Netherlands8.8 L6.8 L52.3 L17.2 L5.3 L37.1 L127.5 L59.6 L67.9 L
% of total6.9%5.3%41.0%13.5%4.2%29.1%100.0%46.7%53.3%
Hamburg (Germany)5 L8 L46 L15 L8 L35 L117 L58 L59 L
% of total4.3%6.8%39.3%12.8%6.8%29.9%100.0%49.6%50.4%
Seoul (South Korea)12 L22 L80 L20 L8 L66 L208 L94 L114 L
% of total5.8%10.6%38.5%9.6%3.8%31.7%100.0%45.2%54.8%
It is important to note that it is possible to keep the same water demand without increasing the water footprint by means of tapping other water sources, like rainwater harvesting and service water (greywater recycled). This approach is already being experienced in the Netherlands, South Korea (Soul) and Germany (Hamburg).

3.1. ESTs and Domestic Water Use
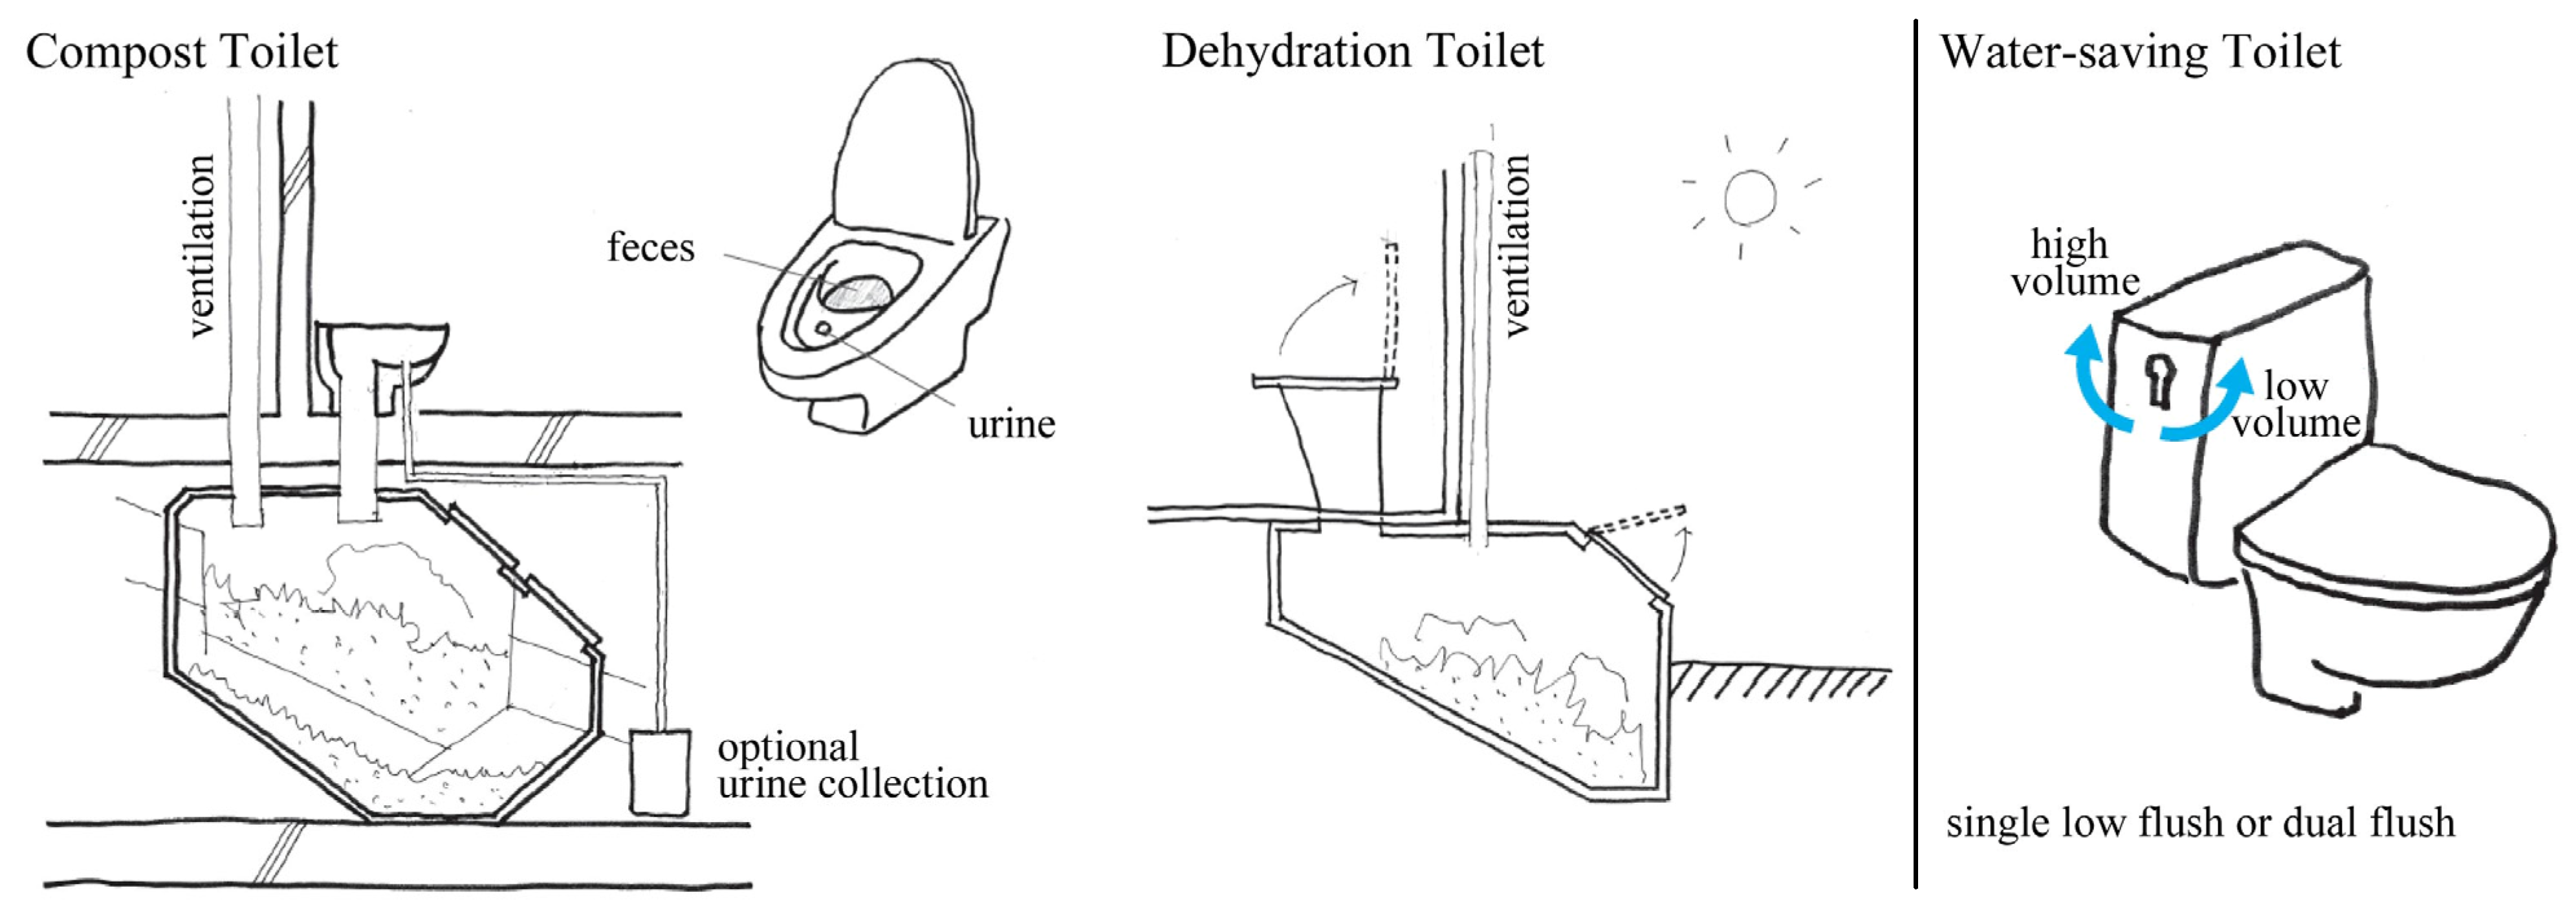
As already stated in the introduction, domestic water demand can be reduced by applying ESTs and also by changing user behavior, which in turn will reduce the water footprint of households and properties, as water use efficiency will ensue.
ESTs consider a variety of tools and approaches that can be applied at a household level, such as toilets, redesigned taps, nozzles with specific flow rates (L/min) as well as water efficient appliances such as dishwaters and washing machines with reduced water consumptions, which can significantly contribute to large water savings. Some examples for such ESTs are provided in the following subsections.

3.1.1. Toilets

A large variety of water saving toilets exists, ranging from low water flushing volume, to waterless or dry toilets. Of the latter, a variety also exists ranging from those with temporary storage of excreta in the toilet to enhanced toilet systems with on site storage and treatment (fermentation or composting) of excreta. Simple dry toilet systems can be easily installed in existing buildings and households, but require regular maintenance and manual transport of excreta.
The installation of enhanced dry toilets has to be considered during the early design and planning process of buildings and requires more space for the transport, storage and processing of excreta than is required for toilet systems that use water as a transport medium for excreta. Therefore, flush toilets (or Water Closets–WC) are installed in most areas and buildings that are equipped with a centralized water supply [4,7].
The amount of water used for the flushing of toilets on the other hand is responsible for almost a third of the total water consumption in standard households (Table 1); nevertheless, their consumption can be reduced by the application of low-volume toilets (Figure 1), available with volumes of 6 L, 4 L, or with even only 1 L of water per full flush.
Figure 1. Illustration of different waterless toilet types (left), and a water-saving toilet with options for design and operation (right).
Water 05 01172 g001
The cleaning efficiency of different toilet types that are available on the market is independent of their flush volume [12]. Their design and utilization is quite similar to high-volume toilets, which generally require 10 L or more per full flush. Accordingly, the water consumption for toilet flush could be reduced by 40% to more than 90%, by the application of low flush toilets, which is equivalent to approximately 10% to 30% of the total water consumption in households.
Furthermore, toilets can be differentiated into three basic types: gravity tank, flushometer, and vacuum toilets. The flush of gravity tank toilets is based on the gravity flow of water, while flushometer toilets require pressure in the mains. In both systems, the transport of feces is provided by gravity flow in sewer pipelines after flushing. Flushing of vacuum toilets with a flush volume of 1 L of water and less is provided by a vacuum, which is generated in a vacuum station at the end of the vacuum sewer pipeline.
Low-volume non-vacuum toilets are also available with dual flush devices or early closure devices, which facilitate additional water savings by the opportunity to select smaller flush volumes for liquids (urine) as an alternative to the full flush for solids (feces). Dual flush devices are also available for the retrofitting of high-volume toilets. Most low-volume toilets that are available work on the gravity tank principle, and their price and installation costs are in the range of conventional toilets and are relatively low compared to those of vacuum toilets and the required technology.
If the cities of Hamburg and Seoul were equipped with gravity tank dual flush toilets, which require 3 L water for the big flush and 2 L for the small flush, the total water consumption could be reduced by approximately 33% or one third compared with standard households (according to Table 1) [4].
Leakage control and the adjustment of retrofitting devices to the flush properties of existing low-volume toilets are crucial for a real reduction of water consumption [7]. Leaking retrofit devices or bad flush properties require multiple flushes to clean the toilet bowl, therefore the average water consumption could be even higher after a retrofitting process than it was before [13].

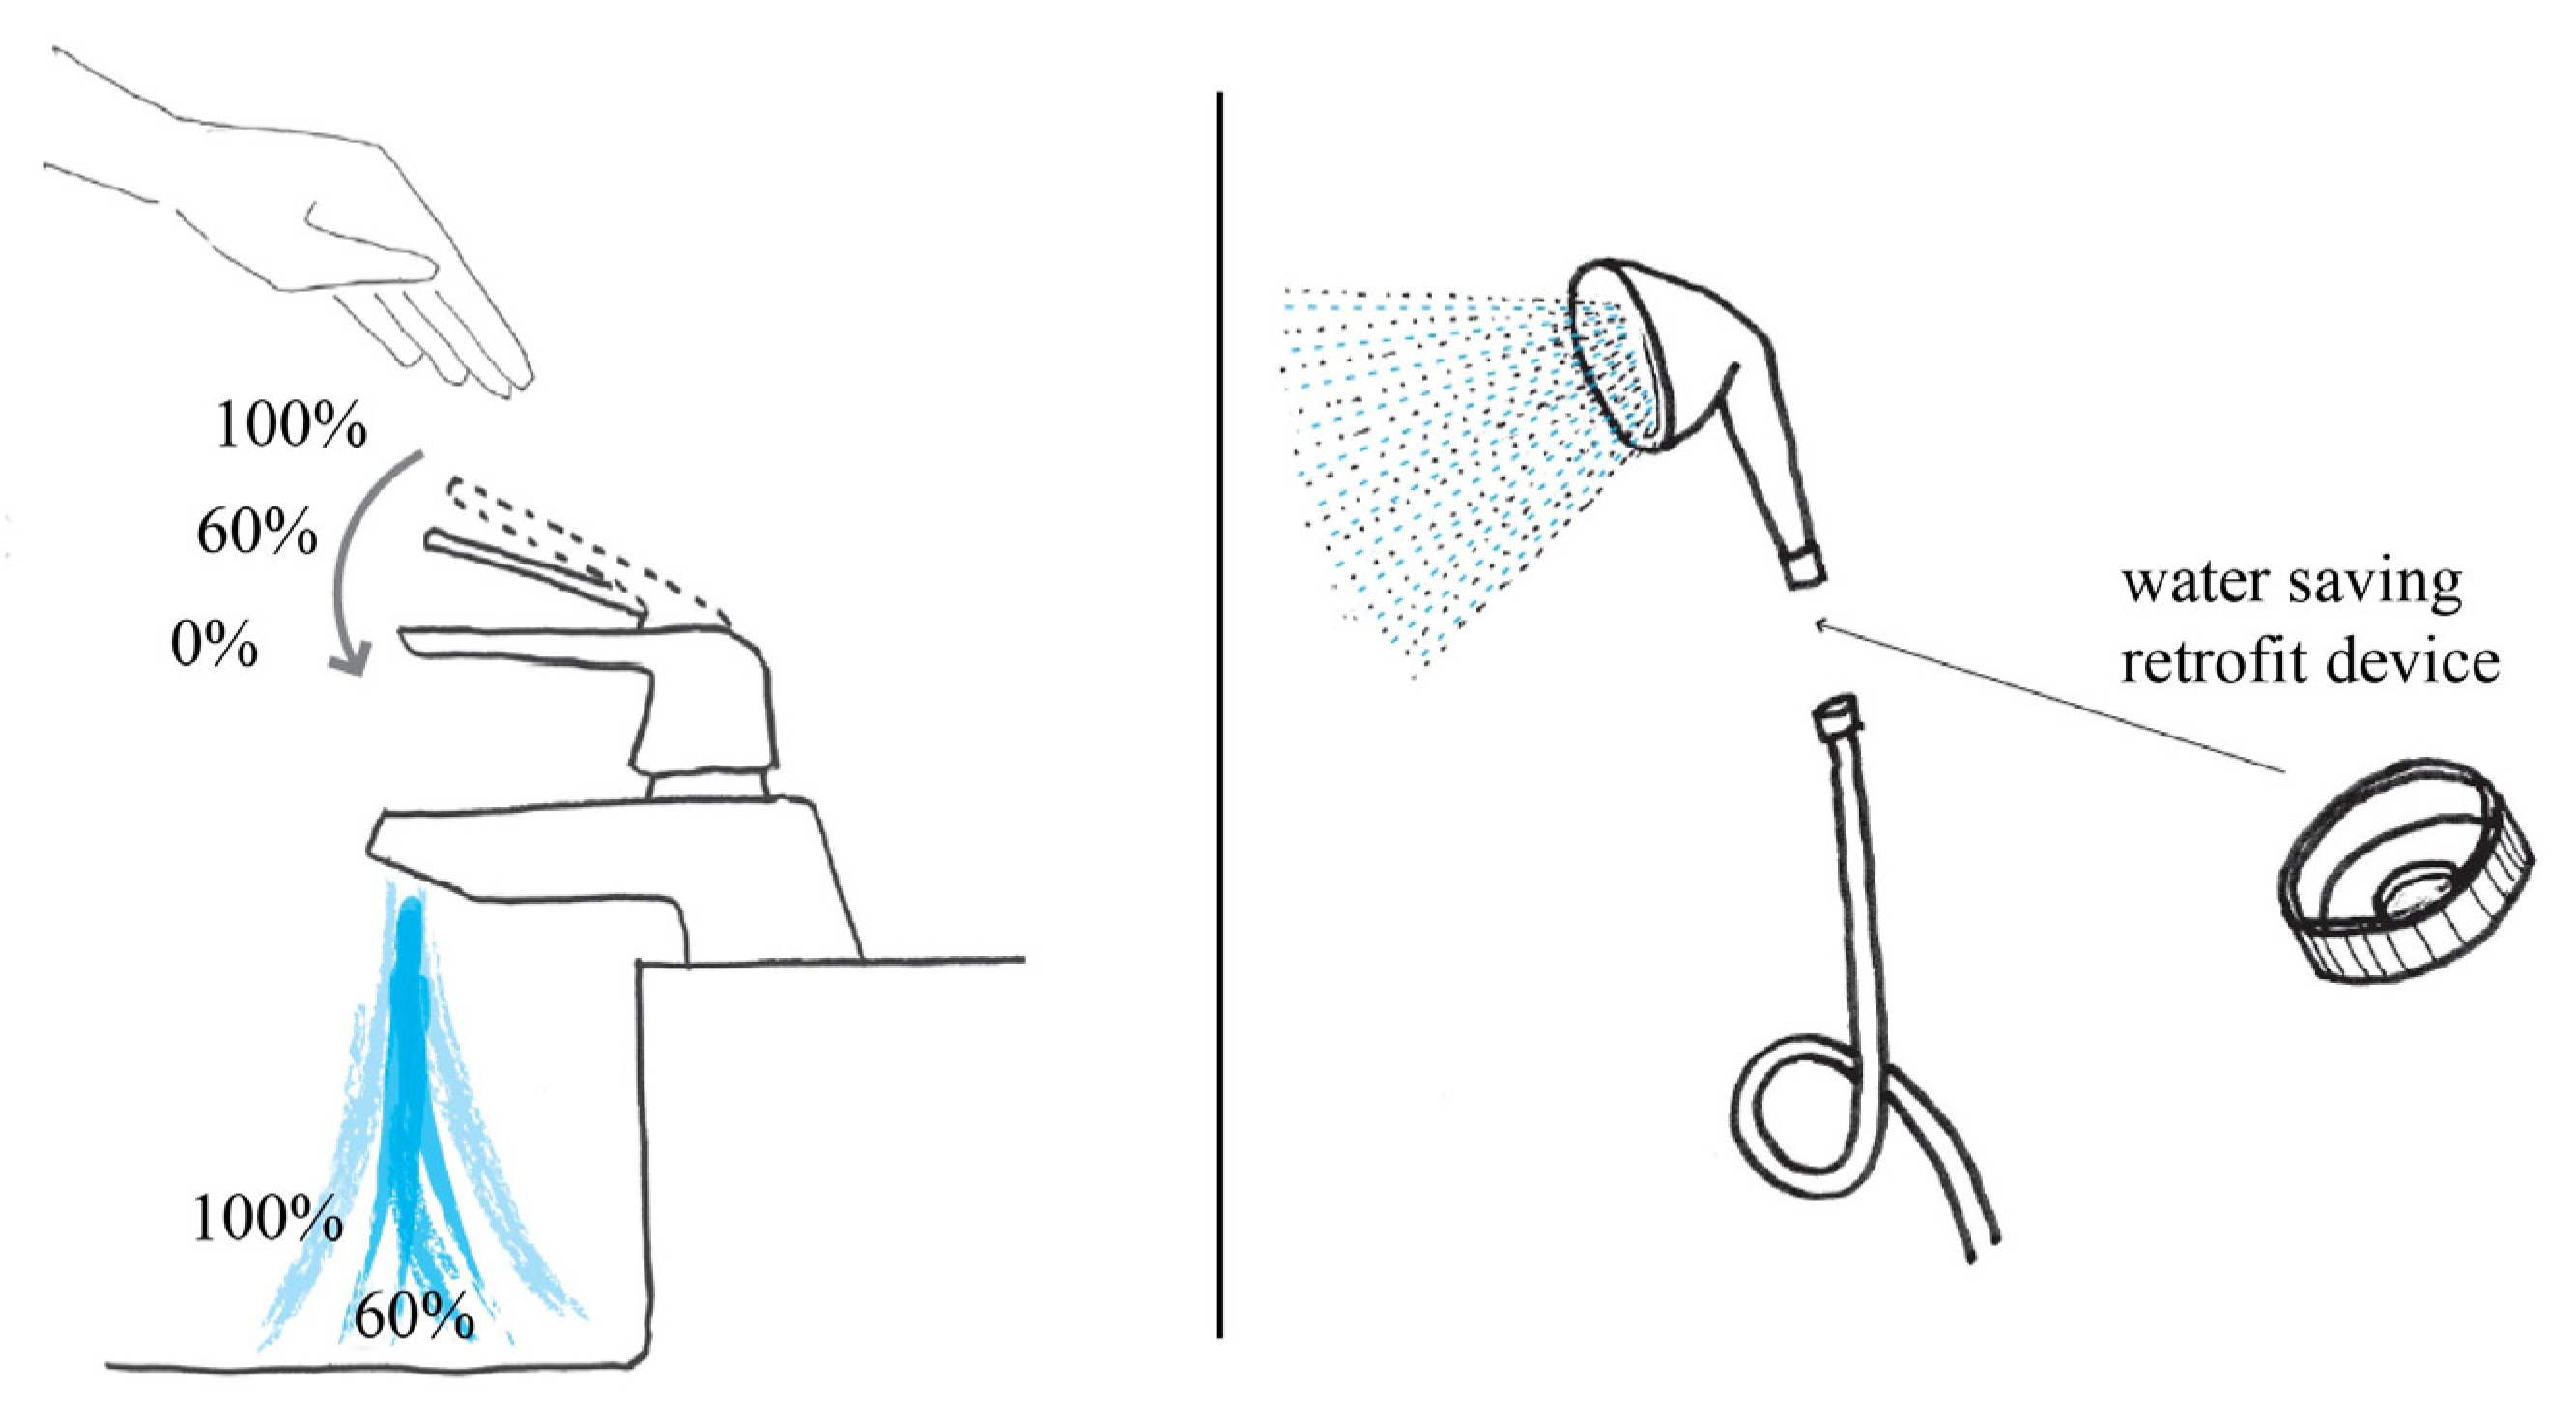
3.1.2. Taps and Showerheads

The use of water-saving taps and showerheads (Figure 2, [7]) facilitates significant water savings, because in standard households more than 50% of the total domestic water is consumed via these interfaces. The quantity of actual savings is dependent on various factors, such as the water pressure and the type and flow rate of standard taps as well as the purpose of water consumption. Dripping and/or leaking taps are common sources for water wastage in many households due to the huge amount of water loss by continuous and uncontrolled flows.
Low-volume taps for applications in kitchens and bathrooms are available in many different designs and approaches. Flow rate delimiter taps, for example, are based on an elastic O-ring that is placed in a disc and controlled by pressure. Such an O-ring flattens and reduces the water flow under high pressure, while it bends and allows higher flow under lower pressure. The installation of water-saving taps, showerheads and/or retrofit devices requires neither plumbing experience, nor maintenance. Such devices allow significant water saving, while still offering convenient water use [7].
Based on experience with the application of water saving taps and showerheads, an average flow rate of 10 L/min can be achieved in water saving households (conventional taps have flow rates of approx. 14 L/min [7]). Taps and showerheads with lower flow rates of 8, 6 or even fewer L/min can also be designed. However, an average flow rate of 10 L/min is an appropriate basis for the dimensioning of water systems and the calculation of realistic savings, although this figure can also be referred to when less than fully satisfactory realization of water saving measures are considered [4].
Figure 2. Examples of a water-saving tap with a ‘water brake’ and two flow rates (left); and a water-saving showerhead with a retrofitting device, which can be inserted in the fitting between the showerhead and hose (right).
Water 05 01172 g002
The reduction of the minimum average flow rate via taps and showerheads from 14 to 10 L/min is similar to a reduced water consumption of approximately 29%. More than 50% of the domestic water consumption happens via these interfaces, but a reduction can only be achieved for uses such as washing (kitchen) as well as bath and shower (bathroom), which are responsible for at least 46% of the total domestic water consumption (see Table 1). Accordingly, the total domestic water consumption can be reduced by approximately 13% with minimal effort, even in existing households. Based on the above applications, i.e., water saving toilets, taps and showerheads, a net saving of between 23% and 43% of the total domestic water consumption is achievable.
Last but not least, the reduction of water flow rates to a specific maximum in L/min, and independently from varying water pressure, can only be achieved by flow rate delimiters (or flow-control devices) that can be placed in tap or showerheads for the regulation of flow rates, from 1.7 L/min upwards, in steps of 0.5 to 1 L/min. An alternative to reduce water consumption is the tap “water brake” system (Figure 2); this type of tap is the best option when variable flow rates are required, like the withdrawal of much water in a short period (e.g., for filling a pot with water for cooking), but also continuous water saving flows (e.g., for washing and rinsing under a steady stream of water). For applications not requiring multiple flow rates, water saving tap (retrofit) devices can be screwed onto the heads of taps to decrease flows [7].

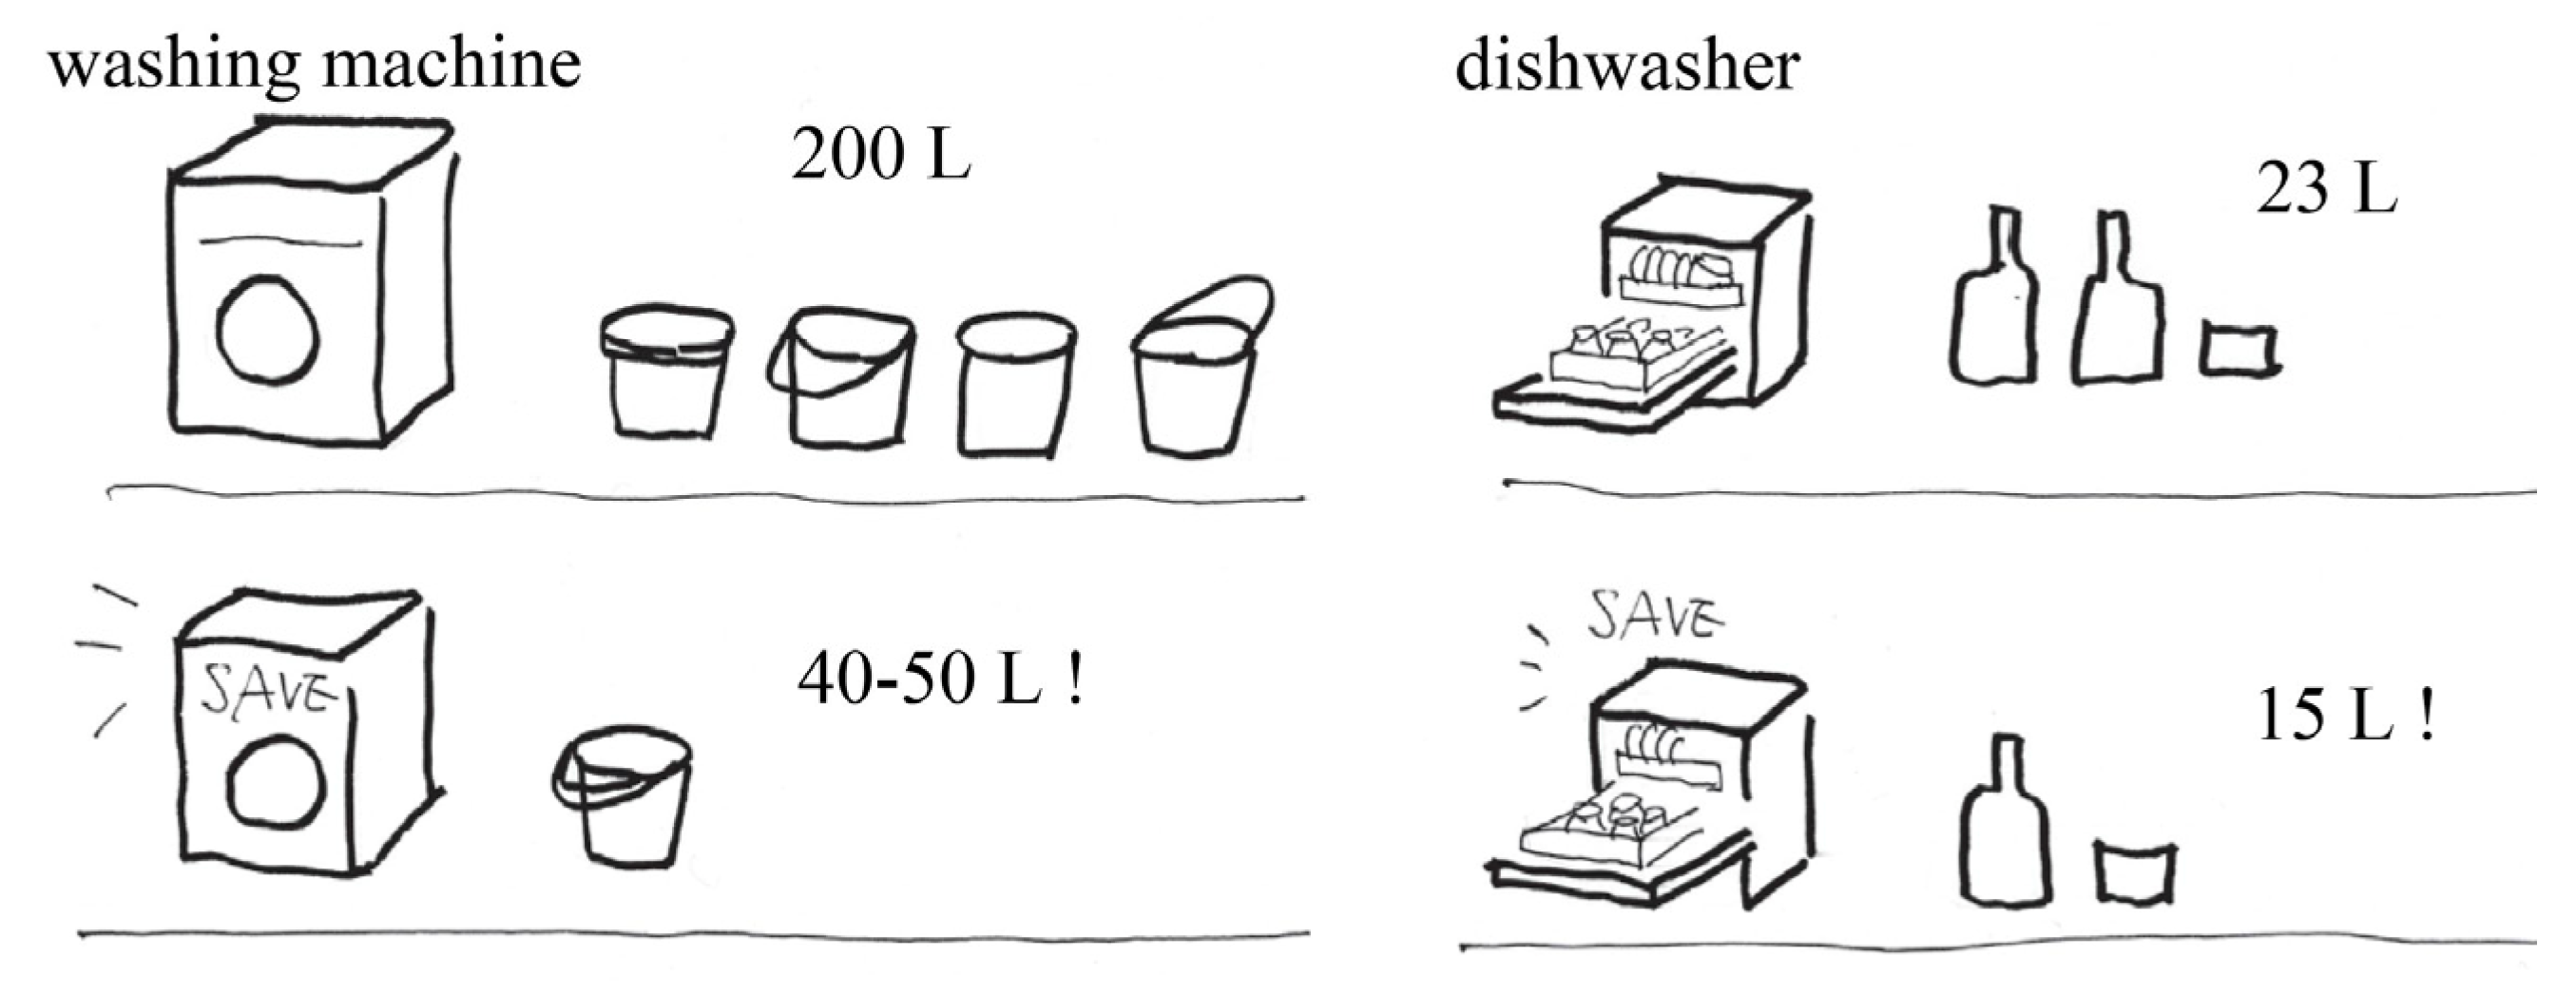
3.1.3. Household Appliances

The application of water saving household appliances, such as washing machines and dishwashers, can also contribute to efficient water use (Figure 3, [7]). The water consumption of specific technologies and models can differ significantly. The latest water saving washing machines need only between 40 and 50 L per wash compared to the old ones, which may use up to 200 L. On the other hand, dishwashers can use a range of less than 23 L per load to 15 L or even less than 10 L per wash. Minor savings in domestic water consumption can also be achieved by economized water use for cleaning, which includes the washing of clothes and cleaning of households and building components. The required amount of water is dependent on cultural and religious traditions [7].
Figure 3. Water consumption of conventional household appliances (top), compared to that of water saving household appliances (bottom).
Water 05 01172 g003

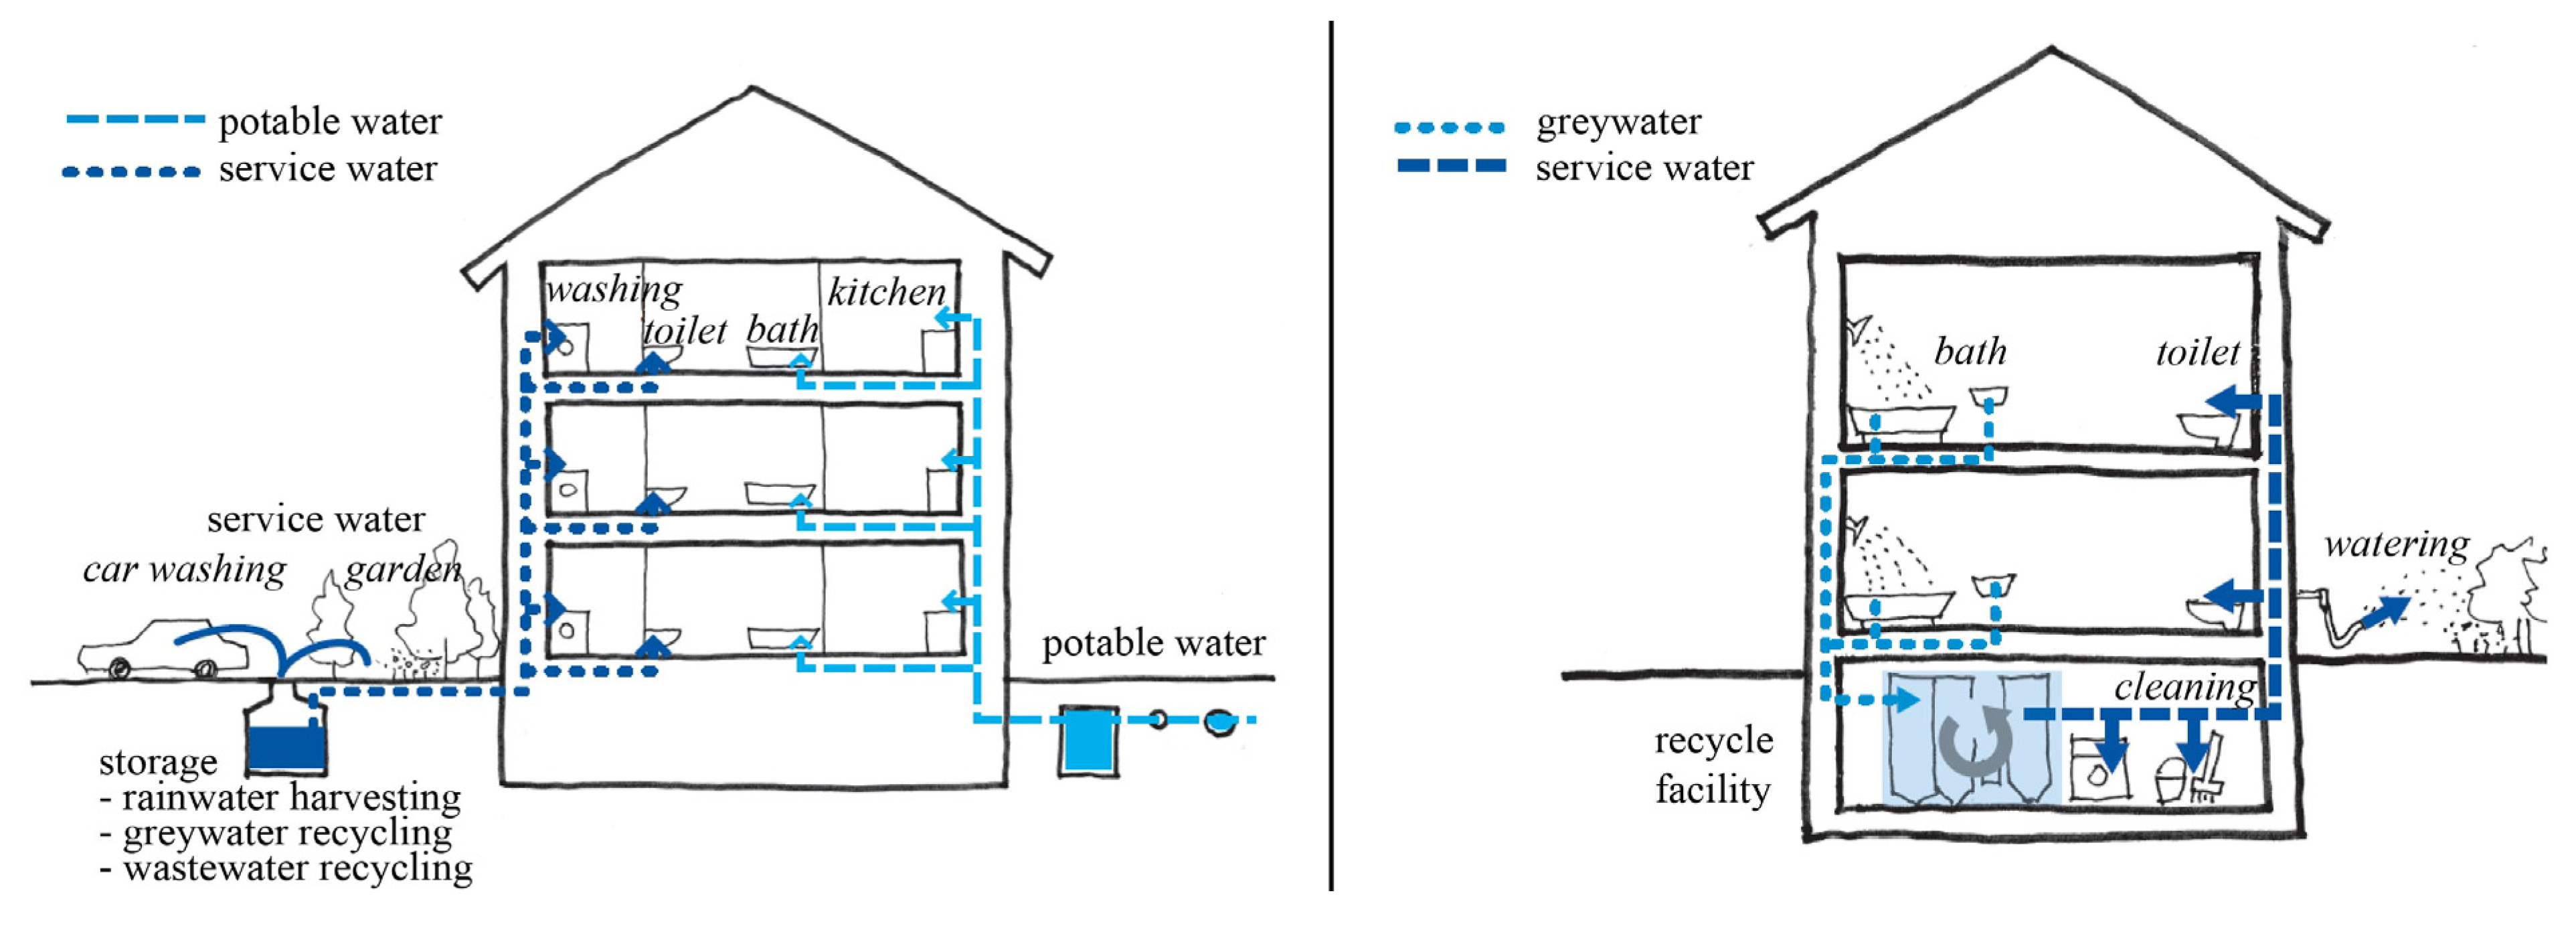
3.1.4. Alternative Water Resources for Increasing Water Availability

In addition to efficient water use, the total drinking water consumption in domestic environments can be further reduced by the use of alternative water sources, such as rainwater through harvesting, and service water through recycling, which in turn will also reduce the water footprint. These options are meant for applications that neither need nor require drinking water quality.
Rainwater harvesting and utilization is practiced worldwide. Its application is encouraged and supported in Japan [14], Australia, and Germany [15], Canada, and the USA [16], as well as in the Republic of Korea [17], and Taiwan [18]. In the Belgian province of Flanders, the installation of rainwater harvesting and utilization facilities is even mandatory for new buildings with roof surface areas of 70 m2 and more [19].
If rainwater is collected according to generally recognized codes of practice, it generally meets the quality requirements for bathing water. According to the German Industrial Standard “DIN 1989-1 Rainwater Harvesting Systems” [20], rainwater may be used as service water for non-drinking purposes, including toilet flushing, laundry, cleaning and irrigation, without any further treatment. Although still not mandatory, in moderate and humid climates with sufficient precipitation, the domestic use of rainwater is an attractive option for an alternative water supply.
At a larger scale, if the required service water demand can be covered to a notable degree with rainwater, it makes sense to install a harvesting and utilization system with required storage tanks in or close to buildings. As a rule of thumb [7], the required storage capacity should be similar to the water demand of two to three weeks in climates with fairly uniform distribution of rainfall over the year [21]. In areas with arid conditions and/or in urban areas with comparable high population density and small catchment areas (such as roof surfaces) per capita, it might generally be more effective to harvest rainwater for artificial recharge and augmentation of groundwater. If available and accessible, aquifers can be used for seasonal storage of surplus rainwater and function as sustainable freshwater bodies for water supply, if the extraction does not result in overexploitation, exceeding the amount of water recharged and required by the environment [7].
Non-potable service water other than rainwater, such as recycled wastewater, can also be used for cleaning and watering, as well as for laundry and toilet flushing (Figure 4, [7]). Recycled wastewater can be used as a complementary water source. This source is available in urban and domestic environments with centralized water supply, independently from specific climate conditions.
Figure 4. Section of a building with centralized potable water supply and secondary water supply, with service water (left). Recycling of greywater from bathrooms on building level (right).
Water 05 01172 g004
Domestic wastewater streams can be differentiated into blackwater, consisting of flush water and excreta originating from toilets, and greywater, which includes bathing, laundry, food preparation and dishwashing. Greywater from bathrooms (shower, bath and wash basin) makes up the largest percentage of the total amount of domestic wastewater (between 39% and 40% without laundry, Table 1) and can often completely cover the domestic service water demand. Moreover, this type of water is often used as a source for domestic wastewater recycling, because the technical effort for purification and reuse is lower than for sewage with higher pollution.
For the purpose of use, greywater has to be collected separately, e.g., in the basement, or next to buildings, and biologically treated (Figure 4). Hygienization can be achieved by micro filtration, or radiation with UV-light, and the recycling process only takes several hours. Moreover, the tank volume for collection, treatment and storage of the treated water may be quite small and similar to the amount of collected greywater and service water demand of one day. The space demand is dependent on the amount of greywater, its pollutant load, the required service water quality, and the applied technology. A range of between 0.05 and 0.3 m3 per person and an energy demand of approximately 2 kWh/m3 for treatment and supply are realistic values [4,7,22]. The technology is applicable from single households to neighborhood level with groups of households and buildings. Treated greywater can be used for the same purposes as collected rainwater [7,23,24].

3.1.5. Example of the Potential of Drinking Water Demand Reduction by the Application of ESTs

Using the example of water saving households in Hamburg and Seoul, with a reduced domestic water demand of approximately one third compared with standard households, the drinking water consumption could be reduced by approximately a further 17% with the recycling of greywater from bathrooms and its use as service water. By combining efficient water use as well as greywater treatment and reuse, the drinking water demand in both cases could be reduced by approximately 50%, without changing user behavior, compared to standard households [4].
The transferability of the results depends on multiple factors, which can vary significantly. However, the methodology that has been used above is generic and can be transferred to any urban and domestic environment with centralized water supply in households.

3.2. Calculating Domestic Water Use and Achievable Savings

“Wise Water” (WW) [8], a Microsoft Excel-based software application, has been developed to estimate water savings, through applying and combining ESTs for efficient and sustainable water use in urban and domestic environments. This software is also aimed at building awareness and skills for domestic water-use reduction (Figure 5 [7]) (Data and technical information compiled in the UNEP-DTU Delft Sourcebook on Environmentally Sound Technologies for Urban and Domestic Water Use Efficiency “Every Drop Counts” [7]).
Figure 5. User Interface of the Microsoft Excel based software tool “Wise Water”.
Water 05 01172 g005

3.2.1. Data and Base Water Consumption

The starting basis for the calculation of the domestic water use of household and property levels is an analysis of the current situation. This requires the collection of data about water consumption at the household level, water consumption at the property level as well as details of property areas and rainfall.

3.2.1.1. Water Consumption at the Household Level

For the water consumption at the household level, the input of data detailing the average water consumption in L per capita per day for specific purposes in a domestic environment is required. It is assumed that this “base water consumption” is similar for all households on a property. The total domestic water use is assigned to three different purposes (Table 1) for which drinking water quality is required [Cooking and Drinking, Washing (Kitchen), Bath and Shower], and three different purposes for which service water quality is sufficient (Laundry, Cleaning and Watering, Toilet Flushing). Based on the entered data, multiple information is calculated and displayed: The total water consumption in L per capita per day and per year as well as for each use, the water consumption per citizen and year, and the percentage in relation to the total water consumption (Figure 6, [7]).
Figure 6. User interface of the “Base Water Consumption” sheet in “Wise Water”. In the blue and yellow marked cells, the user can change default data for “Base Water Consumption at Household Level”, “Water Consumption at Property Level”, and “Details of Property Area and Rainfall”.
Water 05 01172 g006

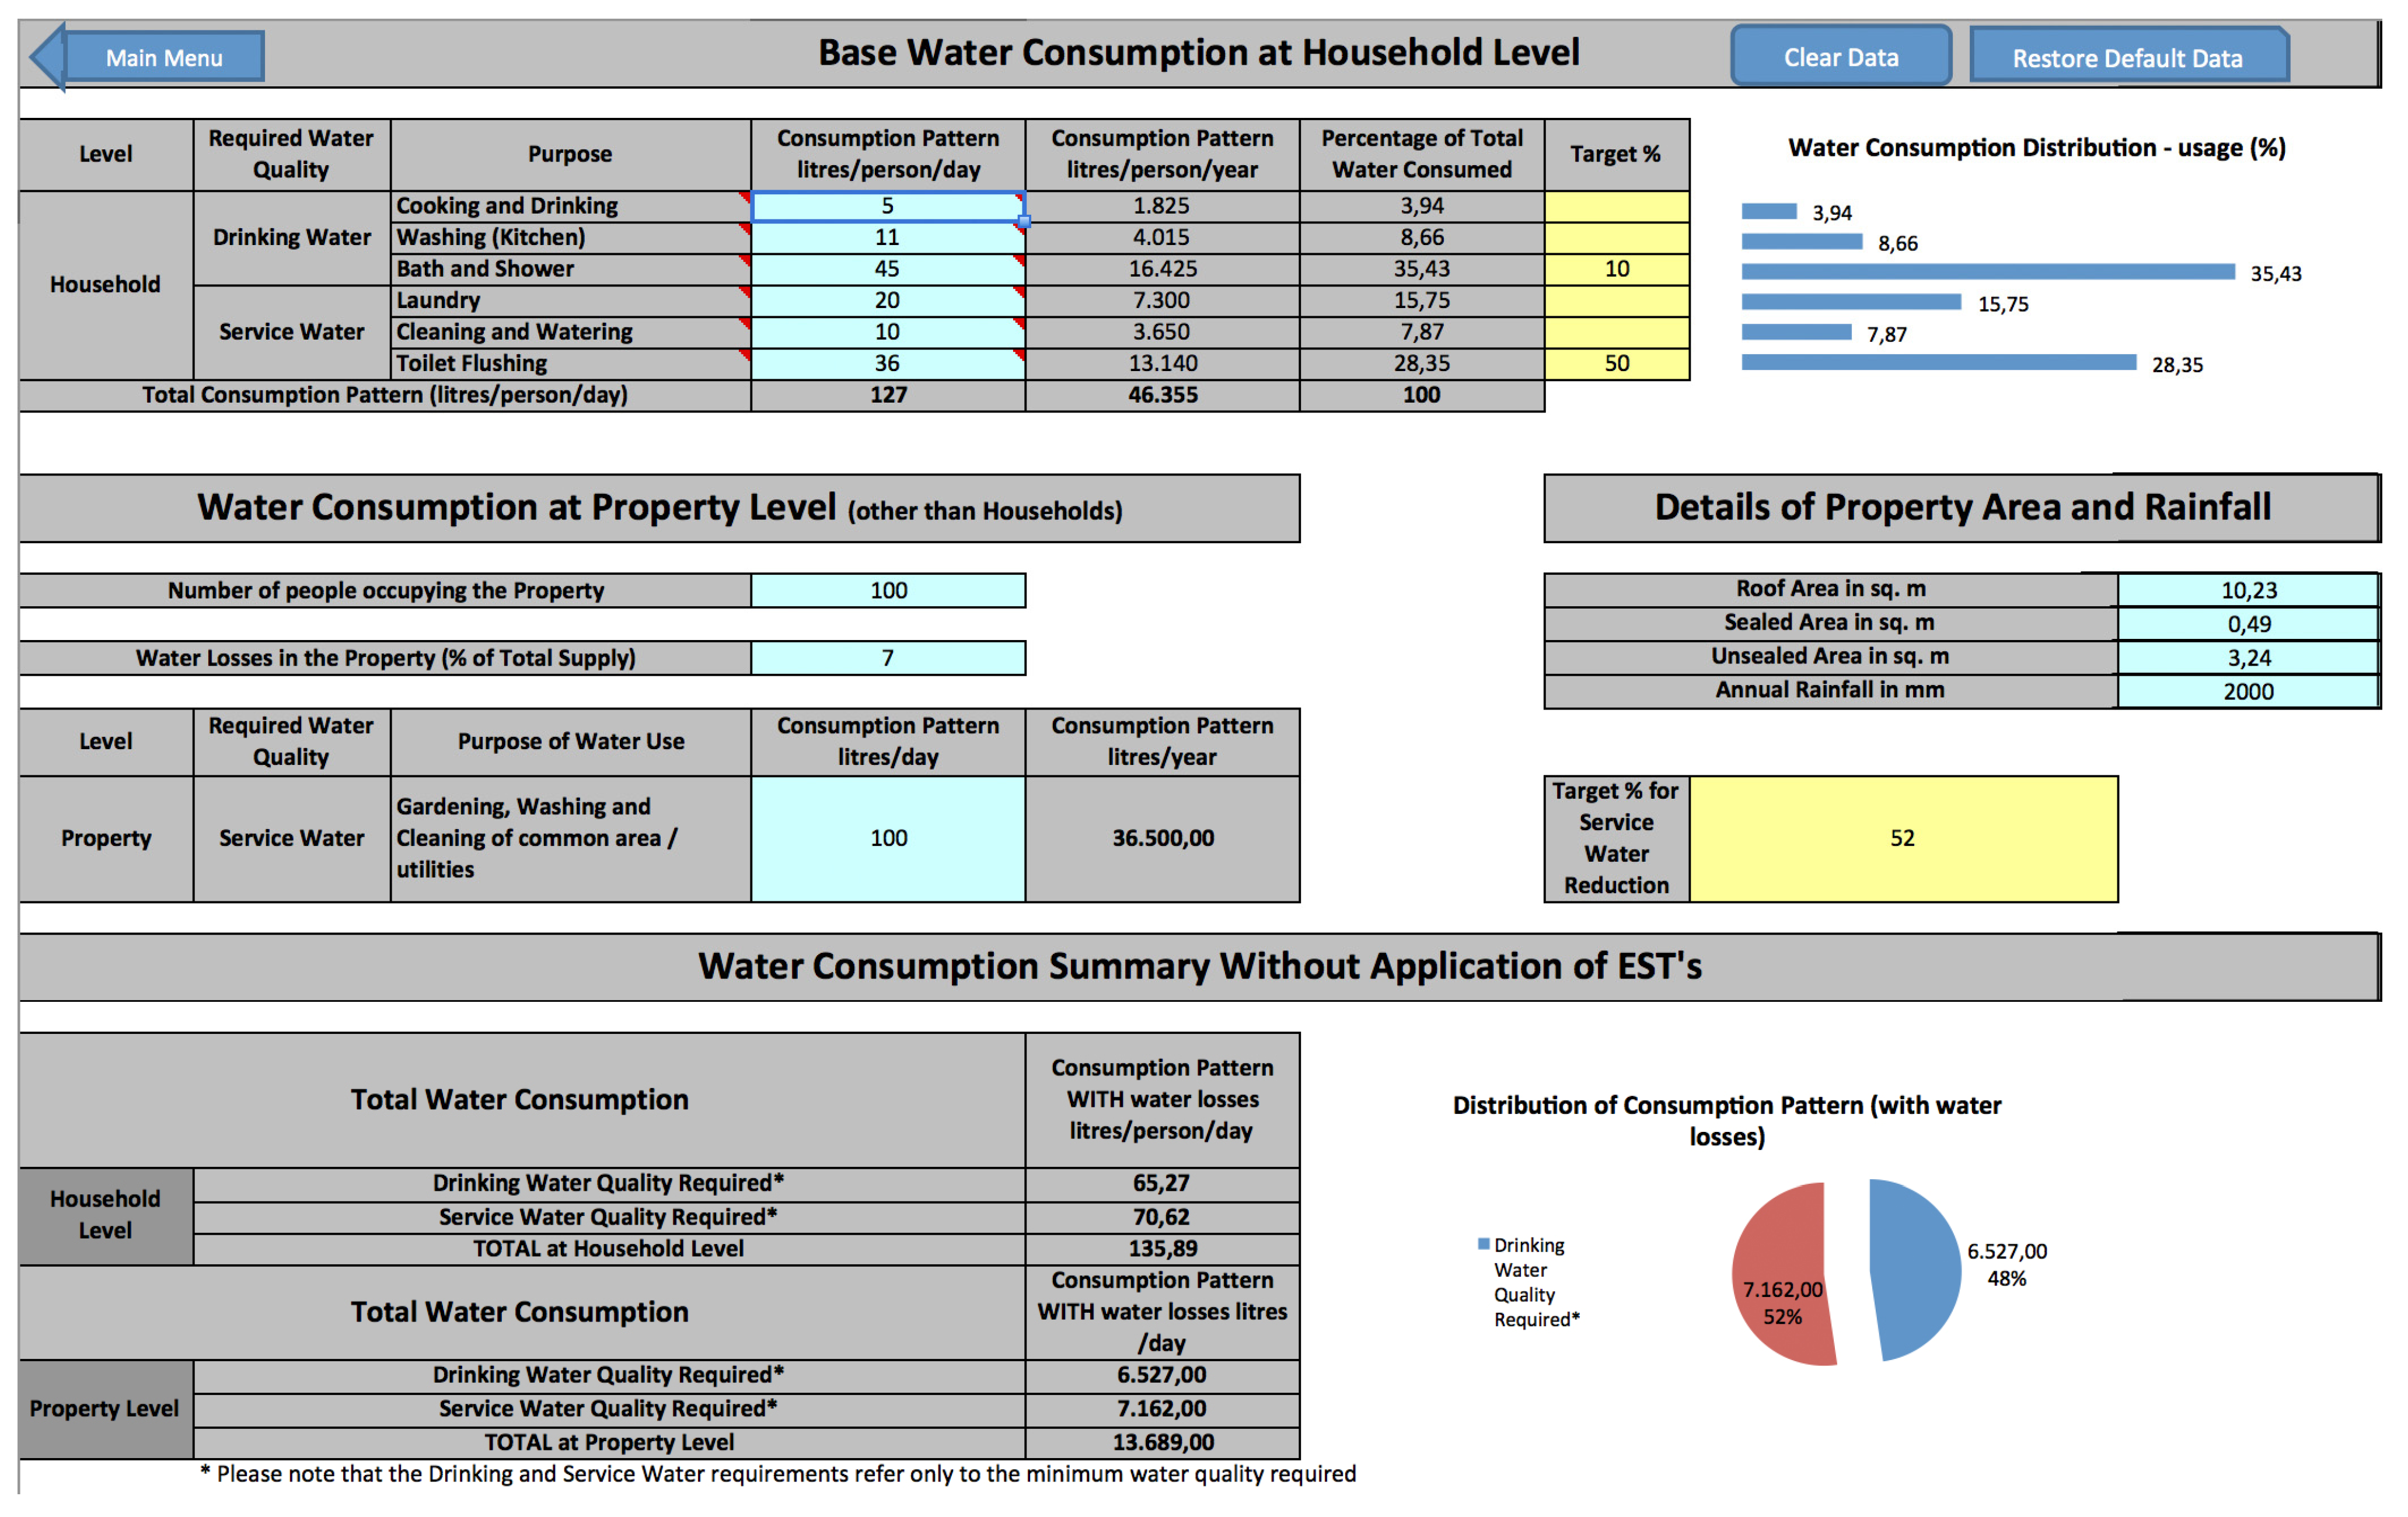
3.2.1.2. Water Consumption at the Property Level

For the water consumption at the property level, the number of citizens and the water losses of the water supply network in percentages from the total supply are required as well as the water demand in L/day for gardening, washing and cleaning of common areas and utilities. The water consumption at property level during the period of one year is calculated accordingly (Figure 6, [7]).
For the estimation of the rainwater harvesting potential at property level, the average annual rainfall in mm as well as the horizontal projections of three specific areas in square meters are required: (non-greened) roofs, sealed surfaces (such as water impermeable pavements and asphalt), and unsealed surfaces (e.g., water permeable pavements as well as greened roofs and areas).

3.2.1.3. Summary of Water Consumption at the Household and Property Level

Based on the entered data, a summary of the water consumption at both the household and property levels, without the application of ESTs, is calculated and displayed. This includes consumption patterns with water losses in L per capita as well as in percentages of total for uses that require drinking water quality and for which service water quality is sufficient. These statistics are helpful in determining the focus area for efficient water use: drinking or service water or reduction of overall water consumption at the property level (Figure 6, [7]).

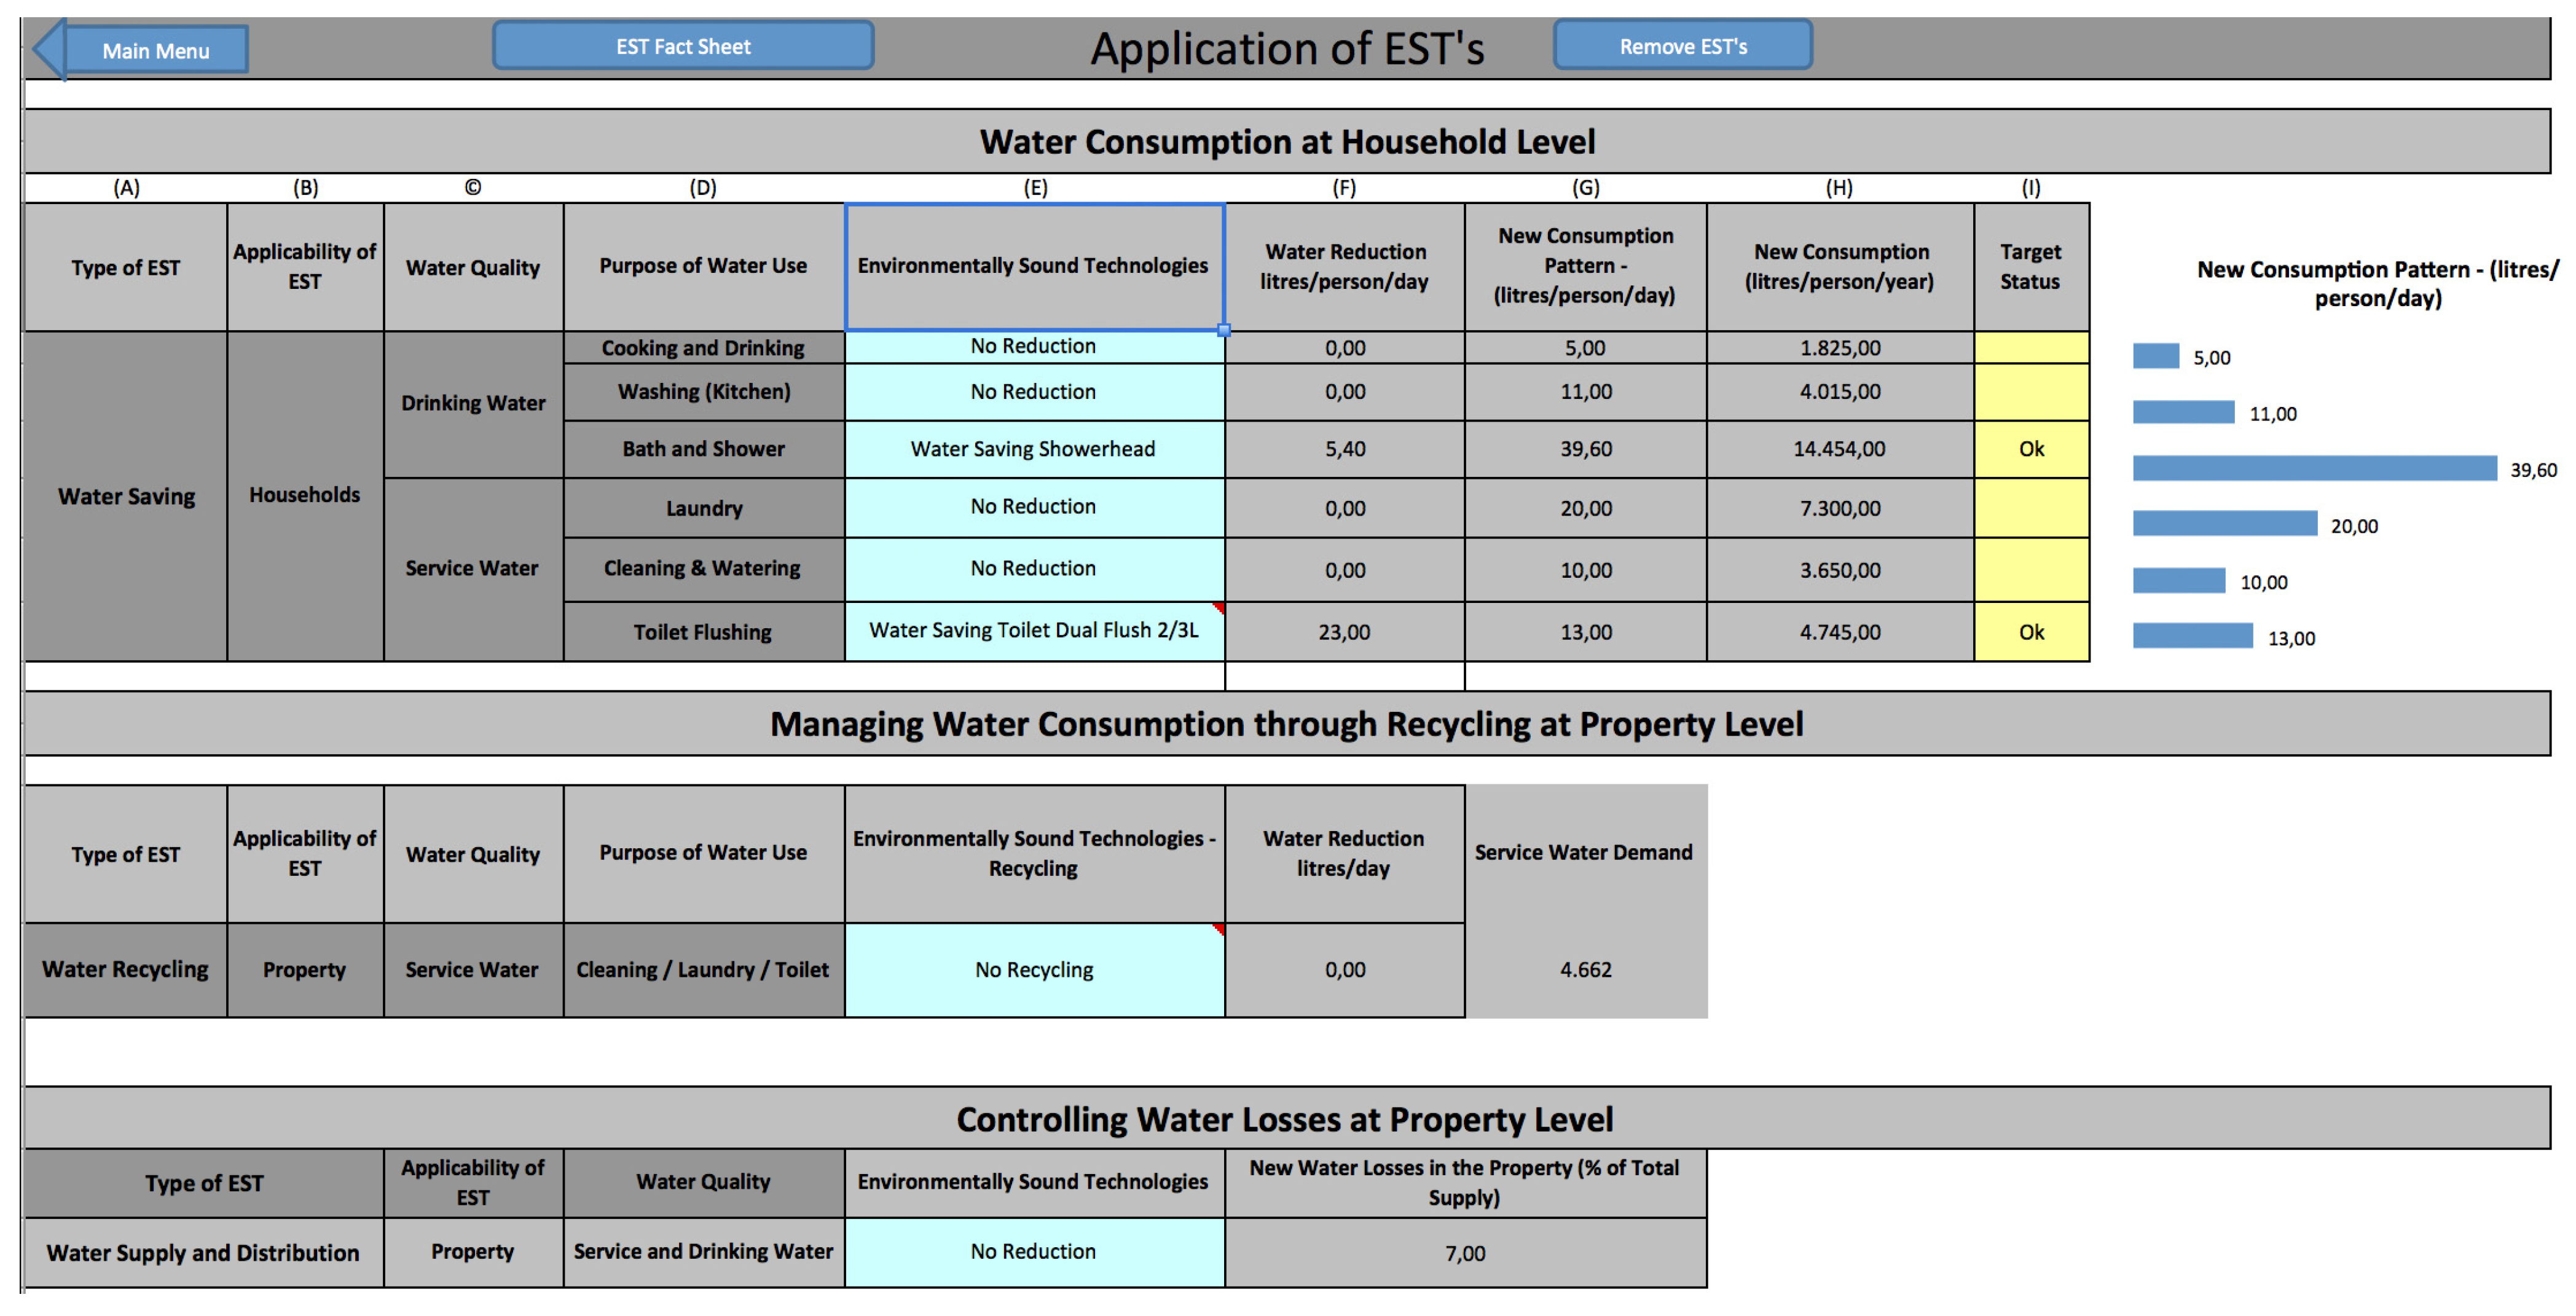
3.2.2. Application of Environmentally Sound Technologies (ESTs)

After entering the base water use data, the user can choose from the ESTs that can be applied for the reduction of domestic drinking water consumption and are assigned to four basic fields of application: reduction of water use at the source, recycling of used water, reduction of water losses in distribution, and complementation or augmentation of freshwater resources. Technologies for the reduction of water use consist of water saving fixtures (household appliances, taps, showerheads and toilets). For recycling, wastewater streams have to be segregated and treatment technologies applied. Technologies for the reduction of water losses include pressure control and the fixing of leaks. For the augmentation of freshwater water bodies, technologies for rainwater harvesting are applied (Figure 7, [7]).
Figure 7. User interface of the “Water Consumption after environmentally sound technologies (EST)” sheet in “Wise Water”. By means of pull down menus in the blue marked cells, the user can choose from different options for reducing “Water Consumption at Household Level”, “Managing Water Consumption through Recycling at Property Level”, and “Controlling Water Losses at Property Level”.
Water 05 01172 g007

3.2.2.1. Technology Factsheets

For better understanding of the specific technologies, factsheets are provided that contain technology descriptions and information about construction, operation and maintenance, relative costs when the technology is appropriate, advantages, disadvantages/constrains, cultural acceptability, as well as the extent of use. Based on the application of ESTs, new water consumption patterns are calculated, and statistics and graphs are displayed. The data required for the calculation comes from a technology database with detailed information about the specific technologies and their effect on the base water consumption. The data can be viewed and edited to modify the properties of specific technologies for water use efficiency according to local availability and/or technological development.

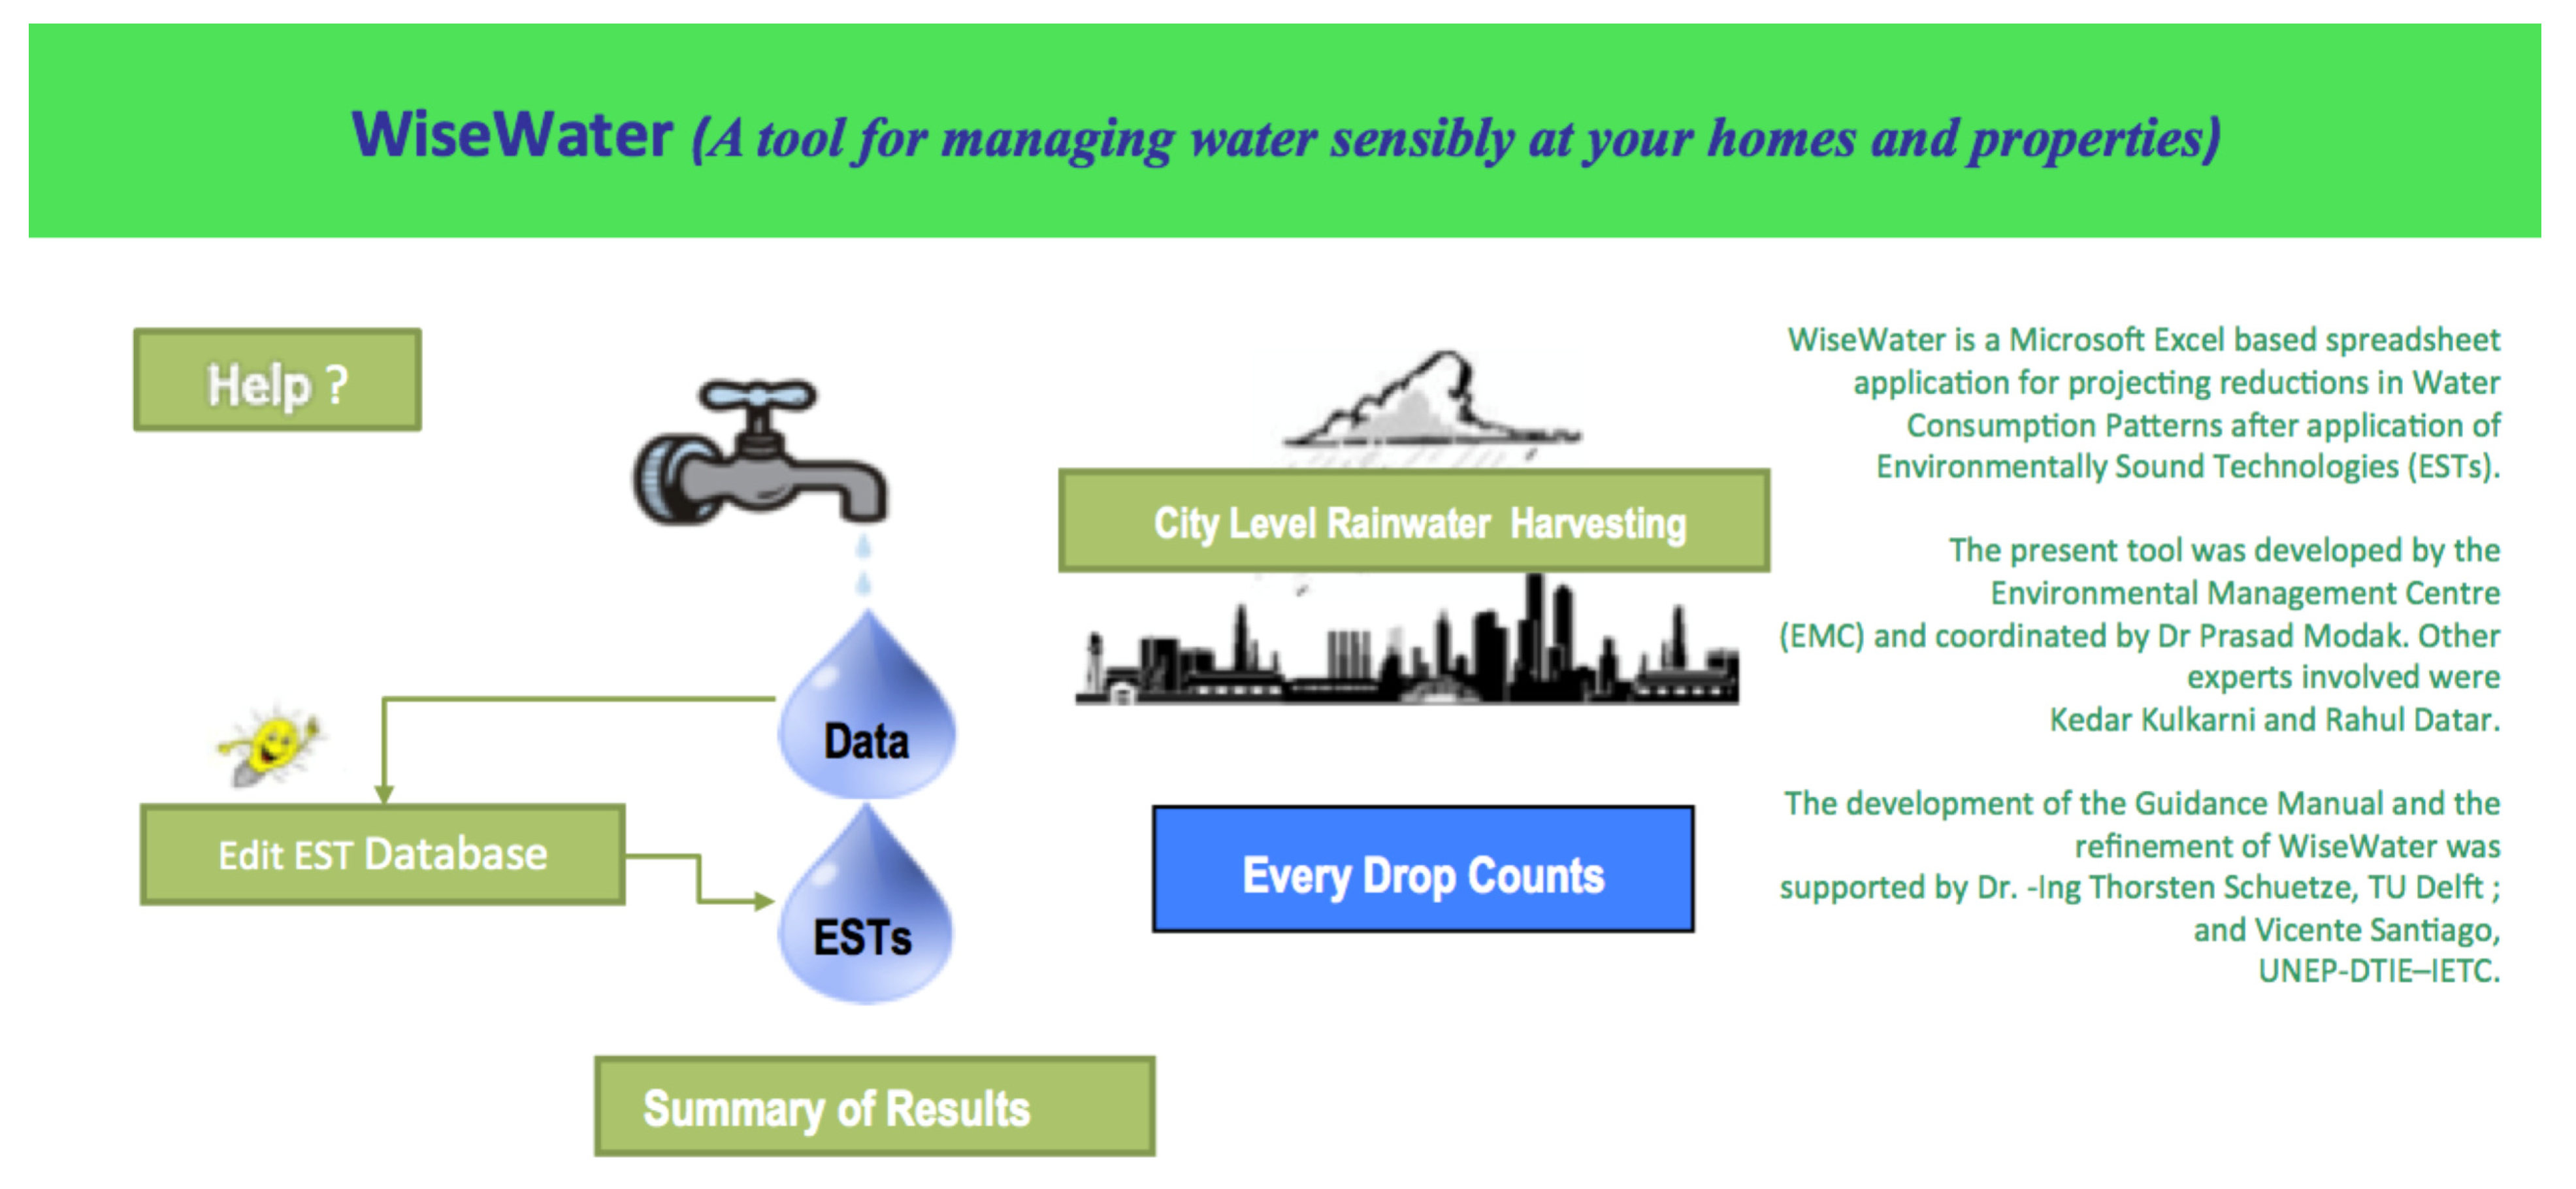
3.2.2.2. Wise water and Water Savings

Wise Water is a powerful tool to calculate water savings using ESTs. This can be done by modifying the water consumption at the household level and applying water saving technologies. The user can choose from the different available technologies, but only one can be applied at any given time. For example, water saving taps can be selected for cooking and drinking in the kitchen. Water saving taps and dishwasher can be selected for washing in the kitchen. For bath and shower, the user can choose either to apply water saving taps, water saving showerheads, or both water saving taps and showerheads. A reduced consumption of these three purposes that require drinking water quality affects the available quantity of wastewater for recycling and service water supply.
To reduce the water demand of both laundry as well as cleaning and watering, water saving behavior and household appliances can be selected. The greatest variety of options is available for toilet flushing; hence the user can choose from compost toilet, pre compost toilet, dehydration toilet, waterless urinal, water saving toilet with 1 L single flush, water saving toilet with 1 and 6 L dual flush, water saving toilet with 2 and 3 L dual flush, as well as water saving toilet with 4 and 6 L dual flush.
In accordance with the properties of the selected technology option, calculations are made and displayed, e.g., water reduction in L/day as well as the new consumption pattern in L/day and L/year. It is also calculated if specific target values for the reduction of water consumption are met. These values can be determined in percentages from the total water demand for each of the six different purposes that are already on the base water consumption sheet (Figure 7, [7]).

3.2.2.3. Water Recycling Technologies

The water consumption can be managed at the property level through the control of water losses and the application of technologies for water recycling. Through Wise Water, water reduction in L/day can be calculated for the recycling of different wastewater streams. The available options for treatment and recycling concern the following wastewater streams: greywater from bathrooms (includes laundry by default), greywater from kitchens, all greywater (from bathrooms and kitchens), blackwater, and all wastewater (blackwater and greywater). The considered quantity of the specific sewage streams is dependent on the specific flow rates of the water saving technologies that have been selected for the different water use purposes. The reduction of water consumption that can be achieved by the selected recycling measure as well as the remaining service water demand are calculated and displayed in L/day. A negative result for the remaining service water demand means that the demand is covered and a surplus is generated. A positive result indicates that the service water demand cannot be covered by the selected recycling measures. Accordingly, demand side or recycling measures should be modified (Figure 7, [7]).
Water losses at the property level are determined by the application of leakage or pressure control. The leakage rate after application of these measures is calculated and displayed in percentages of the total supply (Figure 7, [7]).

3.2.2.4. Rainwater Harvesting Potential

The Rainwater Harvesting Potential in humid and temperate climates with fairly uniform distribution of rainfall over the year can be estimated in “Wise Water” in L/year for the three different catchment area types “roof”, “sealed area” and “unsealed area”. For the calculation of the specific usable rainwater quantities, the program multiplies specific area sizes with the available annual rainfall and area specific runoff coefficients. For service water use, only the amount of rainwater that can be harvested from roof areas is considered. Furthermore, it is estimated that the rainwater storage volume is based on the service water demand of approximately three weeks. However, depending on the climate conditions, the volume could be increased to allow for a higher coverage rate of the service water demand by stored rainwater (Figure 8, [7]).
Figure 8. User interface of the “Water Consumption after EST” sheet in “Wise Water”. The user can choose to “Apply Rainwater Harvesting”. Water Consumption Pattern after Application of EST’s is displayed for household and property levels.
Water 05 01172 g008
The water consumption pattern after application of ESTs with water losses is calculated for both household and property levels. At the household level, the total consumption is the sum of the consumed drinking and service water in L per person per day. The results are displayed for all three categories (Figure 8, [7]).

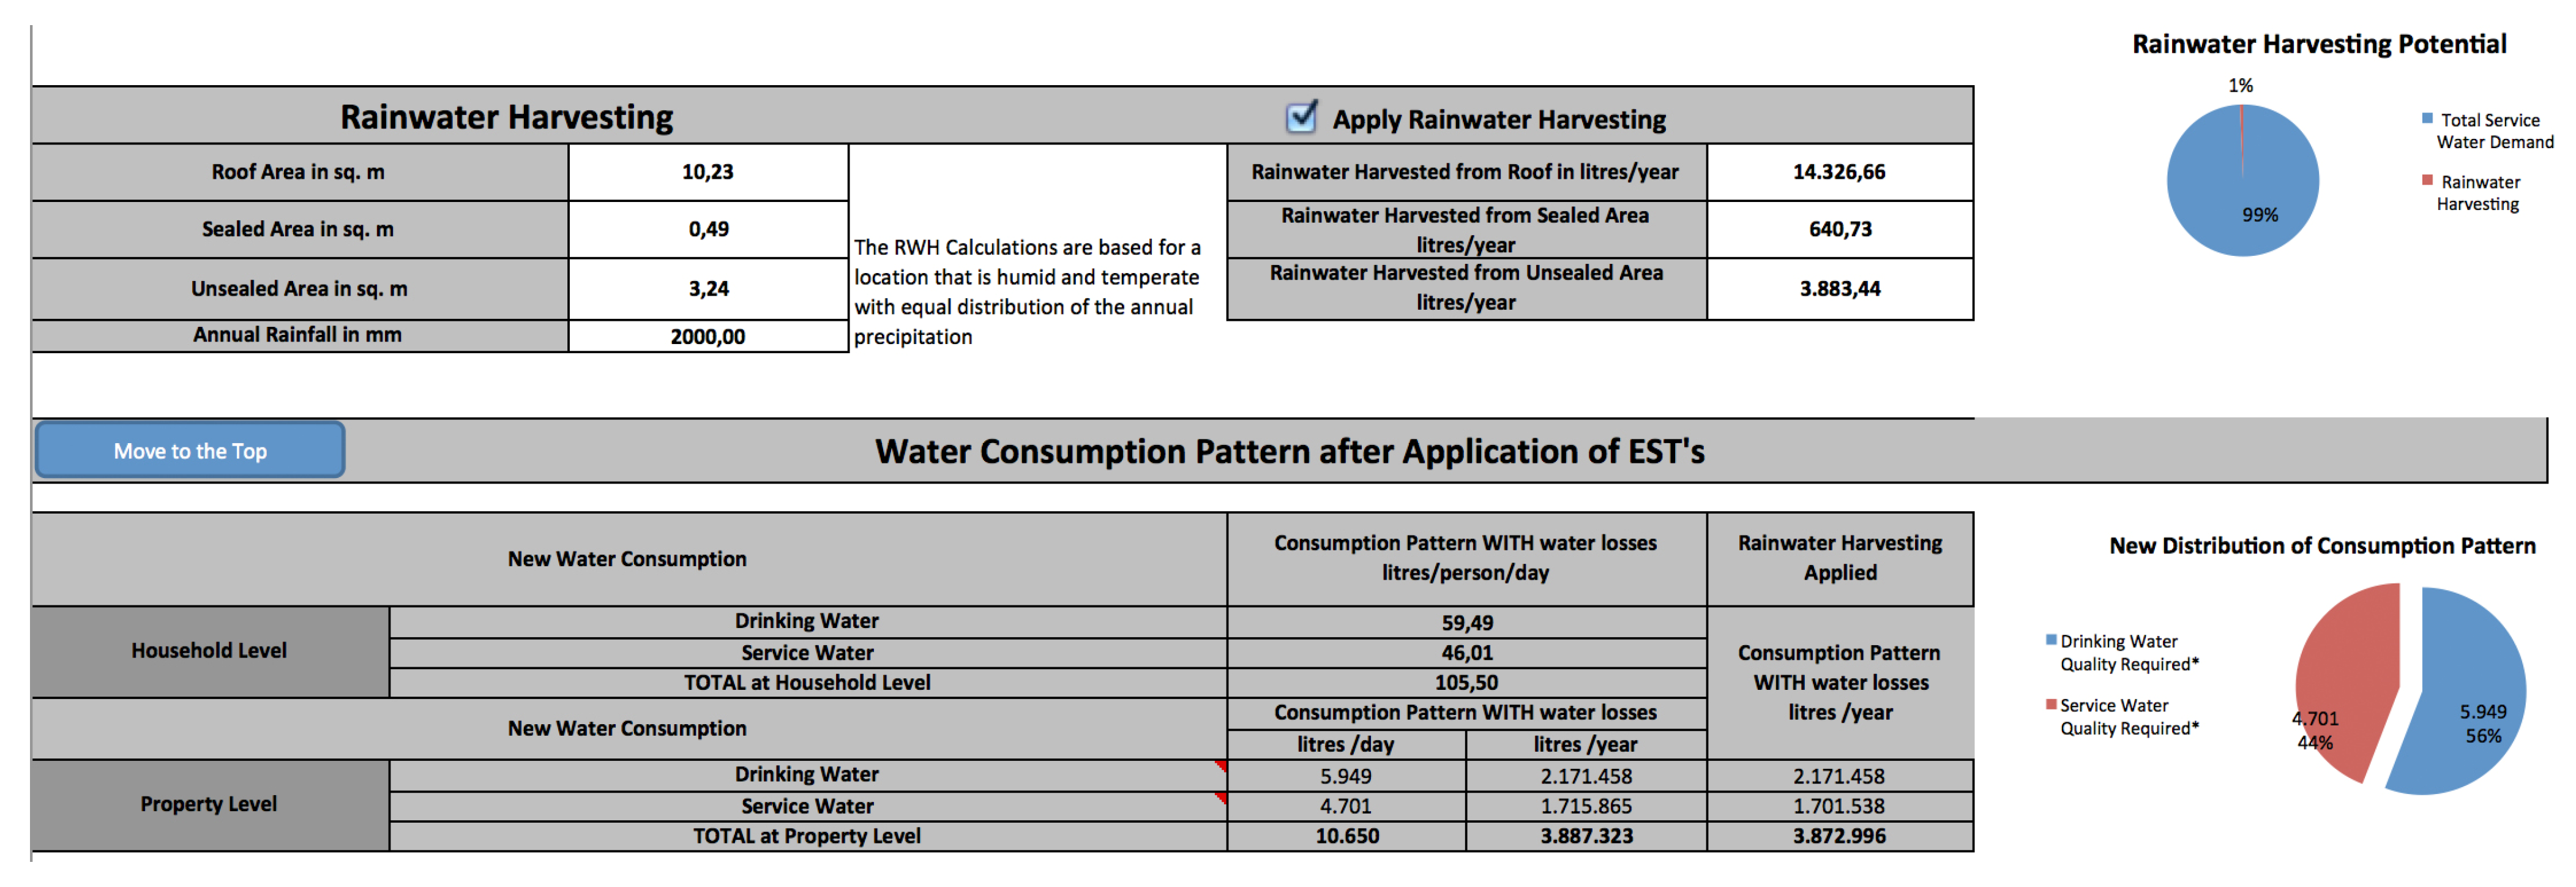
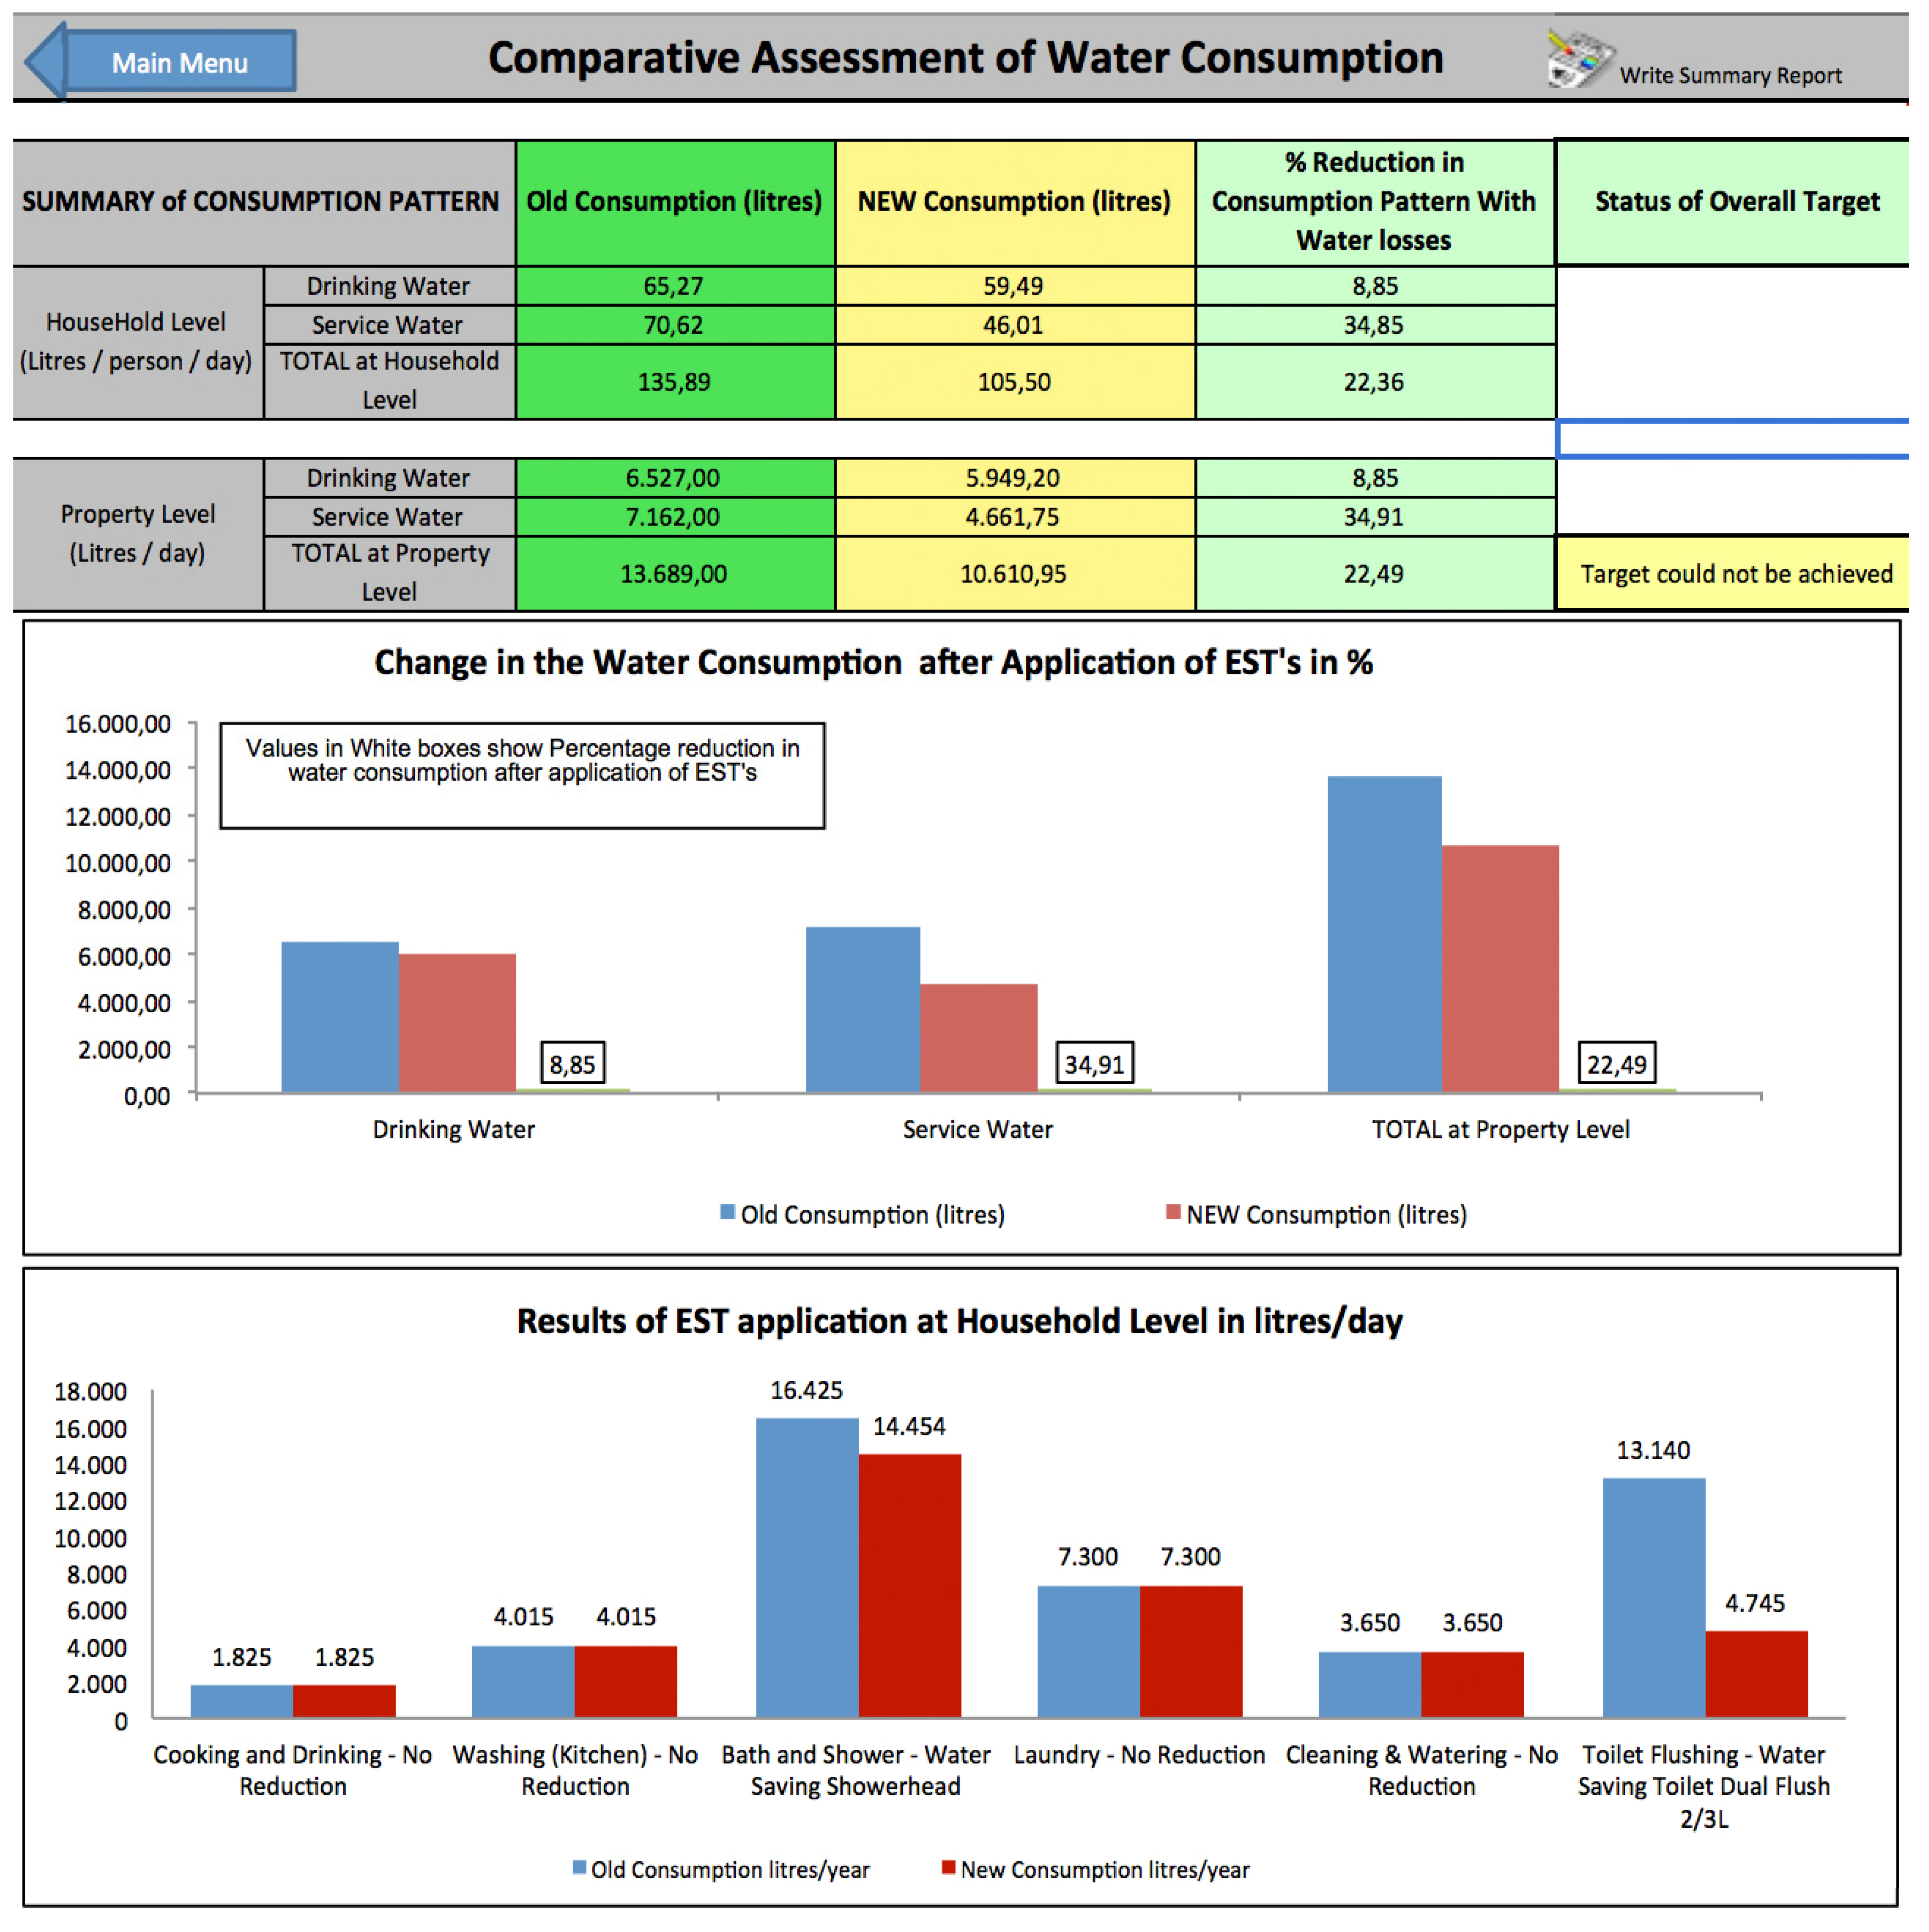
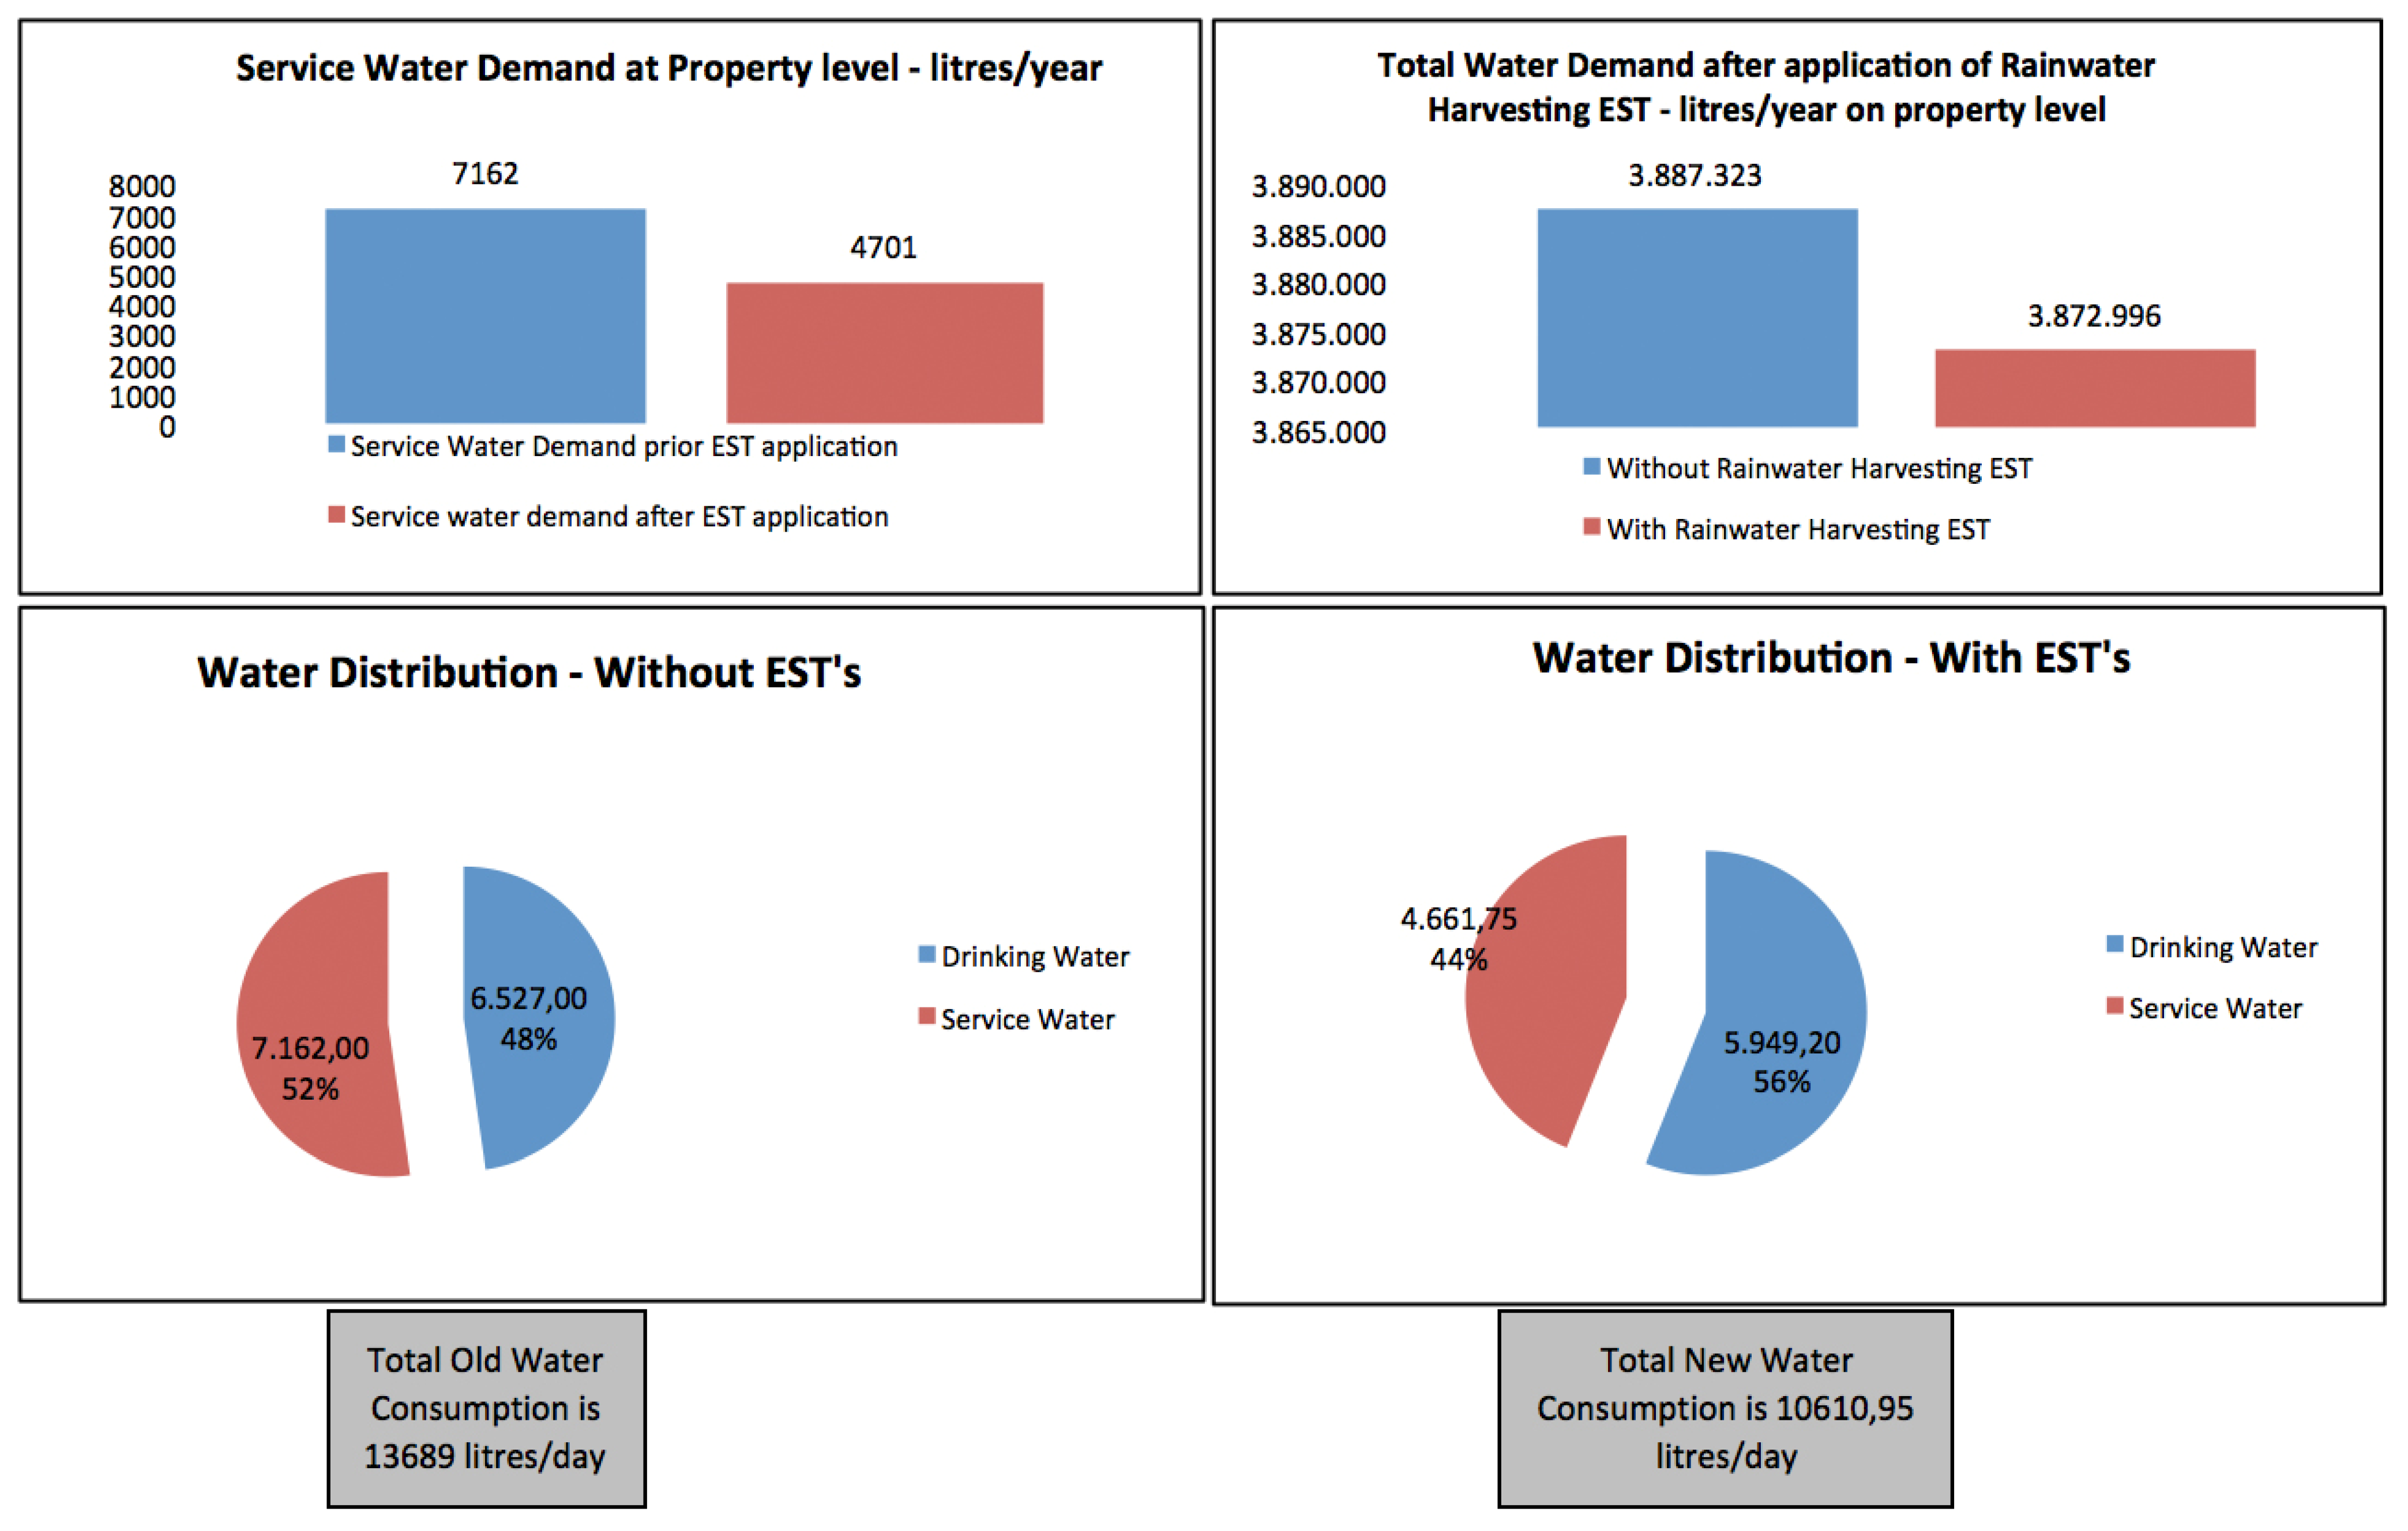
3.2.2.5. Water Consumption Pattern after Application of ESTs

The total water consumption pattern at the property level after the application of ESTs describes the freshwater footprint of the area. In this case, the recycling of the previously selected wastewater streams to service, as well as to drinking water, is considered (for example through augmentation of freshwater resources in surface or groundwater bodies for the production of drinking water). The total freshwater demand is calculated through Wise Water by subtracting the amount of purified wastewater and produced service water from the total drinking water demand. The results are displayed for total water consumption, as well as for consumed drinking water and produced service water in L/day and in L/year (Figure 8, [7]).

3.2.2.6. Water Footprint and Freshwater Dependency

In addition to the calculation of a properties water footprint, “Wise Water” also calculates the total demand of freshwater that has to be imported to a property, if rainwater is harvested. In this case, the total amount of rainwater that can be harvested during a year is added to the quantity of recycled wastewater. The sum of available service water is subtracted from the property’s drinking water consumption and results in its total freshwater demand. In the best case, the result is negative. This means that the sum of collected rainwater and recycled sewage exceeds the freshwater demand. For easy estimation of the proportion of the total amount of produced service and drinking water during the period of one year, the sum of both is regarded to be 100%, and the program displays the specific percentages of the total for both qualities. Accordingly, a potentially water independent property should always have a drinking water consumption that is less than 50% and a service water production that is more than 50% (Figure 8, [7]).

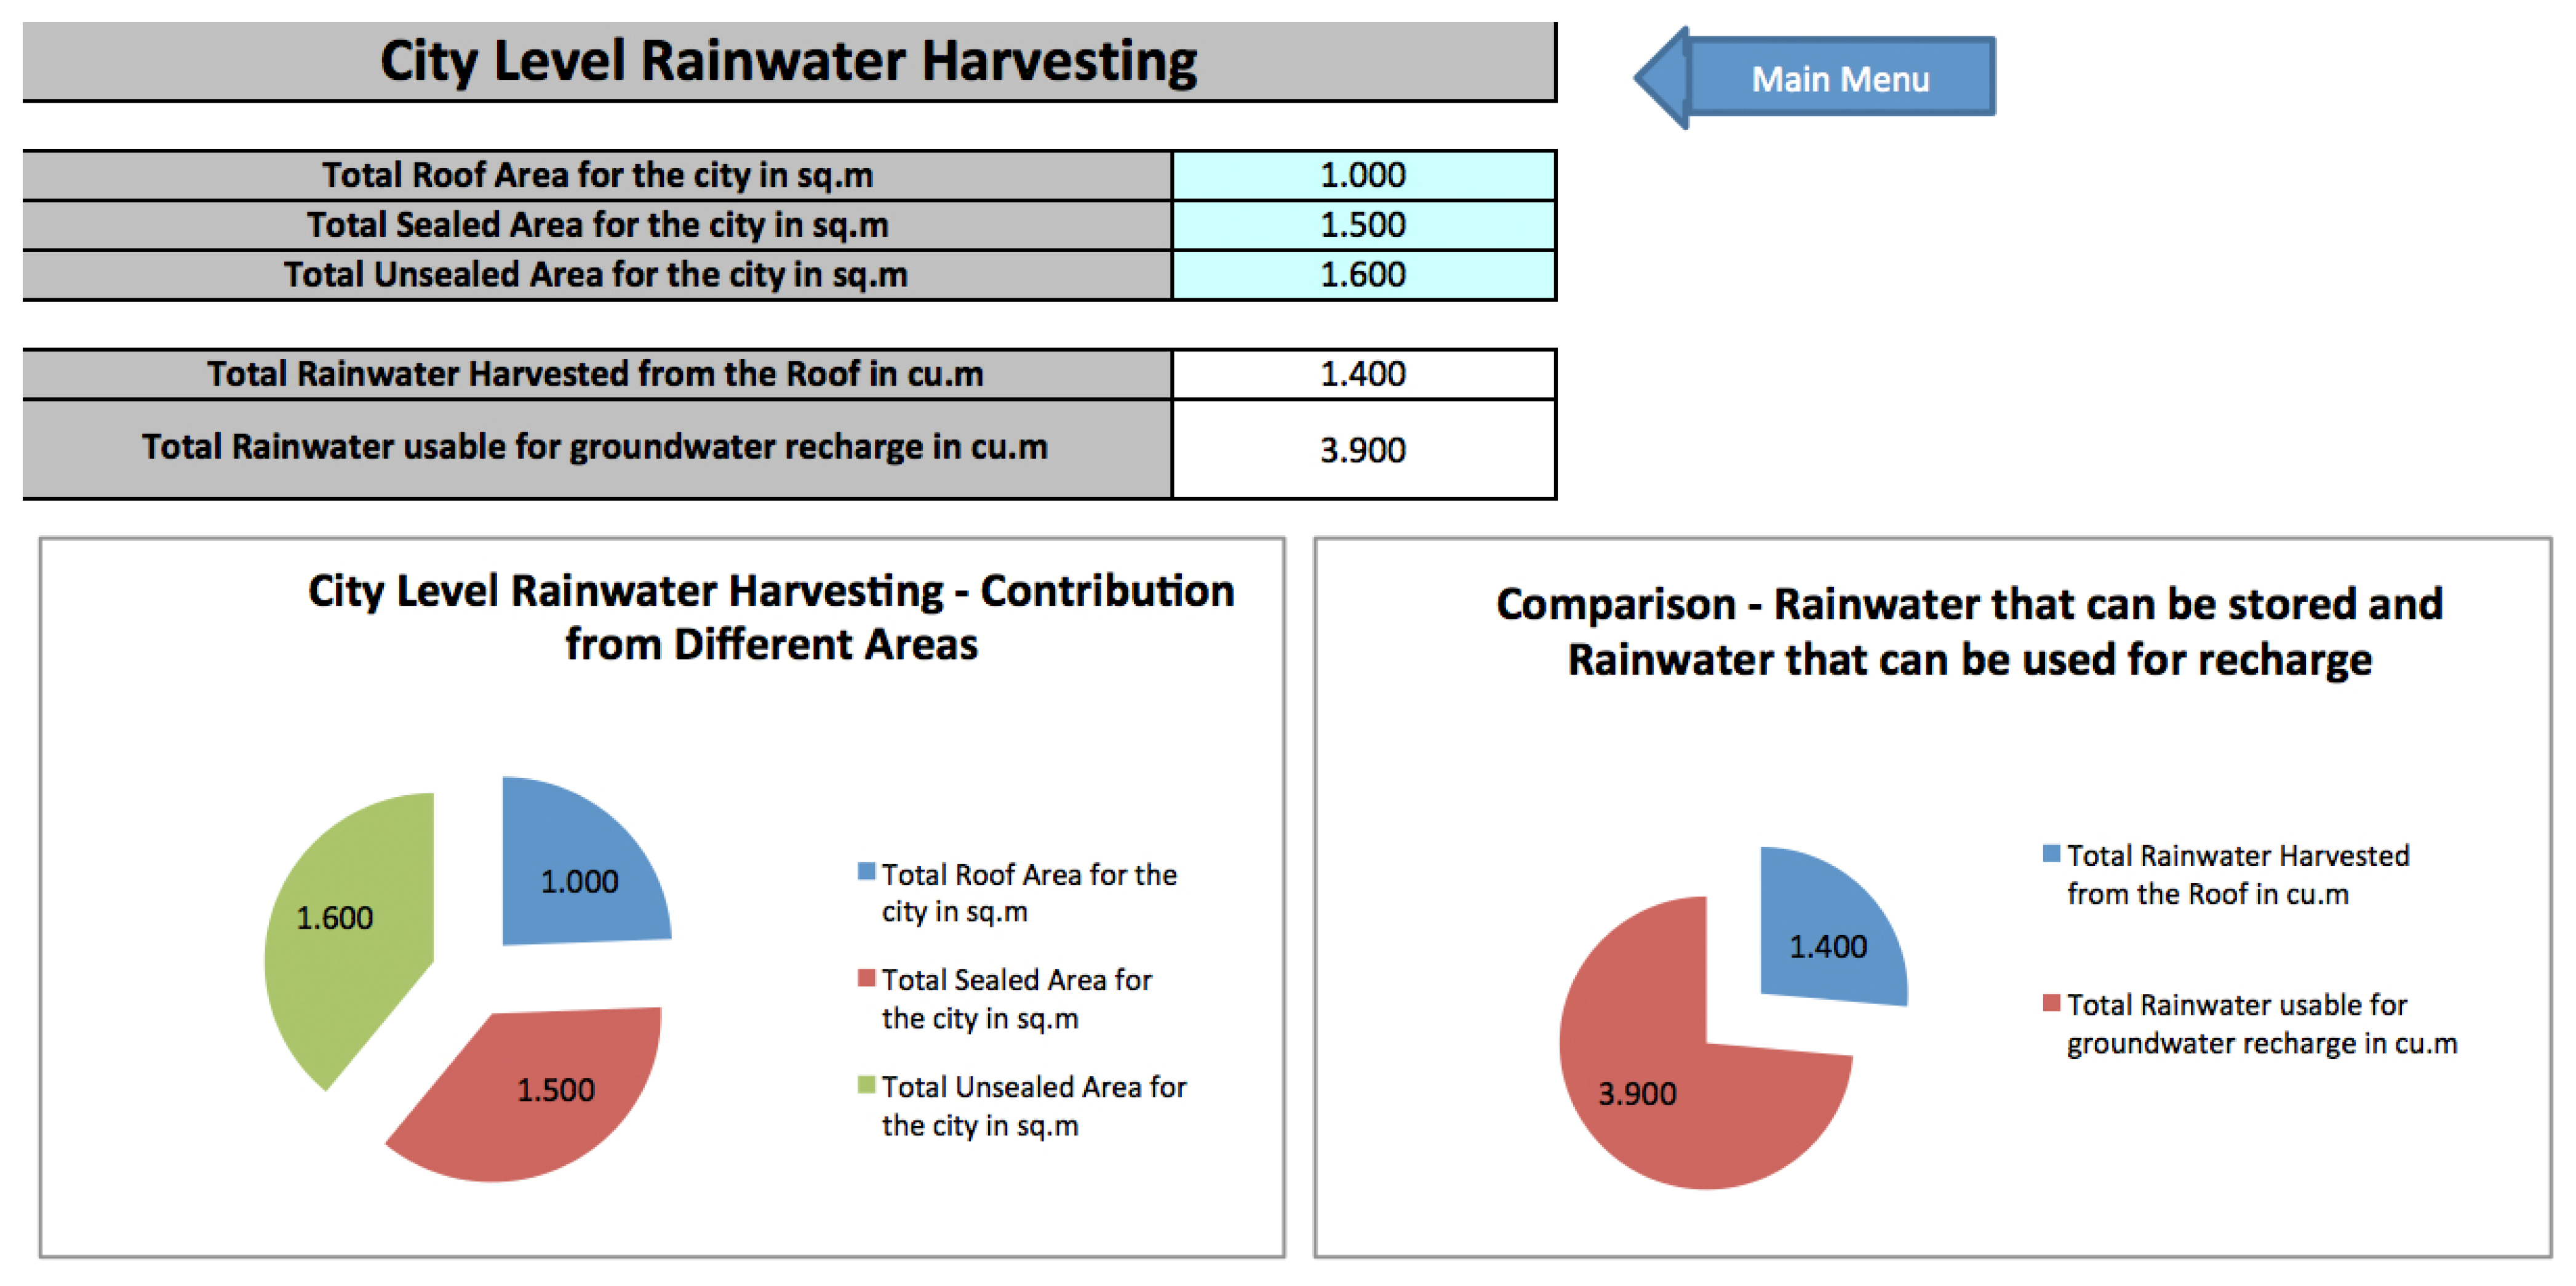
3.2.3. Summary and Rainwater Harvesting and Management Potential at the City Level

For better appreciation of the simulation results, a summary worksheet in Wise Water provides a histogram-based comparative assessment of the water consumption at household and at property levels before and after the application of ESTs for sustainable and efficient water use (Figure 9, [7]).
Tables and bar charts provide information about the old and new water consumption in L for the total as well as divided into drinking and service water quality. The reduction in consumption pattern, including water losses, is displayed in percentages, and it is indicated if the water reduction targets, which have been set on the base water consumption sheet, could be achieved with the selected measures. A bar chart comparing the consumption of the six different water use purposes in L/day, before and after application of ESTs for all households, enables understanding of the effectiveness of the specific choices (Figure 9, [7]).
The benefits and effectiveness of rainwater harvesting are illustrated by bar charts showing the total water demand of a property, with and without application of this technology. With the information provided on this worksheet, a report in HTML format can be automatically generated and saved. The generation of such reports for different scenarios allows for easy comparison of the specific benefits of different technological choices and combinations (Figure 10, [7]).
One needs to recall that the database, containing quantitative information about specific ESTs used by “Wise Water” for the calculation of scenarios for water use, is based on information and data compiled in the Sourcebook on ESTs “Every Drop Counts” [7]. To facilitate the adaption of the program to site-specific conditions or new data available for specific technologies, the user can edit the database, regarding the percentage of water reduction that can be achieved.
In addition to the calculation of efficient water use and management at the household and property level, the program also facilitates the estimation of rainwater harvesting potential at the city level in humid and temperate climates with fairly uniform distribution of rainfall over the year. Computations of water consumption for cities are currently not possible, as non-domestic industrial and commercial water uses are not addressed. The methodology for the estimation of the rainwater harvesting potential at city level is similar to the previously described method at property level. The total rainwater that can be harvested and potentially used for the substitution of drinking water at property and household levels is calculated based on the user input of the city’s total roof areas. The sizes of the sealed and unsealed city areas have to be entered for the computing of the total rainwater usable for groundwater recharge. The program displays the contribution from different areas to the city level rainwater harvesting as well as a comparison of the rainwater quantities that can be stored and that can be used for recharge (Figure 11, [7]).
Figure 9. “Summary” sheet in “Wise Water” with summary of water consumption pattern and graphics displaying change in the water consumption after application of ESTs, and results of EST applications.
Water 05 01172 g009
Figure 10. Diagrams on the “Summary” sheet in “Wise Water” illustrating the service water demand at property level, total service water demand after application of rainwater harvesting as well as water distribution with and without ESTs.
Water 05 01172 g010
Figure 11. “City Level rainwater harvesting (RWH)” sheet in “Wise Water”. The user can enter the size of different area types in the blue marked cells. Diagrams illustrate the contribution of different areas to the rainwater harvesting as well as the amounts of rainwater that can be used for storage and recharge.
Water 05 01172 g011

3.2.4. Examples of Rainwater Harvesting and Management Potential at the City Level

As an example, the rainwater harvesting potential at the city level is estimated for the cities of Seoul in the Republic of Korea and Hamburg in Germany, for which the reduction of drinking water demand has already been estimated in the first section of this paper.
The rainwater harvesting potential in cubic meters for the period of one year is calculated by multiplying the amount of rainwater landing on a specific area with specific runoff coefficients. To avoid a too positive estimation, these coefficients are comparatively low. For the rainwater harvesting and utilization potential from non-greened roofs, a coefficient of 0.7 is applied. The coefficients for estimation of the amount from sealed surfaces at the property level is 0.6 and for the augmentation of freshwater bodies from unsealed green city areas is 0.55.

3.2.4.1. Rainwater Harvesting and Management Potential for Seoul, Republic of Korea (Table 2)

The total city area of Seoul in the Republic of Korea is approximately 605,000,000 m2. Seventeen percent (102,600,000 m2) consists of non-greened roofs [25]. Forty-nine percent (296,450,000 m2) is sealed surfaces and the remaining 34% (205,700,000 m2) is non-sealed surfaces [26]. If these data are multiplied with the average rainfall of 1282 mm/year and the specific runoff coefficients, the amount of rainwater that could be collected and utilized, either directly or for the augmentation of freshwater bodies, can be roughly estimated. The total amount of rainwater that could be harvested is 465,141,650 m3, and this can be assigned to 92,073,240 m3 from non-greened roofs, 228,029,340 m3 from sealed surfaces, and 145,039,070 m3 from non-sealed surfaces.
Considering an average drinking water consumption of 208 L per capita per day, and water losses due to leaking pipelines of 8%, the total domestic drinking water demand of the 10,581,728 inhabitants in Seoul [27] is approximately 867,633,973 m3/year. By area-wide introduction of water saving households, greywater recycling, and reduction of pipeline losses to 4%, this demand could be minimized to 417,749,691 m3/year.
Table 2. Rainwater harvesting potential at city level for Seoul, Republic of Korea (for 100% of the total city area; DWD = drinking water demand, RWH = rainwater harvesting).
ComponentRoof non greenedSurface sealedSurface non sealedTotal
Area (m2)102,600,000296,450,000205,700,000604,750,000
Area (Proportion of total)17%49%34%100%
Rainfall (m3/year)131,533,200380,048,900263,707,400775,289,500
Runoff coefficient0.70.60.55
Potential RWH (m3/year)92,073,240228,029,340145,039,070465,141,650
DWD domestic standard (m3/year) 867,633,973
Proportion potential RWH of DWD domestic standard10.6%26.3%16.7%53.6%
DWD domestic water saving (m3/year) 417,749,691
Proportion potential RWH of DWD domestic water saving22%54.6%34.7%113%
Taking the average rainfall of 1282 mm/year into account, the total amount of rainwater landing on the city area would be 775,610,000 m3 and similar to 89.4% of the standard domestic drinking water demand. According to the calculation with “Wise Water”, the amount of rainwater harvested from non-greened roofs is equivalent to the consumption of 10.6% of the standard and 22% of the water saving households. From sealed surfaces, the quantity is equal to the consumption of 26.3% of the standard and 54.6% of the water saving households, and from unsealed surfaces, it is equivalent to the consumption of 16.7% of the standard and 34.7% of the water saving households. The total amount of rainwater that could be harvested in Seoul is accordingly equivalent to a portion of 53.6% of the domestic water demand of standard households and 113% of the demand of water saving households with grey water recycling. Therefore, the domestic water demand of Seoul could be provided with local renewable water resources, if effective measures for water use efficiency and the recycling of greywater would be realized citywide.

3.2.4.2. Rainwater Harvesting and Management Potential for Hamburg, Germany (Table 3)

In Hamburg, Germany, 8% (60,000,000 m2) of the total city area (75,000,000 m2) consists of surface water, 40% (300,000,000 m2) is green areas, and the remaining 52% is traffic and settlement areas (390,000,000 m2) [28]. For the estimation of rainwater harvesting potential, only the 52% traffic and settlement area is taken into account. It is estimated that approximately 5% (37,500,000 m2) of the city’s surface areas consists of non-greened roof areas, 20% (150,000,000 m2) of the city area is sealed ground, and the remaining 27% (202,500,000 m2) is non-sealed traffic and settlement areas.
Table 3. Rainwater harvesting potential at city level for Hamburg, Germany (for traffic and settlement areas, which have a proportion of 52% of the total city area; DWD = drinking water demand, RWH = rainwater harvesting).
ComponentRoof non greenedSurface sealedSurface non sealedTotal
Area (m2)37,500,000150,000,000202,500,000390,000,000
Area (Proportion of total)10%38%52%100%
Rainfall (m3/year)26,775,000107,100,000144,585,000278,460,000
Runoff coefficient0.70.60.55
Potential RWH (m3/year)18,742,50064,260,00079,521,750162,524,250
DWD domestic standard (m3/year) 78,922,256
Proportion potential RWH of DWD domestic standard23.7%81.4%100.8%205.9%
DWD domestic water saving (m3/year) 39,461,128
Proportion potential RWH of DWD domestic water saving47.5%162.8%201.5%411.9%
Estimating an average domestic drinking water consumption of 117 L per person per day of the 1,777,000 inhabitants in Hamburg and water losses of approximately 4%, the total domestic drinking water demand of the city would be 78,922,256 m3/year. By area-wide introduction of water saving households and greywater recycling, this demand could be minimized to 39,461,128 m3/year. Taking the average rainfall of 714 mm/year into account, the total amount of rainwater landing on the city area would be 535,500,000 m3. This amount is equivalent to approximately 679% of the standard domestic water demand. According to the calculation with “Wise Water”, approximately 18,742,500 m3 could be collected from roofs, 64,260,000 m3 could be harvested from sealed-, and 79,512,750 m3 from non-sealed traffic and settlement areas, and could be used for the augmentation of freshwater bodies.
The amount of rainwater harvested from non-greened roofs is equivalent to 23.7% of the demand of standard and 47.5% of water-saving households. From sealed surfaces, the quantity is equal to 81.4% of the demand of standard and 162.8% of water saving households, and from unsealed surfaces it is equivalent to 100.8% of the demand of standard and 201.5% of the demand of water saving households. The total amount of rainwater that could be harvested in Hamburg from traffic and settlement areas is accordingly equivalent to a portion of 205.9% of the domestic water demand of standard households and 411.9% of the demand of water saving households with grey water recycling. Therefore, the domestic water demand of Hamburg could be provided with local renewable water resources, even without effective measures for water use efficiency, and a citywide realization of greywater recycling.

4. Conclusions and Outlook

The methodology discussed in this paper facilitates the estimation of possible water savings in domestic water consumption at the household level and in new or existing urban environments, by application of ESTs for efficient and sustainable water use.
According to the findings, domestic freshwater footprints can also be significantly reduced by household centered measures for water demand management, wastewater recycling, and reuse of secondary water quality for non-drinking purposes. Achievable savings in drinking water demand are in the range of 30% to 50% compared with standard domestic water consumption. Single measures for efficient and sustainable water use can be combined in multiple ways. With the help of software tools, such as the program “Wise Water”, different system configurations can be compared regarding their effect on the total domestic water demand. Furthermore, the rainwater harvesting potential on property and city levels can be calculated and related to the total domestic water demand.
The management of locally available renewable freshwater resources in the form of rainwater retention as well as its use for the augmentation of freshwater bodies and the domestic use of surplus quantities that are not required for the maintenance of ecosystems, contributes significantly to the sustainable management of freshwater resources according to the principles of integrated water resource management [29]. Dependent on the rainfall, the properties of urban areas, and the population density, more or less rainwater can be collected locally. This water can be used for the provision of freshwater, either directly or indirectly, through the augmentation of freshwater bodies. Through effective measures for decentralized water demand management and water provision, the water footprint of cities and the related environmental, economical and social costs can be significantly reduced. The method presented for the estimation of freshwater footprints, before and after the application of ESTs, can be transferred to non-domestic environments, e.g., public and commercial buildings.
For sustainable urban water management, qualitative aspects also play an important role. An example is the separated treatment of sewage streams with different properties and the utilization of greywater with low pollutant levels for recycling and reuse of water for non-drinking purpose. The separation of sewage streams with different properties at the source facilitates decentralized treatment and reuse, a practice that is, for example, already practiced with growing tendency by water intensive industries [7]. It is already an important step towards the development of sustainable urban sanitation, which has to integrate wastewater, excreta, and waste management [7,30,31,32,33,34].
An integrated management of wastewater, excreta and waste in future cities requires a different approach and level of thinking. The increasing shortages of resources, such as freshwater and fertile soil, as well as higher prices for water, fertilizer and energy, have to be taken into account. If the focus is put systematically on the balancing of inputs and outputs of sanitation systems, as well as their potential products and values, new opportunities for effective resource management can be found [35].
Finally, it can be concluded that overall water demand side management, the separated treatment and recycling of domestic sewage streams as well as rainwater harvesting and utilization are powerful instruments for successfully coping with the challenges of scarce water resources and are an indispensible starting basis for the realization of integrated urban water resource management and for sustainable urban development.

Acknowledgments

This research was, in part, supported by a grant (11 Ubiquitous City G04) from the Construction and Transportation R&D Program, funded by the Ministry of Land, Transport and Maritime Affairs (MLTM) of the Korean Government. This work was also supported by funding received from the KORANET Joint Call on Green Technologies, www.koranet.eu.

Conflict of Interest

The authors declare no conflict of interest.

References

  1. Hutson, S.S.; Barber, N.L.; Kenny, J.F.; Linsey, K.S.; Lumia, D.S.; Maupin, M.A. Estimated Use of Water in the United States in 2000; U.S. Geological Survey: Reston, VA, USA, 2004. [Google Scholar]
  2. Environmental Protection Agency Web Page, Water supply in the U.S. Available online: http://www.epa.gov/WaterSense/pubs/supply.html (accessed on 19 December 2012).
  3. Graveland, C.; Baas, K. Savings in Groundwater and Tap Water Use. Available online: http://www.cbs.nl/en-GB/menu/themas/natuur-milieu/publicaties/artikelen/archief/2011/2011-3349-wm.htm (accessed on 27 July 2013).
  4. Schuetze, T. Dezentrale Wassersysteme im Wohnungsbau internationaler Großstädte am Beispiel der Städte Hamburg in Deutschland und Seoul in Süd-Korea; [in German]; Books on Demand: Norderstedt, Germany, 2005. [Google Scholar]
  5. Core Writing Team; Pachauri, R.K.; Reisinger, A. Climate Change 2007: Synthesis Report; Intergovernmental Panel on Climate Change: Geneva, Switzerland, 2007. [Google Scholar]
  6. UN-Habitat, Water and Sanitation in the World’s Cities: Local Action for Global Goals; UN-Habitat: London, UK, 2003.
  7. Schuetze, T.; Tjallingi, S.P.; Correlje, A.; Ryu, M.; Graaf, R.; van der Ven, F. Every Drop Counts: Environmentally Sound Technologies for Urban and Domestic Water Use Efficiency, 1st ed.; United Nations Environment Programme: Nairobi, Kenya, 2008. [Google Scholar]
  8. EMC—Environmental Management Centre, Wise Water—A Microsoft ExcelTM Based Spreadsheet Application, 1st ed.; UNEP—United Nations Environment Programme: Nairobi, Kenya, 2008.
  9. Seoul Metropolitan Government, Seoul Water Works Report 2002; Seoul Metropolitan Government: Seoul, Korea, 2003.
  10. Hamburger Wasserwerke HWW, Rohwasserförderung 2001; [in German]; Hamburger Wasserwerke HWW: Hamburg, Germany, 2002.
  11. Foekema, H.; van Thiel, L.; Lettinga, B. Watergebruik Thuis 2007; [in Dutch]; Vewin—Vereniging van waterbedrijven in Nederland: Amsterdam, The Netherlands, 2008. [Google Scholar]
  12. Demirir, M.; Seelig, R. Eine vergleichende Untersuchung über die Spüleigenschaften ausgewählter Klosettbecken für öffentliche Sanitäranlagen; [in German]; Laboratory for Sanitation Technology, University of Applied Sciences Gelsenkirchen: Gelsenkirchen, Germany, 2000. [Google Scholar]
  13. Harrison, J. UA Study Shows Leaks in Conservation Theory Behind Low-Flow Toilets. Available online: http://uanews.org/node/3810 (accessed on 16 February 2013).
  14. Kamiya, H. Aim of “AIJ Guideline for RWH” and Practical Case Study. In Proceedings of the 3rd IWA Rainwater Harvesting Management International Conference, Goseong County, Korea, 20-24 May 2012; International Water Association Gyeongnam: Goseong County, Korea, 2012; pp. 77–79. [Google Scholar]
  15. Ward, S.L. Rainwater Harvesting in the UK: A Strategic Framework to Enable Transition from Novel to Mainstream. Ph.D. Thesis, University of Exeter, Exeter, UK, 27 April 2010. [Google Scholar]
  16. Marsalek, J. Rainwater Harvesting in Canada and the USA: Policies and Regulation. In Proceedings of the 3rd IWA Rainwater Harvesting Management International Conference, Goseong County, Korea, 20–24 May 2012; International Water Association: Goseong County, Korea, 2012; pp. 80–82. [Google Scholar]
  17. Kim, R. Rainwater Management Policy and Regulation in Korea. In Proceedings of the 3rd IWA Rainwater Harvesting Management International Conference, Goseong County, Korea, 20–24 May 2012; International Water Association: Goseong County, Korea, 2012; pp. 87–88. [Google Scholar]
  18. Liaw, C.-H. Integrating Rainwater into Stormwater Management in Metropolitean Taipei. In Proceedings of the 3rd IWA Rainwater Harvesting Management International Conference, Goseong County, Korea, 20–24 May 2012; International Water Association: Goseong County, Korea, 2012; pp. 83–85. [Google Scholar]
  19. Vlaamse Milieumaatschappij. Waterwegwijzer Bouwen en Verbouwen; [in Flemish] Building Code by the Ministry of Environment—Vlarem II (Article 6.2.2.1.2.). Vlaamse Milieumaatschappij: Brussels, Belgium, 2010. Available online: http://www.vmm.be/water/waterwegwijzerbouwen (accessed on 26 July 2013).
  20. DIN—Deutsches Institut fuer Normung e.V, DIN 1989-1 Rainwater Harvesting Systems; DIN: Berlin, Germany, 2002.
  21. König, K.W. The Rainwater Technology Handbook: Rainharvesting in Building; Wilo-Brain: Dortmund, Germany, 2001. [Google Scholar]
  22. Lange, J.; Otterpohl, R. Abwasser—Handbuch zu einer Zukunftsfähigen Wasserwirtschaft; [in German]; Mall: Pfohren, Germany, 2000. [Google Scholar]
  23. Jiménez, B. Turning brown water into green produce: Wastewater reuse in 22 Nicaraguan cities. J. Water Reuse Desalin. 2011, 1, 185–201. [Google Scholar] [CrossRef]
  24. Jiménez, B.; Asano, T. Water Reclamation and Reuse around the World. In Water Reuse: An International Survey of Current Practice, Issues and Needs; Jiménez, B., Asano, T., Eds.; IWAP: London, UK, 2008; pp. 3–26. [Google Scholar]
  25. Seoul Metropolitan Government Web Page. Energy Saving News. Available online: http://english.seoul.go.kr/gtk/news/energy_view.php?idx=18995&cPage=3& (accessed on 27 July 2013).
  26. Seoul Metropolitan Government, The Present Situation of Habitats in Seoul and the Demand for Ecological City Development; Seoul Metropolitan Government: Seoul, Korea, 2000.
  27. Seoul Metropolitan Government Web Page. Facts. Available online: http://english.seoul.go.kr/gtk/about/fact.php (accessed on 27 July 2013).
  28. Umweltbehörde Hamburg, Umweltatlas Hamburg 1997; Umweltbehörde Hamburg: Hamburg, Germany, 1997.
  29. Global Water Partnership Technical Advisory Committee, Integrated Water Resource Management; Global Water Partnership: Stockholm, Sweden, 2000; Volume 4.
  30. Durchschlag, A.; Hartel, L.; Hatwig, P.; Kaselow, M.; Kollatsch, D.; Otterpohl, R.; Schwentner, G. Joint consideration of combined sewerage and wastewater treatment plants. Water Sci. Technol. 1992, 26, 1125–1134. [Google Scholar] [CrossRef]
  31. Rauch, W. Some General Aspects on Modelling Integrated Urban Drainage Systems. In Proceedings of the Impact of Urban Runoff on Wastewater Treatment Plants and Receiving Waters, 9th European Junior Scientist Workshop, Kilve Somerset, UK, 9–13 April 1996; Schuetze, M., Ed.; Foundation for Water Research: Buckinghamshire, UK, 1996; pp. 79–84. [Google Scholar]
  32. Schuetze, M.R. Integrated Simulation and Optimum Control of the Urban Wastewater System. Ph.D. and D.I.C. Thesis, Department of Civil Engineering, Imperial College, University of London, London, UK, 1998. [Google Scholar]
  33. Schuetze, T.; van Loosdrecht, M.M. Urine Separation for Sustainable Urban Water Management. In Water Infrastructure for Sustainable Communities: China and the World; Hao, X., Novotny, V., Nelson, V., Eds.; IWA Publishing: London, UK, 2010; pp. 213–225. [Google Scholar]
  34. UNESCO-IHP, Capacity Building for Ecological Sanitation; UNESCO-IHP: Paris, France, 2006.
  35. Lüthi, C.; Panesar, A.; Schuetze, T.; Norström, A.; McConville, J.; Parkinson, J.; Saywell, D.; Ingle, R. Sustainable Sanitation in Cities—A Framework for Action, 1st ed.; Papiroz Publishing House: The Hague, The Netherlands, 2011. [Google Scholar]

