Article

Recovery of N and P from Urine by Struvite Precipitation Followed by Combined Stripping with Digester Sludge Liquid at Full Scale

by
Nicolás Morales
1,2,
Marc Anton Boehler
1,*,
Sandra Buettner
3,
Christoph Liebi
4 and
Hansruedi Siegrist
1
1
Eawag, Swiss Federal Institute of Aquatic Science and Technology, Duebendorf 8600, Switzerland
2
Department of Chemical Engineering, Institute of Technology, University of Santiago de Compostela, Santiago de Compostela, Galicia 15782, Spain
3
Ingenieurbüro Gujer AG, Ruemlang CH 8153, Switzerland
4
WWTP Abwasserreinigung Kloten-Opfikon, Opfikon CH-8152, Switzerland
*
Author to whom correspondence should be addressed.
Water 2013, 5(3), 1262-1278; https://doi.org/10.3390/w5031262
Submission received: 12 June 2013 / Revised: 8 July 2013 / Accepted: 12 August 2013 / Published: 29 August 2013

Abstract

:
A novel ammonia stripping method, including a CO2 pre-stripper was used to treat a mix of supernatant liquor from an anaerobic digester and urine in order to recycle nitrogen as ammonium sulfate at full-scale in the WWTP Kloten/Opfikon. Waste streams were not generated, since the ammonia was recovered as a marketable nitrogen fertilizer, turning a waste product into a valuable product. The efficiency of this system was increased by means of the addition of pre-treated urine collected separately at EAWAG building. The separation step was performed by the use of water free urinals and urine diversion flush toilets. An increase of 10% in the liquid flux with the addition of the urine translated into a 40% increase of the ammonia concentration in the inlet of the stripping unit. The achievement of these percentages generated a proportional increase in the fertilizer production. The urine pre-treatment was carried out by adding magnesium to produce a precipitate of struvite. The first experiments with the combined treatment showed the feasibility of the combination of the separation and pre-treatment steps.

Graphical Abstract

1. Introduction

The industrial production of fertilizers containing nitrogen and phosphorous increased by 600% between 1950 and 2000 [1], reaching a rate of 100 million tons of nitrogen per year [2]. Modern agriculture is highly dependent on phosphorus, which is derived from phosphate rock, a non-renewable resource whose global reserves might be depleted in 50–160 years [3,4,5,6]. On the other hand, nitrogen and phosphorus contained in wastewaters are the primary causes of environmental eutrophication in surface waters [7]. Dodds et al. [8] have estimated the annual cost of eutrophication in the United States in $2200 million. There are many efforts to break this trend, as for example the EU directive 91/676/EWG of the European Community [9]. Both problems, nutrients depletion and eutrophication, can be reduced at the same time by the application of technologies for recovering nutrients out of wastewater streams. Recycled sludge liquid from anaerobic digesters and separated collected urine are two wastewater streams of particular interest for nutrients recovery due to the high concentrations of nitrogen and phosphorus in relatively low flows. Percentages of nutrients present in chemical fertilizers that can be substituted by those recovered from wastewater vary and depend on several factors, one being whether a country has a net import or export of food [10]. In this way, Norway can substitute 15%–20% of its mineral fertilizer [11] while, according to Etnier and Jenssen [12], more than 40% of the nutrients present in chemical fertilizers could be substituted by nutrients recovered from wastewater in developing countries.
Even if nitrogen can be recovered from wastewater using different techniques, until now, most of the WWTP have implemented some kind of denitrification processes that imply the loss of nitrogen by returning it to the atmosphere as N2 gas [13]. Nowadays, only around 10 pre treatment plants in Europe are using the air stripping process and produce fertilizer in form of ammonium sulphate. As nitrogen is not a finite resource, the economic and energetic balance has to be taken into account when the stripping alternative is evaluated. In this way, the combination of industrial ammonia production (around 30 MJ/kg Nproduced and 0.20 €/kg Nproduced) [14] plus nitrogen removal via Sharon/Anammox process (around 14 MJ/kg Nremoved and 3 €/kg Nremoved, including amortization and energy costs) [15] is still economically more favorable than ammonia recovery, as free ammonia air stripping processes require 40–50 MJ/kg Nrecovered (including primary energy for chemical production and excess heat of WWTP) and costs are about 6 €/kg Nrecovered [15]. Energy consumption and costs for the base are a significant part of the overall operational costs in the stripping process. Consequently, an improvement of the stripping process efficiency and the economic exploitation of the by-products (fertilizers costs around 1.2 €/kg N) [14] can reverse the situation. An alternative to reduce costs is the use of a CO2-pre-stripper column, prior to the stripping reactor. Ammonium and bicarbonate are partly transformed to the gaseous components free ammonia and carbon dioxide. The latter can be stripped in a first stripper column with significantly lower air flow requirements than those of the ammonia stripper and therefore, no more than 2%–3% of the free ammonia will be lost in the off-gas. That is due to the fact that Henry’s law constant for free ammonia (HNH3) is much lower than that for CO2 (HCO2), 0.0006 and 1.1 at 20 °C respectively [16]. After the additional CO2 stripping column, 50% of the nitrogen is in the form of NH3, reducing the total amount of alkali needed for the ammonia removal by 50% [17] as the pH of the anaerobic digestion effluent is increased from about 7 to 9 by CO2 stripping [18]. Extra investment costs for the CO2-stripper can be compensated by the decrease of alkali demand. In this way, if the specific benefit for the recovered N could be increased to 1 €/kgNrecovered, the specific treatment costs would decrease by about 20% [15].
Similar to the case of nitrogen, different treatment technologies are commonly applied in wastewater treatment plants in order to remove the phosphorus [19]. Most of these processes produce wastes, which need to be land filled or incinerated [20]. Another option is the recovery of phosphorus as a by-product by means of crystallization processes where minerals with application in agriculture as fertilizers are produced: struvite (NH4MgPO4·6H2O) or hydroxyapatite [Ca5(PO4)3OH].
Until now, the recovering costs as precipitates are higher than the current production costs derived from mineral extraction. Nevertheless, the phosphorous recovery seems to be favorable in order to meet the aims of sustainability. Shu et al. [21] indicated that struvite production is technically feasible and economically beneficial. Up to 50% of the total phosphate load in municipal wastewaters comes from urine, which represents only 1% of the total volume of wastewater [22]. The benefit of the selective collection and separated treatment of this high loaded stream from domestic wastewater is not only the economic profit of the struvite, being the potential income around 1.5 € per m3 of urine [14], but also the advantages in the operation of wastewater treatment plant: the reduction of many problematic micropollutants, the removal of one of the main nitrogen contributions and the reduction of the volume necessary for the nitrification/denitrification process. By separating only 50% of the urine, the use of compact and energy-efficient treatment technologies without nitrification, denitrification, and phosphorus removal is possible. In this way, the remaining nutrients are removed through the produced sludge [23].
The combination of urine and sludge liquid from the anaerobic digester in an ammonia stripping reactor, including a CO2 pre-stripper can increase the overall nitrogen removal efficiency and the fertilizer production of the wastewater treatment plant. Thus, the objectives of the present work were the evaluation of the pretreatment of the separately collected urine produced in EAWAG and its further co-treatment in a stripping system where the sludge liquid from an anaerobic digester was treated. The urine pretreatment consisted of a precipitation step by reagents addition (magnesium) at pilot-scale. Reaction time and magnesium addition was evaluated in a pilot-scale reactor, and the precipitates produced were characterized in terms of composition and crystal size. The stripping process was performed in a full-scale plant comprising a CO2 pre-stripper unit followed by an ammonia stripping system and a subsequent ammonia sulphate recovery unit.

2. Materials and Methods

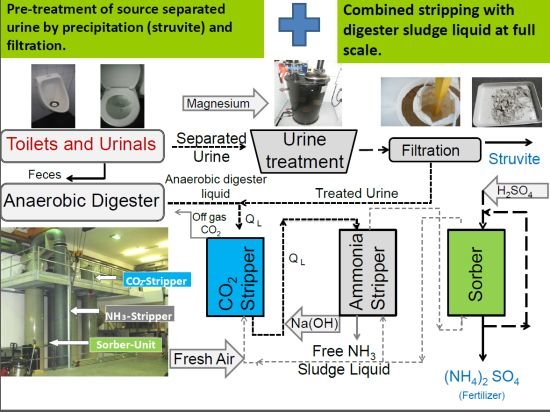
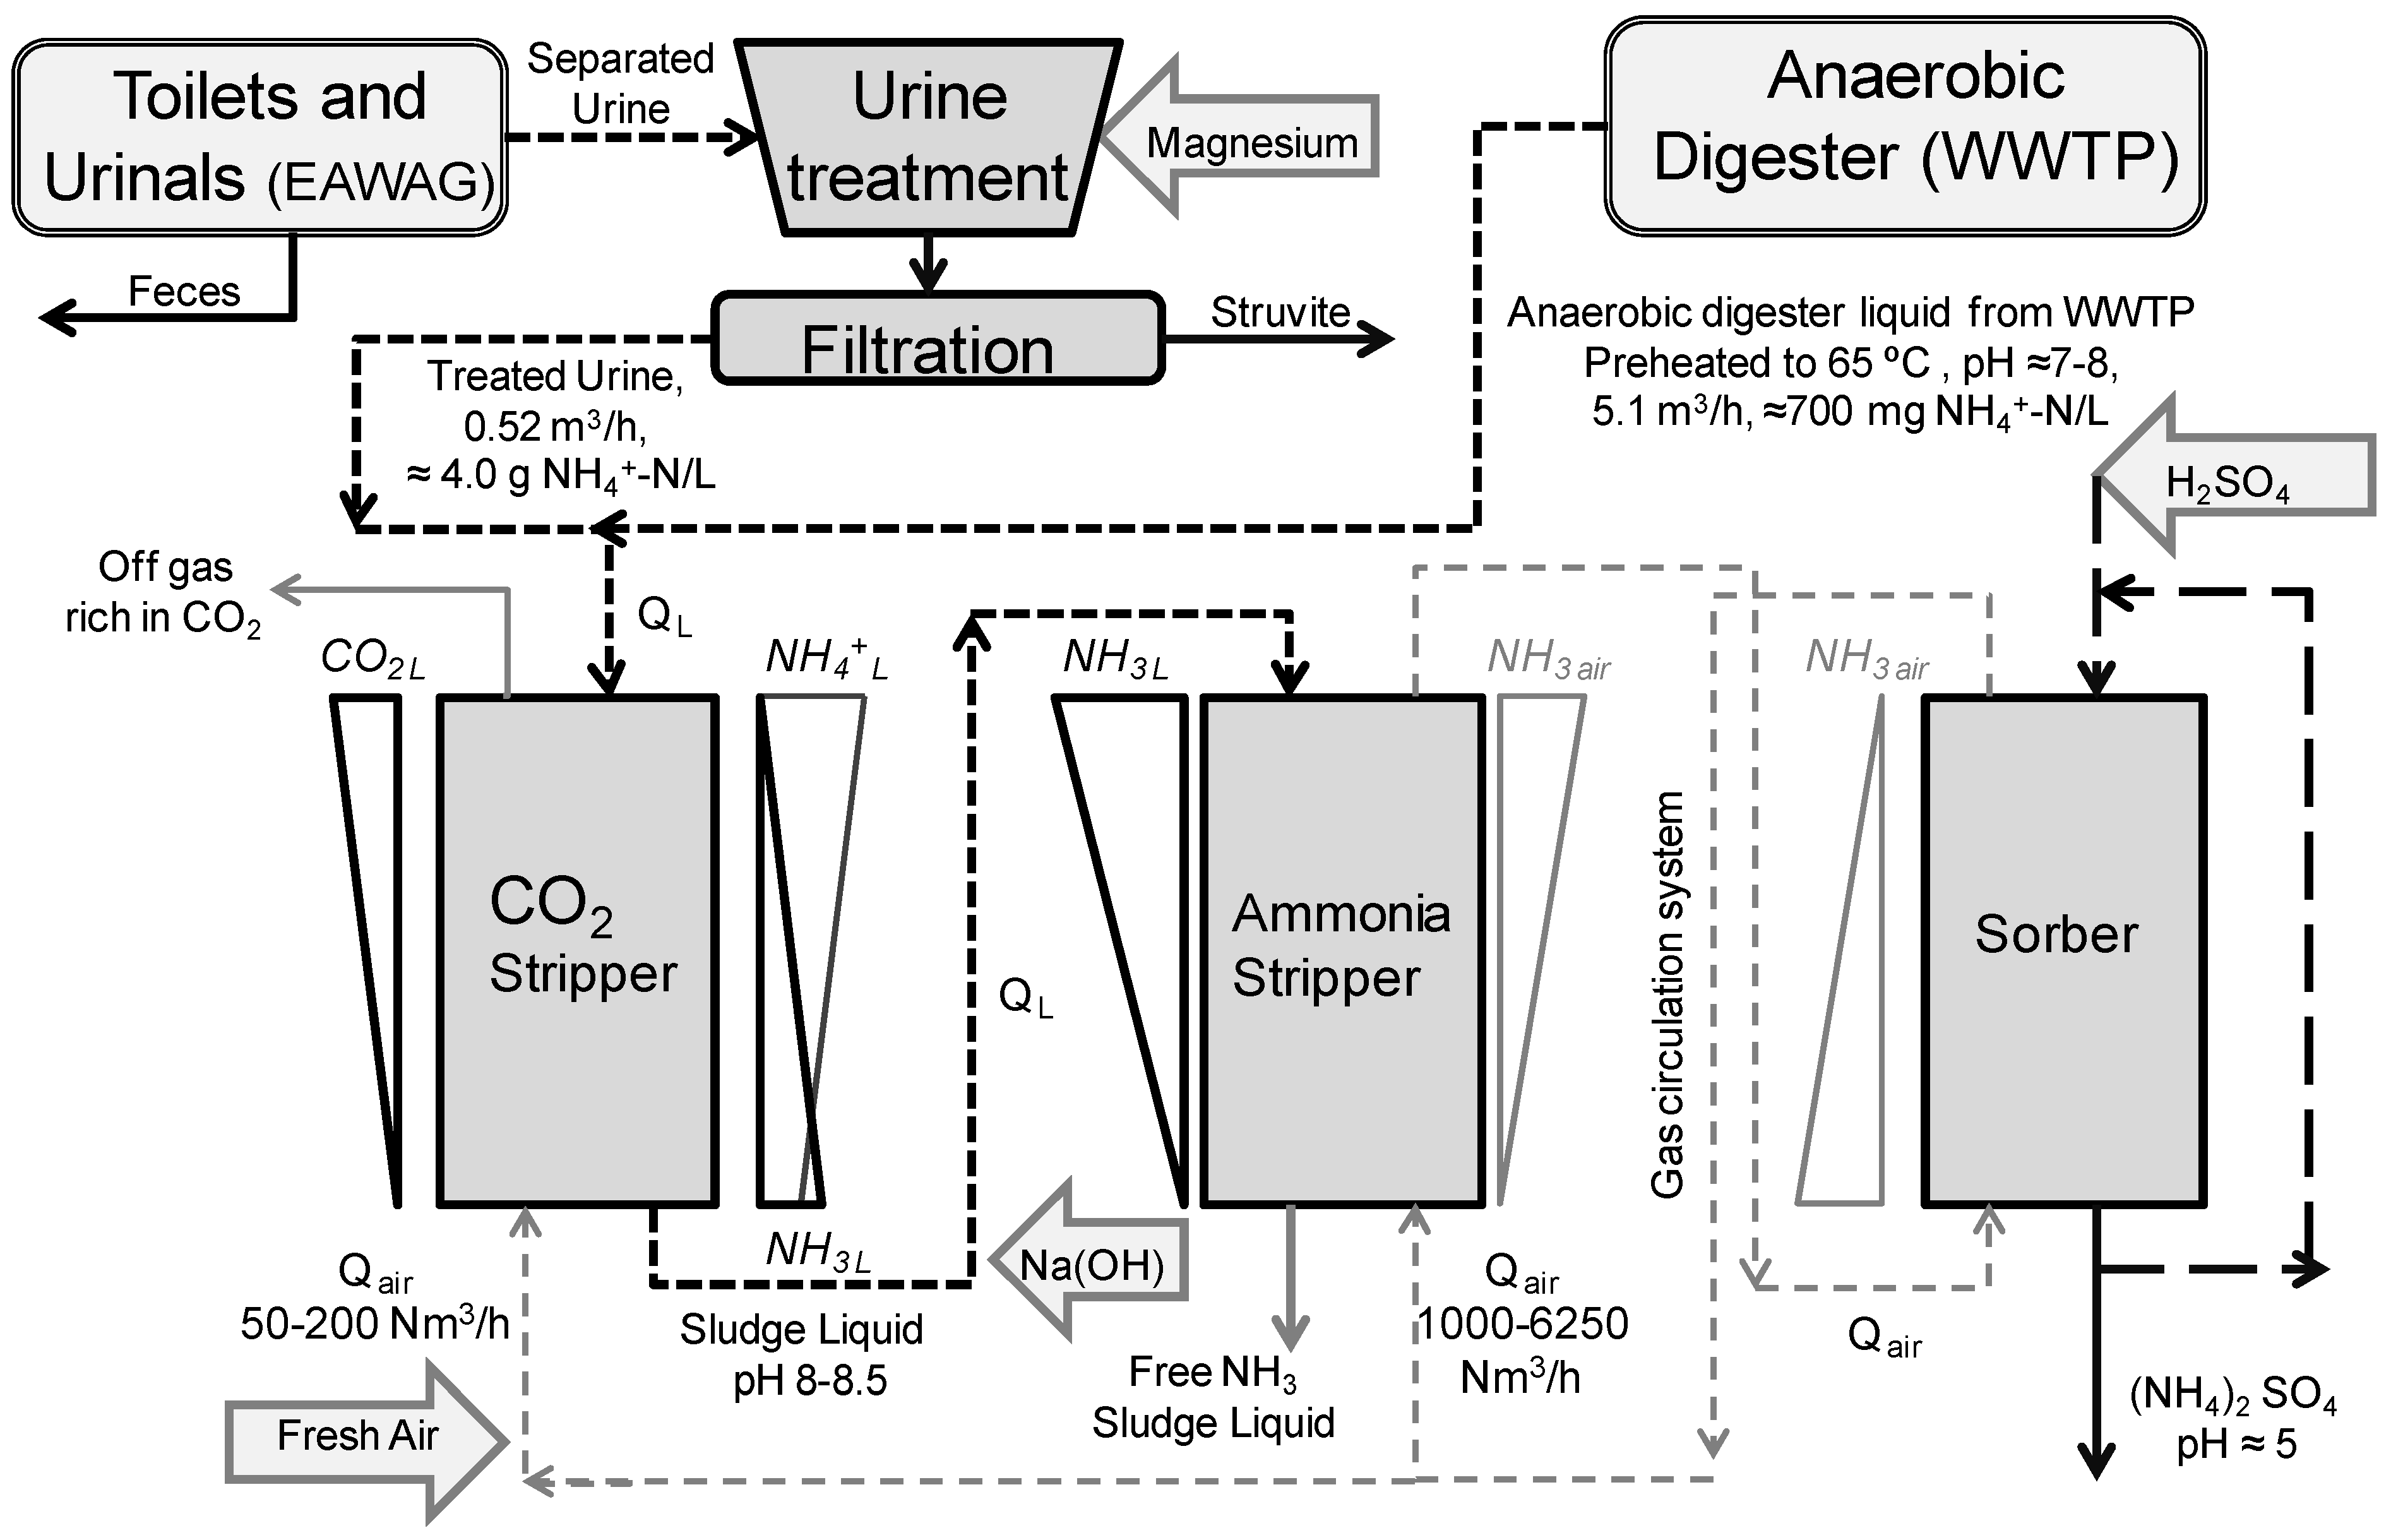
2.1. Urine Separation, Storage and Treatment

Separated urine from the No-Mix toilets (Roediger, Vacuum GmbH, Hanau, Germany ) (male and female) and water free urinals (Minimax, HellBrok GmbH, Axams, Austria) was collected during several weeks. Urine was stored in the basement of the EAWAG office building, in a 600 L water- and odor-tight storage tank equipped with an overflow outlet, stirring mechanism, level sensor, sampling points and a pump to remove the effluent located at the bottom of the tank. The storage tank was also used as reactor for the urine treatment (struvite precipitation). After reaching a level of approximately 80% of the capacity of the storage tank a pre-defined dose of magnesium was added at the top of the tank. Seven tanks of urine with the characteristics showed in Table 1 were collected and treated during the experimental work. Each tank in Table 1 represented the urine collected approximately in one week. The reaction time and optimal dose of magnesium were determined based on laboratory scale batch experiments performed with stored urine samples from the storage tank. The reactor mixing started at least 10 min before the addition of magnesium and it was working during the whole process (reaction and emptying). The magnesium was added in different ways: MgO in powder, MgO pre-solved in 5 L of water and 15, 30 and 50% of the stoichiometric amount of HCl and in 100% of the stoichiometric amount of H2SO4, as it is indicated in Table 1. The minimum mixing period applied was of 30 min after the addition of the magnesium. Samples were taken from the sample port located at the middle height of the reactor tank and filtered immediately (0.45 µm pore size) in order to follow the phosphorus removal from the urine. Then, the treated urine was transferred using the effluent pump and transfer to a 1 cubic meter plastic container. Filter bags of 81 cm × 18 cm and 0.5 m2, made of Nylon Monofilament (BNM-050 and BNM-100, Infiltec GmbH, Speyer am Rhein, Germany), with a pore size of 50 µm and 100 µm, respectively were used for the separation of the solids from the treated urine. The filter bags were placed over the input port of the plastic container at the moment of the removal of the treated urine from the reactor in such a way that the urine passed through them while charging the plastic container. In some experiments, a pre filtration with the 100 µm filter bag was applied before the filtration with the 50 µm filter bags. Filtered urine was transported from the EAWAG to the WWTP in the plastic containers and then mixed with the sludge liquid before entering the stripping treatment by a flow controlled pump station in the stripping experiments I and II.
Table 1. Reagents addition in the urine treatment experiments, concentrations of N and P in the stored urine and volume treated in each experiment.
ParameterTank 1Tank 2Tank 3Tank 4Tank 5Tank 6Tank 7
Mg SourceMgO + (15%) HCl MgO + (30%) HCl MgO + H2SO4MgO + (50%) HCl MgOMgOMgO
PO4−3-P (mg/L)166.8 ± 0.4156.0 ± 0.3187.2 ± 0.4194.1 ± 0.3167.8 ± 0.2174.4 ± 1.0 174.4 ± 1.0
NH4+-N (mg/L)3200 ± 503900 ± 2904990 ± 2374930 ± 1993780 ± 133
Volume (L)600 ± 10480 ± 10510 ± 10510 ± 10430 ± 10430 ± 10510 ± 10

2.2. Ammonia Air Stripping Process Including a CO2 Pre-Stripper

The full-scale stripping reactor including a CO2 pre-stripper was located in the Kloten/Opfikon Wastewater Treatment Plant (60000 population equivalent, Glattbrugg, Switzerland). It was the first of these reactors installed in Switzerland [15]. The ammonia stripping process was set in operation for the first time in fall 2010. Some of the characteristics of the stripping reactor are summarized in Table 2. A scheme of the overall process is shown in Figure 1, including the stripping columns, and the urine co-treatment [24]. Both stripping columns use special UV-stabilized Fluorpolymere packing with a honeycomb shape (CF 12F, Hewitech GmbH & Co, Ochtrup, Germany). This material has 12 mm of channel opening, a specific surface of 300 m2/m3 and a cross-flow channel structure. The ammonium rich stream is fed by the top of the CO2-pre stripper where air is fluxed in counter flow. The CO2 stripping increases the pH of the liquid due to the displacement of carbonic acid system equilibrium [25]. In order to avoid a CO2 accumulation in the column, CO2 rich gas is discharged after this unit, and fresh air is provided. Sodium hydroxide (NaOH solution at 50%, 1.524 kg/L, Thommen-Furler AG, Büren, Switzerland) is used to increase the pH of the liquid in the ammonia stripper up to a fixed value to favor the equilibrium displacement towards the NH3, as showed in Equation (1):
Water 05 01262 i001
This liquid is fed by the top of the stripper reactor, where the ammonia solved in the liquid phase is stripped to the gas phase. Then, the ammonia rich gas is washed in the sorber unit using a sulfuric acid solution (H2SO4 at 32% solution, 1.16 kg/L, Thommen-Furler AG, Büren, Switzerland) and ammonia sulphate is recovered as the end product, following Equation (2). The gas washing is done until a solution with a density of 1.2 kg/L is obtained.
Water 05 01262 i002
The stripping factor (S) describes the balance between gas and water at the upper end of the stripping column. The minimum required amount of air (QAir) in relation to the supernatant (QLiquid) is in accordance with Equation (3) [17] to be at least 1/HNH3 where HNH3 is the NH3 Henry’s constant.
Water 05 01262 i003
The operation QAir/Qliquid ratio used in the air stripping unit was in the range of 700–750 Nm3/m3 at 60 °C, while higher air to liquid ratios resulted in higher electricity consumption [24]. Values for Henry’s coefficients at different temperatures were determined following Crittenden et al. [16]. Acid cleaning of the stripping reactor is executed daily using hydrochloric acid at pH 0–2 (HCl at 35%, Thommen-Furler AG, Büren, Switzerland) with an automated pH control.
Table 2. Dimensions and operational conditions of the stripping system.
ParameterValueUnits
Column height (CO2 and Ammonia)10 m
Packing bed height6 m
Diameter0.98 m
Liquid inflow5–12 m3/h
Air flow to the ammonia stripper1000–6250 Nm3/h
Gas flow to the CO2 stripper50–200 Nm3/h
Average NH4+-N concentration inlet1000 mg/L
Average NH4+-N concentration effluent30 mg/L
Maximum removal rate99%
Treated urine was dosed to the stripping treatment system in a percentage of 10% of the liquid sludge flux, which accounted for approximately 525 L/h in experiment I and II, while the sludge liquid flux was maintained around 5.1 m3/h. In experiment I the air flow in the stripping reactor was adjusted to 3600 Nm3/h, the pH to 9.3 and the temperature to 60 °C, which were the operation conditions used by the WWTP operators at the time of the experimental work. Experiment II was divided in stages with different conditions of pH and air flow as it is shown in Table 3, while temperature set point remained at 60 °C.
Table 3. Sample conditions and times during experiment II.
Parameter Stage IStage IIStage IIIStage IV
Time (min)02543758995125162178179195210211235
SamplingXXXXXXXXXXX
Urine additionXXXXXXXXXXXX
Modification in the operational conditionsXXX
pH set point9.39.59.09.3
Air flux (Nm3/h)3900390039003900
Note: Sampling, urine addition or modification in the operational conditions were performed at times indicated by “X”.
Figure 1. Flow-chart of the co-treatment of sludge liquid and treated urine.
Water 05 01262 g001

2.3. Chemical and Crystals Analysis

Filtered urine (0.45 µm PET/GF) was used to measure the concentration of (ortho-) phosphate and ammonium with Lange cuvette tests (Hach Lange, GmbH, Düsseldorf, Germany). Magnesium and calcium concentrations were measured with ion chromatography. The pH of the samples was measured using a pH meter (WTW 340 i, Wissenschaftlich-Technische Werkstätten GmbH, Weilheim, Germany). The composition of the solids (NH4+-N, PO43−-P, Mg2+ and Ca2+) was measured from solid samples recovered with the filter bags. These samples were previously dried (40 °C in a heater) and powdered. Then the analysis was performed with an amount of 0.05 g, which was dissolved in 1 mL of HCl (32%) and 25 mL of H2O. Taking into account the magnesium added and the stoichiometric composition of struvite, the theoretical amount of struvite formed during the experiment was calculated. Then the PO43− and Ca2+ in excess per mol of struvite formed and the calcium phosphate [Ca3(PO4)2] that could be produced with such excess was calculated. Microscopy images of the formed crystals were taken with a Scanning Electron Microscopy (Nova NanoSEM 230, FEI Company, Hillsboro, OR, USA) equipped with a high resolution field emission-SEM column, operated in low vacuum mode and equipped with a gaseous analytical detector (TV-rate low vacuum Solid-State BSED). Previously, the samples of the precipitate were filtered thought nuclepore filters and rinsed with nanopure water, in order to remove organics and salts. Crystal’s size measurements were performed with a “Mastersizer 2000” (Malvern Instruments Ltd., Worcestershire, UK) with a measuring range from 0.02 µm to 2000 µm.

2.4. Chemical Cost, Electricity and Fertilizer Price

Price of chemicals and electricity cost for year 2011 (Table 4) were obtained from the WWTP data in Swiss Francs (CHF) [26], and the fertilizer price was calculated in relation with the average price of the ammonium nitrate in the last three years and the price of ammonia sulphate in the last year using data from the Swiss Farmers Association [27], following Equation (4):
Water 05 01262 i004
Table 4. Chemical, electricity and fertilizer price.
YearElectricity (CHF/kWh)NaOH (CHF/kg)H2SO4 (CHF/kg)HCl
(CHF/kg)
NH4NO3
(CHF/100 kg)
(NH4)2SO4
(CHF/1000 kg)
20110.10.360.230.5250.6
2010169.6350.0
2009199.95
2008231.83
2007162.49

3. Results and Discussion

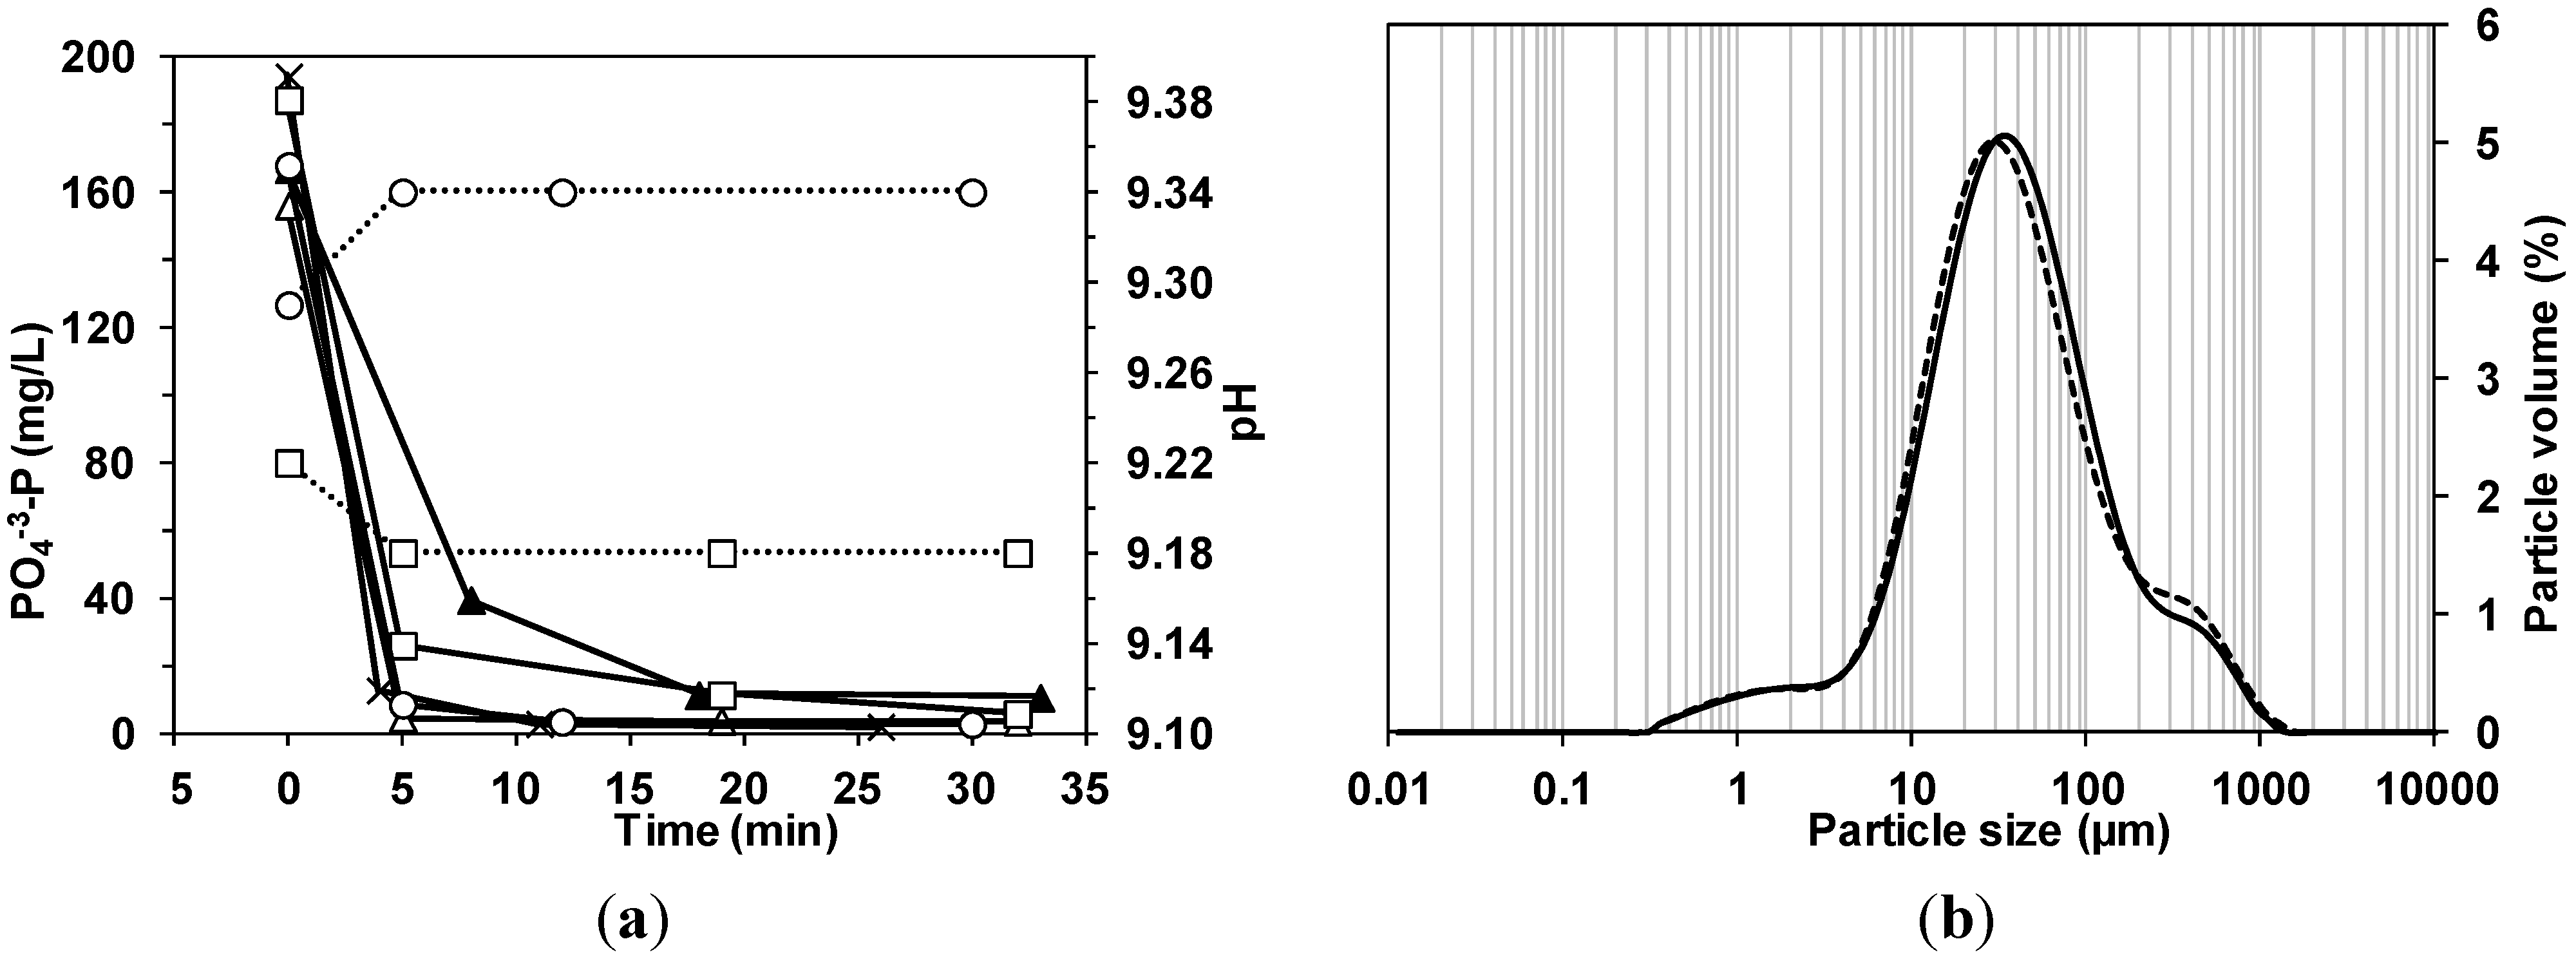
3.1. Magnesium Dose and Reaction Time Determination. Urine Pre-Treatment

An important part of the phosphorus concentration present in the urine was already precipitated in the storage tank, and the measured values for phosphorus concentration before the magnesium addition were around 150 mg P/L–200 mg P/L (Table 1). Literature values for phosphorus concentration in fresh human urine samples are about 740 mg P/L [28]. However, in the storage tank, that value can be reduced to 76 mg P/L due to the ureolysis (urea is hydrolyzed to ammonia by naturally-occurring bacteria) and subsequent struvite precipitation [29], while total phosphate precipitation is limited by the lack of magnesium.
A minimum magnesium to phosphorus ratio of 1.2 was determined after laboratory scale precipitation experiments: similar results to that obtained by Abegglen [30] and Tettenborn et al. [31] and higher than that obtained by Wilsenach et al. [22]. However, these authors used synthetic urine. Finally, a ratio of 1.4 was used in order to guarantee a complete removal in the stored urine tank.
Ronteltap et al. [32] obtained precipitation after 5 min–10 min of stirring when using MgCl2 as a magnesium source, however, Abegglen [30] needed 60 min to complete the reaction and suggested that the reason was the slow dissolution rate of MgO used in his experiment. MgO is poorly soluble in water (0.086 g/L) but sufficiently soluble in high-strength solutions (digester supernatant, urine). In the present study, magnesium was added in different ways (in powder and solved in acid) to the tank scale experiments, in order to check the effect of the magnesium solubility in the stored urine (Table 1).
The phosphorus concentration in the tank scale experiments after the magnesium addition was quite similar (Figure 2a). After 30 min of reaction, more than 95% of P was removed from the stored urine in all the experiments. There were no significant differences between the experiments where the MgO was added pre-dissolved in acid solution, and the experiments where the MgO was added directly as powder. Differences in the reaction rates of the tested magnesium precipitants might be observed with more frequent and faster measurements. However, for practical purposes, the simpler and more economical approach seems to be the use of magnesium oxide in powder form, as no extra chemicals are required and obtained results were equivalents after a reaction time of 30 min.
Figure 2. (a) Evolution of phosphorus concentration (─) and pH (···) values in the reactor in the experiments: Tank 1 (▲), Tank 2 (△), Tank 3 (), Tank 4 (×) and Tank 5 (〇); (b) Crystal size distribution of particles in Tank1, before the addition of magnesium (─) and at the end of the experiment (···).
Water 05 01262 g002
pH of fresh urine samples collected in the inflow of the urine storage tank was around 7.2, the same value observed by Udert et al. [29], but that value rose in the storage tank to values around 9.1–9.3 due to the ureolysis (Udert et al. [29] obtained a pH of 9.0 in stored urine). The precipitation experiments showed that the pH rose by 0.04 units after MgO addition in powder and dropped 0.04 units if MgO was pre-solved in acid, in consequence, no significant pH variations were produced by the reagent addition.
Regarding the formed precipitates, the size of the crystals in samples from Tank 1 was measured, before and after magnesium addition. In Figure 2b, the particle size distribution in terms of volume percentage of both samples is compared. The average size of the crystals in the raw urine was about 75.3 µm (with a standard deviation of 123.9 µm). After the reaction, the average size increased slightly and reached a value about 79.3 µm (standard deviation 137.2 µm), with almost the same size distribution as in the initial sample. The average size of the crystals in the experiments Tanks 2–6 varied between 42.5 and 79.3 µm with a similar crystal size distribution to that obtained in Tank 1. The size of the crystals formed are in the range obtained by other authors, in this way Ronteltap et al. [33] observed that under the conditions typically found in hydrolyzed urine, larger crystals cannot be easily formed, leading to rather limited crystal sizes typical for struvite precipitation in urine (36–136 µm). These authors observed that there was no significant time dependent shift recognizable in the particle size, once the magnesium was added to the urine. It is necessary to take into account that solids were presented in the storage tank even before the addition of magnesium; the elemental composition of these crystals determined with the gaseous analytical detector corresponded with magnesium ammonium phosphate (struvite) and with calcium phosphates. Some of the struvite crystals showed the typical coffin shape [34], but there were no x-shaped branched crystals (Figure 3). It is possible that the mixing speed in the reactor avoided the formation of big crystals, and some crystals seem to be fragments of bigger crystals. In terms of further application as fertilizers, different struvite morphologies have been shown to have distinct dissolution kinetics while chemical differences may also affect solubility and phosphorus availability over time as the materials dissolve [35]. Struvite particle size affects the nitrogen release in the first weeks after planting; smaller particle sizes released more nitrogen [36]. However, the mentioned study was conducted with larger particle’s sizes (>2 mm) than the obtained in the present experiments. It was also possible to distinguish the typical clusters of calcium phosphate in the samples from raw stored urine (Figure 3b). The composition of the solids (in terms of NH4+-N, PO43−-P, Mg2+ and Ca2+) recovered from the filters is shown in Table 5. It is important to emphasize the significant amount of Ca2+ found in the solid samples which suggested that the solids recovered from the filter bags were not 100% struvite. Calcium is a major interfering ion affecting the deposit composition, decreasing struvite purity [37]. However, calcium increases the recovery and precipitation efficiency due to a phosphorus co-precipitation as struvite and calcium phosphates [38].
Table 5. Composition of solids in mg of compound per gram of solid. Excess of PO43− and Ca2+ consumed and Ca3(PO4)2 produced per mol of struvite.
SampleComposition mg/g solid mol/molstruvite
NH4+PO43−Mg2+Ca2+ PO43−Ca2+Ca3(PO4)2
Sample 1 (Tanks 1 and 2) 52.1367.767.055.0 0.400.500.17
Sample 2 (Tanks 2 and 3)57.2376.975.044.5 0.290.360.12
Sample 3 (Tanks 4 and 5)55.3370.871.045.5 0.340.390.13
Sample 4 (Tank 6)63.6380.080.027.0 0.220.210.07
The theoretical production of struvite after the addition of magnesium in the urine collected in Tanks 1–6 was around 4.2 kg (2960 L with an average of 180 mg PO43−-P/L). Using the theoretical concentrations of phosphorus, magnesium and calcium in fresh urine [31] the theoretical maximum values of struvite (3 kg) and calcium phosphate (1.5 kg) that would be produced in the urine was determined. In the present work, the weight of solids actually recovered from the filter bags after grinding was about 3.2 kg, including solids formed before the magnesium addition, which is clearly lower than the calculated theoretical values. The solids recovery system needs to be improved in order to retrieve a higher percentage of nutrients.
Figure 3. Scanning Electron Microscopy images of crystals in the reactor.
Water 05 01262 g003
From the previous results, it is inferred that the main objectives of the present work which were the urine pre-treatment to remove the phosphate and to prevent precipitation in the stripping column together with the characterization of the formed crystals were achieved. The maximization of the P rich solids recovery was not the objective because the experiments were accomplished in a reactor (storage tank) with a non optimized filtration system. A full-scale reactor equipped with an automatic filter system should be designed for the continuous application of the urine pretreatment, as the recovery of phosphorous as struvite can have a high economic and environmental potential benefit, and probably can cover part of the investment costs for the urine separation and pre-treatment infrastructure. One option can be the scale up of the system used by Abegglen [30] for decentralized wastewater treatment in a 4-person household. In addition, the magnesium source can be changed to other products with lower cost, as was remarked by Etter et al. [39].

3.2. Ammonia Stripping with Sludge Liquid and Treated Urine

Two experiments were performed in order to study the effect of the addition of a mix of urine and sludge liquid from the anaerobic digestion in the stripping unit. The temperature of the experiments was the value fixed by the WWTP operators, 60 °C and the effect of its variation was not studied in this work. The change of the ammonia/ammonium ratio in favor of ammonia is mainly affected by the pH, with less impact of the temperature [40]. In addition, temperature changes needed longer times to be applied in the full-scale stripping unit. With such temperature, the free ammonia/total ammonia ratio was 0.84 at pH 9.0, 0.91 at pH 9.3 and 0.94 at pH 9.5. The average pH of the pre treated urine measured at the moment of the addition to the stripping unit was 8.86 ± 0.02, while pH of the sludge liquid was 7.91 ± 0.06. That pH implied a deprotonation of 21% for the urine and 2.3%–2.9% for the sludge liquid at 20 °C.

3.2.1. Experiment I

In first experiment with urine addition, no variations in the operational parameters of the stripping units were performed. The addition of urine was tested, in order to check the direct effect of the urine in the performance of the full-scale stripping reactor. With such conditions, the maximum nitrogen removal efficiency reached during the optimization phase of the reactor was 89% [26] using a simulation in AQUASIM validated with experimental data from the full-scale WWTP.
The sludge liquid in the influent during experiment I had an average of 753 ± 19 mg N/L and was fed with a flow of 5.10 m3/h. The pre-treated urine had a total nitrogen average concentration of around 3970 ± 93 mg N/L with a flow of 0.52 m3/h, which provoked an increase on nitrogen concentration up to 1050 ± 120 mg N/L (around 40%) in the influent of the stripping units. Değermenci [41] determined that initial ammonia concentration has no significant effect on the ammonia removal rate. The treated liquid after the stripping processes had an average of 264 ± 4 mg N/L, which represented a TN removal efficiency of 76%. A representation of this experiment is shown in Figure 4.
Figure 4. Total nitrogen concentration (■) in mg N/L and volumetric flow ( Water 05 01262 i005
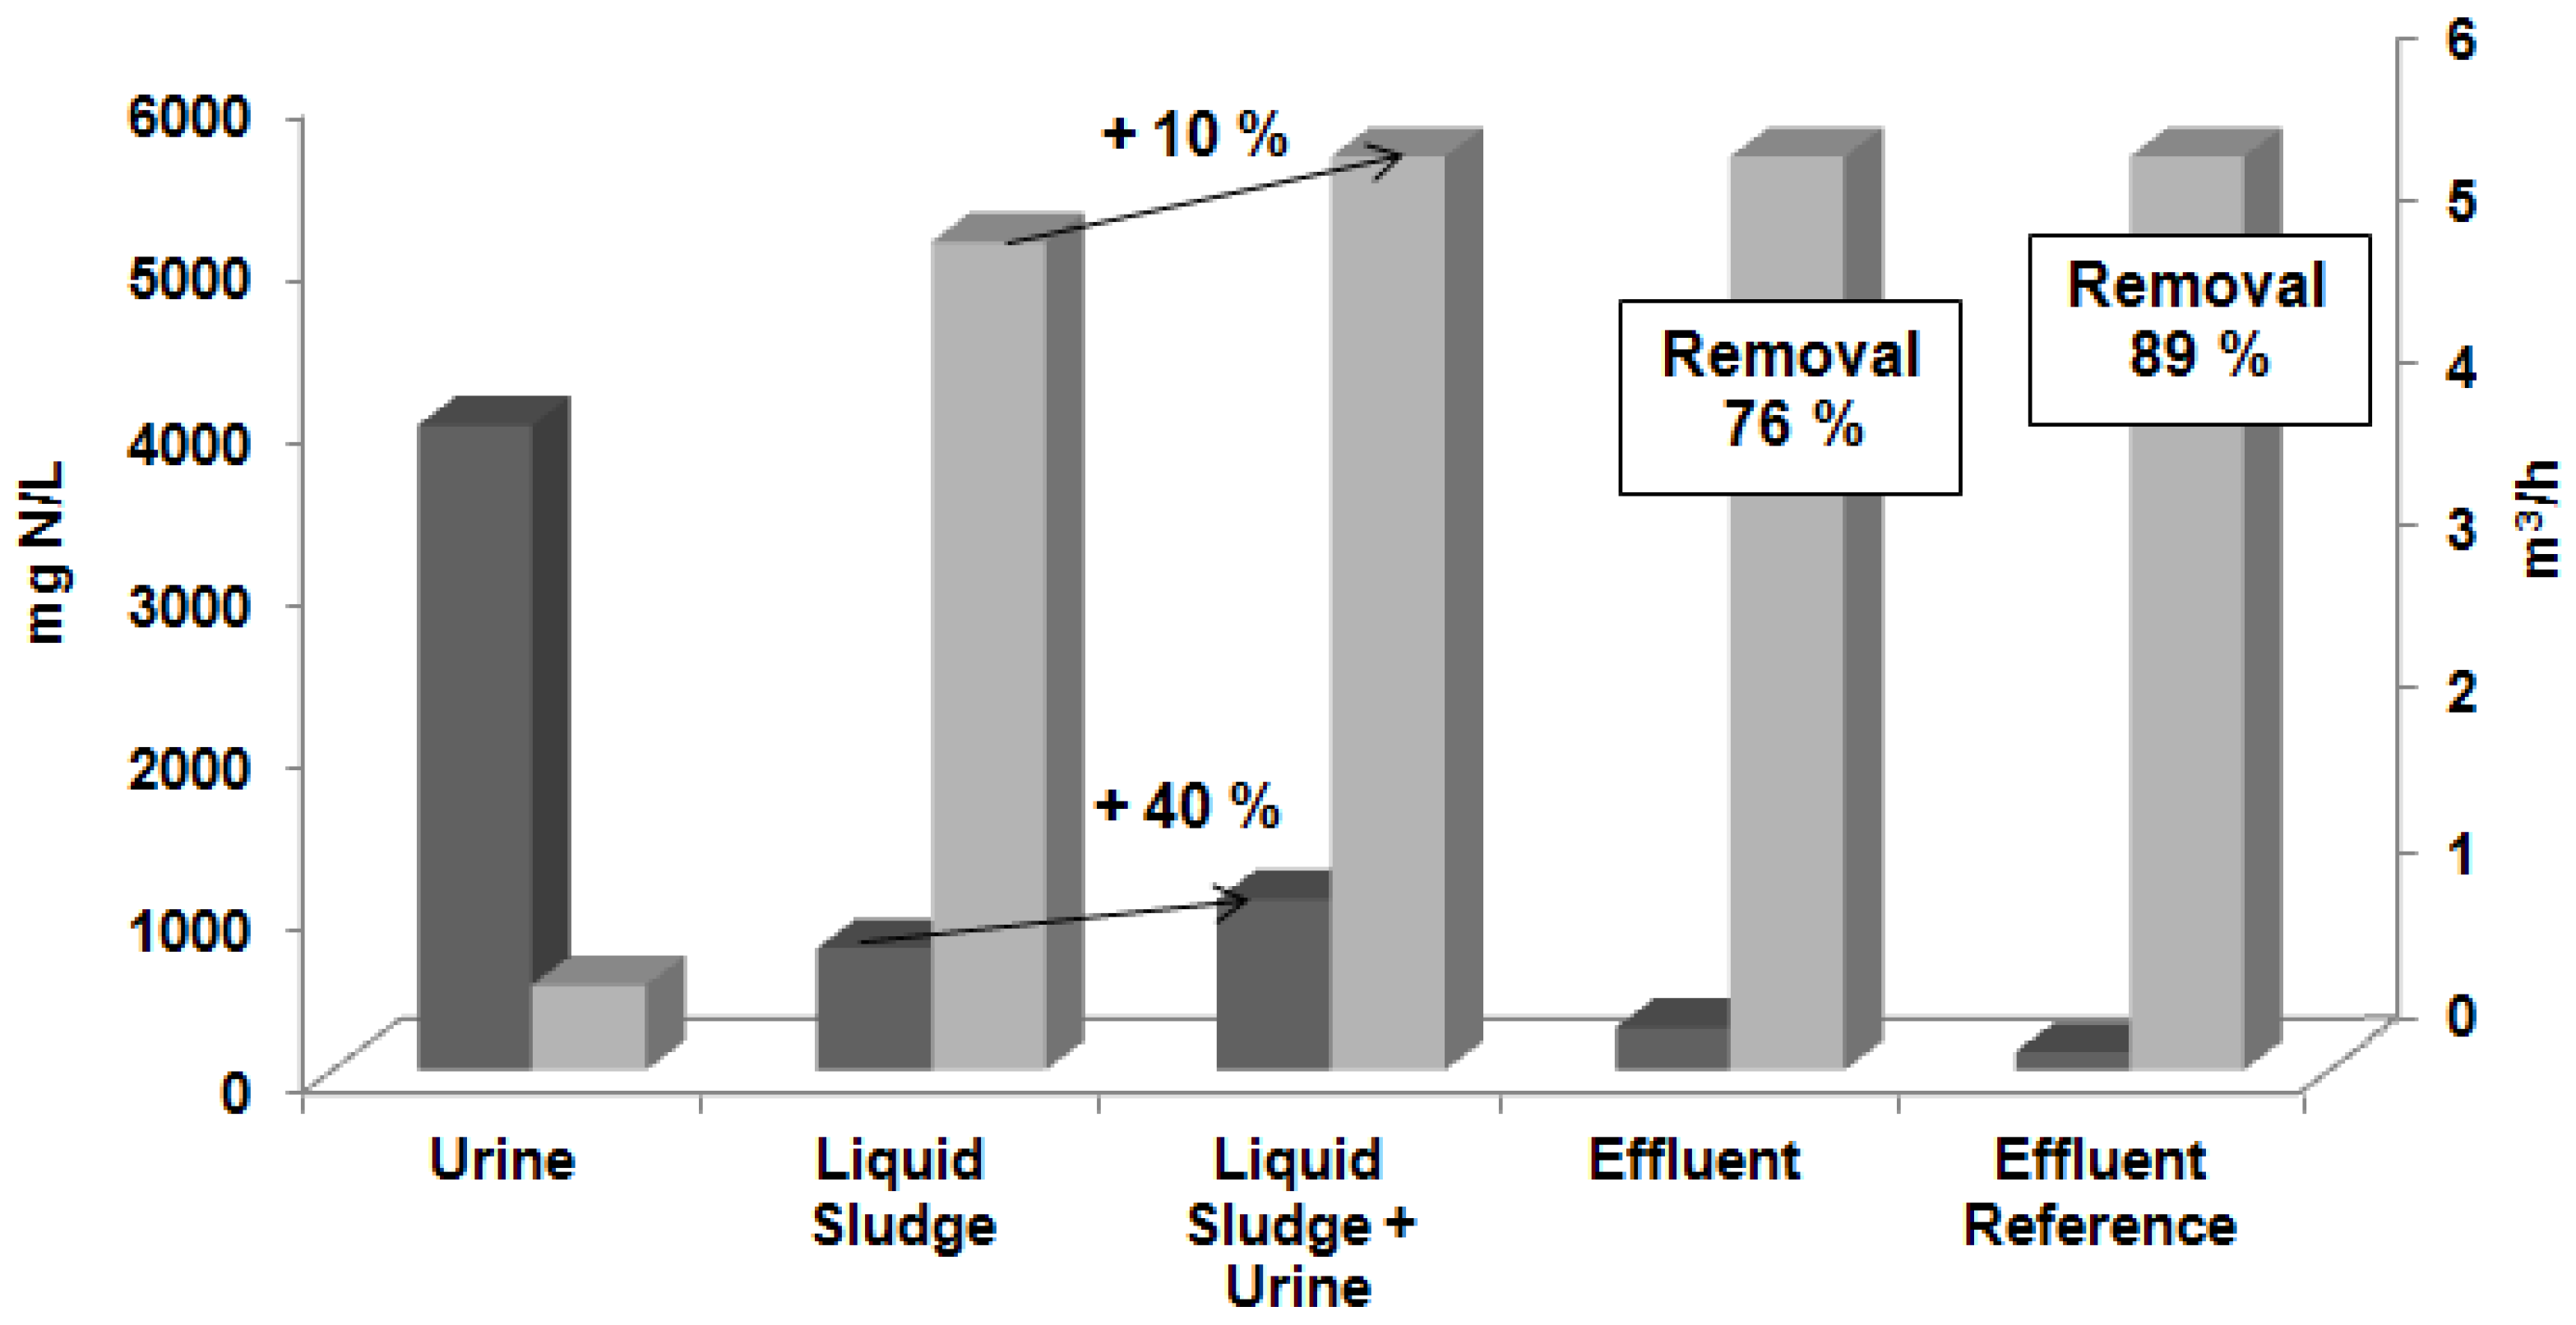
) in (m3/h) in the urine, liquid sludge, liquid sludge after the urine addition, effluent in the experiment I, and effluent for the removal efficiency reference (89%) [26].
Water 05 01262 g004
The ammonia sulphate retrieved in the sorber column increased by a factor of 47% due to the extra ammonia addition. If the removal efficiency would have reached the maximum obtained with the simulation (89%) the recovery of fertilizer at the end of the stripping treatment should have increased by a factor of 54%. The air/liquid ratio before the addition of urine was 706 Nm3/m3, while that value was reduced to 643 Nm3/m3 during experiment I due to the addition of the urine flux, with the consequent decrease of the stripping factor by 9%.

3.2.2. Experiment II

With the assumption that the air flux was one of the limit parameters in experiment I, that parameter was changed in experiment II. The air ratio was fixed in 3900 Nm3/h and the air/liquid ratio was increased up to 697 Nm3/m3.
Pre treated urine added in experiment II, had an average concentration of 3943 ± 224 mg NH4+-N/L and was fed with a flow of 0.52 m3/h, while the sludge liquid had an average nitrogen concentration of 692 ± 17 mg NH4+-N/L with a flow of 5.10 m3/h, resulting in an increase of the ammonia content of about 41%. Samples were taken before the addition of treated urine (time 0), and at different times after the beginning of the experiment as shown in Table 3.

3.2.2.1 Removal Efficiency and Fertilizer Recovery

The overall removal efficiency of the stripping processes without urine addition in experiment II (time 0) was around 68%, when the reactor treated 3300 g N/h, thus ammonia sulphate was produced at a rate of 2460 g N-(NH4)2SO4/h. Once the urine was added to the influent, the overall removal efficiency slightly dropped to 65% (Stage I). However, the nitrogen treated was 5100 g N/h (41% more) and consequently, the ammonia sulphate recovered after the sorber column rose to 3350 g N-(NH4)2SO4/h, which represents an increase of 36%. In stage II, the dose of NaOH was increased in order to reach a pH of 9.5, which facilitated the deprotonation of ammonium (94%). With such conditions, the nitrogen treated in the stripping reactors was 5250 g N/h and an improvement of the removal efficiency was obtained as it reached the 73%. The production of fertilizer was 3800 g N-(NH4)2SO4/h, which represented an increase of 56% comparing with the observed at time 0. In Stage III, the pH set point was reduced to 9.0. The nitrogen in the influent of the stripping column was 5200 g N/h and a removal of 65% was reached (similar value to the obtained on Stage I), in consequence, also the increase in the ammonia sulphate produced reached a similar value to that obtained in Stage I.
After the urine addition, the operation conditions were reset (Stage IV) and all parameters recovered the stationary values observed before the urine addition experiment. Foam or clogging problems or other operational problems related to the addition of the urine were not reported by the WWTP operators (but the length of the experiments was too short to discard this possibility).
Overall nitrogen removal in all stages was lower than expected values obtained from the simulation [26], even with no urine addition (Table 6), which can suggest operational problems of the stripping unit no related to the urine addition.

3.2.3 Chemical and Energy Cost

Extra costs related to the urine addition in the stripping unit were caused by the necessary increase of some operational parameters as the air/liquid ratio or chemicals consumption.
The electric energy used variations were mainly related to the increase of air flux. In this way, the electricity consumed for aeration was around 4.5, 5.0 and 6.0 kWh/h when the air flow was fixed in 3600, 3900 and 4300 Nm3/h respectively. The electricity cost was 0.1 CHF/kWh (around 0.08 €/kWh), in consequence, an increase of 11.1% in kWh consumed or 1.2 CHF/day was necessary to apply in experiment II, when the air flow was fixed in 3900 m3/h.
The average amount of NaOH dosed in the stripping reactor before urine addition was around 132 L/day (average of the week). The measured values during experiment I and II were around 170 L/day. The NaOH consumption rose when urine was added, as the amount of NaOH dosed in the stripping reactor must be around 35 mol/m3 [26]. Taking into account the NaOH price, the cost raised around 20.8 CHF/day. Siegrist [42] reported a relation of 24 kg of NaOH (30%) per 1 kg of N removed in an air stripping system at 20 °C, while that rate in the present study was around 2.4 kg of NaOH (50%) in the stripping system with CO2 pre-stripper at 60 °C. If the CO2 stripping column was not included, the NaOH solution consumption should be around 55 mol/m3 [26] a 57% more.
The consumption of sulphuric acid is related with the amount of N removed; Siegrist [42] reported 9.6 kg of H2SO4 per kg of N removed. The average daily use of sulphuric acid solution was around 205 L/day, while that value raised 30%–40% during the experiments with urine addition, which represented around 23 CHF/day.
Thermal energy costs also increased, as the urine had to be heated to 60 °C from ambient temperature. However, residual heat from the WWTP was used for that purpose, and no data to analyze were available. Costs related with the possible increase in chemical cleaning of the stripping unit were not possible to evaluate due to the short terms of experiments.
These extra costs associated with the urine addition can be directly compensated by the increase in fertilizer recover at the end of the stripping processes, which can vary around 5.3–7.8 CHF/day (+36%–56%). Each kg of N removed need at least 3.5 kg of H2SO4 and will produce 4.7 kg of (NH4)2SO4. In a cost study for a full-scale stripping plant with a CO2 pre-stripper, the estimated costs for treatment were around 3–4.5 €/kg Nrecovered (depending on operation/ charge wise or continuously) [43]. With the current price of the fertilizer, chemical cost was higher than fertilizer incomes. However, indirectly extra costs can be compensated by the reduction in the cost of aeration for nitrification and in the carbon source for denitrification in the biological reactors of the WWTP [44,45].
A summary of the results of the two experiments with urine addition to the stripping columns is shown in Table 6. The experiments established that is possible to treat sludge liquid and pre-treated urine in the same stripping unit.
Table 6. Summary of the main results of the different experiments.
Experiment (Stage)III (S-I)II (S-II)II (S-III)
Temperature after the heat exchanger (°C)60606060
Set point pH, after the NaOH dosage9.39.39.59.0
Air flow in the stripping reactor (Nm3/h)3600390039003900
Air flow in the CO2 stripper (Nm3/h)100100100100
Sludge liquid flow (m3/h)5.15.15.15.1
Urine flow added (L/h)525525525525
pH after the strippingNo data7.98.18.0
Efficiency (%)76657365
Efficiency % [26]89 (with 5.25 m3/h)89 (with 5.25 m3/h and 4000 Nm3/h)97 (with 5.25 m3/h and 4000 Nm3/h)80 (with 5.25 m3/h and 4000 Nm3/h)
Increase/decrease in the efficiency (%)−13−24−24−13

4. Conclusions

In this work, a set of experiments were performed in order to investigate the combination of urine treatment and ammonia stripping to treat a mixture of sludge liquid together with separated collected urine in a full-scale stripping reactor located in a municipal WWTP. The experiments performed in this work provided preliminary results, more experiments are needed in order to test the viability of the system, but first results are promising. The following conclusions could be drawn:
  • The addition of magnesium oxide in powder to the separated urine, combined with a filtration system is enough to produce and recover nutrients in form of struvite. A magnesium to phosphorus ratio of 1.4 was used in order to remove more than 95% of phosphorus from the stored urine in a short time of less than 1 hour;
  • Struvite crystals with an average size of 42 to 80 µm were formed in the reactor (the urine storage tank). Nevertheless, the solids recovery system during urine pre-treatment needs to be improved in order to retrieve a higher percentage of nutrients and the separated urine collecting system should be connected to the stripping reactor in order to combine both processes and optimize the nutrients recovery system;
  • The addition of 10% volume of treated urine to the sludge liquid fed in the stripping treatment system produced an increase of 40% of the ammonia concentration;
  • The efficiency in the nitrogen removal was lower than the value reached during the optimization and simulations without urine addition. An increase in the NaOH dose, H2SO4 composition and air/liquid ratio was needed, due to the liquid flux increase. Nevertheless, an increase in the ammonia sulphate production rate (36%–56%) was observed during the full-scale experiments with urine addition, which demonstrated the viability of the combined system;
  • Operational problems due to the treated urine addition were not reported by the WWTP operators; however, the length of the experiments was too short to discard this possibility.

Acknowledgments

The authors gratefully thank the WWTP Kloten/Ofikon and the AWEL (environmental protection office of the canton of Zürich), Switzerland. N. Morales acknowledges the fellowship of the Spanish Personnel Research Training Program (FPI) for international research stay (EEBB-2011-43482) provided by the Spanish Government.

Conflicts of Interest

The authors declare no conflict of interest.

References

  1. International Fertilizer Industry Association Home Page. Available online: http://www.fertilizer.org/ifa/HomePage/STATISTICS/Production-and-trade (accessed on 21 August 2013).
  2. Glass, A.D.M. Nitrogen use efficiency of crop plants: Physiological constraints upon nitrogen absorption. Crit. Rev. Plant Sci. 2003, 22, 453–470. [Google Scholar]
  3. Steen, I.; Agro, K. Phosphorus availability in the 21st century: Management of a non-renewable resource. Phosphorus Potassium 1998, 217, 25–31. [Google Scholar]
  4. Roberts, T.L.; Stewart, W.M. Inorganic phosphorus and potassium production and reserves. Better Crop. 2002, 86, 6–7. [Google Scholar]
  5. Cordell, D.; Drangert, J.O.; White, S. The story of phosphorus: Global food security and food for thought. Glob. Environ. Chang. 2009, 19, 292–305. [Google Scholar] [CrossRef]
  6. Heffer, P.; Prud’homme, M. 78th IFA Annual Conference. In Fertilizer Outlook 2010–2014; International Fertilizer Industry Association: Paris, France, 2010. [Google Scholar]
  7. Environmental Protection Agency, Biological Nutrient Removal Processes and Costs; United States Environmental Protection Agency: Washington, DC, USA, 2007.
  8. Dodds, W.K.; Bouska, W.W.; Eitzmann, J.L.; Pilger, T.J.; Pitts, K.L.; Riley, A.J.; Schloesser, J.T.; Thornbrugh, D.J. Eutrophication of us freshwaters: Analysis of potential economic damages. Environ. Sci. Technol. 2009, 43, 12–19. [Google Scholar] [CrossRef]
  9. European Commission, Council Directive 91/676/EEC of 12 December 1991 Concerning the Protection of Waters Against Pollution Caused by Nitrates from Agricultural Sources; Office for Official Publications of the European Communities: Brussels, Belgium, 1991.
  10. Jenssen, P.D.; Vråle, L.; Lindholm, O. Sustainable wastewater treatment. In Proceedings of International Conference on Natural Resources and Environmental Management and Environmetal Safety and Health, Kuching, Malaysia, 27–29 November 2007.
  11. Jenssen, P.D.; Vatn, A. Ecologically sound wastewater treatment: Concepts and implementation. In Proceedings of the International Conference at Stensund Folk College, Stensund, Sweden, 24–28 March 1991.
  12. Etnier, C.; Jenssen, P.D. The Human Waste Resource in Developing Countries: Examples of Options for Reuse of Nutrients in Agriculture and Aquaculture; Centre for International Environment and Development Studies: Noragric, Norway, 1997. [Google Scholar]
  13. Metcalf Eddy, I.; Tchobanoglous, G.; Burton, F.; Stensel, H.D. Wastewater Engineering: Treatment and Reuse; McGraw-Hill Companies: NewYork, NY, USA, 2002. [Google Scholar]
  14. Wilsenach, J. Separate Urine Collection and Treatment: Options for Sustainable Wastewater Systems and Mineral Recovery; Stichting Toegepast Onderzoek Waterbeheer: Utrecht, The Netherlands, 2002. [Google Scholar]
  15. Böhler, M.; Liebi, C. Reduzierter NaOH-Verbrauch bei der Ammoniak-Strippung durch den Einsatz einer vorgeschalteten CO2-Strippung—Betriebserfahrungen auf der ARA Kloten-Opfikon (In German). Reduction of base consumption in the free ammonia stripping process by means of a pre treatment by CO2-stripping—Operational experiences at WWTP Kloten/Opfikon. In 8th Conference on Nitrogen Rejection Load—State of the Art; Markus Groemping, Atemis GmbH: Heidelberg, Germany, 2012. [Google Scholar]
  16. Crittenden, J.C.; Trussell, R.R.; Hand, D.W.; Howe, K.J.; Tchobanoglous, G. MWH’s Water Treatment: Principles and Design; Wiley: Hoboken, NJ, USA, 2012. [Google Scholar]
  17. Siegrist, H.; Laureni, M.; Udert, K.M. Transfer into the gas phase: Ammonia stripping. In Source Separation and Decentralization for Wastewater Management; IWA publishing: London, UK, 2013. [Google Scholar]
  18. Lei, X.; Sugiura, N.; Feng, C.; Maekawa, T. Pretreatment of anaerobic digestion effluent with ammonia stripping and biogas purification. J. Hazard. Mater. 2007, 145, 391–397. [Google Scholar] [CrossRef]
  19. Morse, G.K.; Brett, S.W.; Guy, J.A.; Lester, J.N. Review: Phosphorus removal and recovery technologies. Sci. Total Environ. 1998, 212, 69–81. [Google Scholar] [CrossRef]
  20. Bhuiyan, M.I.H.; Mavinic, D.S.; Koch, F.A. Phosphorus recovery from wastewater through struvite formation in fluidized bed reactors: A sustainable approach. Water Sci. Technol. 2008, 57, 175–181. [Google Scholar] [CrossRef]
  21. Shu, L.; Schneider, P.; Jegatheesan, V.; Johnson, J. An economic evaluation of phosphorus recovery as struvite from digester supernatant. Bioresour. Technol. 2006, 97, 2211–2216. [Google Scholar] [CrossRef]
  22. Wilsenach, J.A.; Schuurbiers, C.A.H.; van Loosdrecht, M.C.M. Phosphate and potassium recovery from source separated urine through struvite precipitation. Water Res. 2007, 41, 458–466. [Google Scholar] [CrossRef]
  23. Wilsenach, J.A.; van Loosdrecht, M.C.M. Integration of processes to treat wastewater and source-separated urine. J. Environ. Eng. 2006, 132, 331–341. [Google Scholar] [CrossRef]
  24. Böhler, M.; Büttner, S.; Morales, N.; Liebi, C.; Schachtler, M.; Siegrist, H. Recovery of nutrients from ammonia rich sludge liquids and urine for the production of fertilizer by full scale air stripping or membrane stripping. In Proceedings of the IWA World Congress on Water, Climate and Energy, Dublin, Ireland, 13–18 May 2012.
  25. Cohen, Y.; Kirchmann, H. Increasing the ph of wastewater to high levels with different gases CO2 stripping. Water Air Soil Pollut. 2004, 159, 265–275. [Google Scholar] [CrossRef]
  26. Büttner, S. Gewinnung eines düngers aus abwasser—Optimierung des verfahrens der luftstrippung der kläranlage Kloten/Opfikon [In German] (Production of a fertilizer from sewage—Optimization of the process of air stripping of the WWTP Kloten/Opfikon). Master’s Thesis, (EAWAG) Das Wasserforschungs-Institut des ETH-Bereichs, Dübendorf, Switzerland, May 2011. [Google Scholar]
  27. SBV Landwirtschaftliche Monatszahlen Home Page. Available online: http://www.sbv-usp.ch/de/shop/landwirtschaftliche-monatszahlen/ (accessed on 10 March 2011).
  28. Udert, K.M.; Larsen, T.A.; Gujer, W. Estimating the precipitation potential in urine-collecting systems. Water Res. 2003, 37, 2667–2677. [Google Scholar] [CrossRef]
  29. Udert, K.M.; Larsen, T.A.; Biebow, M.; Gujer, W. Urea hydrolysis and precipitation dynamics in a urine-collecting system. Water Res. 2003, 37, 2571–2582. [Google Scholar] [CrossRef]
  30. Abegglen, C. Membrane bioreactor technology for decentralized wastewater treatment and reuse. Ph.D. Thesis, Eidgenössische Technische Hochschule, Zürich, Switzerland, November 2008. [Google Scholar]
  31. Tettenborn, F.; Behrendt, J.; Otterpohl, R. Resource Recovery and Removal of Pharmaceutical Residues Treatment of Separate Collected Urine; Technical University of Hamburg: Hamburg, Germany, 2007. [Google Scholar]
  32. Ronteltap, M.; Maurer, M.; Gujer, W. Struvite precipitation thermodynamics in source-separated urine. Water Res. 2007, 41, 977–984. [Google Scholar] [CrossRef]
  33. Ronteltap, M.; Maurer, M.; Hausherr, R.; Gujer, W. Struvite precipitation from urine—Influencing factors on particle size. Water Res. 2010, 44, 2038–2046. [Google Scholar] [CrossRef]
  34. Wierzbicki, A.; Sallis, J.D.; Stevens, E.D.; Smith, M.; Sikes, C.S. Crystal growth and molecular modeling studies of inhibition of struvite by phosphocitrate. Calcif. Tissue Int. 1997, 61, 216–222. [Google Scholar] [CrossRef]
  35. Massey, M.S.; Ippolito, J.A.; Davis, J.G.; Sheffield, R.E. Macroscopic and microscopic variation in recovered magnesium phosphate materials: Implications for phosphorus removal processes and product re-use. Bioresour. Technol. 2010, 101, 877–885. [Google Scholar] [CrossRef]
  36. Nelson, N.O. Phosphorus removal from anaerobic swine lagoon effluent as struvite and its use as a slow-release fertilizer. Master’s Thesis, North Carolina State University, Raleigh, USA, 2000. [Google Scholar]
  37. Wang, J.; Burken, J.G.; Zhang, X.; Surampalli, R. Engineered struvite precipitation: Impacts of component-ion molar ratios and pH. J. Environ. Eng. 2005, 131, 1433–1440. [Google Scholar] [CrossRef]
  38. Pastor, L.; Mangin, D.; Barat, R.; Seco, A. A pilot-scale study of struvite precipitation in a stirred tank reactor: Conditions influencing the process. Bioresour. Technol. 2008, 99, 6285–6291. [Google Scholar] [CrossRef]
  39. Etter, B.; Tilley, E.; Khadka, R.; Udert, K.M. Low-cost struvite production using source-separated urine in nepal. Water Res. 2011, 45, 852–862. [Google Scholar] [CrossRef]
  40. Guštin, S.; Marinšek-Logar, R. Effect of pH, temperature and air flow rate on the continuous ammonia stripping of the anaerobic digestion effluent. Process Saf. Environ. Prot. 2011, 89, 61–66. [Google Scholar] [CrossRef]
  41. Değermenci, N.; Ata, O.N.; Yildız, E. Ammonia removal by air stripping in a semi-batch jet loop reactor. J. Ind. Eng. Chem. 2012, 18, 399–404. [Google Scholar] [CrossRef]
  42. Siegrist, H. Nitrogen removal from digester supernatant—Comparison of chemical and biological methods. Water Sci. Technol. 1996, 34, 399–406. [Google Scholar] [CrossRef]
  43. Zuleeg, S.; Wüthrich, F.; Egli, C.; Hürlimann, M.; Grömping, M.; Böhler, M.; Siegrist, H. ARA Altenrhein—Rücklaufbehandlung Variantenvergleich. (In German). In Cost Comparison on Different Side Stream Treatment Technologies for Ammonia Rich Supernatant for WWTP Altenrhein; ARA Altenrhein/Ingenieurbüro AG: St. Gallen, Switzerland, 2012. [Google Scholar]
  44. Fux, C.; Siegrist, H. Nitrogen removal from sludge digester liquids by nitrification/denitrification or partial nitritation/anammox: Environmental and economical considerations. Water Sci. Technol. 2004, 50, 19–26. [Google Scholar]
  45. Wett, B.; Buchauer, K.; Fimmi, C. Energy self-sufficiency as a feasible concept for wastewater treatment systems. In Proceedings of the Leading-Edge Technology Conference, Singapore, 4–6 June 2007.

