Setting Target Measurement Uncertainty in Water Analysis

CCMM-DQB, Faculty of Sciences, University of Lisbon, Campo Grande, Lisbon 1749-016, Portugal
Water 2013, 5(3), 1279-1302; https://doi.org/10.3390/w5031279
Submission received: 19 June 2013
/
Revised: 7 August 2013
/
Accepted: 14 August 2013
/
Published: 3 September 2013
(This article belongs to the Special Issue Analytical Chemistry of Water)
Abstract
:Water is the most frequently and thoroughly characterised product due to the impact of the chemical composition of water of different sources or destinations on public health and on economy. The adequacy of water characterisation relies on measurement quality, which is a function of measurement traceability and uncertainty. In some analytical fields, target values of measurement performance parameters are set to ensure that the measurements quality is fit for the intended use. Nevertheless, frequently, these performance parameters do not allow the control of the magnitude of relevant components of measurement uncertainty. This work discusses the need for assessing fitness of the measurement for its intended use through the magnitude of uncertainty associated to the measurement value. The way this evaluation should be performed, when no guidelines are available, is also suggested. Target values of relevant performance parameters, results of interlaboratory tests, or the magnitude of trends of the measured quantity, are some types of information useful to define the maximum admissible uncertainty, i.e., target uncertainty. The information and algorithms used to define the target uncertainty are presented from the most suitable to the less likely to produce consensual values. Calculations are illustrated with application examples of different analytical fields. In this work, the way in which variability of uncertainty evaluation is taken into account when comparing estimated with target uncertainty is also discussed.
1. Introduction
Water is the most frequently and thoroughly characterised product, in particular when intended for human consumption. Drinking water is monitored before and after treatment to guarantee high quality of this essential food. Urban and industrial wastewaters are also monitored before and after treatment to check treatment efficiency and ensure minimum impact of effluent discharges in the environment. The environment is subsequently monitored to check the adequacy of the regulation of contamination sources. Frequently, this involves the characterisation of surface or underground waters that due to their mobility can supply information about the state of the local environmental resources. Water of bathing and recreation areas is also controlled having in mind its possible impact on the user’s health. Water quality is also extremely important in industry; food, energy and transformation industry are some examples where water composition is critical.
Most commonly, water is monitored for checking compliance with relevant legislation or specification, considering a maximum and/or a minimum quantity defined as “target quantity value”. However, many relevant characterizations of water are performed without having a target quantity level defined. The quantification of a new contaminant, the assessment of variation of the eutrophic level of a lake in a dry season, or the determination of seawater acidification with global environmental changes are a few examples. In this work, the generic term “quantity” is preferred to specific examples such as, e.g., concentration, mass fraction, depletion rate or pH.
The quality of the information collected from water characterisation depends both on sample representativeness and measurement quality.
In most cases, the routine monitoring or enforcement of legislation of water quality involves the characterisation of a sample collected following a defined procedure without the representativeness of the sample being checked. This approach aims at saving resources needed for the sound characterisation of a large item. Nevertheless, whenever a large item needs to be characterised in detail, the representativeness of the sample must be checked or ensured through an adequate sampling protocol. In this case, the sampling stage is included in the measurement procedure.
Measurement fitness for the intended use depends on measurement results’ traceability and uncertainty. The latest edition of the international vocabulary of metrology (VIM) [1] defines metrological traceability as a “property of a measurement result whereby the result can be related to a reference through a documented unbroken chain of calibrations, each contributing to the measurement uncertainty”. Measurement traceability is defined after the reference/standard of the measurement has been selected. If two measurement results are obtained after calibrating the measurement systems using calibrators with reference quantity values traceable to the same measurement unit of the International System of Units, both measurements will be traceable to a common reference; this way measurement results are comparable.
The quality of a measurement traceable to the selected reference is quantified by its respective “measurement uncertainty”. This is defined as the “non-negative parameter characterizing the dispersion of the quantity values being attributed to a measurand, based on the information used” [1]. Therefore, the adequacy of measurement results for their intended use also depends on the magnitude of the measurement uncertainty. Measurement results affected by a large uncertainty may not be informative enough. For instance, if compliance to a maximum target value of the determined quantity is assessed, a large uncertainty can make compliance assessment inconclusive even when measured and target values present a large deviation. On the other hand, measurements with extremely low uncertainty may demand sophisticated and expensive experimental conditions and should only be performed when absolutely necessary.
The latest edition of the VIM [1] defines “target measurement uncertainty” as “measurement uncertainty specified as an upper limit and decided on the basis of the intended use of measurement results”. Only measurement results with uncertainty smaller than this target value are considered fit for the intended use. If measurement uncertainty is well below this target value, measurement cost optimisation should be encouraged.
In some analytical fields, target values of measurement precision and mean analyte recovery of trueness tests are defined to guarantee acceptable quality of performed measurements. Nevertheless, depending on the way these performance parameters are defined or estimated, their control may or may not be enough to ensure acceptable uncertainty of measurement results.
If measurement repeatability is checked considering a target value, this will only prove that precision is fit for the intended use in the specific conditions under which the procedure was conducted. Usually, this conclusion cannot be extrapolated to different conditions; e.g., to a subsequent day. When precision components of the measurement uncertainty are estimated in repeatability conditions, additional uncertainty components must be considered to take the between days components into account.
For the purpose of the trueness test, if the mean analyte recovery is estimated through the analysis of spiked samples prepared from a stock solution used to produce calibrators, the uncertainty associated with the quantity value of the stock solution is not being tested. Therefore, if results of trueness test do not reflect relevant systematic effects, like the uncertainty of the quantity value of the reference solution used to prepare both spiked samples and calibrators, results of trueness tests must be combined with other uncertainty components in the uncertainty budget.
The assessment of the magnitude of measurement uncertainty in the analytical range is the last stage of validation of the measurement procedure that closes the previous preliminary assessments.
In most measurements of chemical quantities in water, target measurement uncertainty is not defined even when the target quantity value is set. This situation forces analysts to define the target measurement uncertainty themselves. This work suggests a strategy for defining the target uncertainty in water analysis, when no complete guidance is available, using information from different sources. This information is presented from the most adequate to the less likely to produce consensual target uncertainties.
This manuscript intends to be a support for any research or compliance assessment based on quantitative measurements in water.
2. Selecting Inputs for Defining the Target Measurement Uncertainty
Guidance about the acceptable magnitude of measurement uncertainty should start with consultation of the document—typically a legislation or a technical specification—defining the target quantity value.
In some fields, target values of measurement performance parameters, like limit of detection, precision and mean analyte recovery, are defined instead of the target measurement uncertainty. In those cases, if such performance parameters reflect the most relevant random and systematic effects, they can be converted into a target measurement uncertainty.
The measurement quality requirements can also be deduced from the quantity value beyond which a wrong compliance decision should be unlikely.
When no target values are defined, measurement quality requirements can be defined from the way laboratory competence is checked in, e.g., proficiency tests. International proficiency tests are preferred to national ones if measurements are to be compared at an international level.
If none of the previous references are available, information from a different analytical problem pertaining to the analyte, the matrix or the test purpose, may be used for defining the target measurement uncertainty. The equivalence of the process of defining target quantity values can justify the extrapolation of the target measurement uncertainty from one analytical problem to another. In any such cases, arguments must be presented in a convincing way.
When target values of measurement performance parameters are available for a specific quantity value and adequacy of measurements at other quantity values need to be assessed, a prediction model of the variation of measurement performance with the quantity can be used to define the requirements at those ranges.
If measurement performance does not meet the defined requirements, the measurement procedure should be revised or changed to satisfy the quality requirements.
3. Using Inputs for Defining Target Measurement Uncertainty
This section details the way to proceed when different types of references or data are available for defining the target measurement uncertainty. The types of data presented range from the most adequate sources for target measurement uncertainty to the sources less likely to become consensual.
3.1. Legislation or Product Specification
3.1.1. Defined Target Measurement Uncertainty
If legislation or specification defining target quantity values also define the target measurement uncertainty, compliance assessment should be supported on measurements fulfilling the defined quality requirements. In most of these cases, target measurement uncertainty is defined for measurements next to the target quantity value.
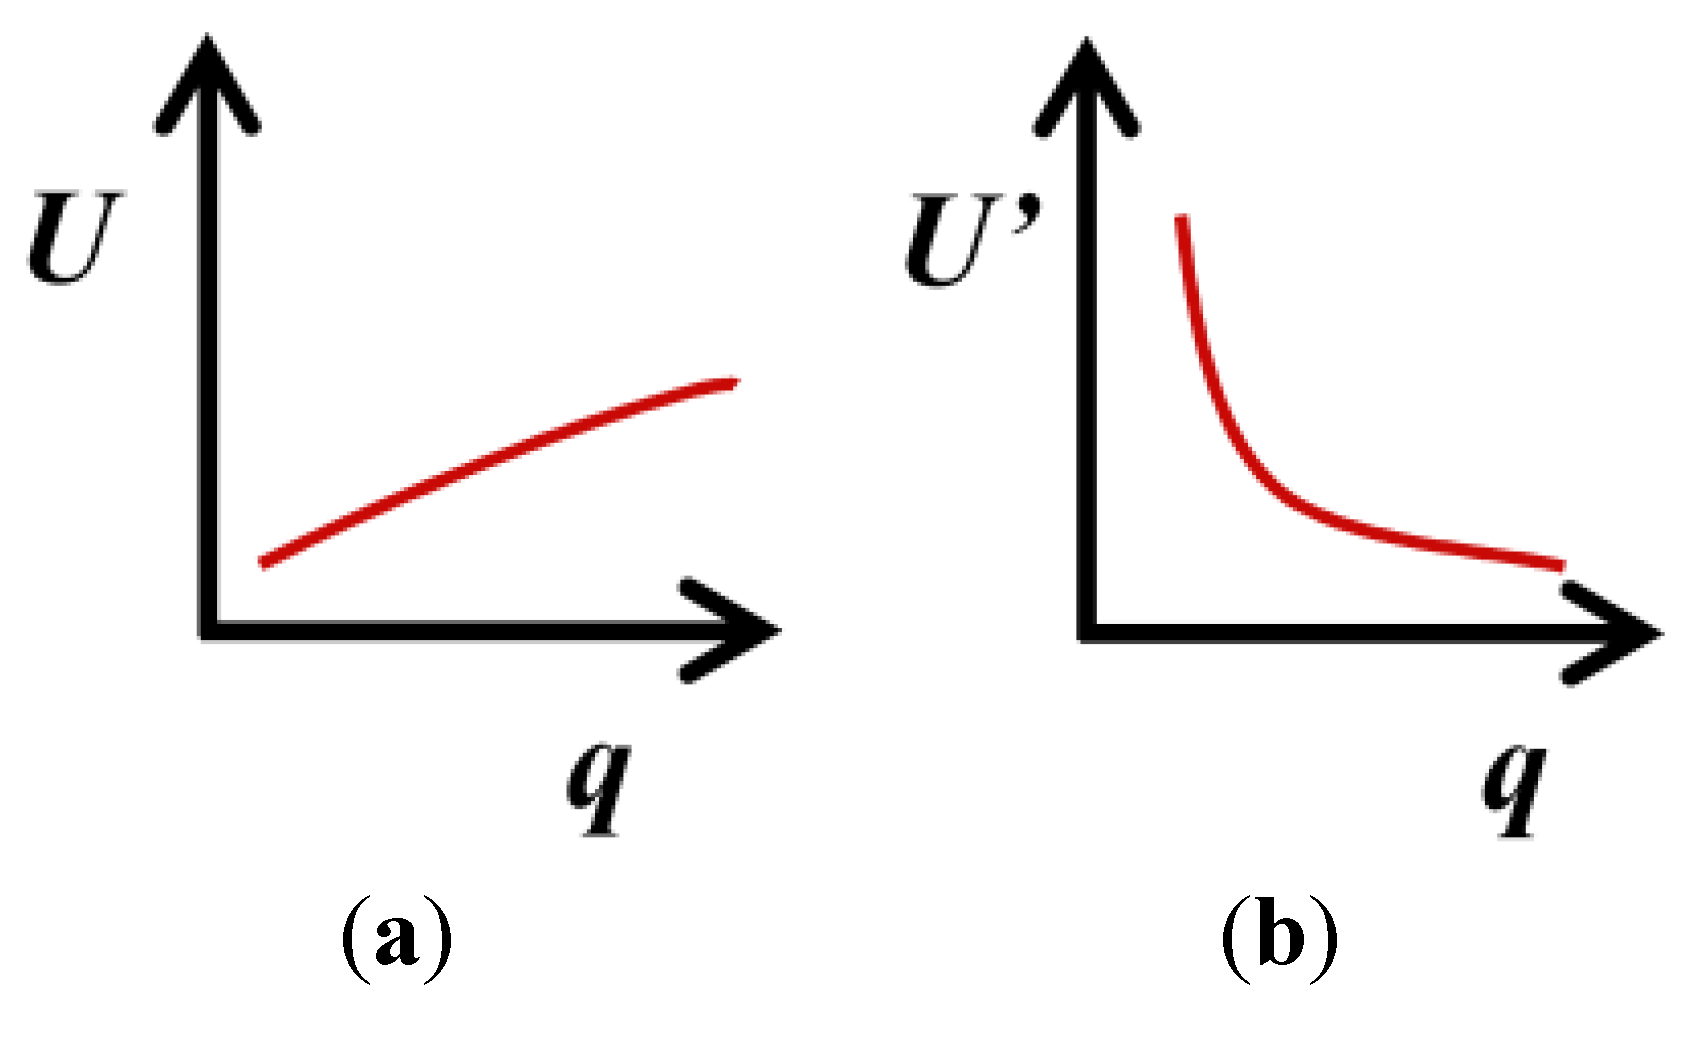
Since the absolute uncertainty U tends to increase or to be constant with the quantity value and relative uncertainty (U’—uncertainty divided by the quantity value) decreases for higher quantity values (see Figure 1), the following rule can be used to extrapolate the target measurement uncertainty to slightly above and below the target quantity.
Figure 1.
Expected trend of the variation of the absolute U and relative U’ expanded measurement uncertainty with the quantity value, q: (a) slight increase and (b) decrease.
Figure 1.
Expected trend of the variation of the absolute U and relative U’ expanded measurement uncertainty with the quantity value, q: (a) slight increase and (b) decrease.

The relative target uncertainty should be used up to two times above the target quantity value and the absolute target uncertainty up to two times below the target quantity value. This range of quantity values is the relevant one for compliance assessment. If target measurement uncertainty needs to be defined for a wider range, see Section 4.
3.1.2. Defined Measurement Performance Parameters
In some legislation or technical specifications, target values of measurement performance parameters related to relevant uncertainty components are defined. Maximum limit of detection and/or quantification, maximum range of results of duplicate measurements or maximum coefficient of variance of results of replicate measurements obtained under different precision conditions, and maximum absolute mean error, are some examples.
Before checking measurement performance, analysts must verify how terms are defined in the reference, since sometimes performance parameters are presented using terminology different from the one presented in the International Vocabulary of Metrology (VIM) [1]. If those documents are not clear about relevant details, like precision conditions, other sectorial documents or reports on the application of the reference should be consulted. For instance, Directive 98/83/EC [2] on the quality of drinking water defines maximum values for the trueness where, using VIM [1] terms, are in fact defined maximum values for the absolute mean error calculated as a percentage of the target quality value known as “parametric value”.
If measurement performance parameters for which target values are defined reflect relevant random and systematic effects, this can be used alone to estimate the target measurement uncertainty.
Table 1 presents some measurement performance parameters for which target values are defined in some references, together with an explanation on the way these values can be used to define the target measurement uncertainty.

Table 1.
Measurement performance parameters for which defined target values can be used to estimate the target measurement uncertainty.
| Performance parameter | Description |
|---|---|
| Limit of Detection (LD) | The Limit of Detection (LD) can be estimated in repeatability or intermediate precision conditions. For instrumental methods of analysis requiring daily calibration of the instrumentation, LD estimated in repeatability conditions is only applicable to the daily run. The LD estimated from the precision of measurements of different calibrations can be applicable to a larger time scale. At this quantity level, the measurement coefficient of variance is 33% or 30% if LD is calculated by multiplying precision standard deviation by 3 or 3.3, respectively. Since absolute precision is constant in a narrow quantity range, the precision estimated at LD can be used to estimate precision between LD and the Limit of Quantification (LQ) (3 or 3.3 times larger than LD). Only seldom relevant systematic effects affect measurements at this quantity range [LD, LQ[. Convergent (“[#” or “#]”) or divergent (“]#” or “#[”) brackets indicate the inclusion or exclusion of number “#” in the interval, respectively. A target limit of detection, LDtg, can be used to estimate a target standard deviation, stg, of precision under studied conditions. The stg is “LDtg/3” or “LDtg/3.3” depending on used convention for estimating LD. |
| Limit of Quantification (LQ) | The calculation of the Limit of Quantification (LQ) is similar to that involved to estimate LD where the multiplying factor of the standard deviation of measurement precision is 10 instead of 3 or 3.3. At this quantity level, systematic effects can be relevant. |
| Limit of Quantification (LQ) | A target limit of quantification, LQtg, can be used to define the target standard deviation, stg, of studied precision conditions (stg = LQtg/10). Typically, stg can be applied between LD and two to five times LQ. |
| Range of duplicate measurements | Whenever a target range of results of duplicate measurements is defined, the respective confidence level and involved precision conditions should be checked. If the confidence level is not reported, a value of 95% should be considered. Since the repeatability or intermediate precision limits [3], estimated for a confidence level of 95%, are 2.83 times larger than the standard deviation of measurements under the same precision conditions, the target range can be converted into a stg by dividing it by 2.83. Only if otherwise specified, this precision should refer to the global measurement. If a target range of more than two replicate results is defined, this range can be converted into stg by dividing it by the factor previously used to convert the standard deviation of single measurements in the critical range [3]. |
| Coefficient of variance | If a target coefficient of variance is defined without specifying the precision conditions considered (typically repeatability or intermediate precision conditions), it can be assumed that the more informative intermediate precision is reported. Many references of measurement performance parameters do not use terminology of the latest, or even previous, VIM [1] editions, requiring a careful check of the meaning of the terms. In the past, the term reproducibility was used for the concept designated as intermediate precision in the latest VIM edition. Some documents define precision requirements as a target value for two times the standard deviation of the precision in defined conditions [2]. The repeatability standard deviation only reflects random effects in specific environmental and operational (i.e., for an analyst/equipment combination) conditions. A target intermediate precision can be used to set the target standard uncertainty reflecting all relevant random effects affecting measurement results. This uncertainty component does not reflect relevant systematic effects like the so called laboratory or method bias [4]. |
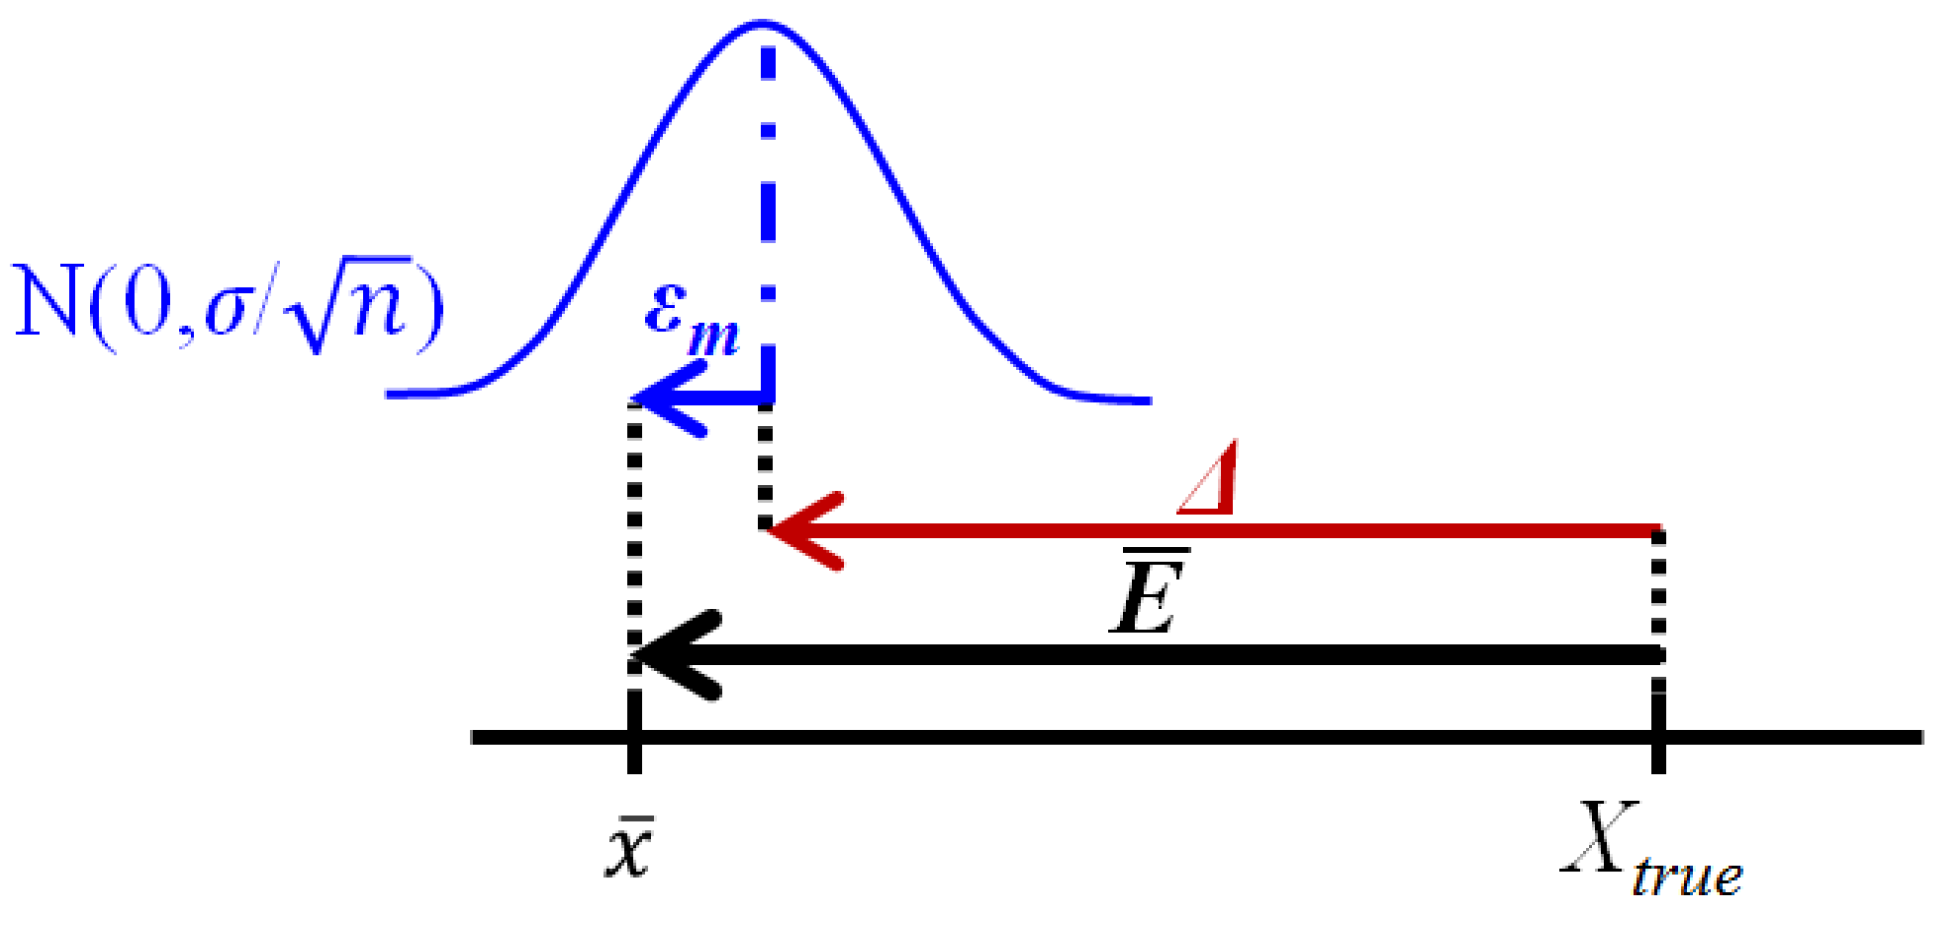
| Mean error | Measurement error, E, calculated by the difference between estimated, x, and conventional true value, Xtrue, occurs as a result of the combination of a random, ε, and the systematic, Δ, errors (Figure 2). Although measurement uncertainty evaluation, following principles presented in the “Guide to the expression of uncertainty in measurement” (GUM) [5], involves the combination of the uncertainty associated with random and systematic effects using the same general propagation law, the single measured quantity value, x, comes from the sum of Xtrue with ε and Δ resulting from the uncertainty associated with independent effects. The mean error, E, occurs as a result of the combination of the same systematic error, Δ, affecting single measurements, with a random error of the mean εm resulting from an uncertainty component of random effects  times smaller than the one affecting single measurements (where n is the number of replicate measurements combined in the mean value) (Figure 3). As n increases, the error of the mean tends to be less affected by random effects. In most measurements in chemistry, if n ≥ 20 the mean error E describes, with acceptable reliability, the systematic error ( times smaller than the one affecting single measurements (where n is the number of replicate measurements combined in the mean value) (Figure 3). As n increases, the error of the mean tends to be less affected by random effects. In most measurements in chemistry, if n ≥ 20 the mean error E describes, with acceptable reliability, the systematic error (  Δ). Δ).Therefore, the target absolute mean error  of a specific measurement defines the target absolute systematic error. This target value can be converted into an uncertainty component described by a variable centred in zero with a maximum range of (0 ± ). Assuming a normal distribution associated with , this range is converted into a standard uncertainty by dividing it by a coverage factor of 2 (u = of a specific measurement defines the target absolute systematic error. This target value can be converted into an uncertainty component described by a variable centred in zero with a maximum range of (0 ± ). Assuming a normal distribution associated with , this range is converted into a standard uncertainty by dividing it by a coverage factor of 2 (u =  ). If a rectangular or triangular distribution is assumed, the divisor 2 is replaced by ). If a rectangular or triangular distribution is assumed, the divisor 2 is replaced by  or or  , respectively. This component only reflects systematic effects. , respectively. This component only reflects systematic effects. |
The target limit of detection (LDtg) can be used to define a target standard deviation, stg, of results, obtained under considered precision conditions, between the limit of detection (LD) and the limit of quantification (LQ) where stg is expected to be constant.
LD can be estimated as 3 or 3.3 times the standard deviation of measurement results obtained under repeatability or intermediate precision conditions. Therefore, stg = LDtg/3 or stg = LDtg/3.3 depending on the convention used to estimate LD. The target standard deviation stg can quantify measurement results repeatability or intermediate precision depending on how LD is expected to be quantified. It can be used between LD and, at least, LQ where absolute precision is expected to be approximately constant.
The stg can also be estimated from a target value of the limit of quantification LQtg. Since LQ, is usually estimated as 10 times the standard deviation of replicate measurements obtained under defined conditions, stg = LQtg/10. stg estimated from LQtg should be applicable between LD and 5LQ where stg is expected to be approximately constant.
If LDtg and/or LQtg are defined for intermediate precision conditions, the resulting standard deviation stg can be used to define the target standard uncertainty of relevant random effects ![Water 05 01279 i026]() (
( ![Water 05 01279 i026]() = stg). The standard deviation of measurement repeatability underestimates random effects observable in various runs.
= stg). The standard deviation of measurement repeatability underestimates random effects observable in various runs.
 ( = stg). The standard deviation of measurement repeatability underestimates random effects observable in various runs.
If only target values of the measurement repeatability are defined, analysts can assume reproducibility standard deviation is 3/2 times larger than the repeatability standard deviation, as proposed in a SANCO document [6]. Section 3.2.2 describes the use of target values of measurement reproducibility to estimate the target measurement uncertainty.
For measurements performed above 5LQ, stg can be estimated from available target values of the coefficient of variance or range of replicate measurements (Table 1).
The target absolute mean error ![Water 05 01279 i022]() can be used to estimate the target standard uncertainty associated with systematic effects
can be used to estimate the target standard uncertainty associated with systematic effects ![Water 05 01279 i027]() , as described in Table 1 (
, as described in Table 1 ( ![Water 05 01279 i023]() ; where divisor 2 can be substituted by
; where divisor 2 can be substituted by ![Water 05 01279 i024]() or
or ![Water 05 01279 i025]() ).
).
can be used to estimate the target standard uncertainty associated with systematic effects  , as described in Table 1 (
  ; where divisor 2 can be substituted by or ).
Some references define a tolerance for the mean analyte recovery observed from the analysis of spiked samples or other reference material. This tolerance can be converted into the relative mean error allowing for estimation of ![Water 05 01279 i027]() .
.
.The target measurement uncertainty ![Water 05 01279 i029]() , reflecting the combination of random and systematic effects, is calculated using uncertainty propagation law:
, reflecting the combination of random and systematic effects, is calculated using uncertainty propagation law:
![Water 05 01279 i001]() where
where ![Water 05 01279 i026]() can be estimated from target values of the LD, LQ, coefficient of variation or range of replicate measurements, or any other parameter describing the same effect. The
can be estimated from target values of the LD, LQ, coefficient of variation or range of replicate measurements, or any other parameter describing the same effect. The ![Water 05 01279 i027]() can be estimated from the target absolute mean error, mean analyte recovery tolerance or an equivalent parameter. If a relative target mean error is defined, it must be multiplied by the measured quantity value or the target quantity value before being combined with the random effect component in measurement result units.
can be estimated from the target absolute mean error, mean analyte recovery tolerance or an equivalent parameter. If a relative target mean error is defined, it must be multiplied by the measured quantity value or the target quantity value before being combined with the random effect component in measurement result units.
 , reflecting the combination of random and systematic effects, is calculated using uncertainty propagation law:
 can be estimated from target values of the LD, LQ, coefficient of variation or range of replicate measurements, or any other parameter describing the same effect. The can be estimated from the target absolute mean error, mean analyte recovery tolerance or an equivalent parameter. If a relative target mean error is defined, it must be multiplied by the measured quantity value or the target quantity value before being combined with the random effect component in measurement result units.
Figure 2.
Measurement error, E, results from a combination of a random, ε, and the systematic component Δ (E = ε + Δ) [4]. Assuming random errors are normally distributed, the standard deviation σ can be used to define predictive models of ε.
Figure 2.
Measurement error, E, results from a combination of a random, ε, and the systematic component Δ (E = ε + Δ) [4]. Assuming random errors are normally distributed, the standard deviation σ can be used to define predictive models of ε.
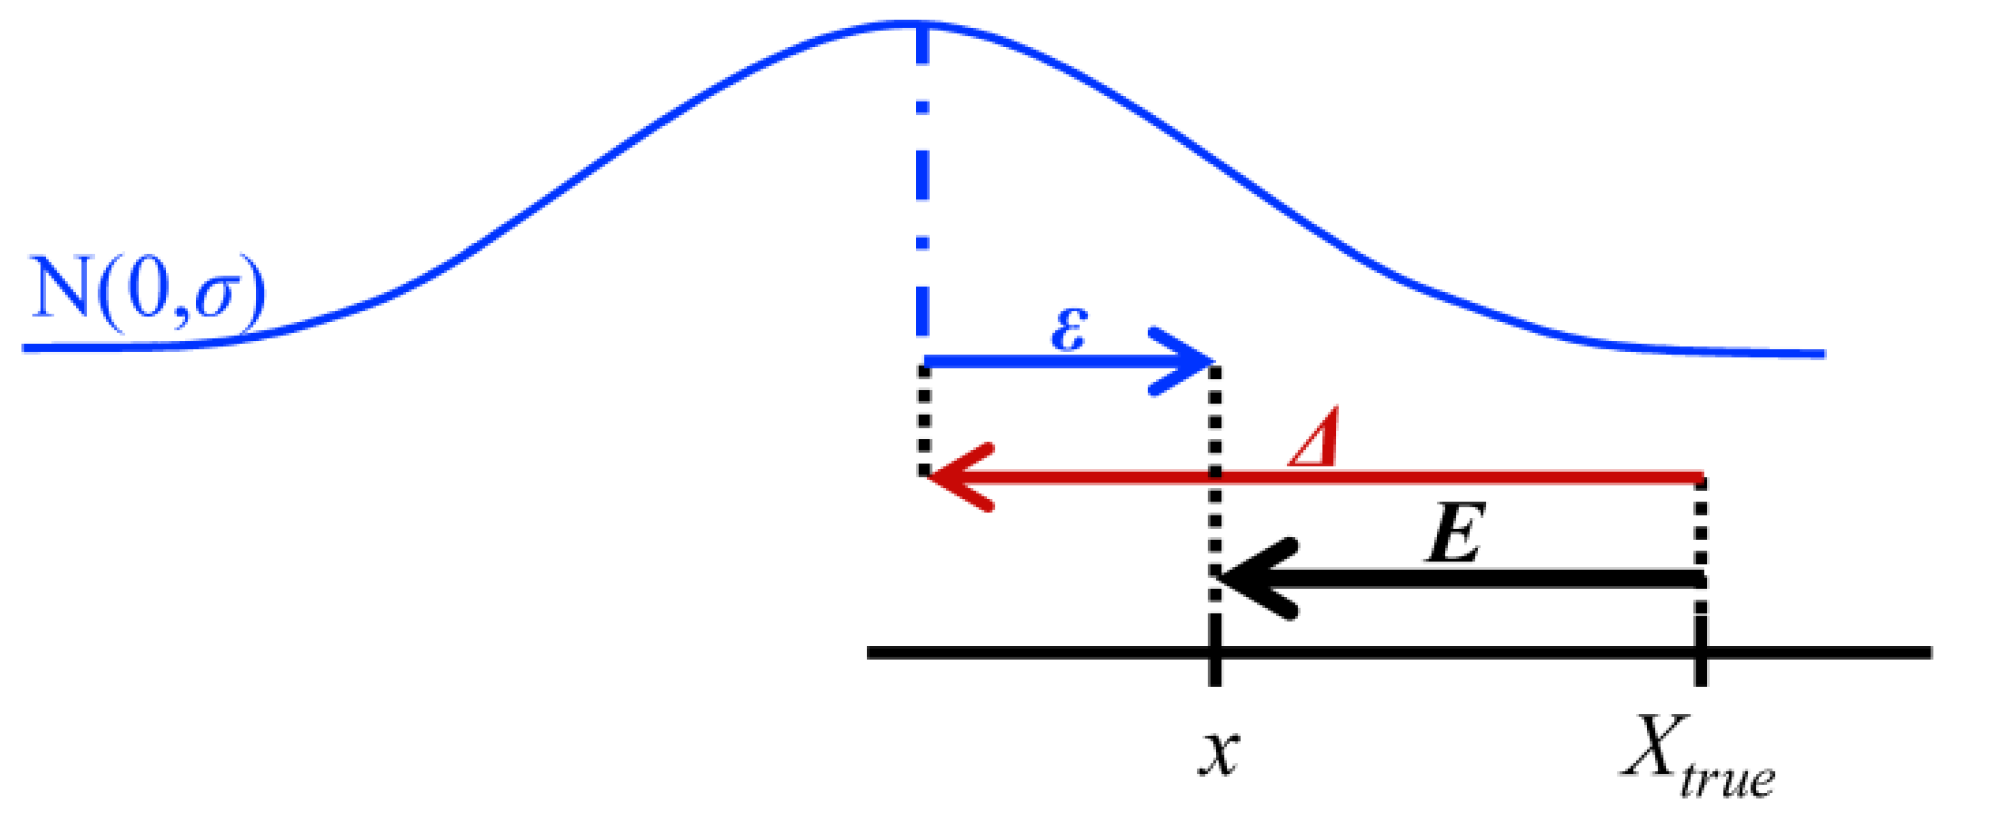
Figure 3.
The mean error E of n measurements comes from the combination of a random, εm, and the systematic component Δ. The εm is a random error resulting from measurements dispersion quantified by the standard deviation of the mean ( ![Water 05 01279 i028]() ) (where σ is the standard deviation of individual measurements, Figure 2).
) (where σ is the standard deviation of individual measurements, Figure 2).
 ) (where σ is the standard deviation of individual measurements, Figure 2).
Figure 3.
The mean error E of n measurements comes from the combination of a random, εm, and the systematic component Δ. The εm is a random error resulting from measurements dispersion quantified by the standard deviation of the mean ( ![Water 05 01279 i028]() ) (where σ is the standard deviation of individual measurements, Figure 2).
) (where σ is the standard deviation of individual measurements, Figure 2).
) (where σ is the standard deviation of individual measurements, Figure 2).
The target standard uncertainty ( ![Water 05 01279 i029]() ) is to be compared with the combined standard uncertainty of performed measurements. The expansion of
) is to be compared with the combined standard uncertainty of performed measurements. The expansion of ![Water 05 01279 i029]() , considering the typical coverage factor, in the expanded target measurement uncertainty
, considering the typical coverage factor, in the expanded target measurement uncertainty ![Water 05 01279 i046]() allows the definition of criterion for the expanded measurement uncertainty. The comparison of the estimated with the target measurement uncertainty is discussed in Section 5.
allows the definition of criterion for the expanded measurement uncertainty. The comparison of the estimated with the target measurement uncertainty is discussed in Section 5.
) is to be compared with the combined standard uncertainty of performed measurements. The expansion of , considering the typical coverage factor, in the expanded target measurement uncertainty  allows the definition of criterion for the expanded measurement uncertainty. The comparison of the estimated with the target measurement uncertainty is discussed in Section 5.
3.1.3. Defined Target Quantity Value
In some analytical fields, the target quantity values are defined without guidelines on the quality of measurements performed to check compliance with these levels. If a single minimum or maximum quantity value is defined, measurement quality should be assessed, at least, at this level. If a compliance interval of the quantity value is defined, measurement performance within and next to this interval should be assessed. The following section describes the way to define the target uncertainty for the assessment of the compliance of an item with a maximum or minimum quantity value.
If the compliance rule defines a maximum (qmax) and a minimum (qmin) quantity value within which the quantity of the analysed item should lie, it can be inferred that the measurement uncertainty should be small enough to distinguish quantities within this interval. In these cases, the target expanded uncertainty Utg should be no larger than an eighth of the confidence interval range [Equation (2)]:
![Water 05 01279 i002]()

3.1.4. Defined Decision Risk
If together with the target quantity value and the decision rule of compliance assessment [7] it is decided to control the probability of wrongly rejecting or wrongly accepting a product with a “true” quantity value beyond another quantity, this information can be used to define the target measurement uncertainty. The decision rule “describes the way in which the measurement uncertainty will be taken into account with regard to accepting or rejecting a product according to its specification and the result of a measurement” [7]. Various scenarios of maximum and minimum target quantity values are studied:
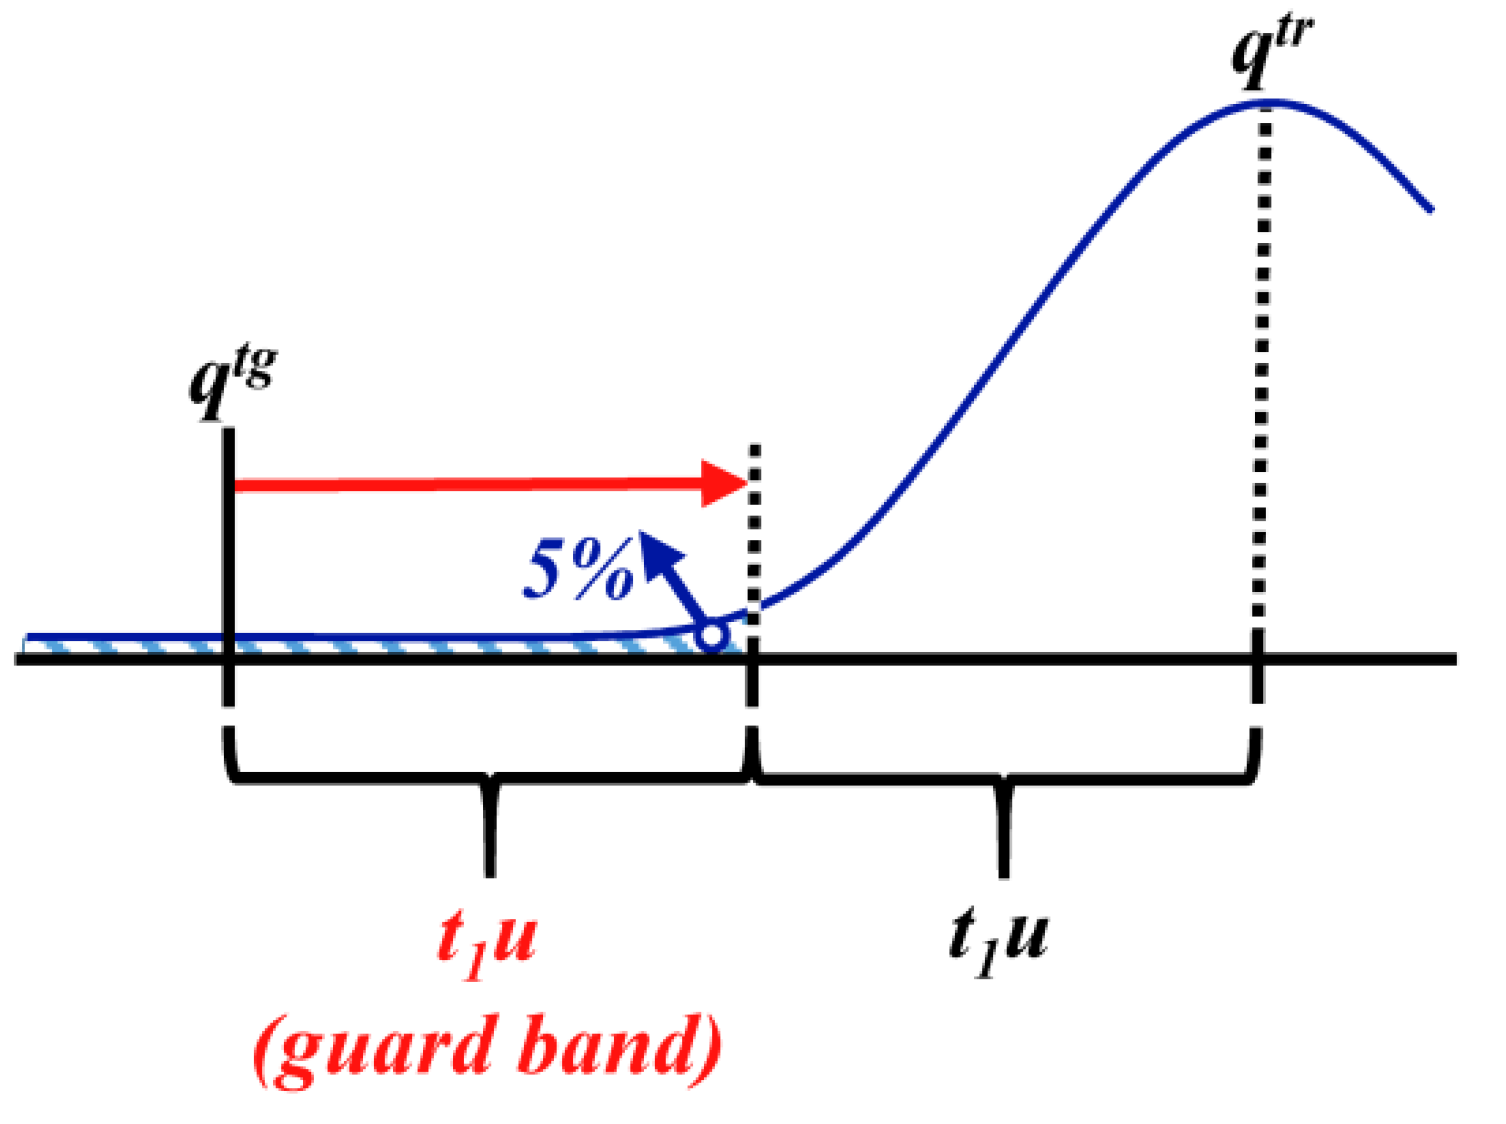
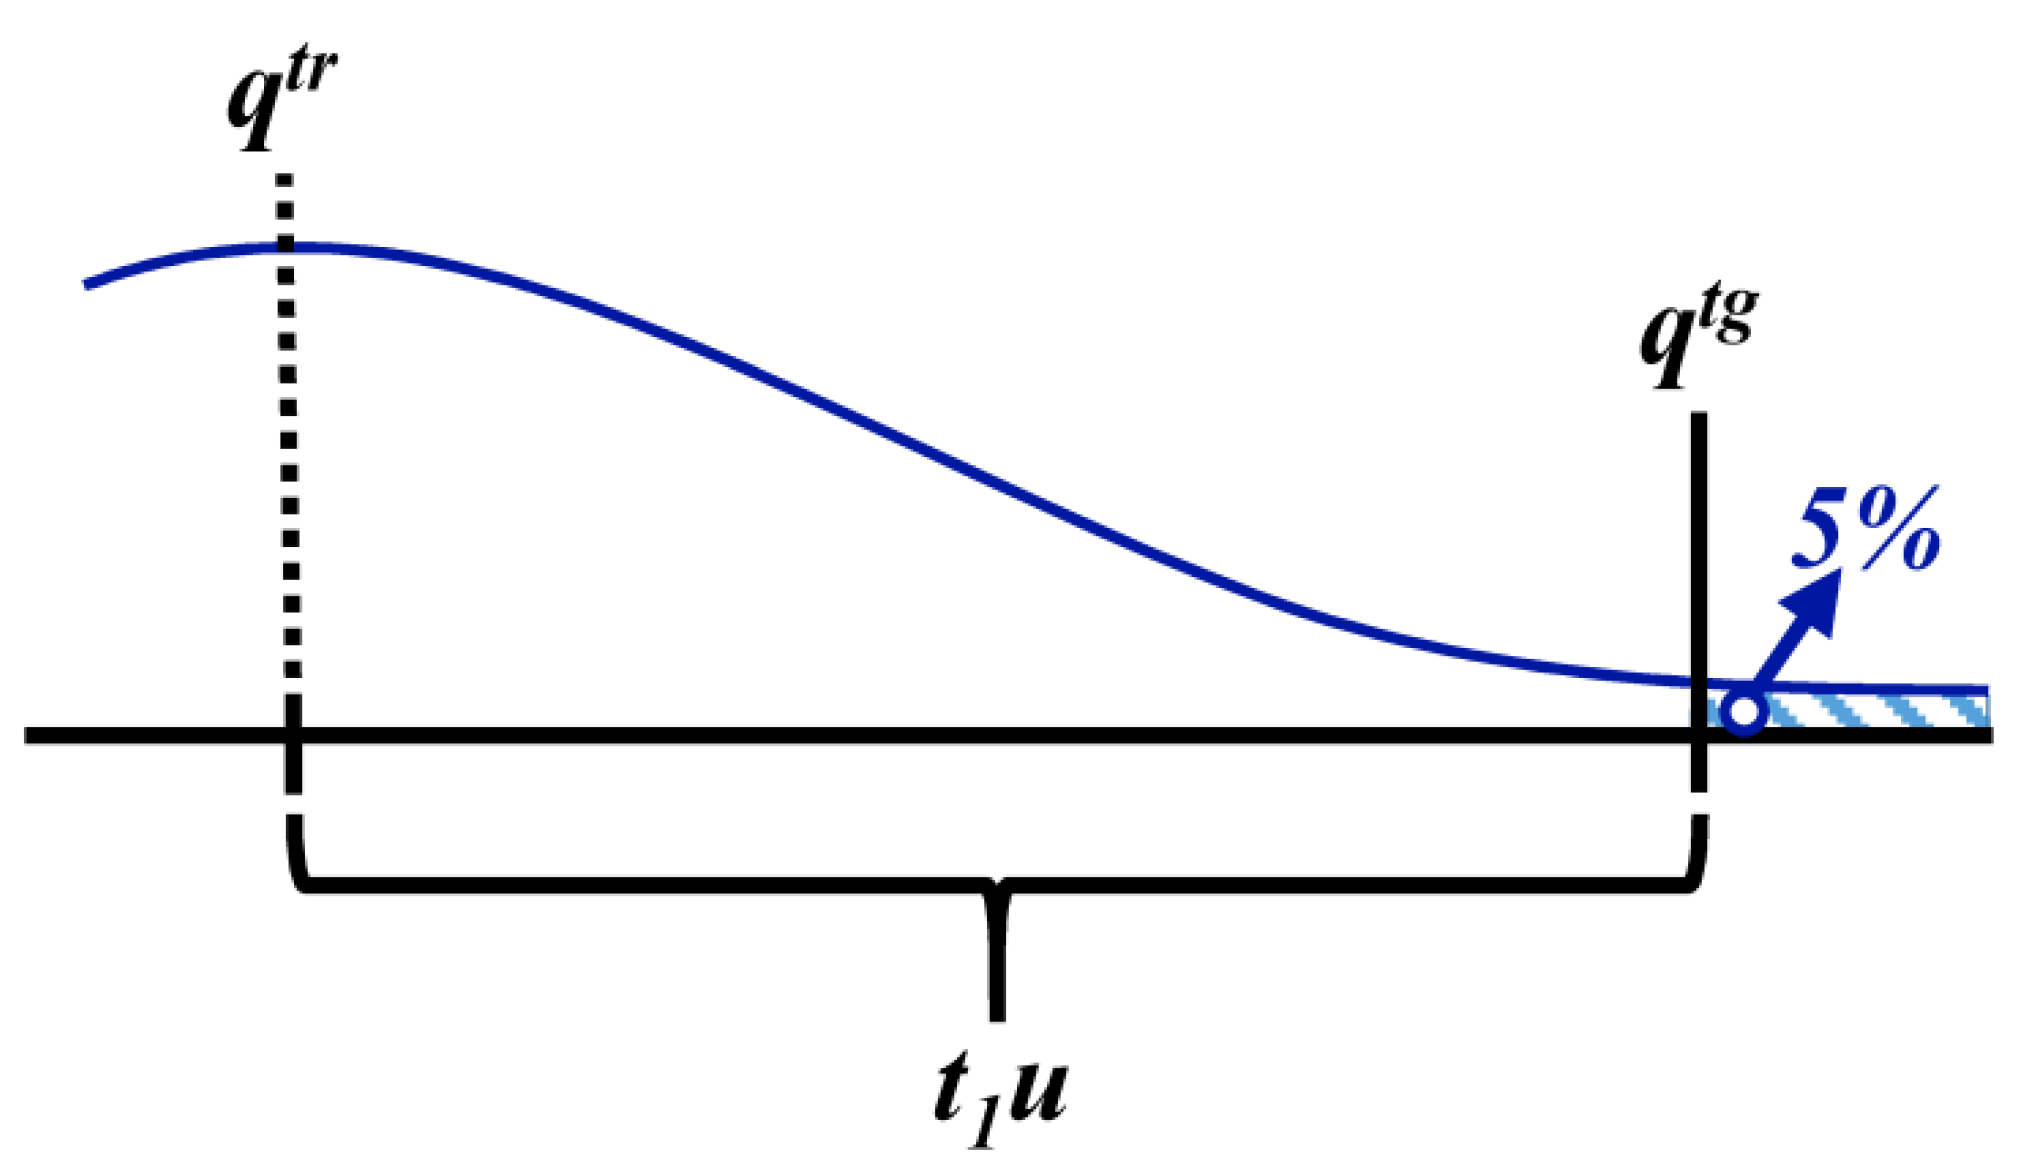
(i) Maximum target quantity value qtg: Defined a minimum threshold quantity qtr to be likely considered non-compliant.
If the following conditions for deciding product compliance are applicable (C1 to C3), the target standard uncertainty utg should be estimated by Equation (3) as illustrated in Figure 4.

(C1) Measurement uncertainty: Measurement results are associated with a normal distribution and the absolute measurement uncertainty is approximately constant in a relevant range next to the target quantity value;
(C2) Decision rule: The product is considered not compliant if the measured quantity value, q, minus an adequate multiple ku of its standard uncertainty u (where k is the multiplying factor and ku is the guard band [7]), is above the target quantity value qtg [i.e., (q − ku) > qtg]. The k is typically the one-tailed Student’s t t1 for an adequate confidence level and degrees of freedom of u [7];
(C3) Decision risk: A minimum threshold quantity, qtr, is set above which the probability of deciding a product is not compliant is above 95%. The qtr is typically a multiple of qtg.
Figure 4.
The standard uncertainty u that supports measurements of a “true” threshold quantity, qtr, with a 95% chance of correctly indicating the non-compliance of the product, considering a maximum target quantity value, (qtq), by producing a measured quantity, q, above the guard band (qtg + t1u). Compliance assessment takes measurement uncertainty into account. Above qtr, the chance of indicating the non-compliance is larger than 95%.
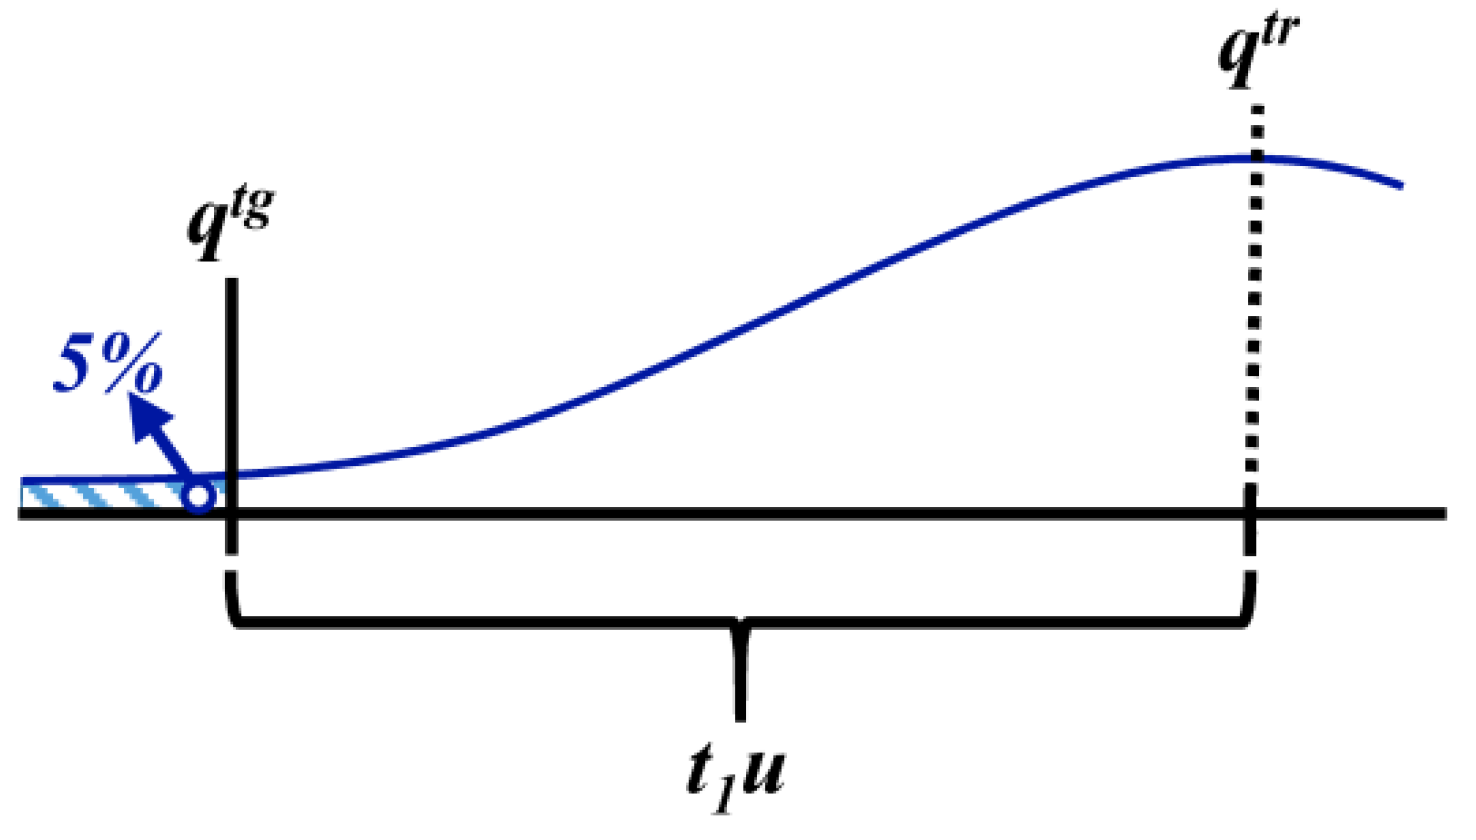
If the previously defined C2 condition, regarding the decision rule, is changed to “compliance is decided without taking measurement uncertainty into account”, a larger target measurement uncertainty is set [Equation (4)] (Figure 5).
Figure 5.
The standard uncertainty u that supports measurements of a “true” threshold quantity, qtr, with a 95% chance of correctly indicating the non-compliance of the product, considering a maximum target quantity value, (qtg), by producing a measured quantity, q, above qtg. Compliance assessment does not take measurement uncertainty into account. Above qtr, the chance of indicating the non-compliance is larger than 95%.

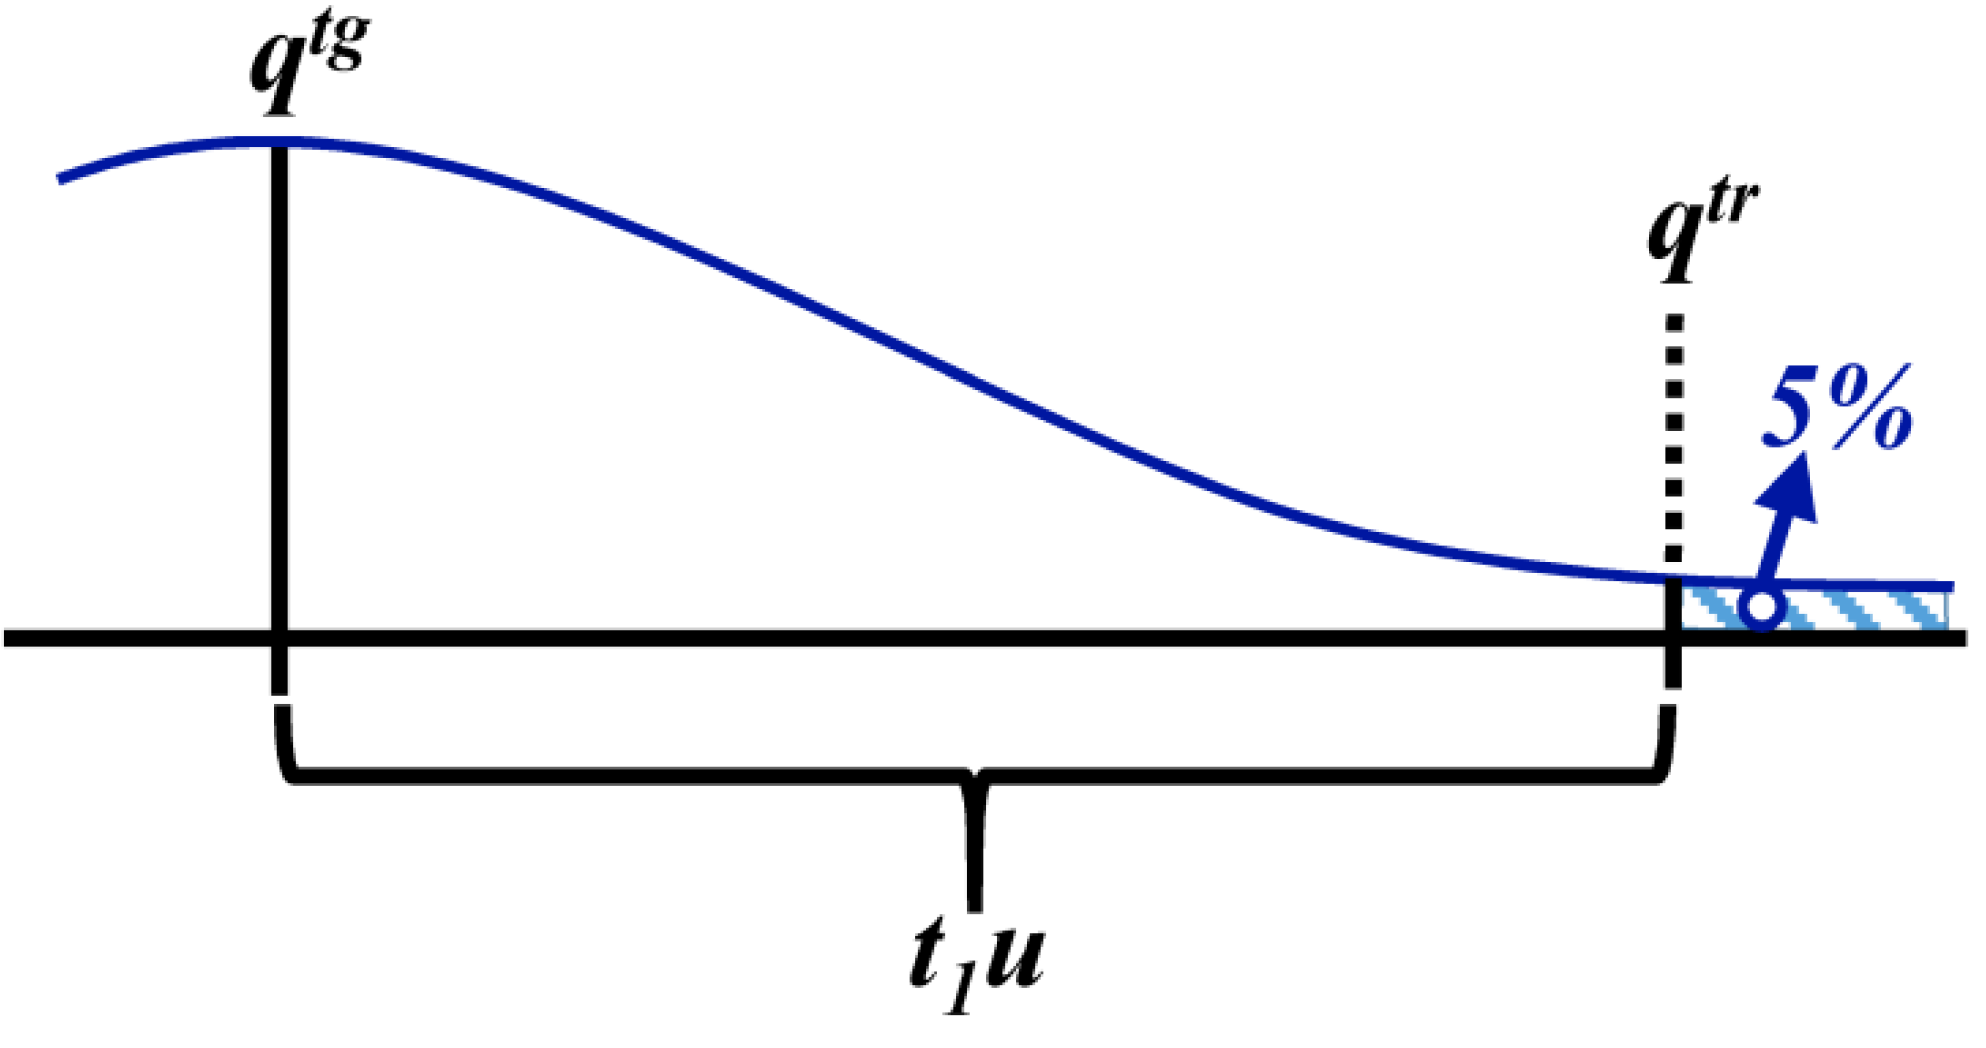
(ii) Minimum target quantity value qtg: Defined a maximum threshold quantity qtr to be likely considered non-compliant.
If a minimum, instead of a maximum, quantity value is defined, and together with this a maximum threshold quantity, qtr, below which a wrong compliance decision should be unlikely, the target standard uncertainty should be calculated by Equation (5), if the decision rule takes measurement uncertainty into account (q + ku < qtg), or by Equation (6) if uncertainty is not taken into account (q < qtg).


Figure 6, Figure 7 present schemes supporting both Equations (5) and (6). These schemes are symmetric to those presented in Figure 4, Figure 5, respectively.
Figure 6.
The standard uncertainty u that supports measurements of a “true” threshold quantity, qtr, with a 95% chance of correctly indicating the non-compliance of the product, considering a minimum target quantity value, (qtq), by producing a measured quantity, q, below the guard band (qtg − t1u). Compliance assessment takes measurement uncertainty into account. Below qtr, the chance of indicating the non-compliance is larger than 95%.
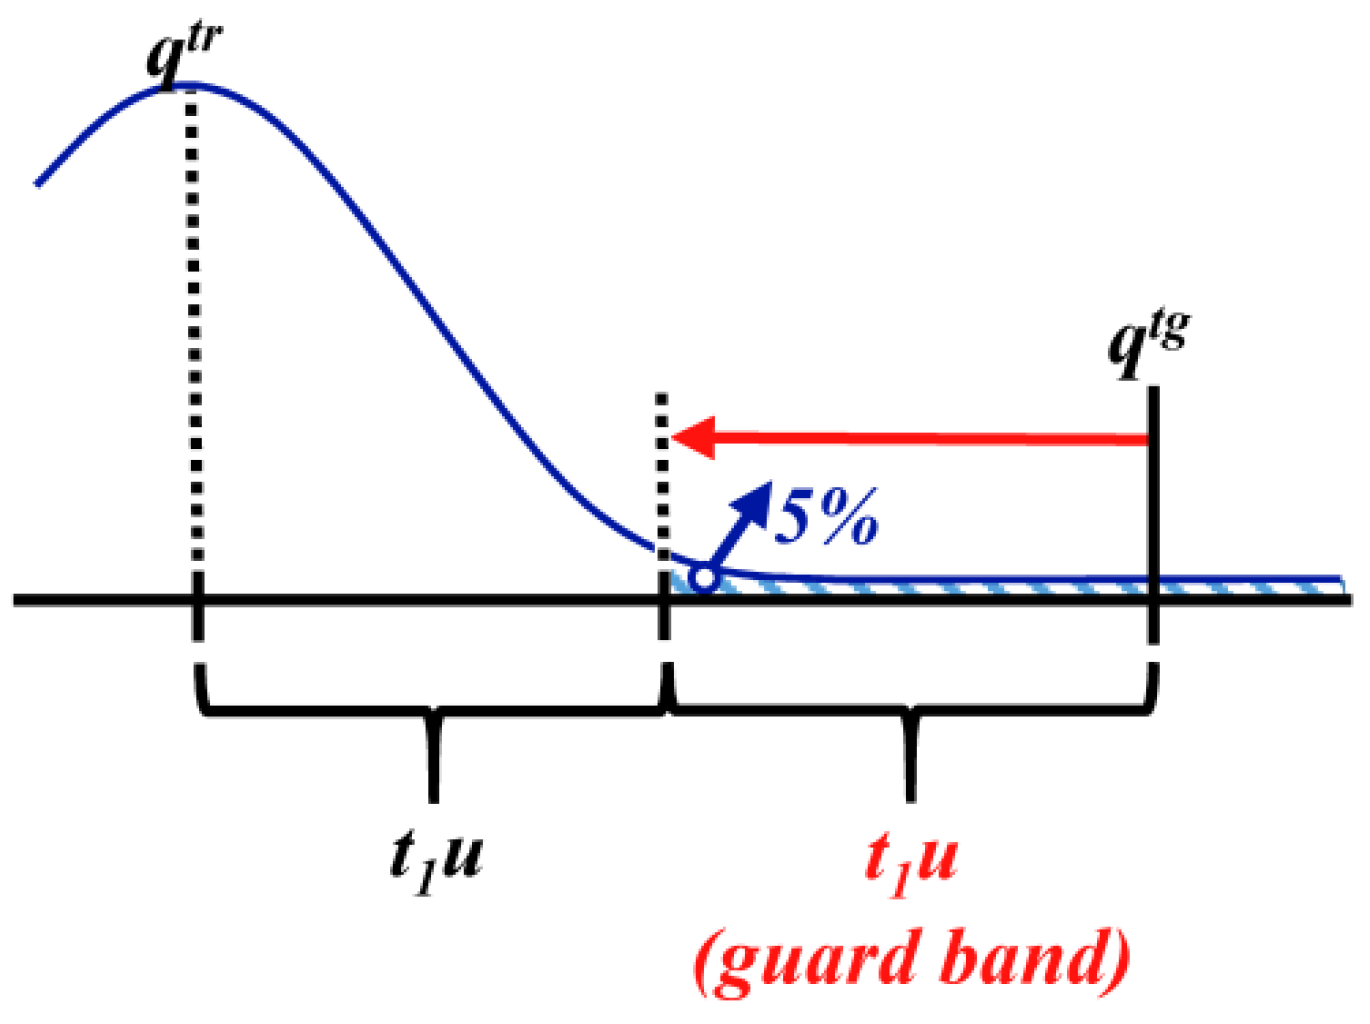
Figure 7.
The standard uncertainty u that supports measurements of a “true” threshold quantity, qtr, with a 95% chance of correctly indicating the non-compliance of the product, considering a minimum target quantity value, (qtg), by producing a measured quantity, q, below qtg. Compliance assessment does not take measurement uncertainty into account. Below qtr, the chance of indicating the non-compliance is larger than 95%.
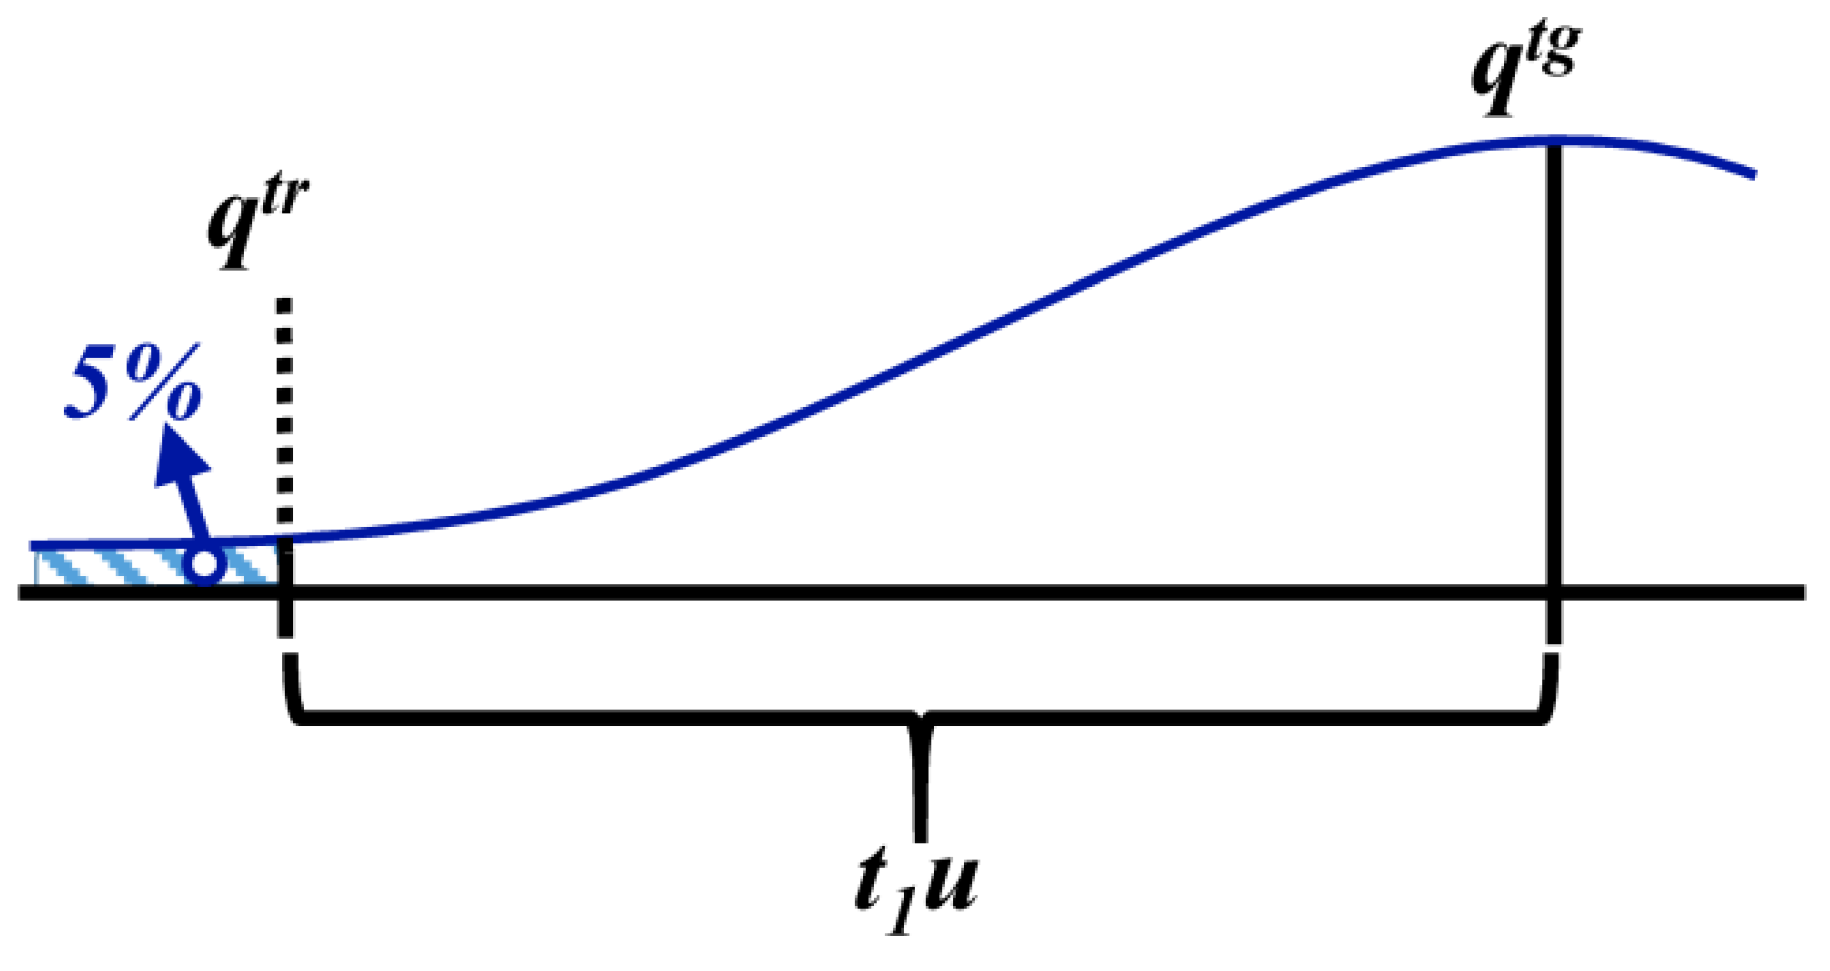
(iii) Maximum target quantity value qtg: Defined a maximum threshold measured quantity value qtr of a compliant product.
The measurement quality requirement can focus on the chance of measurement of a compliant product producing a measured quantity value above a maximum threshold quantity, qtr, larger than the target one qtg. In this case, if condition C1 of (i) in Section 3.1.4) is valid, the target measurement uncertainty should also be calculated from Equation (4) as illustrated in Figure 8.
Figure 8.
The standard uncertainty u that supports measurements of a “true” quantity equivalent to qtg, with a 5% chance of producing a measured quantity value above a maximum quantity, qtr.
Figure 8.
The standard uncertainty u that supports measurements of a “true” quantity equivalent to qtg, with a 5% chance of producing a measured quantity value above a maximum quantity, qtr.
(iv) Minimum target quantity value tg: Defined a minimum threshold measured quantity value qtr of a compliant product.
If a minimum target quantity, qtg, is set together with a lower threshold value for the measured quantity value qtr that would unlikely be obtained or overtaken by a complaint product, the utg is estimated by Equation (6) as illustrated in Figure 9.
Figure 9.
The standard uncertainty u that supports measurements of a “true” quantity equivalent to qtg, with a 5% chance of producing a measured quantity value below a minimum quantity, qtr.
Figure 9.
The standard uncertainty u that supports measurements of a “true” quantity equivalent to qtg, with a 5% chance of producing a measured quantity value below a minimum quantity, qtr.
The criteria of Sections 3.1.4: (i), (ii), (iii) and (iv) can be used when risk of accepting a product with a quantity above or below qtr becomes too high. The qtr can be, for instance, the content of a contaminant above which acute toxicity becomes relevant when qtg is defined considering chronic toxicity.
3.2. Proficiency Evaluation Criterion
If reference documents of the target quantity value of the analysed items do not define measurement quality requirements, this information can be obtained from interlaboratory performance data or from how measurements are assessed in proficiency tests or other interlaboratory comparisons.
3.2.1. Proficiency Tests
In most analytical fields, performance in proficiency tests is evaluated by calculating z-scores estimated by the ratio between the measurement error and a reference standard deviation [Equation (7)].
![Water 05 01279 i007]() where xi, Xtrue and σ are the value estimated by the laboratory, the conventional “true” value of the quantity and reference standard deviation of the proficiency test, respectively. The σ can be the robust standard deviation of results of participants or a fit for intended use standard deviation, typically a percentage of Xtrue. In drinking water analysis of major components, it is generally used a reference standard deviation of 10% of Xtrue [8].
where xi, Xtrue and σ are the value estimated by the laboratory, the conventional “true” value of the quantity and reference standard deviation of the proficiency test, respectively. The σ can be the robust standard deviation of results of participants or a fit for intended use standard deviation, typically a percentage of Xtrue. In drinking water analysis of major components, it is generally used a reference standard deviation of 10% of Xtrue [8].

The reference standard deviation of the proficiency test σ can be used to define the target standard uncertainty ( ![Water 05 01279 i030]() ) for which a coverage factor of 2 can be used to expand to a confidence level of 95% (
) for which a coverage factor of 2 can be used to expand to a confidence level of 95% ( ![Water 05 01279 i031]() ).
).
 ) for which a coverage factor of 2 can be used to expand to a confidence level of 95% (
  ).
).This strategy is preferable to the use of target intervals of the quantity value to define the target measurement uncertainty (see end of Section 3.1.3) when criterion for defining σ results from a large consensus between analysts of the specific analytical field.
3.2.2. Measurement Reproducibility
Whenever the standard deviation of the measurement reproducibility sR or the reproducibility limit R (where R = 2.83sR) is available in the used standard measurement procedure or in the report of an interlaboratory comparison, sR can be used as the target standard uncertainty for the specific quantity value: ![Water 05 01279 i032]() . If sR is estimated with a low number of degrees of freedom (νtg), this information should be considered in estimating the target expanded uncertainty Utg [
. If sR is estimated with a low number of degrees of freedom (νtg), this information should be considered in estimating the target expanded uncertainty Utg [ ![Water 05 01279 i033]() , where
, where ![Water 05 01279 i034]() is the Student’s t for νtg degrees of freedom and 95% confidence level] and making a comparison with the estimated measurement uncertainty (see Section 5).
is the Student’s t for νtg degrees of freedom and 95% confidence level] and making a comparison with the estimated measurement uncertainty (see Section 5).
 . If sR is estimated with a low number of degrees of freedom (νtg), this information should be considered in estimating the target expanded uncertainty Utg [
  , where
  is the Student’s t for νtg degrees of freedom and 95% confidence level] and making a comparison with the estimated measurement uncertainty (see Section 5).
For rational measurements, where bias attributed to the physical-chemical principles of the procedure δ can be significant, if sR is not estimated from an adequate diversity of measurement procedures, a target bias, δtg, should be considered in the calculation of the utg. In this case, sR and half the target bias δtg should be combined according to Equation (8) [9]:
![Water 05 01279 i008]()

3.2.3. Maximum Error
Some producers of Certified Reference Materials (CRM) present, together with the certified value with respective uncertainty, the proposed maximum absolute error of single measurements performed in the routine analysis of the CRM. This information, frequently presented as an internal between the maximum q+ and minimum q− admissible measured quantity value, can be used to estimate the target measurement uncertainty. In this case, since this criterion is applicable to single measurements, the target expanded measurement uncertainty Utg can be estimated by Equation (9):
![Water 05 01279 i009]()

The uncertainty associated with the certified value is inadequate to this assessment since reflects a much larger effort in the characterisation of the material than in single routine measurements.
If the uncertainty associated with the certified value UCRM is not negligible considering the tolerance [ ![Water 05 01279 i036]() ], analyst can decide to subtract this component to estimate a target measurement uncertainty independent of the uncertainty of the CRM value:
], analyst can decide to subtract this component to estimate a target measurement uncertainty independent of the uncertainty of the CRM value:
![Water 05 01279 i010]() where k is the coverage factor used to expand the standard uncertainty associated with the certified value of the CRM.
where k is the coverage factor used to expand the standard uncertainty associated with the certified value of the CRM.
 ], analyst can decide to subtract this component to estimate a target measurement uncertainty independent of the uncertainty of the CRM value:

3.3. Magnitude of Studied Trends
Many important measurements are performed without having a target value of the measured quantity. The monitoring of a new contaminant in surface water, the study of the depletion of an endocrine disruptor after wastewater treatment and the composition of thermal water are just some examples. In these cases, measurement quality should be adequate to detect predicted trends or differences of items to be distinguished. The expected rate of variation of the analysed parameter in the studied time scale or the expected heterogeneity of studied property in items to be compared should be adequately studied by developed measurement procedure. Measurement standard uncertainty should be, at least, 4.24 times smaller than trends or differences needed to be distinguished, to be fit for the intended use. For instance, if methylparaben depletion in wastewater of more than 10% needs to be detected, measurement procedure should be developed to ensure the determination of the depletion rate with a standard uncertainty not larger than 2.4% (i.e., 2.4% = 10%/4.24).
The 4.24 factor is estimated from the equation used to check the compatibility of measurement results for a confidence level of 99% [1]. Two measurement results, [(xA ± kA·uA) and (xB ± kB·uB), where xi, ki and ui are the measured quantity value, the coverage factor and the combined standard uncertainty of measurement i (i = A or B)] are metrologically compatible, for a confidence level of 99%, if the absolute difference (or range, ρ) of their measured quantity values (i.e., ρAB = ǀxA − xBǀ) is not larger than the expanded uncertainty of the difference for a confidence level of 99%. Equation (11) presents the tested condition:
![Water 05 01279 i011]() where kd is the coverage factor of the standard uncertainty of the difference ud, {ud = [(uA)2 + (uB)2]½} for a confidence level of 99% and the degrees of freedom of ud.
where kd is the coverage factor of the standard uncertainty of the difference ud, {ud = [(uA)2 + (uB)2]½} for a confidence level of 99% and the degrees of freedom of ud.

If xA and xB are estimated with a high number of degrees of freedom, kd is approximately 3. Assuming uA and uB are equivalent (uA = uB = u), since xA and xB are similar, measurement results are metrologically compatible, and therefore, can represent independent measurement results of the same quantity value, if the following condition is valid:
![Water 05 01279 i012]()

Therefore, the target standard uncertainty utg allowed to distinguish a minimum range, ρmin, between xA and xB, is [ρmin/(3 ![Water 05 01279 i037]() ]; i.e., the u should be, at least, (3
]; i.e., the u should be, at least, (3 ![Water 05 01279 i037]() = 4.24) times smaller than the ρmin to distinguish this minim range. If ud is expected to be associated with a low number of degrees of freedom, the kd must be adjusted accordingly.
= 4.24) times smaller than the ρmin to distinguish this minim range. If ud is expected to be associated with a low number of degrees of freedom, the kd must be adjusted accordingly.
 ]; i.e., the u should be, at least, (3 = 4.24) times smaller than the ρmin to distinguish this minim range. If ud is expected to be associated with a low number of degrees of freedom, the kd must be adjusted accordingly.
3.4. Information from a Different Scope
Many relevant analytical measurements are performed where no target values of measurement performance parameters are supplied, or proficiency tests or other comparisons were or are regularly promoted. In these cases, target uncertainty can be defined considering target values of performance parameters of related measurements.
The target quantity values and target measurement uncertainties are defined allowing for the impact of the measured quantity on the managed interests, ranging from individual or public health matters to issues relevant to the economy. If similarity or relations between the managed interests are identified, target measurement uncertainty defined for one “analyte/matrix/measurement goal” combination can be used to define target measurement uncertainty in other analytical problem. This extrapolation is more straightforward for more similar or more related analytical problems.
When clear differences in the demand of the control of two quantities are observed, this can be used to justify the adopted proportion between the respective target measurement uncertainties. For instance, the target uncertainty of measurements of lead in drinking water should be smaller than the one associated with measurements of lead in wastewaters.
This extrapolation is less obvious for different parameters but it is also possible. For instance, the relative uncertainty associated with measurements of hardness in drinking water can be larger than the one associated with measurements of chloride or sodium for which target quantity values are defined in Directive 98/83/EC [2] (see Section 7.8). Therefore, the target measurement uncertainty can be easily transferred between various parameters of the same analytical sector. Frequently, performance requirements vary from major to minor components. In some cases, due to analytical limitations, target measurement uncertainty for organic parameters is larger than it is for inorganic parameters.
Any transference of the target measurement uncertainty should be clearly justified. Consecutive transference of information from one analytical problem to another should be avoided since it tends to become less consensual.
The definition of the target measurement uncertainty should balance the need to ensure acceptance, by an individual or the community, with the feasibility of the target measurement uncertainty being reached considering the state-of-the-art of measurement procedures. Often, people without analytical or metrological background in the field of measurements tend to request unrealistically low measurement uncertainty. In these cases, it is the analyst’s responsibility to make it clear why the proposed target measurement uncertainty is adequate and/or possible.
4. Variation of the Target Measurement Uncertainty with the Quantity Value
If a target measurement uncertainty is, or can be, defined for only some quantity values and measurement adequacy must be assessed in a range of quantities, the expected variation of the measurement uncertainty with the quantity can be used to define target uncertainty values for the analytical scope.
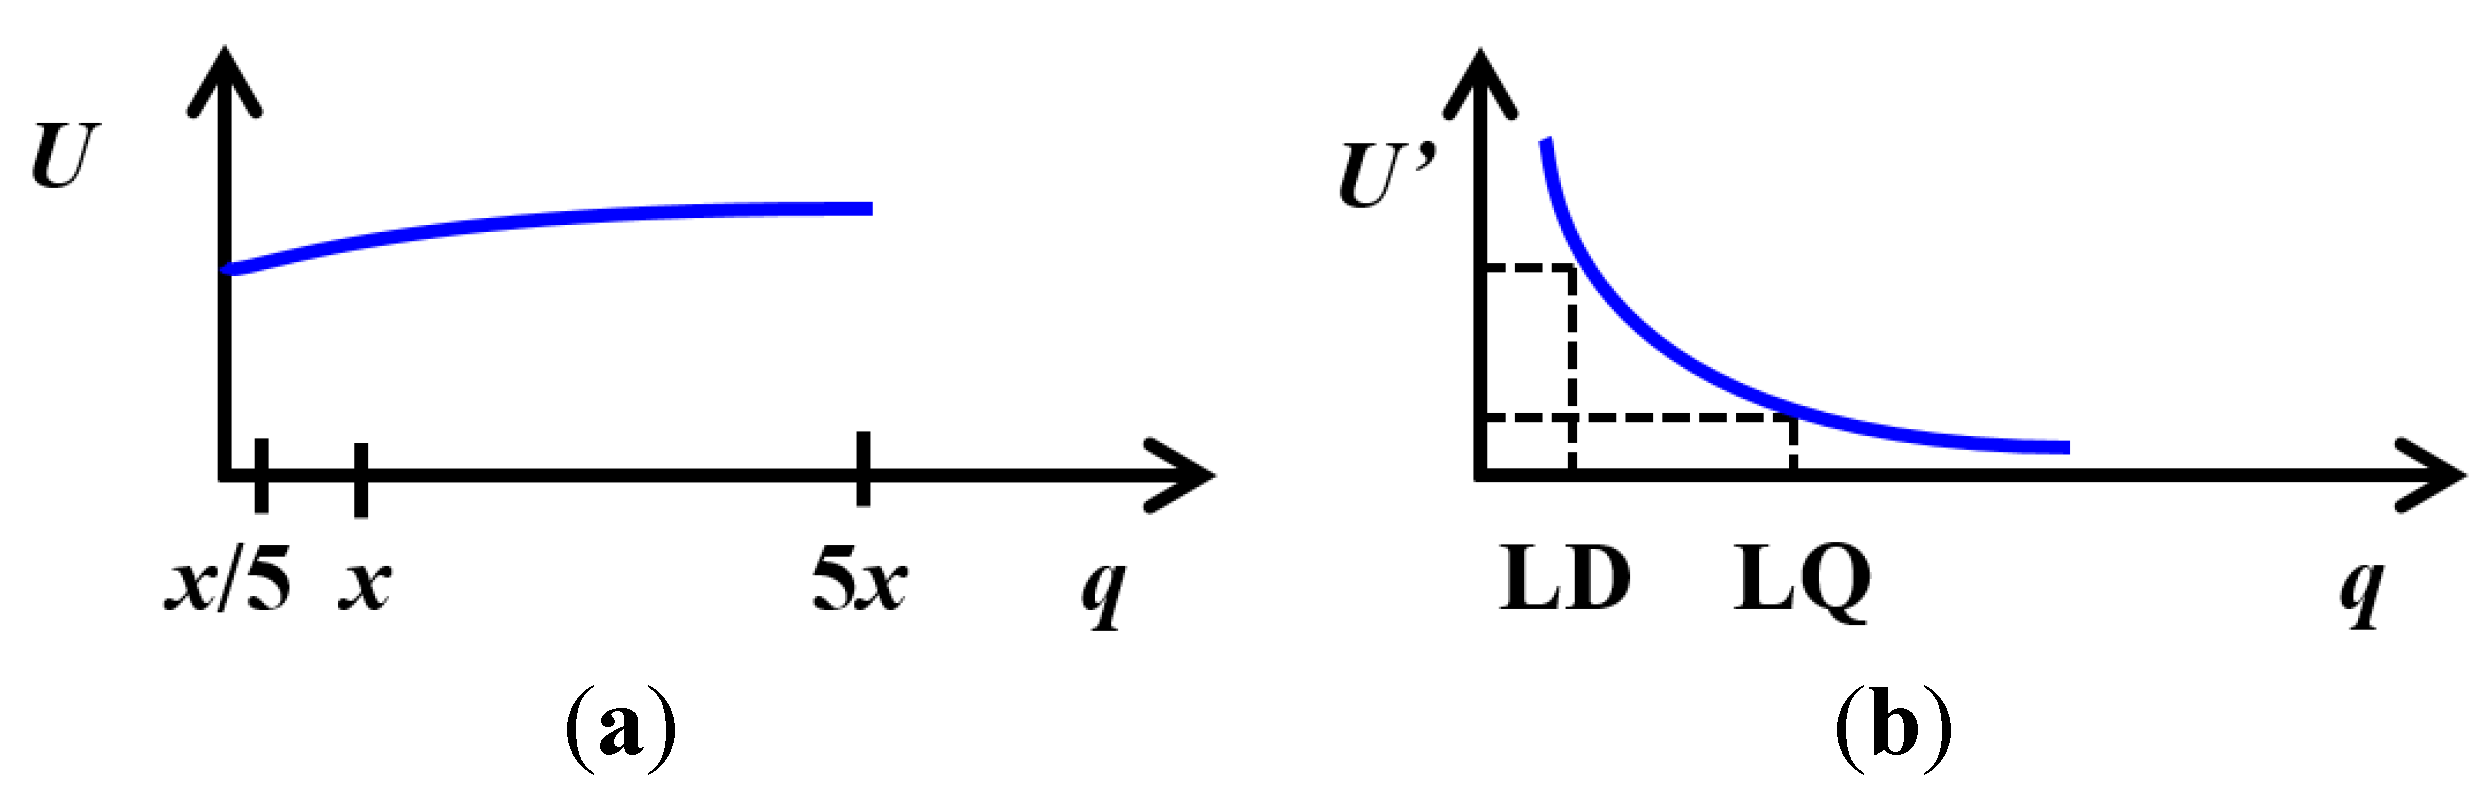
The absolute measurement uncertainty U tends to be constant in half an order of magnitude (i.e., in a range where the minimum quantity value is five times smaller than the largest one). If a target measurement uncertainty defined for a quantity value is applied five times above and five times below this quantity, the lowest quantity of the interval will be 25 times lower than the highest one (Figure 10a).
Figure 10.
Expected trends of the variation of (a) absolute (U) and (b) relative (U’) measurement uncertainty with the quantity value (q). The x is the quantity value for which target absolute measurement uncertainty is defined.
Figure 10.
Expected trends of the variation of (a) absolute (U) and (b) relative (U’) measurement uncertainty with the quantity value (q). The x is the quantity value for which target absolute measurement uncertainty is defined.

The relative measurement uncertainty U’ decreases with quantity value increase, being that this reduction is abrupt from LD to about 2LQ. Above 2LQ, the relative measurement uncertainty tends to be approximately constant (Figure 10b).
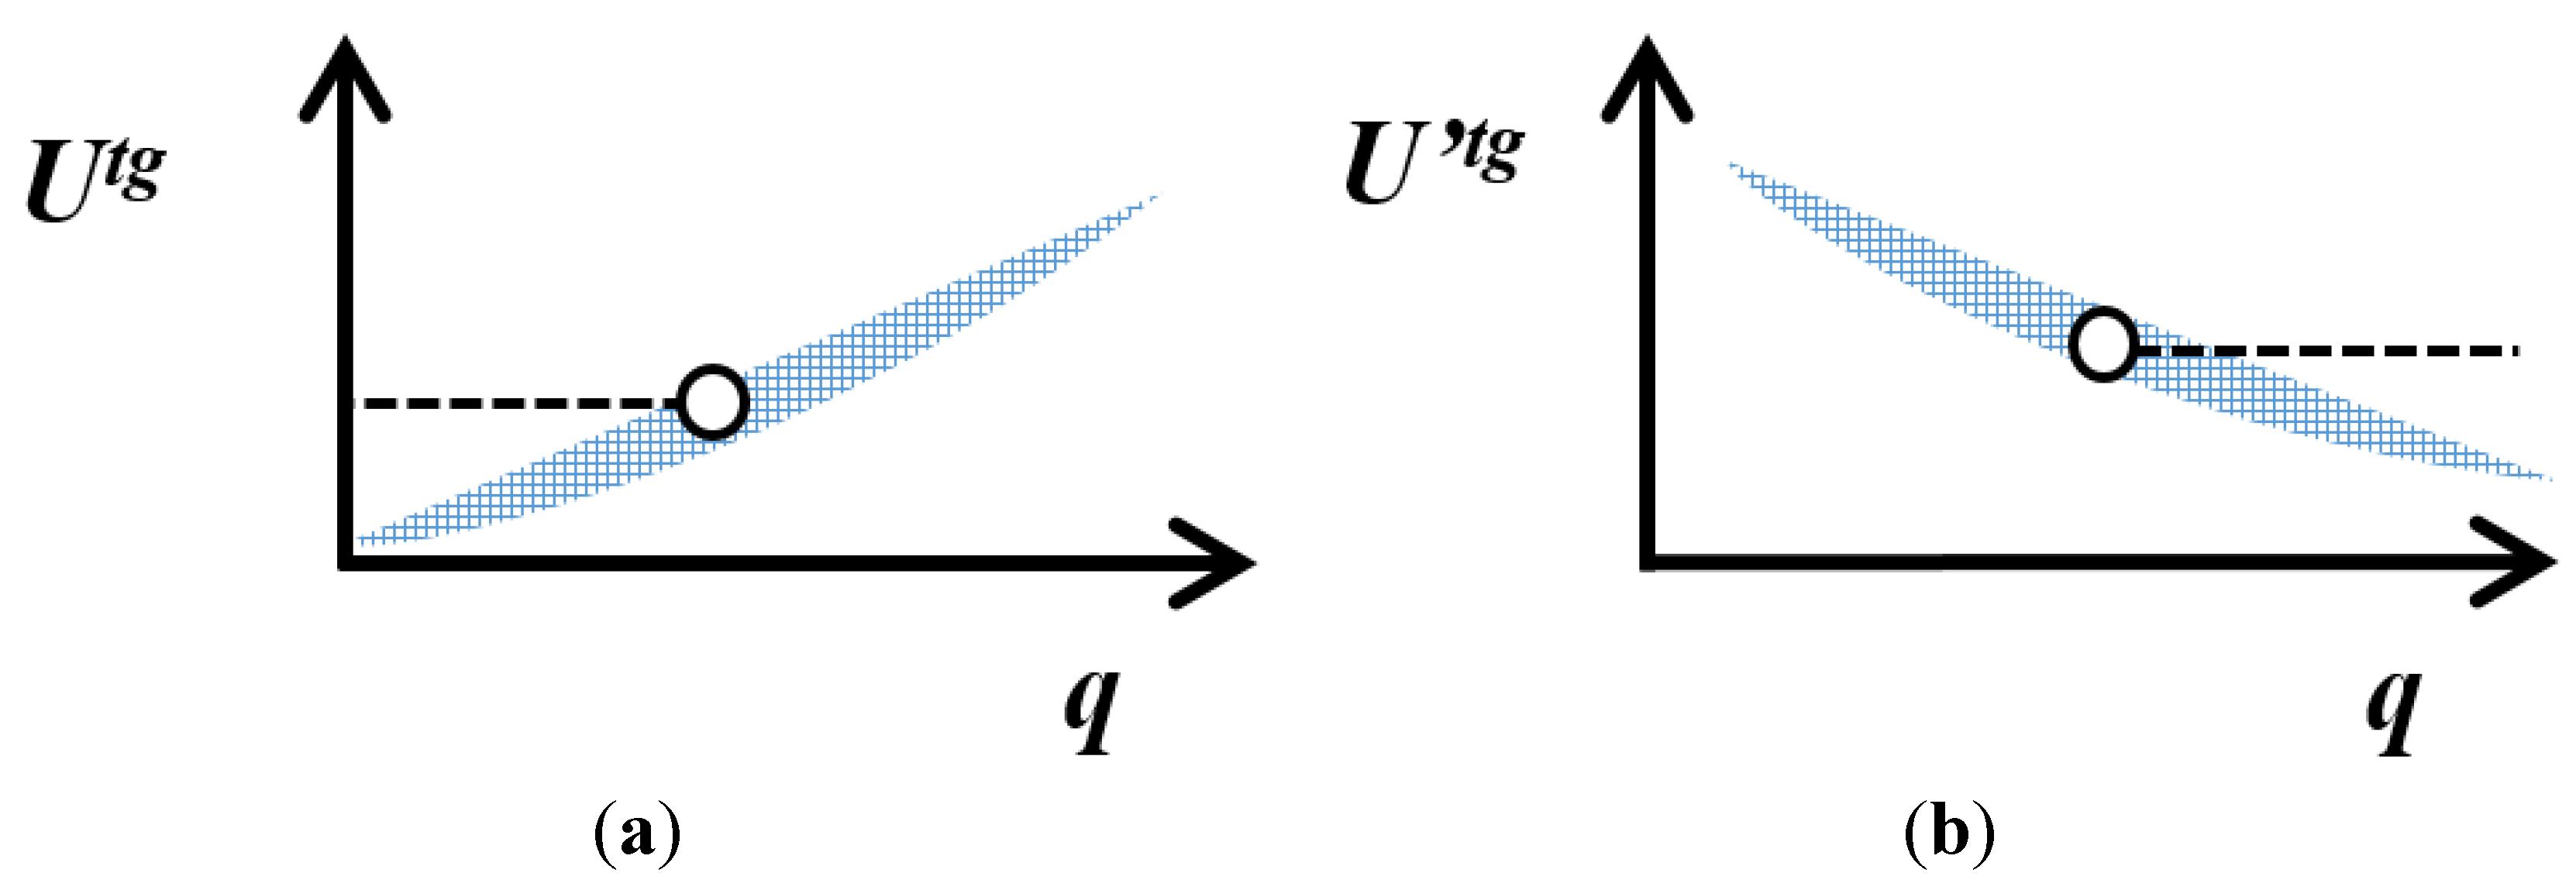
These frequent trends suggest that a target relative measurement uncertainty set at a quantity value is feasible above that level, and a target absolute measurement uncertainty is applicable down to five times below this level (Figure 11). In many cases, the target absolute measurement uncertainty can even be applicable further below since uncertainty tends to decrease with quantity reduction.
Figure 11.
(a) The absolute Utg and (b) relative U’tg target measurement uncertainties defined at a quantity value can be applied half a magnitude order below and above this value, respectively. Where ![Water 05 01279 i043]() represents the expected trend of U or U’ with the quality value, q.
represents the expected trend of U or U’ with the quality value, q.
 represents the expected trend of U or U’ with the quality value, q.
Figure 11.
(a) The absolute Utg and (b) relative U’tg target measurement uncertainties defined at a quantity value can be applied half a magnitude order below and above this value, respectively. Where ![Water 05 01279 i043]() represents the expected trend of U or U’ with the quality value, q.
represents the expected trend of U or U’ with the quality value, q.
represents the expected trend of U or U’ with the quality value, q.
Since target measurement uncertainty is particularly important next to the target quantity value, any extrapolation to this critical value should involve a reflexion of the adequacy of the measurement requirements.
5. Comparison of the Estimated with the Target Measurement Uncertainty
The comparison of estimated and target measurement uncertainties should be performed keeping in mind the uncertainty associated with uncertainty estimation itself [5]. The quantified measurement uncertainty is an estimation of the measurement quality affected by the variability of the estimation process.
If the estimated measurement uncertainty U is smaller than Utg, it can be concluded that the measurement is fit for the intended use. However, if U is slightly above Utg, it should be checked if U can be claimed to be statistically equivalent to Utg.
Since most results of measurements in chemistry are, at least, approximately normally distributed, the estimated u and conventional utg can be compared with an F-test taking respective degrees of freedom into account. It can be assumed that the conventional utg or Utg is defined for a high number of degrees of freedom. If Utg is defined for a 95% confidence level, utg is calculated by dividing Utg by a coverage factor of 2 (utg = Utg/2).
The comparison of utg with a larger u, estimated for a measurement, involves the calculation of a F factor (Equation 13), and its comparison with the one-tailed F-statistics ![Water 05 01279 i040]() for the degrees of freedom associated with u, ν, and utg, νtg, and a confidence level of 95%.
for the degrees of freedom associated with u, ν, and utg, νtg, and a confidence level of 95%.
 for the degrees of freedom associated with u, ν, and utg, νtg, and a confidence level of 95%.
If F is smaller or equal to ![Water 05 01279 i040]() , it can be assumed that there is no evidence that u is larger than utg. Assuming ν is larger than 50, a
, it can be assumed that there is no evidence that u is larger than utg. Assuming ν is larger than 50, a ![Water 05 01279 i040]() of 1.35 can be used.
of 1.35 can be used.
, it can be assumed that there is no evidence that u is larger than utg. Assuming ν is larger than 50, a of 1.35 can be used.At the end of measurement procedure validation, when measurement procedure is checked to be fit for intended use, prediction models of the measurement uncertainty estimated for a relevant quantity range are compared with the target measurement uncertainty utg or a larger maximum value, umax, reflecting the described F-test [Equation (14)]:
![Water 05 01279 i014]()

The target measurement uncertainty utg is the maximum admissible uncertainty to decide whether a measurement is fit for the intended use. The maximum value umax is the maximum admissible value for an occasional estimation of the measurement uncertainty.
6. Measurement Uncertainty Optimization
If comparison between estimated and target measurement uncertainties proves measurements are not fit for the intended use in relevant quantity values or ranges, measurement uncertainty must be reduced. Measurement uncertainty can be reduced if relevant uncertainty components can be minimized. The so called bottom-up approach [4,10] for the evaluation of the measurement uncertainty produces models most suitable for this optimization, where direct links between material improvements of the analytical steps or effects and global measurements uncertainty reduction can be established. Whenever this information is not available and/or changes in measurement procedure or used reference materials do not reduce measurement uncertainty to an adequate level, the analyst can reduce the component related with measurement precision by reporting the mean of replicate measurements.
The standard deviation of the intermediate precision sIP can be divided into two components: the repeatability standard deviation sr and the between days standard deviation sBD {sIP = [(sr)2 + (sBD)2]½}. The sBD reflects the effect of the operator and/or equipment in the measurements’ variability. These two components of sIP can be easily estimated from results of the replicated analysis of the same, or portions of a homogeneous, stable item in repeatability conditions, where these experiments are also repeated on different days. These data are further processed by a one-way ANOVA [11] estimating sr and sBD separately.
The standard deviation of the intermediate precision, adequately estimating relevant random effects (ura = sIP), can be reduced in different ways:
(i) If results of unknown samples are estimated by the mean of n replicate measurements obtained under repeatability conditions, the standard deviation of the intermediate precision of the mean sPI(1) is:
![Water 05 01279 i015]()

(ii) If replicated measurements are performed under intermediate precision conditions, the standard deviation of the intermediate precision of this mean of the m replicate measurements sIP(2) is:
![Water 05 01279 i016]() where sIP is the standard deviation of the intermediate precision of single measurements.
where sIP is the standard deviation of the intermediate precision of single measurements.

(iii) Both equations can be combined if the reported result is the mean of the m average values obtained on different days where, on each day, n replicate measurements are performed under repeatability conditions. In this case, the intermediate precision of the mean of m × n replicate measurements is:
![Water 05 01279 i017]()

This strategy to improve precision—in many cases, a major uncertainty component—can be particularly useful for measurements next to the target quantity value. In that case, the extra experimental effort will be performed only when strictly needed.
7. Examples
The following sections present examples of the definition of the target uncertainty in the previously described scenarios.
7.1. Defined Target Measurement Uncertainty
European legislation defines target quantity values of several chemical parameters in water intended for the abstraction of drinking water, environmental water, bathing water, and urban and industrial wastewater [2,12,13,14,15,16,17,18,19]. Nevertheless, these documents do not define target measurement uncertainties.
7.2. Defined Measurement Performance Parameters
In the European Union, the monitoring of drinking water quality must be supported by measurements and measurement procedures fulfilling the requirements presented in Council Directive 98/83/EC [2]. This directive sets target quantity values of various chemical parameters designated as “parametric values” and target maximum values for the “Limit of detection”, “Trueness” and “Precision”. This document uses terminology different from the one presented in the latest edition of the VIM [1]. The defined target performance values are fractions of the “parametric value”. The “trueness” represents the absolute difference between the mean quantity value estimated from a large number of repeated measurements and the “true” value, and the precision is “twice the standard deviation” of measurements performed “within and between batch”. Using VIM terminology [1], “trueness” (τ) is the absolute mean error and “precision” (π) is two times the standard deviation of measurements collected under repeatability or intermediate precision conditions [20].
For the determination of Cd in drinking water, the parametric value is 5 μg L−1, and τ and π are 0.5 μg L−1 (τ = π = 10%·5 μg L−1).
According to Equation (1):
![Water 05 01279 i018]()

For instance, if the standard uncertainty u of a specific measurement is 0.42 μg L−1, measurement is not fit for the intended use since u is larger than 0.41 μg L−1 ( ![Water 05 01279 i029]() =0.35
=0.35 ![Water 05 01279 i041]() ) (see Section 5). Nevertheless, if Cd results are estimated by the mean of duplicate measurement performed in two consecutive days (i.e., under intermediate precision conditions), the standard uncertainty can become fit for the intended use (see Section 6).
) (see Section 5). Nevertheless, if Cd results are estimated by the mean of duplicate measurement performed in two consecutive days (i.e., under intermediate precision conditions), the standard uncertainty can become fit for the intended use (see Section 6).
=0.35  ) (see Section 5). Nevertheless, if Cd results are estimated by the mean of duplicate measurement performed in two consecutive days (i.e., under intermediate precision conditions), the standard uncertainty can become fit for the intended use (see Section 6).
7.3. Defined Target Quantity Value
In the European Union, the quality of bathing water is regulated by Directive 76/160/EEC [13] that supports national monitoring programmes. This legislation establishes limits for microbiological and physical-chemical parameters. The pH of bathing water should be between 6 and 9 but provisions exist for exceeding the limits under some conditions. Therefore, the determination of pH in bathing water should be able to distinguish pH values within this interval. According to what is proposed in Section 3.1.3, the expanded measurement uncertainty should be smaller or equal to [(9 – 6)/8] = 0.38 in pH (i.e., Utg = 0.38). This Utg represents a relative expanded uncertainty, U'tg , next to pH = 7 of 5.4%. This performance is easily achievable by potentiometric determinations with combination glass electrode.
7.4. Proficiency Tests
In 2007, the Institute for Reference Materials and Measurements (IRMM) of the European Commission promoted a proficiency test, for National Reference Laboratories appointed by the Member States, for the determination of Cd, Pb and Hg in mineral water [21]. In this proficiency test, the assigned value was determined, with negligible uncertainty considering participants’ performance, by gravimetric spiking of the material. The laboratory performance was assessed by calculating a z-score and a zeta-score. The z-score was calculated assuming a reference standard deviation of 10% of the assigned value. Therefore, the promoter of the proficiency test suggested that measurement results should be affected by a relative standard uncertainty not larger than 10% (i.e., u'tg = 10%). If the variability of the measurement uncertainty estimation process is considered and uncertainty is estimated with a high number of degrees of freedom, the quantified relative standard uncertainty can reach up to 11.6% (see Section 5).
7.5. Measurements Reproducibility
The relative standard deviation of the reproducibility of measurements of 300 µg L−1 of copper in wastewaters, by electrothermal atomic absorption spectrometry following the SMEWW3113B (SMEWW-Standard Methods for the Examination of Water & Wastewater) procedure, is 14% [22]. Therefore, the relative target expanded uncertainty—for a confidence level of 95%—of this determination is 28%. If the variability of the uncertainty estimation process is considered, the estimated relative expanded uncertainty can reach up to 32%. Section 7.9 discussed the determination of the target uncertainty in a wide quantity range.
7.6. Maximum Error
The certificate of the reference material “EnviroMAT EU-H-1” of the mass concentration of metals in wastewater [23] reports the certified values with measurement uncertainty and tolerances of measured quantity values estimated from single measurements performed by the user of this material. For instance, for Pb, the certified value is (0.73 ± 0.01) mg L−1 for a confidence level of 95% and the tolerance of the measured quantity value estimated from single measurements is (0.73 ± 0.08) mg L−1 for the same confidence level. Therefore, the producer of this reference material suggests a target expanded measurement uncertainty of 0.079 mg L−1 estimated by Equation (19) (Section 3.2.3):
![Water 05 01279 i019]()

If the variability of the uncertainty estimation process is also considered, the expanded uncertainty of measurements of Pb in wastewater are adequate if smaller than 0.092 mg L−1. This criterion is defined considering measurement quality requirements defined by the reference material producer. This target uncertainty can be applied in a quantity range of 0.15–3.6 mg L−1 (see Section 4), if a relative expanded uncertainty of 61% at 0.15 mg L−1 is acceptable.
Regardless of the defined Utg, the quality of measurements of the reference material performed by the user of the material should be assessed by evaluating the metrological compatibility of estimated and reference results taking into account their respective uncertainties [1] [Equation (11)].
7.7. Magnitude of the Studied Trends
The optimisation of a wastewater treatment scheme, by changing conditions in a pilot plant, is supported by the percentage reduction of the chemical oxygen demand (COD) with the treatment. If variations in COD reduction of 5% are considered relevant, the determination of the COD reduction should be affected by a standard uncertainty not larger than 1.18% (i.e., 1.18 = 5/4.24) (see Section 3.3).
7.8. Information from a Different Scope
The hardness of drinking water—measured as the combined concentration of calcium and magnesium ions reported in mass concentration of CaCO3—is determined due to its impact on the organoleptic quality of water, performance of detergents and production of incrustation in heating water devices. Nevertheless, no target quantity values are defined for the mass concentration of calcium, magnesium or hardness in Directive 98/83/EC [2]. Since in this Directive the parameters with a larger target quantity value are chloride and sulphate (250 mg L−1) and the respective target performance parameters indicate a relative target expanded uncertainty of 14% next to the target quantity value (see Section 3.1.2 and 7.2), it can be decided to use twice this relative target uncertainty for determinations of hardness in the analytical range.
If the variability of the measurement uncertainty estimation process is considered and uncertainty is estimated with a high number of degrees of freedom, the quantified relative expanded uncertainty can reach up to 32%.
7.9. Variation of the Target Measurement Uncertainty with the Quantity Value
Various interlaboratory trials of the determination of copper in wastewater by electrothermal atomic absorption spectrometry (ETAAS), following SMEWW3113B procedure [22], were performed allowing estimates for the measurement reproducibility at different mass concentration levels. Table 2 presents the results of these trials.
Table 2.
Relative standard deviation of measurement reproducibility, ![Water 05 01279 i045]() , estimated in three interlaboratory tests of the determination of copper in wastewaters by measurement procedure SMEWW3113B [22].
, estimated in three interlaboratory tests of the determination of copper in wastewaters by measurement procedure SMEWW3113B [22].
 , estimated in three interlaboratory tests of the determination of copper in wastewaters by measurement procedure SMEWW3113B [22].
| Mass concentration of Cu (μg L−1) | (%) | |||
| Wastewater 1 | Wastewater 2 | Wastewater 3 | Maximum | |
| 234 | 21 | - | 26 | 26 |
| 300 | - | 14 | - | 14 |
| 1670 | - | 13 | - | 13 |
Table 2 results can be used to develop predictive worst-case models of the variation of measurement reproducibility with the mass concentration of copper, useful to define target values for the measurement uncertainty in this wide range.
Table 3 presents the developed model considering criteria presented in Section 4. This table defines the absolute S R or relative ![Water 05 01279 i045]() standard deviations of measurement reproducibility for various ranges, used to define the absolute utg or relative u'tg target standard uncertainty, respectively. The selectivity of the determination of copper in wastewater by ETAAS after an acid digestion of sample suggests measurement procedure bias is negligible and does not need to be considered in defining the target uncertainty. Convergent (“[#” or “#]”) or divergent (“]#” or “#[”) brackets indicate the inclusion or exclusion of the number “#” in the interval, respectively.
standard deviations of measurement reproducibility for various ranges, used to define the absolute utg or relative u'tg target standard uncertainty, respectively. The selectivity of the determination of copper in wastewater by ETAAS after an acid digestion of sample suggests measurement procedure bias is negligible and does not need to be considered in defining the target uncertainty. Convergent (“[#” or “#]”) or divergent (“]#” or “#[”) brackets indicate the inclusion or exclusion of the number “#” in the interval, respectively.
standard deviations of measurement reproducibility for various ranges, used to define the absolute utg or relative u'tg target standard uncertainty, respectively. The selectivity of the determination of copper in wastewater by ETAAS after an acid digestion of sample suggests measurement procedure bias is negligible and does not need to be considered in defining the target uncertainty. Convergent (“[#” or “#]”) or divergent (“]#” or “#[”) brackets indicate the inclusion or exclusion of the number “#” in the interval, respectively.
Table 3.
Predictive worst case model of the variation of S R or ![Water 05 01279 i045]() of measurements of copper in wastewater, following procedure SMEWW 3113B [22], with mass concentration of copper, used to define utg and
of measurements of copper in wastewater, following procedure SMEWW 3113B [22], with mass concentration of copper, used to define utg and ![Water 05 01279 i045]() , respectively.
, respectively.
of measurements of copper in wastewater, following procedure SMEWW 3113B [22], with mass concentration of copper, used to define utg and , respectively.
| Mass concentration of copper (μg L−1) | S R and utg (μg L−1) | and u'tg(%) |
|---|---|---|
| [2.02, 10.1[ | 7.5 | - |
| [10.1, 234[ | - | 74 |
| [234, 300[ | - | 26 |
| [300, 1670[ | - | 14 |
| [1670, (…)[ | - | 13 |
Assuming measurement uncertainty is estimated with a high number of degrees of freedom, the maximum admissible absolute, umax , or relative, u'max, standard uncertainty is 1.16 times larger than utg and u'tg respectively (Table 4).
Table 4.
Maximum admissible absolute umax or relative u'max standard uncertainty estimated for measurements of copper in wastewater following procedure SMEWW 3113B [22].
| Mass concentration of copper (μg L−1) | umax (mg L−1) | u'max (%) |
|---|---|---|
| [2.02, 10.1[ | 8.7 | - |
| [10.1, 234[ | - | 86 |
| [234, 300[ | - | 30 |
| [300, 1670[ | - | 16 |
| [1670, (…)[ | - | 15 |
For instance, if the mass concentration of copper in a wastewater sample determined in a routine laboratory, using procedure SMEWW3113B, is (277 ± 95) mg L−1 (for a coverage factor of 2 defined for 95% confidence level from a high number of degrees of freedom), it can be concluded the measurement is fit for the intended use since it presents a relative standard uncertainty u' ( u' = (95/2)/277 = 17%) smaller than u'max in the range [234,300[.
8. Conclusions
The fitness of a measurement for its intended use is demonstrated by the defined measurement traceability and magnitude of the measurement uncertainty. Therefore, the validation of measurements of water for different uses require observation of a target uncertainty (i.e., maximum admissible uncertainty), defined for the measured quantity. The target uncertainty is more likely to become consensual when calculated from objective parameters related to measurement use. A strategy is presented and applied to a list of selected situations for setting the target measurement uncertainty applicable when no guidelines are available. This allows the definition of adequate measurement quality requirements when deciding adequacy for an intended use.
Conflicts of Interest
The authors declare no conflict of interest.
References
- International Vocabulary of Metrology—Basic and General Concepts and Associated Terms (VIM), 3rd ed.; International Bureau of Weights and Measures: Paris, France, 2008.
- Council Directive 98/83/EC of 3 November 1998 on the Quality of Water Intended for Human Consumption; Official Journal of the European Communities: Brussels, Belgium, 1998.
- International Organization for Standardization, Accuracy (Trueness and Precision) of Measurement Methods and Results—Part 6: Use in Practice of Accuracy Values—ISO5725-6; International Organization for Standardization: Geneva, Switzerland, 1994.
- Analytical Methods Committee, Uncertainty of measurement: Implications of its use in analytical science. In Analyst; 1995; Volume 120, pp. 2303–2308.
- Evaluation of Measurement Data—Guide to the Expression of Uncertainty in Measurement (GUM); International Bureau of Weights and Measures: Paris, France, 2008.
- Technical Material and Preparations: Guidance for Generating and Reporting Methods of Analysis in Support of Pre- and Post-Registration Data Requirements for Annex II (Part A, Section 4) and Annex III (Part A, Section 5) of Directive 91/414; SANCO/3030/99 rev.4 11/07/00; Directorate General for Health and Consumer Protection: Brussels, Belgium, 1999.
- EURACHEM/CITAC Guide: Use of Uncertainty Information in Compliance Assessment, 1st ed; Eurachem: Uppsala, Sweden, 2007.
- RELACRE, EAA—Ensaios De Aptidão De Águas—Programa De Execução; [in Portuguese]; RELACRE: Lisbon, Portugal, 2012.
- International Organization for Standardization, Guidance for the Use of Repeatability, Reproducibility and Trueness Estimates in Measurement Uncertainty Estimation—ISO21748; International Organization for Standardization: Geneva, Switzerland, 2010.
- Da Silva, R.J.N.B.; Santos, J.R.; Camões, M.F.G.F.C. A new terminology for the approaches to the quantification of the measurement uncertainty. Accred. Qual. Assur. 2006, 10, 664–671. [Google Scholar] [CrossRef]
- Ellison, S.L.R.; Barwick, V.J.; Farrant, T.J.D. Practical Statistics for the Analytical Scientist: A Bench Guide; Royal Society of Chemistry: London, UK, 2009. [Google Scholar]
- Council Directive 75/440/EEC of 16 June 1975 Concerning the Quality Required of Surface Water Intended for the Abstraction of Drinking Water in the Member States; Official Journal of the European Communities: Brussels, Belgium, 1975.
- Council Directive 76/160/EEC of 8 December 1975 Concerning the Quality of Bathing Water; Official Journal of the European Communities: Brussels, Belgium, 1975.
- Council Directive 78/659/EEC of 18 July 1978 on the Quality of Fresh Waters Needing Protection or Improvement in order to Support Fish Life as Amended by Council Directive 91/692/EEC (further Amended by Council Regulation 1882/2003/EC), and Council Regulation 807/2003/EC; Official Journal of the European Communities: Brussels, Belgium, 1978.
- Council Directive 79/869/EEC of 9 October 1979 Concerning the Methods of Measurement and Frequencies of Sampling and Analysis of Surface Water Intended for the Abstraction of Drinking Water in the Member States; Official Journal of the European Communities: Brussels, Belgium, 1979.
- Council Directive 79/923/EEC of 30 October 1979 on the Quality Required of Shellfish Waters; Official Journal of the European Communities: Brussels, Belgium, 1979.
- Council Directive 84/491/EEC of 9 October 1984 on Limit Values and Quality Objectives for Discharges of Hexachlorocyclohexane; Official Journal of the European Communities: Brussels, Belgium, 1984.
- Council Directive 86/280/EEC of 12 June 1986 on Limit Values and Quality Objectives for Discharges of Certain Dangerous Substances Included in List I of the Annex to Directive 76/464/EEC; Official Journal of the European Communities: Brussels, Belgium, 1986.
- Council Directive 88/347/EEC of 16 June 1988 amending Annex II to Directive 86/280/EEC on Limit Values and Quality Objectives for Discharges of Certain Dangerous Substances Included in List I of the Annex to Directive 76/464/EEC; Official Journal of the European Communities: Brussels, Belgium, 1988.
- Silva, A.M.E.V.; Silva, R.J.N.B.; Camões, M.F.G.F.C. Optimization of the determination of chemical oxygen demand in wastewaters. Anal. Chim. Acta 2011, 699, 161–169. [Google Scholar] [CrossRef]
- De la Calle, M.B.; Robouch, P.; Bynens, S.; van de Kreeke, J.; Taylor, P. Report of the Second Interlaboratory Comparison Organised by the Community Reference Laboratory for Heavy Metals in Feed and Food—Total Cd, Pb and Hg in Mineral Water; Official Publications of the European Communities: Luxembourg, 2007. [Google Scholar]
- American Public Health AssociationAmerican Water Works AssociationWater Environment FederationStandard Methods for the Examination of Water & Wastewater; American Water Works Association: Denver, CO, USA, 2012.
- SCP Science, Certificate of Analysis, Certified Reference Material “EnviroMAT EU-H-1” of Mass Concentration of Metals in Wastewater; SCP Science: Beijing, China, 2005.
© 2013 by the authors; licensee MDPI, Basel, Switzerland. This article is an open access article distributed under the terms and conditions of the Creative Commons Attribution license (http://creativecommons.org/licenses/by/3.0/).
Share and Cite
MDPI and ACS Style
Da Silva, R.J.N.B. Setting Target Measurement Uncertainty in Water Analysis. Water 2013, 5, 1279-1302. https://doi.org/10.3390/w5031279
AMA Style
Da Silva RJNB. Setting Target Measurement Uncertainty in Water Analysis. Water. 2013; 5(3):1279-1302. https://doi.org/10.3390/w5031279
Chicago/Turabian StyleDa Silva, Ricardo J.N. Bettencourt. 2013. "Setting Target Measurement Uncertainty in Water Analysis" Water 5, no. 3: 1279-1302. https://doi.org/10.3390/w5031279