Article

Buffer Capacity, Ecosystem Feedbacks, and Seawater Chemistry under Global Change

by
Christopher P. Jury
*,
Florence I.M. Thomas
,
Marlin J. Atkinson
and
Robert J. Toonen
Hawai'i Institute of Marine Biology, Department of Oceanography, University of Hawai'i at Mānoa, P.O. Box 1346, Kāne'ohe, HI 96744, USA
*
Author to whom correspondence should be addressed.
Deceased on 18 February 2013.
Water 2013, 5(3), 1303-1325; https://doi.org/10.3390/w5031303
Submission received: 19 June 2013 / Revised: 26 July 2013 / Accepted: 19 August 2013 / Published: 6 September 2013

Abstract

:
Ocean acidification (OA) results in reduced seawater pH and aragonite saturation state (Ωarag), but also reduced seawater buffer capacity. As buffer capacity decreases, diel variation in seawater chemistry increases. However, a variety of ecosystem feedbacks can modulate changes in both average seawater chemistry and diel seawater chemistry variation. Here we model these effects for a coastal, reef flat ecosystem. We show that an increase in offshore pCO2 and temperature (to 900 µatm and + 3 °C) can increase diel pH variation by as much as a factor of 2.5 and can increase diel pCO2 variation by a factor of 4.6, depending on ecosystem feedbacks and seawater residence time. Importantly, these effects are different between day and night. With increasing seawater residence time and increasing feedback intensity, daytime seawater chemistry becomes more similar to present-day conditions while nighttime seawater chemistry becomes less similar to present-day conditions. Recent studies suggest that carbonate chemistry variation itself, independent of the average chemistry conditions, can have important effects on marine organisms and ecosystem processes. Better constraining ecosystem feedbacks under global change will improve projections of coastal water chemistry, but this study shows the importance of considering changes in both average carbonate chemistry and diel chemistry variation for organisms and ecosystems.

1. Introduction

Roger Revelle and Hans Suess long ago recognized a feedback loop whereby the ocean’s capacity to absorb additional CO2 becomes diminished the more it takes up. This property of seawater chemistry is described by the Revelle factor [1,2]. As sea water takes up CO2 from the atmosphere, protons (H+) are released, reducing seawater pH. A portion of this pH decrease is buffered by consuming carbonate ions (CO32−) and other bases [3], which reduces the seawater buffer capacity [4,5,6]. Thus, the same addition of CO2 results in progressively larger reductions in seawater pH as seawater pH decreases. The removal of CO2 has opposite effects, increasing both seawater pH and buffer capacity and resulting in progressively smaller pH increases for the same given removal of CO2. Overall, seawater buffer capacity reaches an absolute minimum at pH ~7.5 [6]. Buffer capacity also increases with increasing temperature due to shifts in acid-base dissociation constants [5,6], though this effect is small over the likely range of seawater temperature increases expected this century due to climate change (i.e., 1–4 °C over most of the ocean) [7]. Therefore, under anthropogenic ocean acidification (OA) one would expect not only a reduction in average seawater pH and aragonite saturation state (Ωarag) and an increase in average pCO2, but also an increase in diel chemistry variation due to reduced buffer capacity. However, seawater chemistry in shallow, coastal environments is often strongly modified by local metabolic and geochemical processes [8,9]. Ecosystem feedbacks in response to OA and climate change could work to either reduce or enhance changes in both average chemistry and diel chemistry variation under global change.
The purpose of this study was to explore how OA, climate change, and ecosystem feedbacks are likely to alter the seawater chemistry in a coastal environment and to explore the potential consequences of these changes for ecosystem processes. We modeled the Kāne‘ohe Bay, Hawai‘i barrier reef flat ecosystem under present-day and two future global change scenarios as well as under various ecosystem feedback scenarios. Our modeling effort focuses on those processes which have major, direct impacts on seawater carbonate chemistry: photosynthesis, respiration, calcification, and carbonate dissolution. The model was parameterized primarily with field studies performed on the barrier reef flat or mesocosm studies performed nearby at the Hawai‘i Institute of Marine Biology (HIMB). Rather than perform a full sensitivity analysis, we focus our modeling effort on the best available estimates for the various parameters and responses of those parameters to global change. Here we show that under global change diel seawater chemistry variation increases (dramatically in some cases) and that various ecosystem feedbacks can substantially modify changes in both the average chemistry and diel chemistry variation over the reef. Despite the likely importance of these changes, the consequences of increased diel chemistry variation for marine organisms and ecosystem processes remain almost entirely unexplored.

2. Materials and Methods

2.1. Ecosystem Description

The Kāne‘ohe Bay barrier reef flat separates the open ocean from inner Kāne‘ohe Bay, which contains numerous, well-developed patch and fringing reefs. The reef flat has a width of about 2.4 km and a mean depth of 2 m. Benthic cover on the reef flat is strongly heterogeneous. Some areas are coral dominated with cover on the order of 50%–90%, but much of the reef flat is dominated by turf algae or macroalgae with relatively low coral cover (<10%). Overall, mean coral cover across the reef flat is roughly 30% [10]. Most of this coral cover is comprised of the dominant Hawaiian coral species: Porites lobata, Porites compressa, Porites evermanni, Montipora capitata, Montipora flabellata, Montipora patula, Pocillopora damicornis, and Pocillopora meandrina. Due to its subtropical location, seawater temperature on the reef flat is somewhat low as compared to many coral reefs with a summertime mean of ~26 °C and a mean monthly maximum of ~26.5 °C. Rates of daily net photosynthesis and respiration are within ranges reported for other reefs, but the Kāne‘ohe Bay barrier reef flat tends to be somewhat net heterotrophic as compared to other reef flats [10]. As a consequence of low temperature and net heterotrophy, Ωarag tends to be low on the Kāne‘ohe Bay barrier reef flat as compared to most reefs (mean Ωarag ~2.85 vs. mean ~3.2–4.2 on most reefs). In spite of low Ωarag net ecosystem calcification rates are similar to or somewhat higher than those reported for most other reefs [10].

2.2. Modeling Approach

The reef flat influences the overlying seawater carbonate chemistry primarily through four processes: photosynthesis, respiration, calcification, and carbonate dissolution. Photosynthesis removes inorganic carbon (CT) from sea water but has no effect on total alkalinity (AT). This increases seawater pH and Ωarag and decreases pCO2. Respiration has the opposite effect. Calcification removes AT and CT from sea water at a 2:1 stoichiometry, which has the net effect of decreasing seawater pH and Ωarag and increasing pCO2. Carbonate dissolution has the opposite effect. At known salinity (S), temperature (T), and dissolved inorganic nutrients any two parameters of the carbonate system can be used to calculate the other parameters. Changes in water chemistry were therefore calculated from fluxes of CT (mmol C m−2 h−1) and AT (meq m−2 h−1) induced by the reef. Changes in each of these parameters are described by the differential equations:
Water 05 01303 i001
Water 05 01303 i002
where pn is the rate of net ecosystem photosynthesis; gn is the rate of net ecosystem calcification; h is the water column depth (2 m); and ρ is the seawater density (kg m−3).
However, it should be noted that calculating pCO2 from CT and AT tends to underestimate pCO2 at high levels (up to 30% at 1000 µatm) for reasons that are not yet resolved [11]. Unfortunately, no satisfactory method to address this issue has yet emerged. Therefore, the high pCO2 levels reported here for some model scenarios may be underestimates of the true values.
We initially intended to model the Kāne‘ohe Bay barrier reef flat under both summertime and wintertime conditions. However, fewer wintertime data are available to parameterize our model, either from field or mesocosm studies. We did not feel confident that we could accurately capture seasonal differences in ecosystem responses (e.g., see [12]), therefore we restricted our modeling effort to summertime conditions where more data are available and parameters important to our model are better constrained.
Calculations were performed using a box model assuming a well-mixed water column over the reef flat. All model runs were initialized at midnight (00:00 h) with offshore seawater chemistry conditions. Rates of photosynthesis, respiration, calcification, and carbonate dissolution were calculated based on these initial conditions and the resulting changes in CT and AT were calculated with Equations (1) and (2). These new CT and AT values were used as input parameters in CO2SYS [13] to calculate seawater chemistry at the next time point and the process was repeated iteratively every hour for 120 h (five days). In each model run the chemistry parameters and metabolic rates tended to converge to a stable set of solutions by day three of the model run.
Because water flow across the reef flat tends to be principally in the direction from the open ocean toward the backreef, the chemistry parameters calculated here correspond most directly to those that would be measured on the backreef and would constitute the source water for downstream communities in inner Kāne‘ohe Bay. The model was run using seawater residence times of 4, 7, and 14 h, which correspond to typical minimum, average, and maximum residence times observed on the reef flat [10]. These residence times are equivalent to mean cross-reef flow rates of 16.7, 9.5, and 4.8 cm s−1, respectively, which agrees well with direct measurements on the reef flat [14] and are similar to those observed on other reefs (reviewed by [15]). Previous work has shown that flow velocity can have large effects on the metabolic rates of some marine organisms (e.g., [16]); however, few data were available to constrain the metabolic sensitivity of the reef flat to varied flow velocity. Therefore, we elected to model reef metabolic rates without including the effects of flow velocity, implicitly assuming that reef metabolism is independent of flow velocity over this range. However, if metabolic rates tend to increase with flow, as has been shown previously for some organisms, the changes in water chemistry modeled here will tend to converge toward those obtained under the intermediate seawater residence time (7 h).
Ecosystem responses were modeled under present-day summertime temperature and pCO2 conditions (26 °C, 400 µatm) and two future scenarios: 27.5 °C, 600 µatm and 29 °C, 900 µatm [7]. For all model runs we held constant temperature (as above), salinity (S = 35 ppt), and inorganic nutrients (zero), both offshore and on the reef flat. The offshore water flowing onto the reef was held at constant AT (2275 µeq kg−1) and CT (1972.84, 2041.72, and 2104.06 µmol kg−1, respectively, for the three scenarios above).
Air-sea gas exchange also affects CT through CO2 exchange. However, at typical wind speeds measured nearby at HIMB we estimated that gas exchange would induce carbon fluxes <3 mmol C m−2 h−1 even under the most extreme scenarios modeled here, and usually much less. Carbon fluxes due to reef metabolism therefore exceed those due to gas exchange by 1–3 orders of magnitude, so for simplicity gas exchange was omitted from the model.
The equations used to model photosynthesis, respiration, calcification, and carbonate dissolution are detailed below. Choices on parameterization are explained in the text and summarized in Table 1.
Table 1. Model parameters, parameter values, and sources for values. See text for discussion of parameterization choices and calculations.
ParametersParameter valueUnitsSource
pmax
400 µatm, 26 °C90mmol C m−2 h−1[15,17]
600 µatm, 27.5 °C96.9 Q10 from [18]
900 µatm, 29 °C103.6 Q10 from [18]
rdark
400 µatm, 26 °C35mmol C m−2 h−1[10,14]
600 µatm, 27.5 °C40.2 Q10 from [18]
900 µatm, 29 °C46.1 Q10 from [18]
Imax1000µmol photons m−2 s−1[14] and Kāne‘ohe Bay Monitoring Program
Ik586µmol photons m−2 s−1[19]
kD1mmol C m−2 h−1[17,20]
bD-6mmol C m−2 h−1[10,19]
kLE
400 µatm, 26 °C9.1mmol C m−2 h−1[10]
600 µatm, 27.5 °C8.463mmol C m−2 h−1Temperature-calcification equation from [21]
900 µatm, 29 °C6.552mmol C m−2 h−1Temperature-calcification equation from [21]
bLE
400 µatm, 26 °C9.1mmol C m−2 h−1[10]
600 µatm, 27.5 °C8.463mmol C m−2 h−1Temperature-calcification equation from [21]
900 µatm, 29 °C6.552mmol C m−2 h−1Temperature-calcification equation from [21]
kdark
400 µatm, 26 °C3.4mmol C m−2 h−1[10]
600 µatm, 27.5 °C3.162mmol C m−2 h−1Temperature-calcification equation from [21]
900 µatm, 29 °C2.448mmol C m−2 h−1Temperature-calcification equation from [21]
bdark
400 µatm, 26 °C3.4mmol C m−2 h−1[10]
600 µatm, 27.5 °C3.162mmol C m−2 h−1Temperature-calcification equation from [21]
900 µatm, 29 °C2.448mmol C m−2 h−1Temperature-calcification equation from [21]
Ca
400 µatm, 26 °C1.0DimensionlessEstimated in conjunction with [22]
600 µatm, 27.5 °C0.5DimensionlessEstimated in conjunction with [22]
900 µatm, 29 °C0.01DimensionlessEstimated in conjunction with [22]

2.3. Photosynthesis and Respiration

Net ecosystem photosynthesis (pn) was calculated with the equation:
Water 05 01303 i003
where pmax is the maximum rate of gross ecosystem photosynthesis; I is the irradiance incident on the reef flat (µmol photons m−2 s−1); Ik is the irradiance at which photosynthesis begins to become light saturated; and rdark is the rate of dark respiration.
A simplifying assumption which is usually made and which this equation implicitly makes is that the rate of light respiration is equal to the rate of dark respiration. While pn and rdark can be readily measured, direct measurements of pmax and light respiration are challenging. It has been shown that light respiration may increase substantially as compared to dark respiration [23] and as a consequence pmax is underestimated by a similar magnitude when assuming constant rates of respiration. However, because both pmax and light respiration are underestimated proportionally they offset each other and the estimate of pn is left unaffected, as is the resultant change in water chemistry.
Equation (3) was parameterized by drawing from several studies. Ik (586 µmol photons m−2 s−1) was taken from [19]. They performed a mesocosm study at HIMB using an assemblage of Porites compressa and Montipora capitata, which is roughly similar to the coral-dominated portions of the reef flat, and this value compares well with those published for other reefs. Mid-day maximum pn in the mesocosm averaged 40–50 mmol C m−2 h−1 [19] which is similar to measurements made on the reef flat [10,14] and similar to measurements made on other reefs [15,17]. However, rdark measured on the reef flat was much higher than in the mesocosm. While variable, mean rdark estimated from [10,14] was approximately 35 mmol C m−2 h−1 which is similar to, or slightly higher than, other reefs or reef mesocosms [15,17]. Because of the higher respiration rate, it was necessary to increase pmax relative to the mathematical fit from [19] to achieve the measured pn. Based on values from other reefs pmax was increased to 90 mmol C m−2 h−1 [15,17] which provided a good fit to pn observed on the reef flat.
Temperature affects metabolic rates, which can be described by a Q10 effect. Elevated temperature increases rates of both photosynthesis and respiration up to critical temperatures above which organisms experience temperature stress and metabolic suppression. While the elevated temperature scenarios considered here can be stressful for certain reef organisms (especially corals which are often thermally sensitive) they are likely tolerable for most algae, microbes, and many other organisms which contribute significantly to overall reef metabolism. Yvon-Durocher et al. [18] found relatively consistent Q10 effects on photosynthesis (Q10 = 1.6) and respiration (Q10 = 2.5) across a range of terrestrial and marine ecosystems. These Q10 values were used to calculate adjusted parameters for Equation (3). For the 27.5 and 29 °C scenarios these were pmax = 96.6 and 103.6, rdark = 40.2 and 46.1 mmol C m−2 h−1, respectively. OA can also stimulate photosynthesis for at least some reef organisms through enhanced supply of CO2 or HCO3. Langdon and Atkinson [19] observed roughly a 10% increase in the rate of photosynthesis per 100 µatm increase in pCO2, relative to a baseline at 460 µatm. Therefore Equation (3) was modified as follows to replicate the pCO2 sensitivity observed by Langdon and Atkinson [19].
Water 05 01303 i004
Incident irradiance on the reef flat was set to zero during the night. From sunrise to sunset incident irradiance was estimated using the equation:
Water 05 01303 i005
where I(t) is the irradiance incident on the reef flat at time t; t0 is sunrise; Imax is the maximum incident irradiance; and Hday is the day length in hours.
Based on in situ measurements by [14] and light attenuation coefficients measured as part of the Kāne‘ohe Bay Monitoring Program [24] the reef flat was estimated to receive a typical Imax of 1000 µmol photons m−2 s−1 during the summer months. Day length was set to a typical summertime value of 13 h with sunrise at 06:00 and sunset at 19:00.

2.4. Calcification and Carbonate Dissolution

Net ecosystem calcification (gn) was calculated with the equation:
Water 05 01303 i006
where Gn is the net rate of community calcification (performed by the community of calcifying organisms) and Dn is the net rate of community dissolution (performed by community of bioeroding organisms and through abiotic dissolution).
It is tempting to think of these processes as gross ecosystem calcification and gross ecosystem dissolution, but strictly they should be considered as net processes for each community type. Dissolution is driven strongly by respiration and bioerosional processes occurring within the reef and soft sediments, but generally tends to increase as Ωarag decreases in field and mesocosm studies. Therefore, Dn was calculated as a function of Ωarag using the equation:
Water 05 01303 i007
where kD is a rate constant and bD is the y-intercept.
Mean Dn on reefs or in reef-associated carbonate sediments has been reported to range from −0.1–13 mmol C m−2 h−1 [20,25]. Assuming that Gn goes to zero at approximately Ωarag = 1 [17,19], mean Dn on the reef flat was estimated to be approximately −5 mmol C m−2 h−1 at Ωarag = 1 from measurements on the reef flat by [10] and the mesocosm study of [20] at HIMB. Anthony et al. [17] saw a roughly 20% decrease in dissolution per unit increase above Ωarag = 1.Yates and Halley [26] observed similar sensitivity over various reef community types off Moloka‘i, which are similar in composition to those found on the Kāne‘ohe Bay barrier reef flat. Therefore, the model was set assuming a 20% (−1 mmol C m−2 h−1) decrease in Dn per unit increase above Ωarag = 1.
Most studies express calcification as a function of Ωarag but recent work suggests that coral calcification rates as well as those of at least some other calcifiers are driven by a combination of CT and pH effects rather than a direct effect of Ωarag [27,28,29,30,31]. Taking these differences into account is critical when both CT and pH vary widely, such as over geological time, but OA results in only small changes in CT and large changes in pH making the distinction less critical over the range of chemistries considered here. Aragonite saturation state directly correlates with both CT and pH so it is still a useful proxy for these more complex CT and pH effects under elevated CO2. To allow for easier comparison with previous work Ωarag was chosen as the chemical parameter used to calculate Gn.
Net community calcification (Gn) was calculated as function of both Ωarag and irradiance, since calcification tends to be “light enhanced” in zooxanthellate corals and in calcifying algae [32,33,34]. Recent work suggests that one of the major mechanisms by which calcification is light enhanced in corals is through increased energy reserves provided by the zooxanthellae [34]. Shamberger et al. [10] provide data showing that calcification on the reef flat tends to begin increasing soon after sunrise, peaks in the afternoon, and continues at a high (i.e., light enhanced) rate for 2–4 h after sunset. This makes sense if corals and/or calcifying algae are using photosynthate produced during the day to maintain enhanced calcification rates after sunset, but eventually exhaust these supplies until the next sunrise. Community calcification (Gn) was modeled as the sum of the dark calcification rate and a light enhanced calcification component with light enhanced calcification beginning at sunrise and continuing for 3 h after sunset using the equation:
Water 05 01303 i008
where GLE is the maximum light enhanced calcification component; Gdark is the rate of dark calcification; and HLE is the length of light enhanced calcification (16 h). The light enhanced component and dark calcification rates are further defined as:
Water 05 01303 i009
Water 05 01303 i010
where kLE, bLE, kdark, and bdark are light enhanced and dark rate constants and y-intercepts, respectively.
As above, it was assumed that Gn goes to zero at approximately Ωarag = 1, as observed by Langdon and Atkinson [19] in a mesocosm study at HIMB and in other work [17]. At Ωarag = 3 night rates of calcification observed by [19] were 6.8 mmol C m−2 h1. Taking into account dissolution as estimated above one would predict nighttime mean gn = 3.8 mmol C m−2 h1 on the barrier reef flat, which agrees well with data from [10]. However, midday maximum rates of calcification were higher on the barrier reef flat than in the Langdon and Atkinson [19] mesocosm study for a given Ωarag. Maximum gn at Ωarag = 3 on the barrier reef flat was approximately 22 mmol C m−2 h1, which corresponds to Gn = 25 mmol C m−2 h1 given the estimate of dissolution. These values were used to derive rate constants and y-intercepts as defined above for light enhanced and dark calcification.
Temperature has an effect on calcification rate with maximum calcification rates occurring at a particular temperature optimum and lower rates at both higher and lower temperature. For most Hawaiian corals maximum calcification rates occur at a temperature of about 26 °C, the mean summertime temperature and the one used in the present-day scenario. The empirically derived calcification-temperature equation developed by [21] was used to calculate the effects of increased temperature on calcification, assuming that the relationship for the reef flat as a whole is similar to the one for corals. At temperatures of 27.5, and 29 °C this equation predicts calcification rates of 92%, and 72% the rate at 26 °C, respectively, under otherwise similar conditions. The parameters from Equations (9) and (10) for these elevated temperature scenarios were recalculated again assuming that Gn goes to zero at approximately Ωarag = 1, but with rates of nighttime and maximum daytime calcification reduced accordingly.
Community calcification rates also depend on benthic community structure and in particular on the abundance of calcifying organisms. Hoeke et al. [22] modeled changes in coral cover on Hawaiian reefs due to climate change and OA. For a 1.5 °C temperature increase (the 27.5 °C scenario here) coral cover around O‘ahu was projected to decrease to 45% of the present-day coverage, and to 0% before reaching a 3 °C temperature increase (the 29 °C scenario here). This decrease was driven principally by coral bleaching-associated mortality due to periodic high temperature stress, but this scenario assumes that coral thermal tolerances will remain constant over the foreseeable future. At least some degree of coral acclimatization and adaptation to elevated temperature is likely [35,36,37], in which case this scenario would overestimate declines in coral cover. However, OA can reduce bleaching thresholds for some corals [38], in which case this scenario may actually underestimate declines in coral cover. While corals are responsible for much of the calcification on the reef, other calcifiers are also important. In general, many reef organisms appear less sensitive to elevated temperature as compared to corals (which are often highly sensitive) whereas their sensitivities to OA vary [20]. Given these uncertainties, high-end declines in calcifier abundance on the reef flat were estimated to produce abundances of 50% and 1% of present-day values for the 27.5 and 29 °C scenarios. Therefore Equation (6) was modified as follows:
Water 05 01303 i011
where Ca is the calcifier abundance on the reef flat relative to present-day abundance (Ca = 1.0, 0.5, and 0.01 for the 26, 27.5, and 29 °C scenarios, respectively).

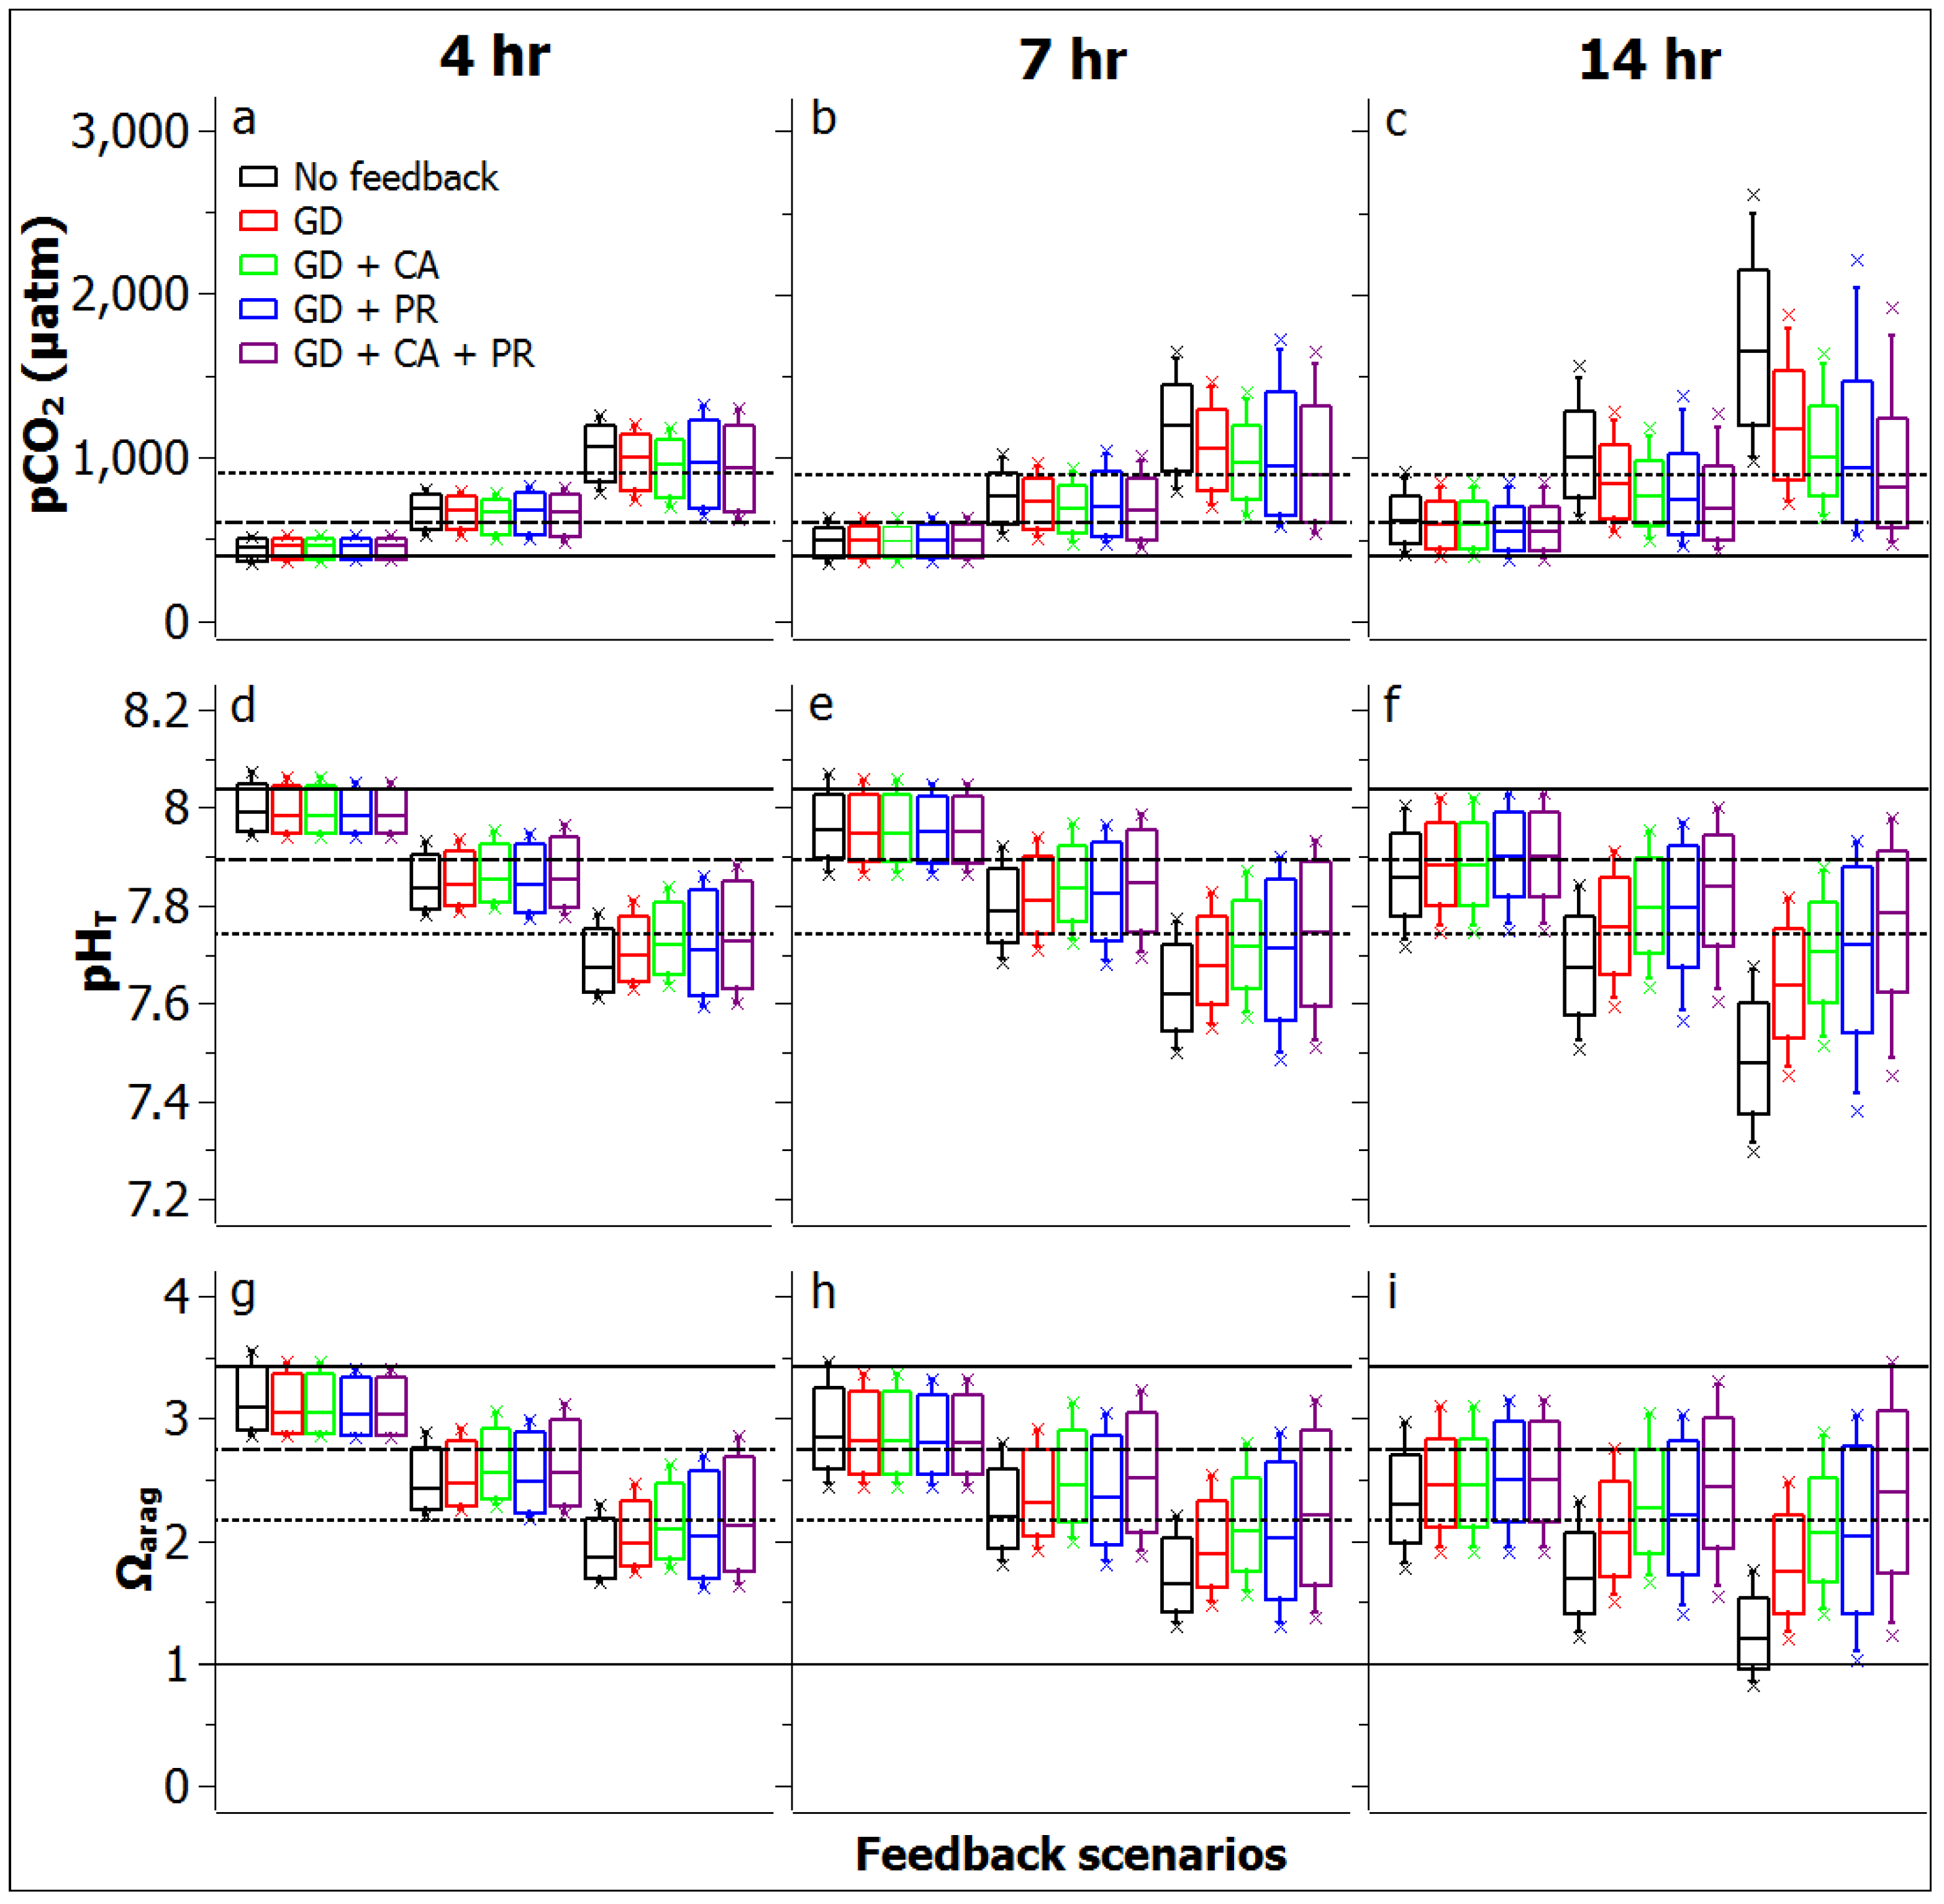
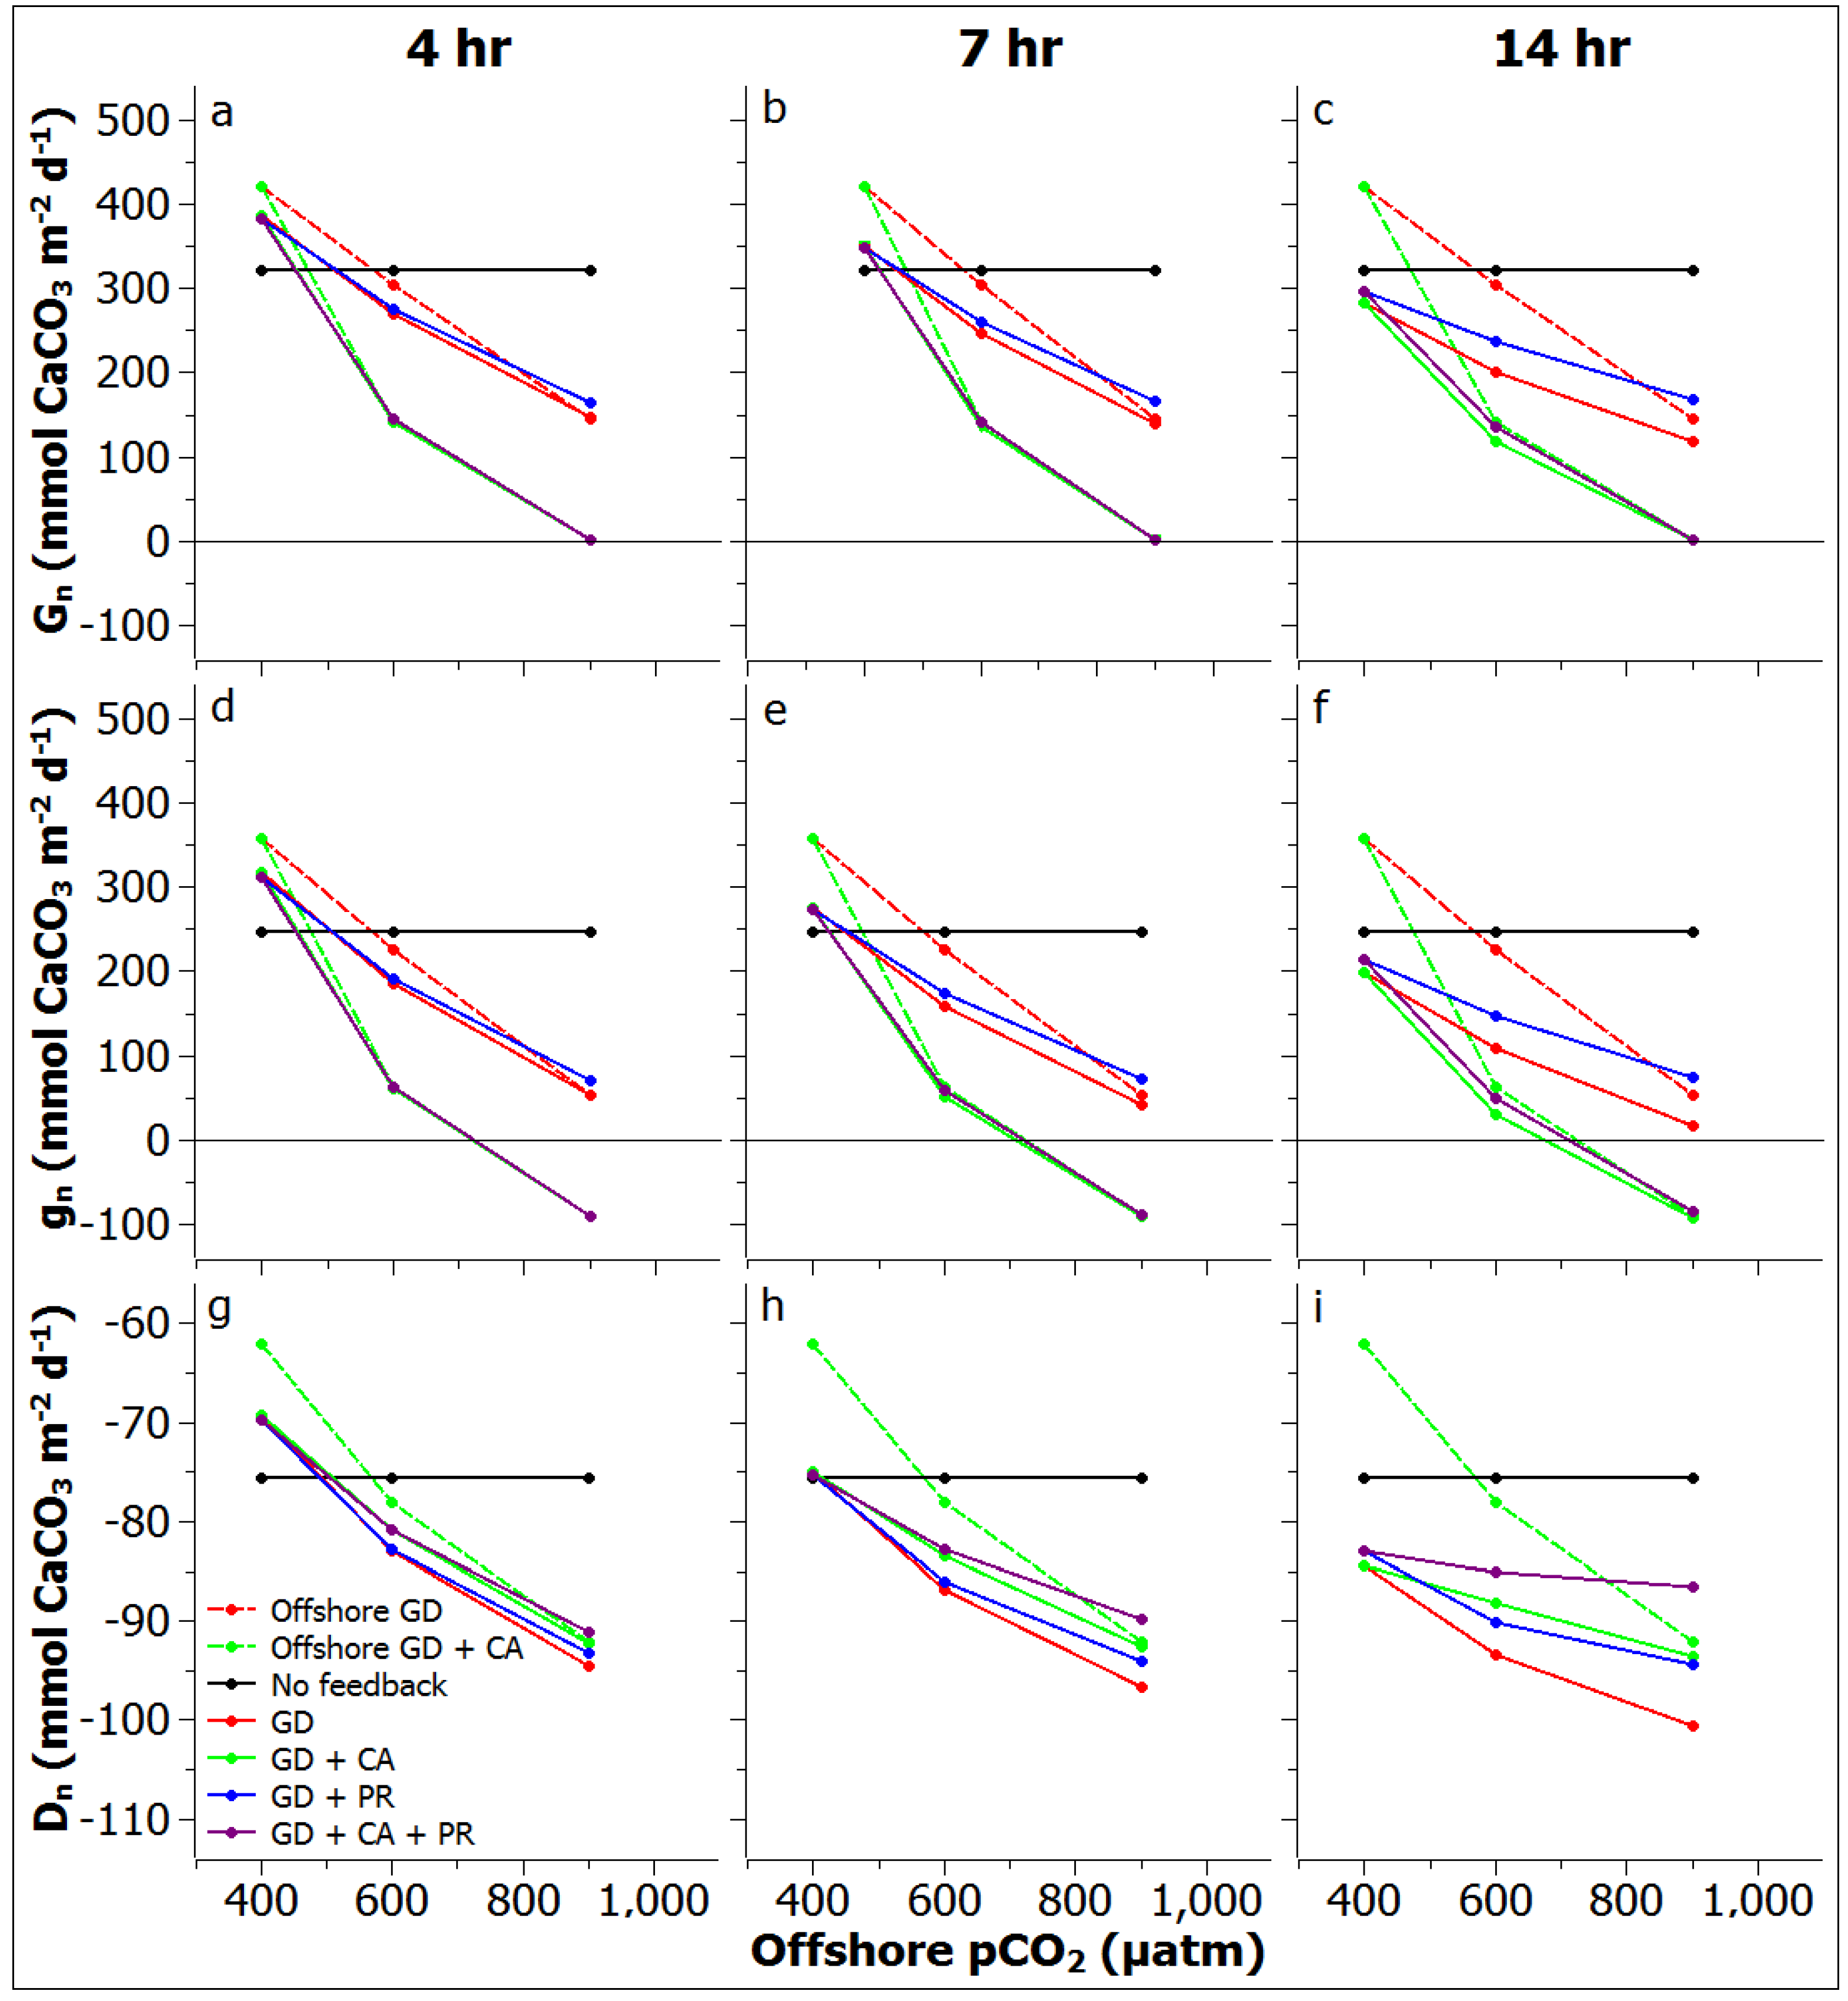
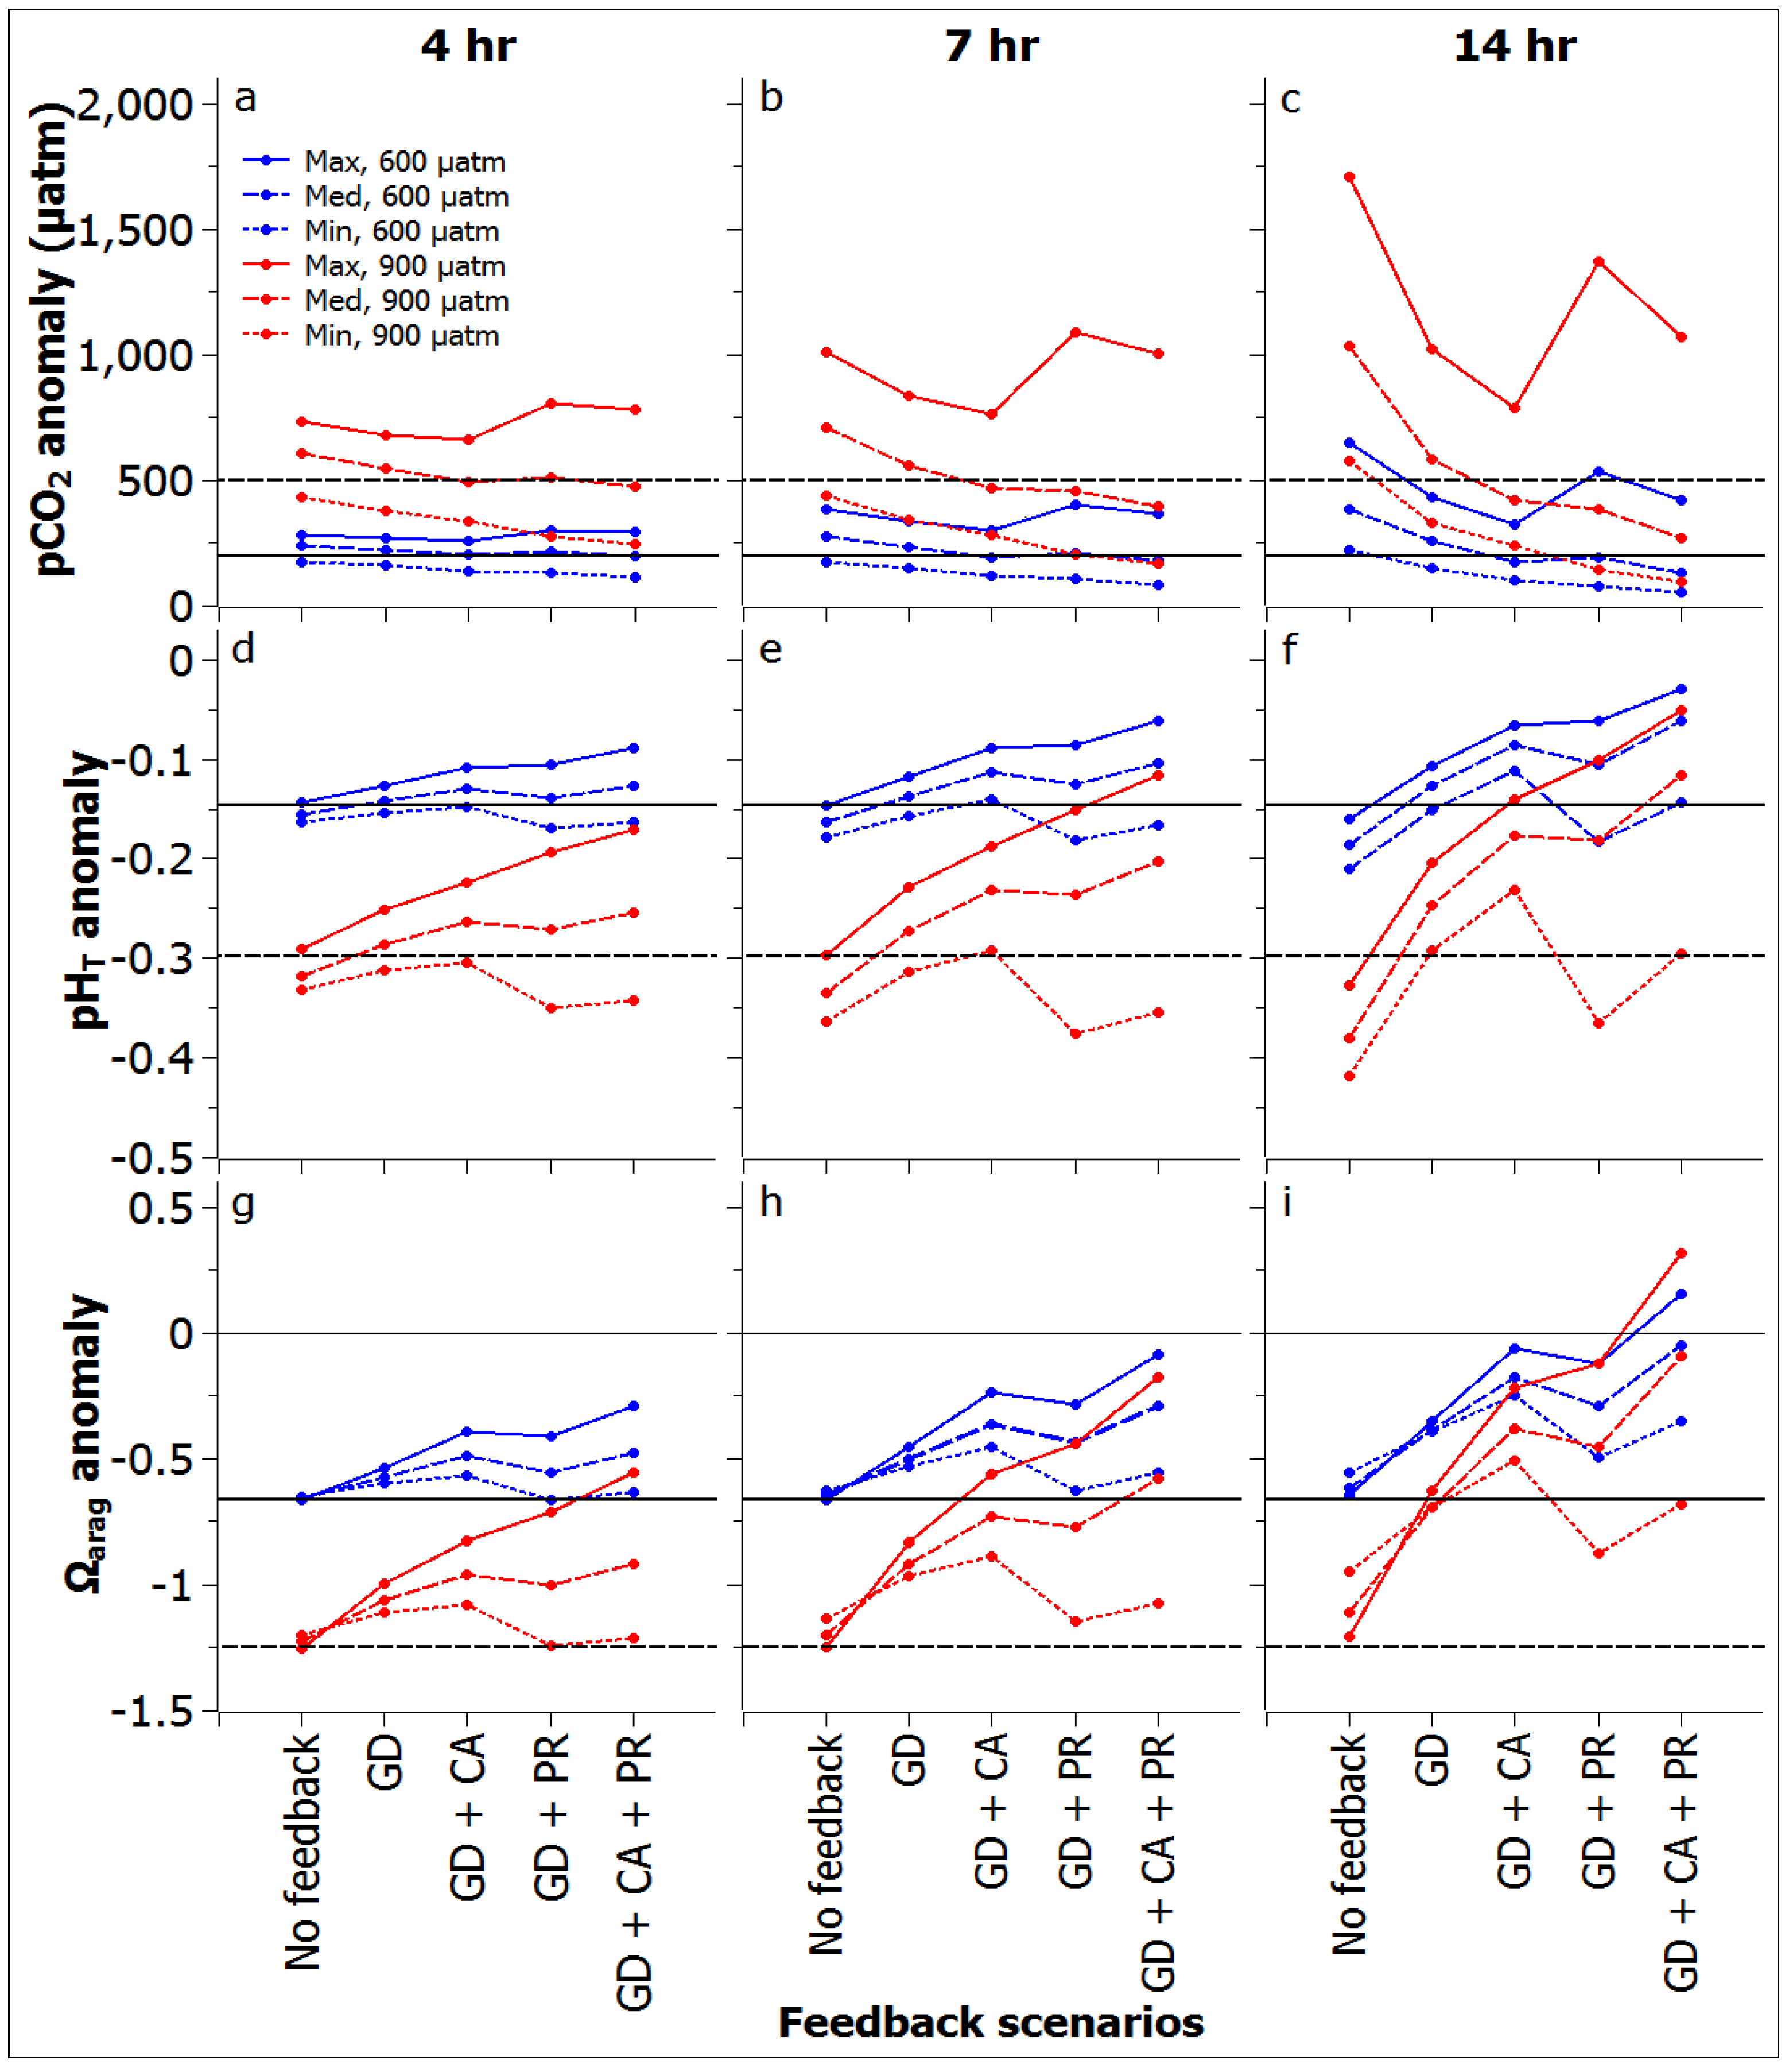
2.5. Ecosystem Feedback Scenarios

Five ecosystem feedback scenarios were considered here: (1) no feedbacks; (2) a calcification and dissolution feedback; (3) calcification and dissolution + calcifier abundance feedbacks; (4) calcification and dissolution + photosynthesis and respiration feedbacks; and (5) calcification and dissolution + calcifier abundance + photosynthesis and respiration feedbacks. Each of these five feedback scenarios were modeled under each global change scenario and at each seawater residence time (4, 7, 14 h).
(1)
No feedbacks: This scenario assumes that reef metabolism is not influenced by seawater chemistry or temperature and that community structure is stable under all global change scenarios. We do not consider this scenario likely but rather use it as a means to distinguish the influence of ecosystem feedbacks from the pure chemical effects imposed by global change on seawater chemistry. For this scenario reef metabolic rates were calculated as if Ωarag were constant at Ωarag = 2.85 and temperature were constant at 26 °C (present-day mean summertime values), but including the influence of irradiance on photosynthesis and calcification. This scenario allows us to examine how global change affects seawater chemistry given the same metabolic forcing and provides a baseline with which to examine the effects of the other ecosystem feedbacks;
(2)
Calcification and dissolution feedback: This scenario allows calcification and dissolution to vary dynamically depending on changes in seawater chemistry and temperature (in addition to irradiance), however, it assumes that temperature and pCO2 have no effect on photosynthesis or respiration and that calcifier abundance is constant;
(3)
Calcification and dissolution + calcifier abundance feedbacks: In this scenario calcification and dissolution were allowed to vary dynamically and calcifier abundance was reduced for the future scenarios. Temperature and pCO2 were assumed to have no effect on photosynthesis or respiration;
(4)
Calcification and dissolution + photosynthesis and respiration feedbacks: Like the scenario above, calcification and dissolution were allowed to vary dynamically but temperature and pCO2 were also allowed to affect photosynthesis and respiration. Calcifier abundance was assumed to be constant;
(5)
Calcification and dissolution + calcifier abundance + photosynthesis and respiration feedbacks: Calcification, dissolution, and photosynthesis were all allowed to vary dynamically based on changes in chemistry and irradiance while calcification, photosynthesis, and respiration were allowed to change based on temperature. Calcifier abundance was also allowed to decrease for the future scenarios.

2.6. Reef Edge vs. Reef Flat Calcification, and Ecosystem Calcification Thresholds

The seaward reef edge of the Kāne‘ohe Bay barrier reef and other highly exposed reefs are rapidly flushed by strong wave action. This makes for a very short seawater residence time and exposes the reef edge and other exposed reefs to nearly constant open ocean seawater conditions [9]. Taking short residence time to the extreme, reef calcification rates were modeled under a seawater residence time of 0 h (i.e., constant seawater chemistry conditions) for the global change scenarios above, assuming that the reef edge has similar metabolic sensitivities to altered chemistry and temperature as the reef flat. Because water chemistry was constant and therefore not subject to the influence of reef metabolism, calcification was modeled only under the (1) calcification and dissolution; and (2) calcification and dissolution + calcifier abundance feedbacks. This allows us to explore how constant vs. variable seawater chemistry might affect ecosystem calcification rates. In addition, this approach allows us to examine ecosystem calcification thresholds wherein the reef edge or reef flat transition from net calcification to net carbonate dissolution.

3. Results and Discussions

3.1. Model Validation

All model output shown below is from day five (the final day) of each model run, which tended to converge to a stable set of solutions by day three of each run. Data are grouped according to feedback scenario and seawater residence time (4, 7, or 14 h) as indicated. Within each plot, GD = calcification and dissolution feedback; CA = calcifier abundance feedback; PR = photosynthesis and respiration feedback. Model output under present-day seawater conditions is shown in Figure 1 in comparison to measurements taken on the reef flat by Shamberger et al. [10], where seawater residence time varied form ~4.5–13.6 h. Data from [10] were accessed through the Earth and environmental science data repository PANGAEA [39]. Hourly changes in net calcification and net production measured on the reef and their resultant effects on seawater chemistry as measured by Shamberger et al. [10] are variable among days. Nonetheless, our model appears to capture the majority of this variation across the three modeled seawater residence times and is generally able to recreate the dynamic changes in reef metabolism and water chemistry parameters observed over the diel cycle.
Figure 1. (ad) Plots of modeled changes in seawater chemistry; (e) net ecosystem calcification; and (f) net ecosystem production in comparison to measurements made on the reef flat by Shamberger et al. [10], shown in grey. pH is reported here on the Total hydrogen ion scale (pHT). Model output is for the calcification and dissolution + photosynthesis and respiration feedback scenario (GD + PR) under present-day seawater conditions (results from other modeled feedback scenarios under present-day conditions are very similar). Thick, black line (ad) shows offshore, seawater chemistry conditions. Thin black line (e,f) shows zero on the y-axis.
Water 05 01303 g001

3.2. Reef Flat Water Chemistry

The effects of the various global change and ecosystem feedback scenarios on water chemistry over the reef flat are shown in Figure 2. As observed on some other reefs, median pH and Ωarag tend to be reduced and pCO2 elevated over the reef as compared to offshore conditions. This is a consequence of reef calcification, which consumes AT faster than CT, and in the case of the Kāne‘ohe Bay barrier reef flat is also due to net heterotrophy under most of the feedback scenarios. Both the degree of acidification via reef metabolism and diel chemistry variation tend to increase with increasing seawater residence time. Depending on the feedback scenario and residence time, seawater chemistry on the reef flat may deviate dramatically from offshore chemistry over the course of the diel cycle. The magnitude of the deviations increases under OA, related to reduced seawater buffer capacity, and with increasing seawater residence time.
Relative to present-day chemistry conditions, predicted conditions for offshore seawater chemistry under the the 600 µatm CO2 scenario include a 0.146 pH unit decrease, a 200 µatm pCO2 increase, and a 0.663 Ωarag decrease. Likewise, under the 900 µatm scenario, offshore water chemistry is predicted to undergo a 0.298 pH unit decrease, a 500 µatm pCO2 increase, and a 1.247 Ωarag decrease One might at first expect that OA should induce changes in chemistry over the reef flat of an equivalent magnitude, but this is not the case. Instead, the median acidification over the reef flat is greater than the “expected” acidification under the no feedbacks scenario and less than the “expected” acidification under the other feedback scenarios (Figure 3). It is important to note that under the no feedbacks scenario the metabolic forcing is exactly the same for all model runs, hence the greater-than-expected acidification on the reef flat is a direct consequence of reduced seawater buffer capacity under OA. Over the range of modeled seawater residence times this process results in an additional decrease in median pH (relative to the expected decrease) of 0.01–0.04 pH units under the 600 µatm scenario, or 0.02–0.08 pH units under the 900 µatm scenario. Likewise, the increase in median pCO2 under the no feedbacks scenario is larger than expected on the reef flat: 39–187 µatm under the 600 µatm scenario, or 109–534 µatm under the 900 µatm scenario. In contrast, the decrease in median Ωarag under the no feedbacks scenario is slightly less than expected, as a consequence of the non-linear relationship between pH and Ωarag: 0.006–0.05 under the 600 µatm scenario, or 0.02–0.14 under the 900 µatm scenario.
Figure 2. Box plots showing modeled seawater chemistry on the reef flat. Within each plot boxes are arranged by offshore pCO2: the five boxes on the left side of each plot correspond to 400 µatm; the five boxes in the center of each plot correspond to 600 µatm; the five boxes to the right side of each plot correspond to 900 µatm. Thick, black lines in each plot show offshore, seawater chemistry conditions: solid black line = 400 µatm; dashed black line = 600 µatm; dotted black line = 900 µatm. Thin, black line (gi) shows Ωarag = 1.
Water 05 01303 g002
Figure 3. Plots showing seawater chemistry anomalies relative to present-day conditions on the reef flat under each model scenario. Data are hourly average maximum, median, and minimum. Thick, black lines in each plot show the magnitude of the anomaly relative to offshore, seawater chemistry conditions (i.e., the “expected” anomaly): solid black line = 600 µatm; dashed black line = 900 µatm.
Water 05 01303 g003
Under present-day conditions the ecosystem feedbacks considered here produce only very small differences in seawater chemistry. In contrast, under the future scenarios the ecosystem feedbacks have much more pronounced effects. Reduced calcification and/or increased carbonate dissolution under both the calcification and dissolution and the calcifier abundance feedbacks provide a buffer against OA. Increased net production under the photosynthesis and respiration feedback (the P:R ratio shifts from a minimum of 0.84 to a maximum of 1.03) also provides a buffer against OA. These buffer effects become more important with increasing seawater residence time. Across all of the feedback scenarios (except for the no feedbacks scenario) and seawater residence times these buffer effects increase the median pH relative to the expected change by 0.004–0.09 pH units under the 600 µatm scenario, or 0.01–0.18 pH units under the 900 µatm scenario. Thus, depending on the precise feedback scenario and seawater residence time, these buffer effects range from relatively trivial pH changes to counteracting as much as 60% of the expected acidification due to OA. The changes in median pCO2 are more complex. Under the 600 µatm scenario the increase in median pCO2 ranges from 56 µatm more than expected to 66 µatm less than expected, or 86 µatm more than expected to 230 µatm less than expected under the 900 µatm scenario, again depending on the precise feedback scenario and seawater residence time. Like pH, median Ωarag increases relative to the expected change under all feedback scenarios and seawater residence times: 0.09–0.61 under the 600 µatm scenario, or 0.19–1.16 under the 900 µatm scenario. Thus, these buffer effects counteract 14%–93% of the expected decrease in median Ωarag, depending on the precise feedback scenario and seawater residence time.
Under all modeled scenarios diel pH and pCO2 variation (i.e., maximum diel range) increase relative to present-day conditions, consistent with reduced seawater buffer capacity allowing for larger chemistry excursions (Figure 3). Diel Ωarag variation also increases under the ecosystem feedback scenarios, but decreases by 0.01–0.55 (2%–22%) under the no feedbacks scenario. Across all feedback scenarios and seawater residence times the increase in pH variation ranges from 0.02 to 0.12 units (14%–66% increase) under the 600 µatm scenario, or 0.04–0.26 units (31%–153% increase) under the 900 µatm scenario. The increase in diel pCO2 variation is proportionally much greater: 111–454 µatm (67%–120% increase) under the 600 µatm scenario, or 303–1227 µatm (181%–361% increase) under the 900 µatm scenario. Except for the no feedbacks scenario, diel Ωarag variation increases under all scenarios: 0.05–0.50 (4%–62% increase) under the 600 µatm scenario, or 0.07–1.00 (6%–119% increase) under the 900 µatm scenario.
When diel chemistry variation increases, the daytime and nighttime chemistry conditions become increasingly disconnected. As more ecosystem feedbacks are incorporated into the model scenarios, and as seawater residence time increases, the daytime chemistry conditions become more similar to present-day conditions while the nighttime chemistry conditions become less similar to present-day conditions, especially under the photosynthesis and respiration feedback. Hence, for any given scenario the acidification of seawater during the daytime is less than the median acidification on the reef flat and the acidification during the nighttime is greater than the median acidification (Figure 3).

3.3. Reef Edge vs. Reef Flat Calcification, and Ecosystem Calcification Thresholds

Net daily calcification under present-day conditions is projected to be higher at the reef edge and on exposed reefs than on the reef flat, due to the higher average Ωarag in offshore water (Figure 4).
Taking into account the calcifier abundance feedback under the global change scenarios, the reef edge is projected to have a net calcification threshold at an offshore pCO2 ~730 µatm (~2.1 °C warmer), whereas the reef flat has a similar or slightly lower threshold at ~670–730 µatm (~1.8–2.1 °C warmer), depending on seawater residence time. If the calcifier abundance feedback is not included (implying that corals and other calcifiers are able to acclimatize or adapt sufficiently to survive under acidified conditions and during high temperature exposure) this threshold shifts to higher pCO2 values and warmer temperatures. The threshold for the reef edge is projected to be ~1000 µatm (~3.4 °C warmer). Under the calcification and dissolution feedback the threshold is projected as ~960–1020 µatm (~3.2–3.4 °C warmer), depending on seawater residence time. However, when the photosynthesis and respiration feedback is included calcification on the reef flat is projected to begin to exceed that of the reef edge when offshore pCO2 exceeds ~810–850 µatm (~2.6–2.7 °C warmer). Under this scenario the reef flat is projected to have a net calcification threshold at an offshore pCO2 ~1080–1200 µatm (~3.6–4 °C warmer), depending on seawater residence time. These higher net calcification thresholds on the reef flat occur in spite of similar or slightly lower median Ωarag as compared to the reef edge and are a consequence of higher daytime Ωarag values, which are especially important during the period of light-enhanced calcification in our model.
Figure 4. (ac)Plots showing integral, daily net community calcification; (df) net ecosystem calcification; and (gi) net community dissolution for the reef flat and the offshore reef edge as a function of offshore pCO2 for all model scenarios. Thin black line (af) shows zero net calcification. Note difference in scale for net community dissolution and that for the offshore reef edge, rates of net community dissolution are directly overlapping for the two modeled scenarios (g-i).
Water 05 01303 g004

3.4. Comparisons to Other Systems

Chemical oceanographers have long recognized that ocean acidification reduces seawater buffer capacity, which will limit the oceanic uptake of anthropogenic CO2 [1,4,5,6]. However, relatively less consideration has been given to the importance of reduced buffer capacity in shaping seawater chemistry variation. This study is among the first to estimate the magnitude of this effect and the role of biological feedbacks in that effect. Here we show that global change does indeed increase diel seawater chemistry variation, and that various ecosystem feedbacks associated with global change can magnify these effects such that the increased variation can be substantial (e.g., 14%–66% increase in diel pH variation at pCO2 of 600 µatm, or 31%–153% increase at 900 µatm). Shaw et al. [40] show broadly similar effects in a recent modeling study parameterized for the Lady Elliot Island reef flat, southern Great Barrier Reef. Despite the likely importance of increased diel chemistry variation for organisms and ecosystem processes, to date these effects have been almost completely unexamined in global change research. While our modeling effort focuses on a particular model ecosystem it is important to recognize that the mechanisms and effects examined here are common to many shallow, coastal ecosystems. Hence, any ecosystem which induces large variation in seawater chemistry as a consequence of ecosystem metabolism is likely to experience similar changes in seawater chemistry.
Each of the ecosystem feedbacks considered here (calcification and carbonate dissolution, calcifier abundance, and photosynthesis and respiration) had large impacts on the seawater chemistry as compared to the no feedbacks scenario. How global change is likely to affect calcification, carbonate dissolution, and community structure on coral reefs and in other ecosystems is a topic of active research, however, relatively less is known about the effects of global change (especially elevated temperature) on ecosystem photosynthesis and respiration. Even relatively small changes in the rates of photosynthesis or respiration (<35% increase here) can result in large changes in seawater chemistry in shallow areas, such as on coral reef flats. Hence, better constraining photosynthesis and respiration feedbacks for coastal ecosystems in response to global change would markedly improve the accuracy of projected changes in seawater chemistry.
Recent work has emphasized the importance of considering natural chemistry variation for understanding the impacts of OA on organisms and ecosystems. For example, Hofmann et al. [9] reported pH records from a diversity of natural habitats. At open ocean sites or those on exposed forereefs and shelves pH variation is quite small. In contrast, estuaries have much higher diel chemistry variation driven by high metabolic rates in shallow water. Extrapolating results from our model to other systems, we predict that OA will induce even greater diel variation in already variable estuarine systems. Eutrophication can amplify this variation by enhancing gross productivity, which then tends to stimulate higher ecosystem respiration [8,41], similar to the photosynthesis and respiration feedback considered here. Regions of upwelling also experience large pH variation, though this variation is driven more by changes in upwelling than by diel variation in ecosystem metabolism (outside of shallow areas). Hence, the phenomenon of enhanced acidification due to reduced seawater buffer capacity outlined in our model would still apply to these systems, though changes in pH variation are likely to be small compared to changes driven by variation in upwelling.
Volcanic CO2 vents off Ischia Island in the Mediterranean [42,43], volcanic CO2 vents off Papua New Guinea [44], and ojos groundwater discharges in Mexico [9,45] show dramatic pH variation (0.8–1.5 units) over short periods of time, likely as a consequence of variable rates of CO2 or CO2-enriched groundwater discharge and variable rates of mixing with normal sea water. While pH variation should increase under OA, the magnitude of the increase at these sites is at least one order of magnitude greater than expected. Kerrison et al. [43] addressed this issue by examining the spatial heterogeneity of pH variation at the CO2 vent site off Ischia. They found that sites near the vents experienced dramatically enhanced pH variation while a site slightly removed from the CO2 vents experienced both reduced pH (~0.32) and moderately enhanced pH variation (~20%), analogous to what would be expected due to OA alone.

3.5. Biological Implications

To date very little research has examined the effects of diel carbonate chemistry variation on organisms or ecosystem processes. Dufault et al. [46] exposed newly settled recruits of the coral Seriatopora caliendrum to stable low pCO2, stable high pCO2, diurnally fluctuating pCO2 on a natural phase (similar to the regime on the reef flat at Hobihu Reef, Taiwan), or diurnally fluctuating pCO2 on a reverse phase. The recruits showed higher rates of calcification and growth under the natural phase fluctuating regime and the high pCO2 regime as compared to the low pCO2 regime or the reverse phase regime. Furthermore, survivorship was highest under the natural phase fluctuating regime and lowest under the reverse phase fluctuating regime. The authors hypothesized that the high calcification rates under the natural phase fluctuating regime could be the result of the coral tissues loading CT during the night (when CT was high) and subsequently drawing on those resources to support higher daytime rates of calcification (when pH and Ωarag were high). Hence, increased diel chemistry variation due to OA could have a stimulatory effect on organismal calcification and recruitment, thereby counteracting at least a portion of the negative effects of OA on organisms and ecosystems. This effect is not included in our model, and it remains to be seen if the hypothesized mechanism is true, and whether other organisms respond similarly to diel chemistry variation. Conversely, another study performed with an intertidal isopod (which lives in a naturally variable environment) found lower rates of survivorship and behavioral differences at variable, low pH as compared to constant, low pH [47]. Given the dearth of information regarding the effects of carbonate chemistry variation on marine organisms it is impossible to evaluate how ubiquitous these effects might be. However, these studies suggest that changes in chemistry variation itself, independent of changes in mean chemistry, could impact marine organisms and ecosystems in ways that are presently difficult to predict.
Changes in the magnitude or period of chemistry variation itself may underlie currently conflicting empirical results with similar mean chemistries reported in the literature. For example, if ecosystem processes, particularly recruitment, experience threshold effects or are especially sensitive to short-term, low-frequency exposure to highly acidified conditions it may help to explain observations made by Fabricius et al. [44] at volcanic CO2 vents in Papua New Guinea. The authors observed substantial reductions in recruitment and species diversity of both calcifying and non-calcifying species at the high pCO2 sites as compared to nearby low pCO2 sites [44]. However, as discussed above the carbonate chemistry variation at the low pH sites is much larger than would be expected as a result of OA. While median pHT at these sites is on the order of 7.7–7.8 (similar to that expected under OA), the lower 95% confidence interval is on the order of pHT ~7.0–7.1, yielding a pH range of at least 0.8–1.0 units, or about 10–30 times more variable than the control sites. In contrast, Shamberger et al. [48] reported opposite results at sites in Palau which are naturally acidified via ecosystem metabolism. Median pH in Palau is similar to the CO2 vent sites in Papua New Guinea, but the chemistry variation is much lower and more in keeping with what would be expected due to OA. Shamberger et al. [48] observed higher species diversity among hard corals at the low pH site as compared to control sites at high pH. It is unknown what if any role carbonate chemistry variation might play in driving the observed patterns, though conflicting empirical results and the predictions of our model suggest this is a topic in need of investigation.
Organismal and ecosystem responses to OA could show threshold effects whereby large responses are induced only after exceeding a particular chemistry threshold. Recent work has shown significant threshold effects for some organisms, but not for others. For example, Ries et al. [49] showed that calcification exhibited a threshold negative response to CO2 enrichment among a temperate coral, pencil urchin, hard clam, and a conch and a threshold positive effect for a lobster at a mean pCO2 between 900 and 2900 µatm. Conversely, Comeau et al. [50] observed no threshold effect for calcification at a mean pCO2 up to 2100 µatm for four species of tropical coral, two species of coralline algae, and two species of calcifying green algae (Halimeda spp.). However, Venn et al. [51] observed a threshold negative effect on calcification for the coral Stylophora pistillata, but only at mean pCO2 > 2500 µatm. Likewise, Price et al. [52] found that the duration spent above the climatological minimum pH and the magnitude of the pH anomaly (due to diel pH variation) was a predictor of recruitment and calcification of early successional reef species such as coralline algae and bryozoans (which produce a hi-Mg calcite skeleton) in the Line Islands. Hence, some organisms and ecosystems processes may respond strongly not only to the mean chemistry conditions, but also to the extremes (either high or low). This effect can be observed as an emergent property of our model, since carbonate chemistry during the period of light-enhanced calcification is very important to the daily carbonate budget. For example, modeled calcification rates can be higher on the reef flat than offshore under the photosynthesis and respiration feedback in spite of lower median Ωarag.
Technological advances have recently allowed for Free Ocean Carbon Enrichment experiments (FOCE). In these experiments, usually small quantities of CO2-enriched sea water are mixed into ambient sea water in situ in chemically controlled chambers, exposing organisms to environmental conditions very similar to ambient but with elevated pCO2. For example, Kline et al. [53] report on a FOCE system developed for use on the Heron Island, Australia coral reef flat. In this system the supply of CO2-enriched sea water is dynamically controlled to achieve a particular pH offset relative to ambient sea water. The actual pH offset achieved by Kline et al. [53] varied over the course of the experiment due largely to variable rates of flushing during tidal transitions (~0–0.5 pH unit offset, relative to a mean offset of 0.22 pH units), though such a system could in principle achieve a constant pH offset relative to ambient. However, as shown here a constant pH offset over the diel cycle does not adequately replicate changes in seawater chemistry induced by global change. A constant pH offset would result in too much of a pH decrease during the daytime and too little of a pH decrease during the nighttime in environments with naturally variable pH, such as coral reef flats and many other coastal environments. Rather than maintaining a particular pH offset, more realistic and environmentally relevant changes in seawater chemistry could be achieved by injecting CO2-enriched sea water at a rate commensurate with the rate of flushing through each chamber (e.g., 1 mL CO2-enriched sea water per 1 L ambient sea water, controlled according to flow rate). This type of manipulation is easily achieved in flow-through mesocosm experiments, where the rate of CO2 addition (or acid addition) and ambient seawater flow-through rate can be readily controlled [54].

3.6. Ecosystem Calcification Thresholds

Our study modeled calcification-dissolution thresholds for the Kāne‘ohe Bay barrier reef flat and for similar, exposed reefs. Under constant temperature (i.e., OA alone) Shamberger et al. [10] projected that the Kāne‘ohe Bay barrier reef flat would transition from net calcification to net dissolution at a mean daily Ωarag = 1.65, which would occur at a mean pCO2 ~1000–1100 µatm. Our model projects a similar threshold under constant temperature and community structure (data not shown). Net calcification thresholds for other reefs under present-day temperature and community structure vary widely from Ωarag < 1 to Ωarag > 4 (reviewed in [10,40]). Hence, the relationship between seawater chemistry and net ecosystem calcification appears to depend strongly on local factors which are not immediately obvious, and results from one reef cannot necessarily be extrapolated to another. For example, as pointed out by Shamberger et al. [10], the coral reef calcification model developed by Silverman et al. [25] under-predicts measured rates of calcification on the Kāne‘ohe Bay barrier reef flat by an order of magnitude. Taking into account the negative effects of OA and elevated temperature on net community calcification, Silverman et al. [25] projected that almost all coral reefs would experience net dissolution when atmospheric CO2 reaches ~750 µatm. In contrast, our model projects that the Kāne‘ohe Bay barrier reef flat and nearby reefs with similar sensitivities would not experience net dissolution until atmospheric CO2 reaches ~960–1200 µatm. Taking into account reduced calcifier abundance under global change Silverman et al. [25] projected that almost all reefs would experience net dissolution by the time atmospheric CO2 reaches ~560 µatm whereas our model projects a substantially higher threshold of ~670–730 µatm for the Kāne‘ohe Bay barrier reef flat and other nearby reefs. Again, these differences underscore the importance of local factors in shaping ecosystem responses to global change. Conditions which might cause net dissolution and long-term degradation of one reef may prove perfectly tolerable for another. It has also been argued that high latitude reefs like those in Kāne‘ohe Bay should be among the first to be negatively affected by OA due to their naturally lower Ωarag [55]. Instead, both our model and recent empirical work [10,20] argue that this reef appears to be less sensitive to OA as compared to some reefs at higher mean Ωarag, including some low latitude reefs.

4. Conclusions

The metabolic rates and ecosystem feedback scenarios considered here have significant uncertainties, but this study nonetheless provides a starting point to begin examining the importance of reduced seawater buffer capacity and ecosystem feedbacks in shaping coastal, seawater chemistry under global change. We have shown that for shallow ecosystems, such as coral reef flats, diel chemistry variation increases substantially under OA. However, the magnitude of the increase in diel chemistry variation (as well as the magnitude of the change in mean chemistry conditions) depends strongly on the precise ecosystem feedbacks involved, and on seawater residence time. Reduced calcification, increased carbonate dissolution, and increased net photosynthesis all provide a buffer against OA which can be quite substantial in areas where ecosystem metabolism already has a large effect on seawater chemistry. In other systems, such as upwelling zones, impacts are expected to be far less obvious. Regardless of the precise feedback scenario, relative to present-day conditions, changes in daytime seawater chemistry are smaller than changes in nighttime chemistry. The implications of this growing disconnect between daytime and nighttime chemistry conditions for marine organisms and ecosystems is largely unknown. However, the few studies published to date which have examined the effects of diel carbonate chemistry variation on organisms suggest that variation itself, above and beyond changes in the mean chemistry, likely has important effects. Hence, it would be useful in future research to examine organism and ecosystem responses not only to a range of mean carbonate chemistry conditions, but also to a range of carbonate chemistry variation. In addition, better constraining ecosystem feedbacks under global change (especially photosynthesis and respiration feedbacks) will improve projections of future seawater chemistry for coastal ecosystems.

Acknowledgments

We dedicate this manuscript to the memory of Marlin Atkinson, who passed away prior to its publication. Marlin was a brilliant scientist, a colleague, mentor, and friend; we miss him greatly. We thank Riccardo Rodolfo-Metalpa and an anonymous reviewer for their helpful comments on this manuscript. Funding was provided by a George Melendez Wright Climate Change Fellowship through the National Park Service to CP Jury, National Oceanic and Atmospheric Administration (NMSP MOA#2005-008/66882), and by UH Sea Grant. This paper is funded in part by a grant/cooperative agreement from the National Oceanic and Atmospheric Administration, Project R/IR-23, which is sponsored by the University of Hawaii Sea Grant College Program, SOEST, under Institutional Grant No. NA09OAR4170060 from NOAA Office of Sea Grant, Department of Commerce. The views expressed herein are those of the authors and do not necessarily reflect the views of NOAA or any of its subagencies. UNIHI-SEAGRANT-JC-12-29. This is contribution number 1561 from the Hawai‘i Institute of Marine Biology and SOEST contribution number 8976.

References

  1. Revelle, R.; Suess, H.E. Carbon dioxide exchange between atmosphere and ocean and the question of an increase of atmospheric CO2 during the past decades. Tellus 1957, 9, 18–27. [Google Scholar] [CrossRef]
  2. Broeker, W.S.; Takahashi, T.; Simpson, H.J.; Peng, T.H. Fate of fossil fuel carbon dioxide and the global carbon budget. Science 1979, 206, 409–418. [Google Scholar]
  3. Caldeira, K.; Wickett, M.E. Anthropogenic carbon and ocean pH. Nature 2003, 425, 365. [Google Scholar] [CrossRef]
  4. Sundquist, E.T.; Plummer, L.N.; Wigley, T.M.L. Carbon dioxide in the ocean surface: The homogenous buffer factor. Science 1979, 204, 1203–1205. [Google Scholar]
  5. Fraginoulle, M. A complete set of buffer factors for acid/base CO2 system in seawater. J. Mar. Syst. 1994, 5, 111–118. [Google Scholar] [CrossRef]
  6. Egleston, E.S.; Sabine, C.L.; Morel, F.M.M. Revelle revisted: Buffer factors that quantify the response of ocean chemistry to changes in DIC and alkalinity. Glob. Biogeochem. Cycles 2010, 24. [Google Scholar] [CrossRef]
  7. Donner, S.D. Coping with commitment: Projected thermal stress on coral reefs under different future scenarios. PLoS ONE 2009, 4, e5712. [Google Scholar] [CrossRef]
  8. Borges, A.V.; Gypens, N. Carbonate chemistry in the coastal zone responds more strongly to eutrophication than ocean acidification. Limnol. Oceanogr. 2010, 55, 346–353. [Google Scholar] [CrossRef]
  9. Hofmann, G.E.; Smith, J.E.; Johnson, K.S.; Send, U.; Levin, L.A.; Micheli, F.; Paytan, A.; Price, N.N.; Peterson, B.; Takeshita, Y.; et al. High-frequency dynamics of ocean pH: A multi-ecosystem comparison. PLoS ONE 2011, 6, e28983. [Google Scholar] [CrossRef]
  10. Shamberger, K.E.F.; Feely, R.A.; Sabine, C.L.; Atkinson, M.J.; DeCarlo, E.H.; Mackenzie, F.T.; Drupp, P.S.; Butterfield, D.A. Calcification and organic production on a Hawaiian coral reef. Mar. Chem. 2011, 127, 64–75. [Google Scholar] [CrossRef]
  11. Hoppe, C.J.M.; Langer, G.; Rokitta, S.D.; Wolf-Gladrow, D.A.; Rost, B. Implications of observed inconsistencies in carbonate chemistry measurement for ocean acidification studies. Biogeosci. Discuss. 2012, 9, 2401–2405. [Google Scholar] [CrossRef] [Green Version]
  12. Falter, J.F.; Lowe, R.J.; Atkinson, M.J.; Cuet, P. Seasonal coupling and de-coupling of net calcification rates from coral reef metabolism and carbonate chemistry at Ningaloo Reef, Western Australia. J. Geophys. Res. 2012, 117. [Google Scholar] [CrossRef]
  13. Lewis, E.; Wallace, D.W.R. Program Developed for CO2 System Calculations, ORNL/CDIAC-105; Carbon Dioxide Information Analysis Center, Oak Ridge National Laboratory: Oak Ridge, TN, USA, 1998. [Google Scholar]
  14. Falter, J.L.; Lowe, R.J.; Atkinson, M.J.; Monismith, S.G.; Schar, D.W. Continuous measurements of net production over a shallow reef community using a modified Eulerian approach. J. Geophys. Res. Oceans 2008, 113. [Google Scholar] [CrossRef]
  15. Kleypas, J.A.; Anthony, K.R.N.; Gattuso, J.-P. Coral reefs modify their seawater carbon chemistry—Case study from a barrier reef (Moorea, French Polynesia). Glob. Chang. Biol. 2011, 17, 3667–3678. [Google Scholar] [CrossRef]
  16. Carpenter, R.C.; Williams, S.L. Mass transfer limitation of photosynthesis of coral algal turf communities. Mar. Biol. 2007, 151, 435–450. [Google Scholar] [CrossRef]
  17. Anthony, K.R.N.; Kleypas, J.A.; Gattuso, J.-P. Coral reefs modify their seawater carbon chemistry—Implications for impacts of ocean acidification. Glob. Change Biol. 2011, 17, 3655–3666. [Google Scholar] [CrossRef]
  18. Yvon-Durocher, G.; Caffrey, J.M.; Cescatti, A.; Dossena, M.; del Giorgio, P.; Gasol, J.M.; Montoya, J.M.; Pumpanen, J.; Staehr, P.A.; Trimmer, M.; et al. Reconciling the temperature dependence of respiration across timescales and ecosystem types. Nature 2012, 487, 472–476. [Google Scholar] [CrossRef]
  19. Langdon, C.; Atkinson, M.J. Effect of elevated pCO2 on photosynthesis and calcification of corals and interactions with seasonal change in temperature/irradiance and nutrient enrichment. J. Geophys. Res. 2005, 110. [Google Scholar] [CrossRef]
  20. Andersson, A.J.; Kuffner, I.B.; MacKenzie, F.T.; Jokiel, P.L.; Rodgers, K.S.; Tan, A. Net loss of CaCO3 from coral reef communities due to human induced seawater acidification. Biogeosci.Discuss. 2009, 6, 2163–2182. [Google Scholar] [CrossRef]
  21. Buddemeier, R.W.; Jokiel, P.L.; Zimmerman, K.M.; Lane, D.R.; Carey, J.M.; Bohling, G.C.; Martinich, J.A. A modeling tool to evaluate regional coral reef responses to change in climate and ocean chemistry. Limnol. Oceanogr. Methods 2008, 6, 395–411. [Google Scholar] [CrossRef]
  22. Hoeke, R.K.; Jokiel, P.L.; Budemeier, R.W.; Brainard, R.E. Projected changes to growth and mortality of Hawaiian corals over the next 100 years. PLoS ONE 2011, 6, e18038. [Google Scholar]
  23. Langdon, C.; Broecker, W.S.; Hammond, D.E.; Glenn, E.; Fitzsimmons, K.; Nelson, S.G.; Peng, T.-H.; Hajdas, I.; Bonani, G. Effect of elevated CO2 on the community metabolism of an experimental coral reef. Glob. Biogeochem. Cycles 2003, 17. [Google Scholar] [CrossRef]
  24. 21Long-Term Kaneohe Bay Monitoring Project Homepage. Available online: http://www.hawaii.edu/cisnet/index.htm (accessed on 26 August 2013).
  25. Silverman, J.; Lazar, B.; Cao, L.; Caldeira, K.; Erez, J. Coral reefs may start dissolving when atmospheric CO2 doubles. Geophys. Res. Lett. Oceans 2009, 36. [Google Scholar] [CrossRef]
  26. Yates, K.K.; Halley, R.B. CO32− concentration and pCO2 thresholds for calcification and dissolution on the Molokai reef flat, Hawaii. Biogeosci. Discuss. 2006, 3, 357–369. [Google Scholar] [CrossRef]
  27. Jury, C.P.; Whitehead, R.F.; Szmant, A.M. Effects of variations in carbonate chemistry on the calcification rates of Madracis auretenra (=Madracis mirabilis sensu Wells, 1973): Bicarbonate concentrations best predict calcification rates. Glob. Change Biol. 2010, 15, 1632–1644. [Google Scholar]
  28. Jokiel, P.L. Ocean acidification and control of reef coral calcification by boundary layer limitation of proton flux. Bull. Mar. Sci. 2011, 87, 639–657. [Google Scholar] [CrossRef]
  29. Jokiel, P.L. The reef coral two compartment proton flux model: A new approach relating tissue-level physiological processes to gross corallum morphology. J. Exp. Mar. Biol. Ecol. 2011, 409, 1–12. [Google Scholar] [CrossRef]
  30. Roleda, M.Y.; Boyd, P.W.; Hurd, C.L. Before ocean acidification: Calcifier chemistry lessons. J. Phycol. 2012, 48, 840–843. [Google Scholar] [CrossRef]
  31. Comeau, S.; Carpenter, R.C.; Edmunds, P.J. Coral reef calcifiers buffer their response to ocean acidification using both bicarbonate and carbonate. Proc. R. Soc. B 2012, 28. [Google Scholar] [CrossRef]
  32. Chalker, B.E.; Taylor, D.L. Light-enhanced calcification, and the role of oxidative phosphorylation in calcification of the coral Acropora cervicoris. Proc. R. Soc. B 1975, 190, 323–331. [Google Scholar] [CrossRef]
  33. De Beer, D.; Larkum, A.W.D. Photosynthesis and calcification in the calcifying algae Halimeda discoidea studied with microsensors. Plant Cell Environ. 2001, 24, 1209–1217. [Google Scholar] [CrossRef]
  34. Colombo-Pallotta, M.F.; Rodríguez-Román, A.; Iglesias-Prieto, R. Calcification in bleaching and unbleached Montastraea faveolata: Evaluating the role of oxygen and glycerol. Coral Reefs 2010, 29, 899–907. [Google Scholar] [CrossRef]
  35. Coles, S.L.; Brown, B.E. Coral bleaching—Capacity for acclimatization and adaptation. Adv. Mar. Biol. 2003, 46, 183–223. [Google Scholar]
  36. Maynard, J.A.; Anthony, K.R.N.; Marshall, P.A.; Masiri, I. Major bleaching events can lead to increased thermal tolerance in corals. Mar. Biol. 2008, 155, 173–182. [Google Scholar] [CrossRef]
  37. Guest, J.R.; Baird, A.H.; Maynard, J.A.; Muttaqin, E.; Edwards, A.J.; Campbell, S.J.; Yewdall, K.; Affendi, Y.A.; Chou, L.M. Contrasting patterns of coral bleaching susceptibility in 2010 suggest an adaptive response to thermal stress. PLoS ONE 2012, 7, e33353. [Google Scholar] [CrossRef]
  38. Anthony, K.R.N.; Kline, D.I.; Diaz-Pulido, G.; Dove, S.; Hoegh–Guldberg, O. Ocean acidification causes bleaching and productivity loss in coral reef builders. Proc. Natl. Acad. Sci. USA 2008, 105, 17442–17446. [Google Scholar]
  39. PANGAEA Home Page. Available online: http://www.pangaea.de/ (accessed on 26 August 2013).
  40. Shaw, E.C.; McNeil, B.I.; Bronte, T.; Matear, R.; Bates, M.L. Anthropogenic changes to seawater buffer capacity combined with natural reef metabolism induce extreme future coral reef CO2 conditions. Glob. Change Biol. 2013, 19, 1632–1641. [Google Scholar] [CrossRef]
  41. Cai, W.-J.; Hu, X.; Huang, W.-J.; Murrel, M.C.; Lehrter, J.C.; Lohrenz, S.E.; Chou, W.-C.; Zhai, W.; Hollibaugh, J.T.; Wang, Y.; et al. Acidification of subsurface coastal waters enhanced by eutrophication. Nat. Geosci. 2011, 4, 766–770. [Google Scholar] [CrossRef]
  42. Hall-Spencer, J.M.; Rodolfo-Metalpa, R.; Martin, S.; Ransome, E.; Fine, M.; Turner, S.M.; Rowley, S.J.; Tedesco, D.; Buia, M.-C. Volcanic carbon dioxide vents show ecosystem effects of ocean acidification. Nature 2008, 454, 96–99. [Google Scholar] [CrossRef]
  43. Kerrison, P.; Hall-Spencer, J.M.; Suggett, D.J.; Hepburn, L.J.; Steinke, M. Assessment of pH variability at a coastal CO2 vent for ocean acidification studies. Estuar. Coast. Shelf Sci. 2011, 94, 129–137. [Google Scholar] [CrossRef] [Green Version]
  44. Fabricius, K.E.; Langdon, C.; Uthicke, S.; Humphrey, C.; Noonan, S.; De’ath, G.; Okazaki, R.; Muehllehner, N.; Glas, M.S.; Lough, J.M. Losers and winners in coral reefs acclimatized to elevated carbon dioxide concentrations. Nat. Clim. Chang. 2011, 1, 165–169. [Google Scholar] [CrossRef]
  45. Crook, E.D.; Potts, D.; Rebolledo-Vieyra, M.; Hernandez, L.; Paytan, A. Calcifying coral abundance near low-pH springs: implications for future ocean acidification. Coral Reefs 2012, 31, 239–245. [Google Scholar] [CrossRef]
  46. Dufault, A.M.; Cumbo, V.R.; Fan, T.-Y.; Edmunds, P.J. Effects of diurnally oscillating pCO2 on the calcification and survival of coral recruits. Proc. R. Soc. B 2012, 279, 2951–2958. [Google Scholar] [CrossRef]
  47. Alenius, B.; Munguia, P. Effects of pH variability on the intertidal isopod, Paradella dianae. Mar. Freshw. Behav. Phy. 2012, 45, 245–259. [Google Scholar] [CrossRef]
  48. Shamberger, K.E.F.; Cohen, A.L.; McCorkle, D.C.; Lentz, S.; Feely, R.; Sabine, C.L.; Mcleod, E. Quantifying Ecosystem Calcification Responses to Elevated CO2 on Coral Reefs. In Proceedings of 12th International Coral Reef Symposium, Cairns, Australia, 9-12 July 2012.
  49. Ries, J.B.; Cohen, A.L.; McCorkle, D.C. Marine calcifiers exhibit mixed responses to CO2-induced ocean acidification. Geology 2009, 37, 1131–1134. [Google Scholar] [CrossRef]
  50. Comeau, S.; Edmunds, P.J.; Spindel, N.B.; Carpenter, R.C. The responses of eight coral reef calcifiers to increasing partial pressure of CO2 do not exhibit a tipping point. Limnol. Oceanogr. 2013, 58, 388–398. [Google Scholar] [CrossRef] [Green Version]
  51. Venn, A.; Tambutté, E.; Holcomb, M.; Tambutté, S. Live tissue imagining shows reef corals elevate pH under their calcifying tissue relative to seawater. PLoS ONE 2011, 6, e20013. [Google Scholar]
  52. Price, N.N.; Matz, T.R.; Brainard, R.E.; Smith, J.E. Diel variability in seawater pH related to calcification and benthic community structure on coral reefs. PLoS ONE 2012, 7, e43843. [Google Scholar]
  53. Kline, D.I.; Teneva, L.; Schneider, K.; Miard, T.; Chai, A.; Marker, M.; Headley, K.; Opdyke, B.; Nash, M.; Veletich, M.; et al. A short-term in situ CO2 enrichment experiment on Heron Island (GBR). Sci. Rep. 2012, 2. [Google Scholar] [CrossRef]
  54. Jokiel, P.L.; Rodgers, K.S.; Kuffner, I.B.; Andersson, A.J.; Cox, E.F.; MacKenzie, F.T. Ocean acidification and calcifying reef organisms: A mesocosm investigation. Coral Reefs 2008, 27, 473–483. [Google Scholar] [CrossRef]
  55. Friedrich, T.; Timmerman, A.; Abe-Ouchi, A.; Bates, N.R.; Chikamoto, M.O.; Church, M.J.; Dore, J.E.; Gledhill, D.K.; González–Dávila, M.; Heinemann, M.; et al. Detecting regional anthropogenic trends in ocean acidification against natural variability. Nat. Clim. Chang. 2012, 2, 167–171. [Google Scholar] [CrossRef]

