Article

The Impact of “Man-Made Hydrological Drought” on Plant Species Abundance in the Low-Flow Channel Downstream from the Matawin Dam, Quebec

Department of Environmental Sciences, University of Quebec at Trois-Rivières, Trois-Rivières, 3351 Boulevard des Forges, Trois-Rivières, Québec G9A 5H7, Canada
*
Author to whom correspondence should be addressed.
Water 2013, 5(3), 875-892; https://doi.org/10.3390/w5030875
Submission received: 1 May 2013 / Revised: 13 June 2013 / Accepted: 14 June 2013 / Published: 28 June 2013
(This article belongs to the Special Issue Ecological Watershed Management)

Abstract

:
The interannual variability of streamflow affects the composition and species richness of vegetation in low-flow channels and alluvial plains. Although climate conditions in 2003 and 2004 were nearly identical, large differences in streamflow were observed downstream from the Matawin dam. These differences resulted in numerous days without flow (no water release) during the growing period (May to August) in 2003, leading to man-made hydrological drought. While this drought had no effect on abiotic variables (grain-size distribution and nutrient concentrations in sediments), a significant decrease in the number of terrestrial species was observed in 2004 (year without drought) relative to 2003 (drought year) on three sand bars studied. This decrease is interpreted to result from prolonged submergence of the sites in 2004. Principal component analysis highlighted the effect of individual sites (first principal component) and of the interannual variability of streamflow (second component) on the number of species. The study suggests that, from a flow management standpoint, it is advisable to release enough water downstream from the dam during the growing season to prevent low-flow channel colonization by invasive terrestrial species.

1. Introduction

Hydrologic variation plays a major role in structuring the biotic diversity within river ecosystems as it controls key habitat conditions within the river channel, the floodplain, and hyporheic zones [1]. According to [2] “flow variations regulate taxonomic composition and abundance of aquatic organisms”. However, many studies deal mainly with lentic natural and man-made (fluvial and non-fluvial) settings. In North America, these studies have shown that fluctuations in water levels are the dominant factor controlling the composition and succession of coastal wetland vegetation in the Great Lakes [3,4,5,6]. This conclusion was also confirmed for other parts of the world. In New Zealand, for instance, [7] noted that species richness was much lower in lakes with interannual level variations than in lakes with intra-annual variations.
Although a larger number of factors interact in lotic settings (e.g., [8,9,10]), there is a recognized effect of water levels on aquatic and riparian vegetation, this effect having been shown mainly for regulated rivers downstream from dams. Most of these studies, however, focused on abrupt water level changes at the daily scale observed downstream from dams (see reviews by [11,12,13,14,15]). In contrast, at the interseasonal and interannual scales, the major change caused by the presence of dams is a decrease (low interannual variability of daily flows) in this natural hydrologic variation, resulting in progressive homogenization of streamflow. This homogenization is mostly due to a decrease in peak flows and an increase in minimum flows [13,16]. From an ecological standpoint, streamflow homogenization downstream of dams would result in a loss of biodiversity due to the extinction of native species in favor of alien species, as well as homogenization of the flora and fauna [16].
Reservoirs in Quebec, which produce an inversion of the natural annual cycle of rivers (maximum flows in winter and minimum flows in spring and summer), cause higher interseasonal and interannual variability of daily flows (e.g., [17,18,19,20]) downstream from associated dams than in natural settings. The ecological consequences of such high interannual variability have not yet been documented. The goal of the study is therefore to analyze the impacts of this high interannual variability of daily flows on the abundance of obligate wetland plant species in the Matawin River channel downstream from the Taureau reservoir. This goal is based on the following hypothesis: the high interannual variability of streamflow during the growing season downstream from the Taureau reservoir leads to decrease in the abundance of obligate wetland species on sand bars in the low-flow channel of the river. It should be mentioned that several studies have looked at the effects of water level variability in the St. Lawrence River on vegetation in aquatic settings in Quebec [21,22,23,24,25,26,27]. However, as shown by [27], the interannual variability of water levels in the St. Lawrence is very low due to flow regulation by dams and locks. In addition, most of these studies focused on vegetation in fluvial lakes (lentic settings) in which the hydrologic regime is not inverted.

2. Methods

2.1. Description of the Matawin River Watershed and Hydrologic Data Sources

The main tributary of the Saint-Maurice River located on the north shore and a subtributary of the St. Lawrence River, the Matawin River drains a watershed of 5775 km2 (Figure 1). It nicks the Canadian Shield and bathes in a subpolar climate with an annual wave surge of about 1000 mm and an annual mean temperature of 4 °C. The entire watershed is covered by hardwood forest. Little agriculture is practiced. In 1930, the Taureau Dam (26 m high, 348,000,000 m3 capacity) was erected, with the main objective of supplying the hydroelectric generating stations built on the Saint-Maurice River to produce hydroelectric power in winter, because the reservoir does not have a hydroelectric generating station.
Figure 1. Location of bars sampled upstream (UD) and downstream (DD) from the Taureau reservoir (Matawin dam).
Water 05 00875 g001
The dam operating mode is characterized by water storage from snow melt during the period from April to May or, sometimes, to early June. Since the Taureau Reservoir is an annual reservoir, all of the water stored in spring is released in winter (January to March) to feed the hydroelectric generating stations constructed downstream on the Saint-Maurice River. This management mode has caused the inversion of the natural streamflow cycle (Figure 2): the highest streamflows are recorded in winter and the lowest in spring downstream from the reservoir [28]. Since impoundment of the reservoir in 1931, there has been practically no change in this management mode. Finally, we should mention that when the reservoir reaches maximum capacity in spring, the surplus water brought by summer and fall precipitation obviously is no longer stored. Therefore, the water used in winter for hydroelectric power production comes exclusively from spring snow melt stored in the reservoir in spring.
Since 1931, daily streamflows have been measured simultaneously upstream from the dam at the Saint-Michel-Des-Saints station (1390 km2, 46°41' N, 73°54' W) and just downstream from the reservoir (4070 km2, 46°51' N, 73°38' W). The upstream station is not influenced by the reservoir. Indeed, it is part of the Canadian Reference Hydrometric Basin Network [29], and the selection of these reference stations is based on very strict anthropogenic impact criteria. Among these criteria is the absence of urbanization or any other major transformation (such as deforestation or the presence of a dam). The two stations are located in the same climatic, lithologic and vegetation context. Streamflows measured at the station downstream from the reservoir are not influenced at all by the contributions of a natural tributary. The homogeneity of physiographic conditions upstream and downstream and the absence of influence of a tributary make it easy to compare interannual streamflow variability upstream and downstream from the dam (Figure 1). The streamflow data for these two stations come from the Environment Canada website [30]. The daily streamflow data downstream from the reservoir end in 1994. After that year, the data are no longer archived by Environment Canada. We obtained them from Hydro-Québec, the reservoir’s manager. The dam was constructed by the Shawinigan Water and Power Company (SWPC) in 1930 and then transferred to Hydro-Québec in 1963 when the Quebec provincial government nationalized hydroelectric power [31].
Climate data (temperature and precipitation) are measured at the Saint-Michel-des-Saints station since 1962. They were also taken from an Environment Canada website on the same date as flow data [32].
Figure 2. Coefficient of monthly discharge (%) upstream (black bars) and downstream (grey bars) of the dam (1931–2004).
Water 05 00875 g002

2.2. Measurement of Abiotic and Biotic Variables

To analyze the effects of daily flow variations on plant species abundance, three sand bars were sampled upstream and downstream from the Taureau reservoir (Figure 1). The choice of the same morphological units, namely sand bars, is based on the fact that, in rivers, the inherent heterogeneity introduced by local topography can affect the effects of water level on the species abundance of sites [9]. Thus, [33] have shown that the number of species on islets located downstream from the Butgenbach dam on the Warche River (Belgium) was strongly influenced by the extent of erosion of these islets. Sediments samples (500 g) were collected on each bar at a depth of 15 cm from three sites along a longitudinal transect (from upstream to downstream). A fraction of each sample was used for grain-size analysis using the classic sieving method to determine sand, silt and clay percentages. Another fraction was used for nutrient analysis as follows: total nitrogen (extraction with sulphuric acid following the QuickChem method), total phosphorus (extraction with hydrochloric acid and ammonium fluoride following the method described by [34] and total organic carbon (extraction using potassium dichromate and ferrous sulphate, following the method described by [35]).
Plants on the sand bars were surveyed extensively in 20 × 30 cm plots (in order to sample the whole surface area of interest to identify all species present at a given site) totaling a maximum of 18 m2. At each site, 30 quadrats (replicates) were thus sampled. All species in a given plot were identified in situ according to the Laurentian flora nomenclature [36]. However, when in situ identification proved difficult, a photo of the specimen was taken for identification in the laboratory. In this way, all species were left in place. Identified species were classified according to their respective ecological group. The classification scheme proposed by [37] for Quebec plants was used for this purpose. In this scheme, species are grouped in two categories. We added this last category to analyze the extent of “terrestrialization” (invasion of a wetland by terrestrial plant species) of the low-flow channel of the Matawin River downstream from the dam. Thus, plant species were divided into the following three ecological groups:
-
Obligate wetland species (OBL) are species that only occur in wetlands;
-
Facultative wetland species (FAC) are species that preferentially occur in wetlands, but can also occur in terrestrial settings;
-
Terrestrial species (TS) are species that preferentially occur in terrestrial settings, but can opportunistically develop in wetlands.
All field observations were conducted between May and September of 2003, then repeated in the same period in 2004, 2005 and 2006. Because sites sampled for sediments in 2003 could not be resampled for several years afterward, sediment samples collected in subsequent years came from sites located very close to the 2003 sampling sites. Of the four years studied, the largest daily flow variations were observed between 2003 and 2004. For this reason, only results for these two years were used to analyze the effect of daily flow variability on the abundance of obligate wetland species.

2.3. Statistical Analysis

The classic paired t-test was used to compare the means of climate (monthly temperature and precipitation) and hydrological (daily and monthly streamflow) data measured in 2003 and 2004. This test was only applied to monthly mean data because daily temperature and precipitation data were not available. As for abiotic data (sediment size and chemistry), a comparison of their variation in time (measurements taken in 2003 and 2004) and space (measurements upstream and downstream from the dam) was carried out using the Chi-square test. Finally, for vegetation, a comparison of absolute frequencies of the number of species between sites was carried out using the Chi-square method. These abiotic variables were correlated with biotic variables (percentage of species in each of the three ecological groups). This correlation was calculated for 2003, 2004, and 2003–2004. An exploratory multivariate method based on principal component analysis (PC) was also used to constrain (1) the effect of individual sites (spatial factor) and of the interannual variability of streamflow (temporal factor) on the number of species in each of the three ecological groups. Principal component analysis, a widely used method, was applied to a matrix consisting of six rows (three sites upstream and three sites downstream from the dam) and six columns (proportions, in percent, of species in each of the three ecological groups calculated for 2003 and 2004 at each site). It is to be noted that we have used the correlation matrix calculated between the proportions of species in each ecological group for each site for 2003 and 2004. Axis rotation was performed using the Varimax method, which allowed us to maximize the loadings of species proportions for each ecological group calculated for 2003 and 2004. Note that, according to the widely-used Kayser criterion, a principal component is statistically significant when its eigenvalue is ≥1. Except for application of the Chi-square method, these computations were carried out in SYSTAT 11 (SYSTAT Software 2004, Cranes Software International Ltd., Karnataka, India).

3. Results and Discussion

3.1. Comparison of Hydroclimate Variables for 2003 and 2004

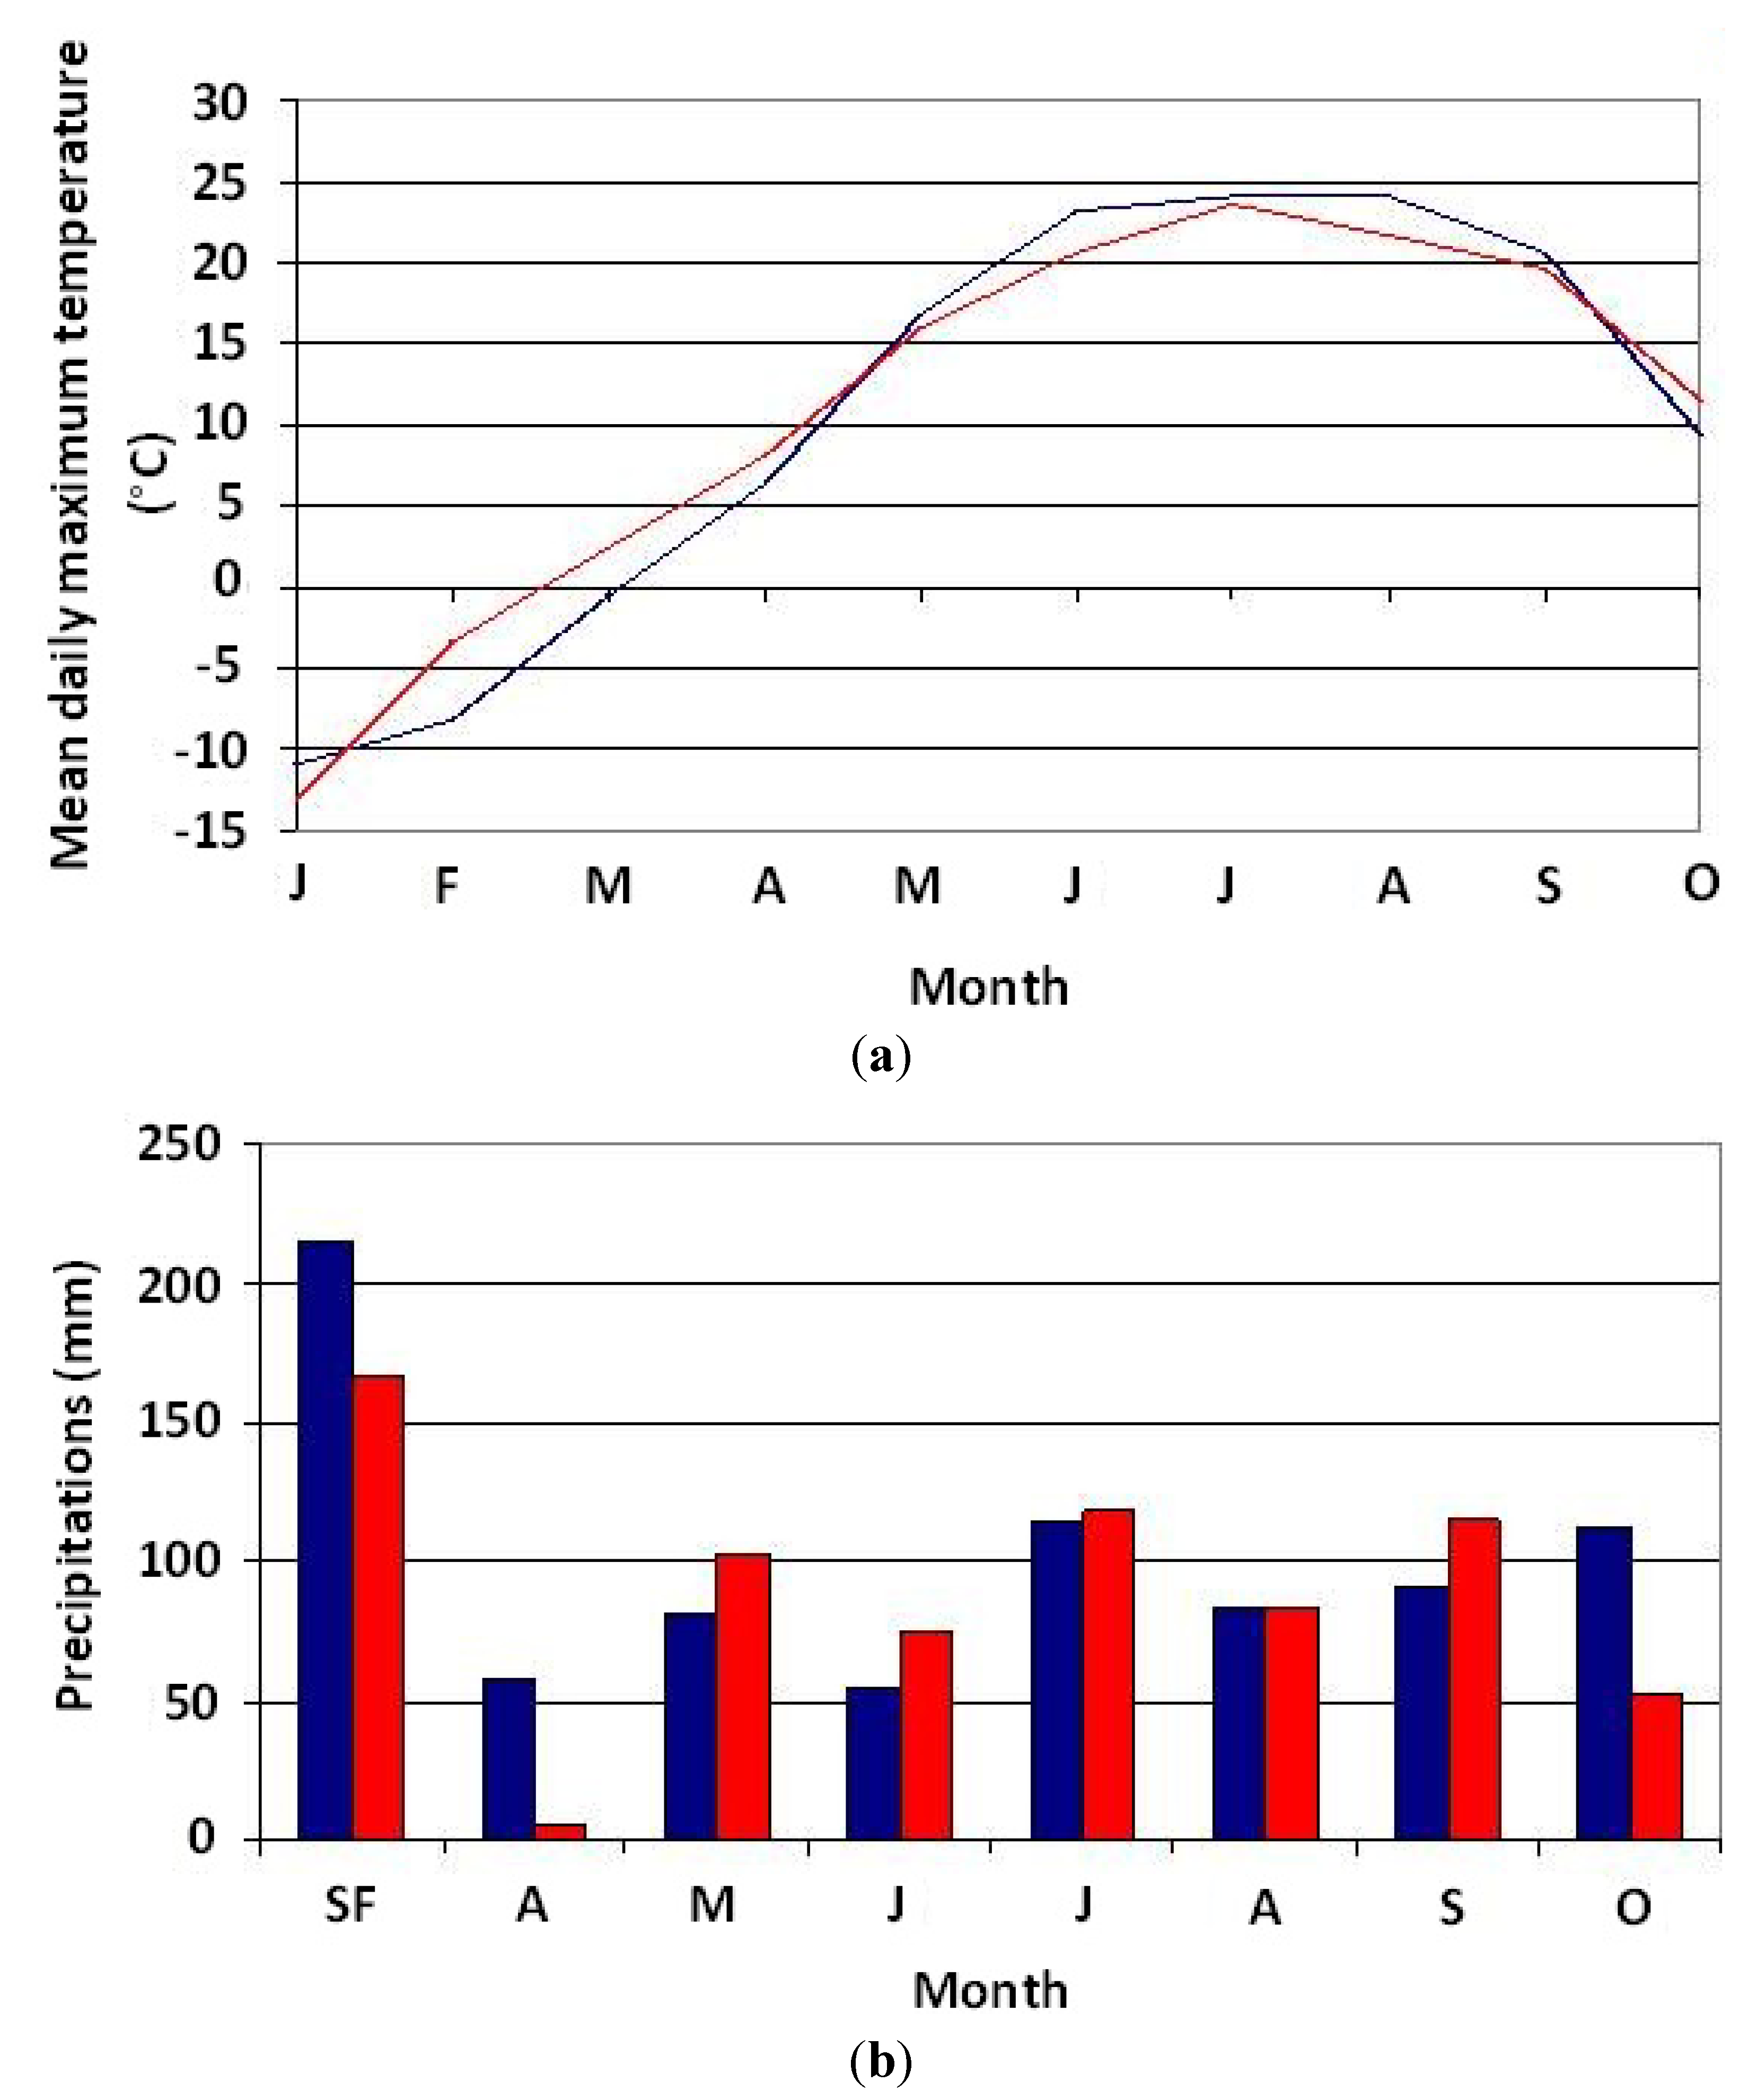
Temperature and precipitation variability in 2003 and 2004 is shown in Figure 3a,b. Results of the comparison of measurements of these two variables at the monthly scale for the two years using the paired t-test are shown in 
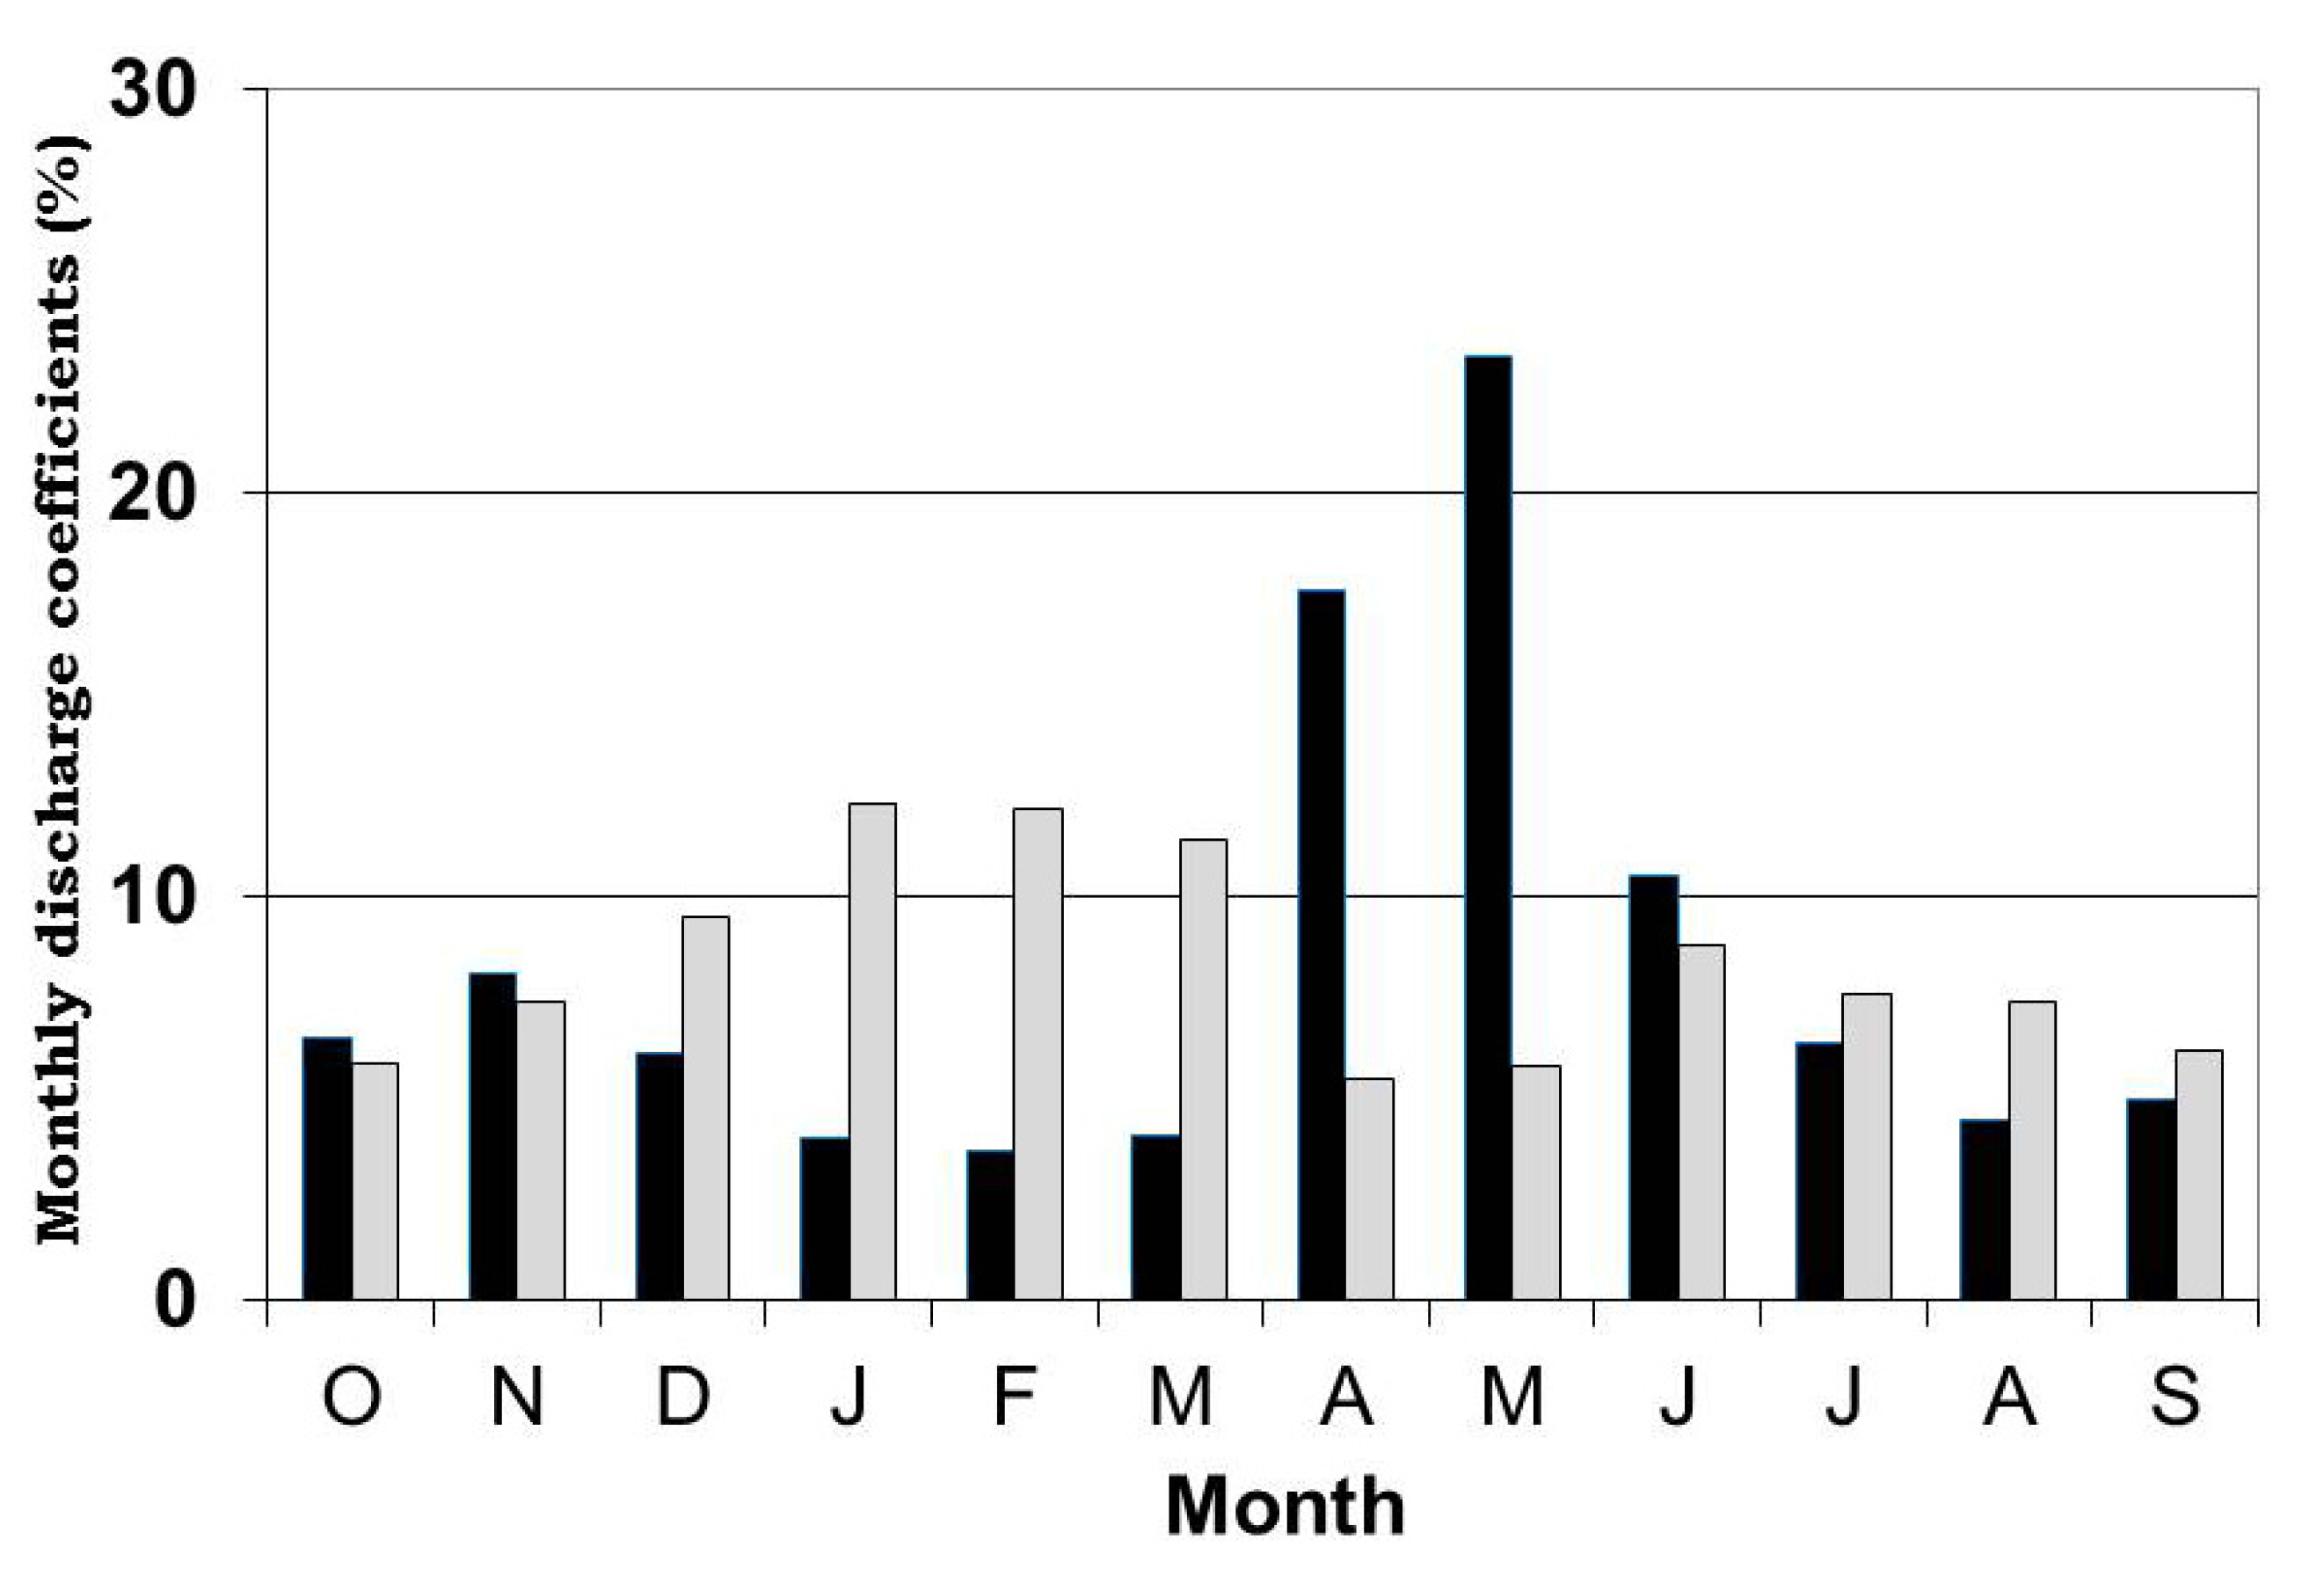
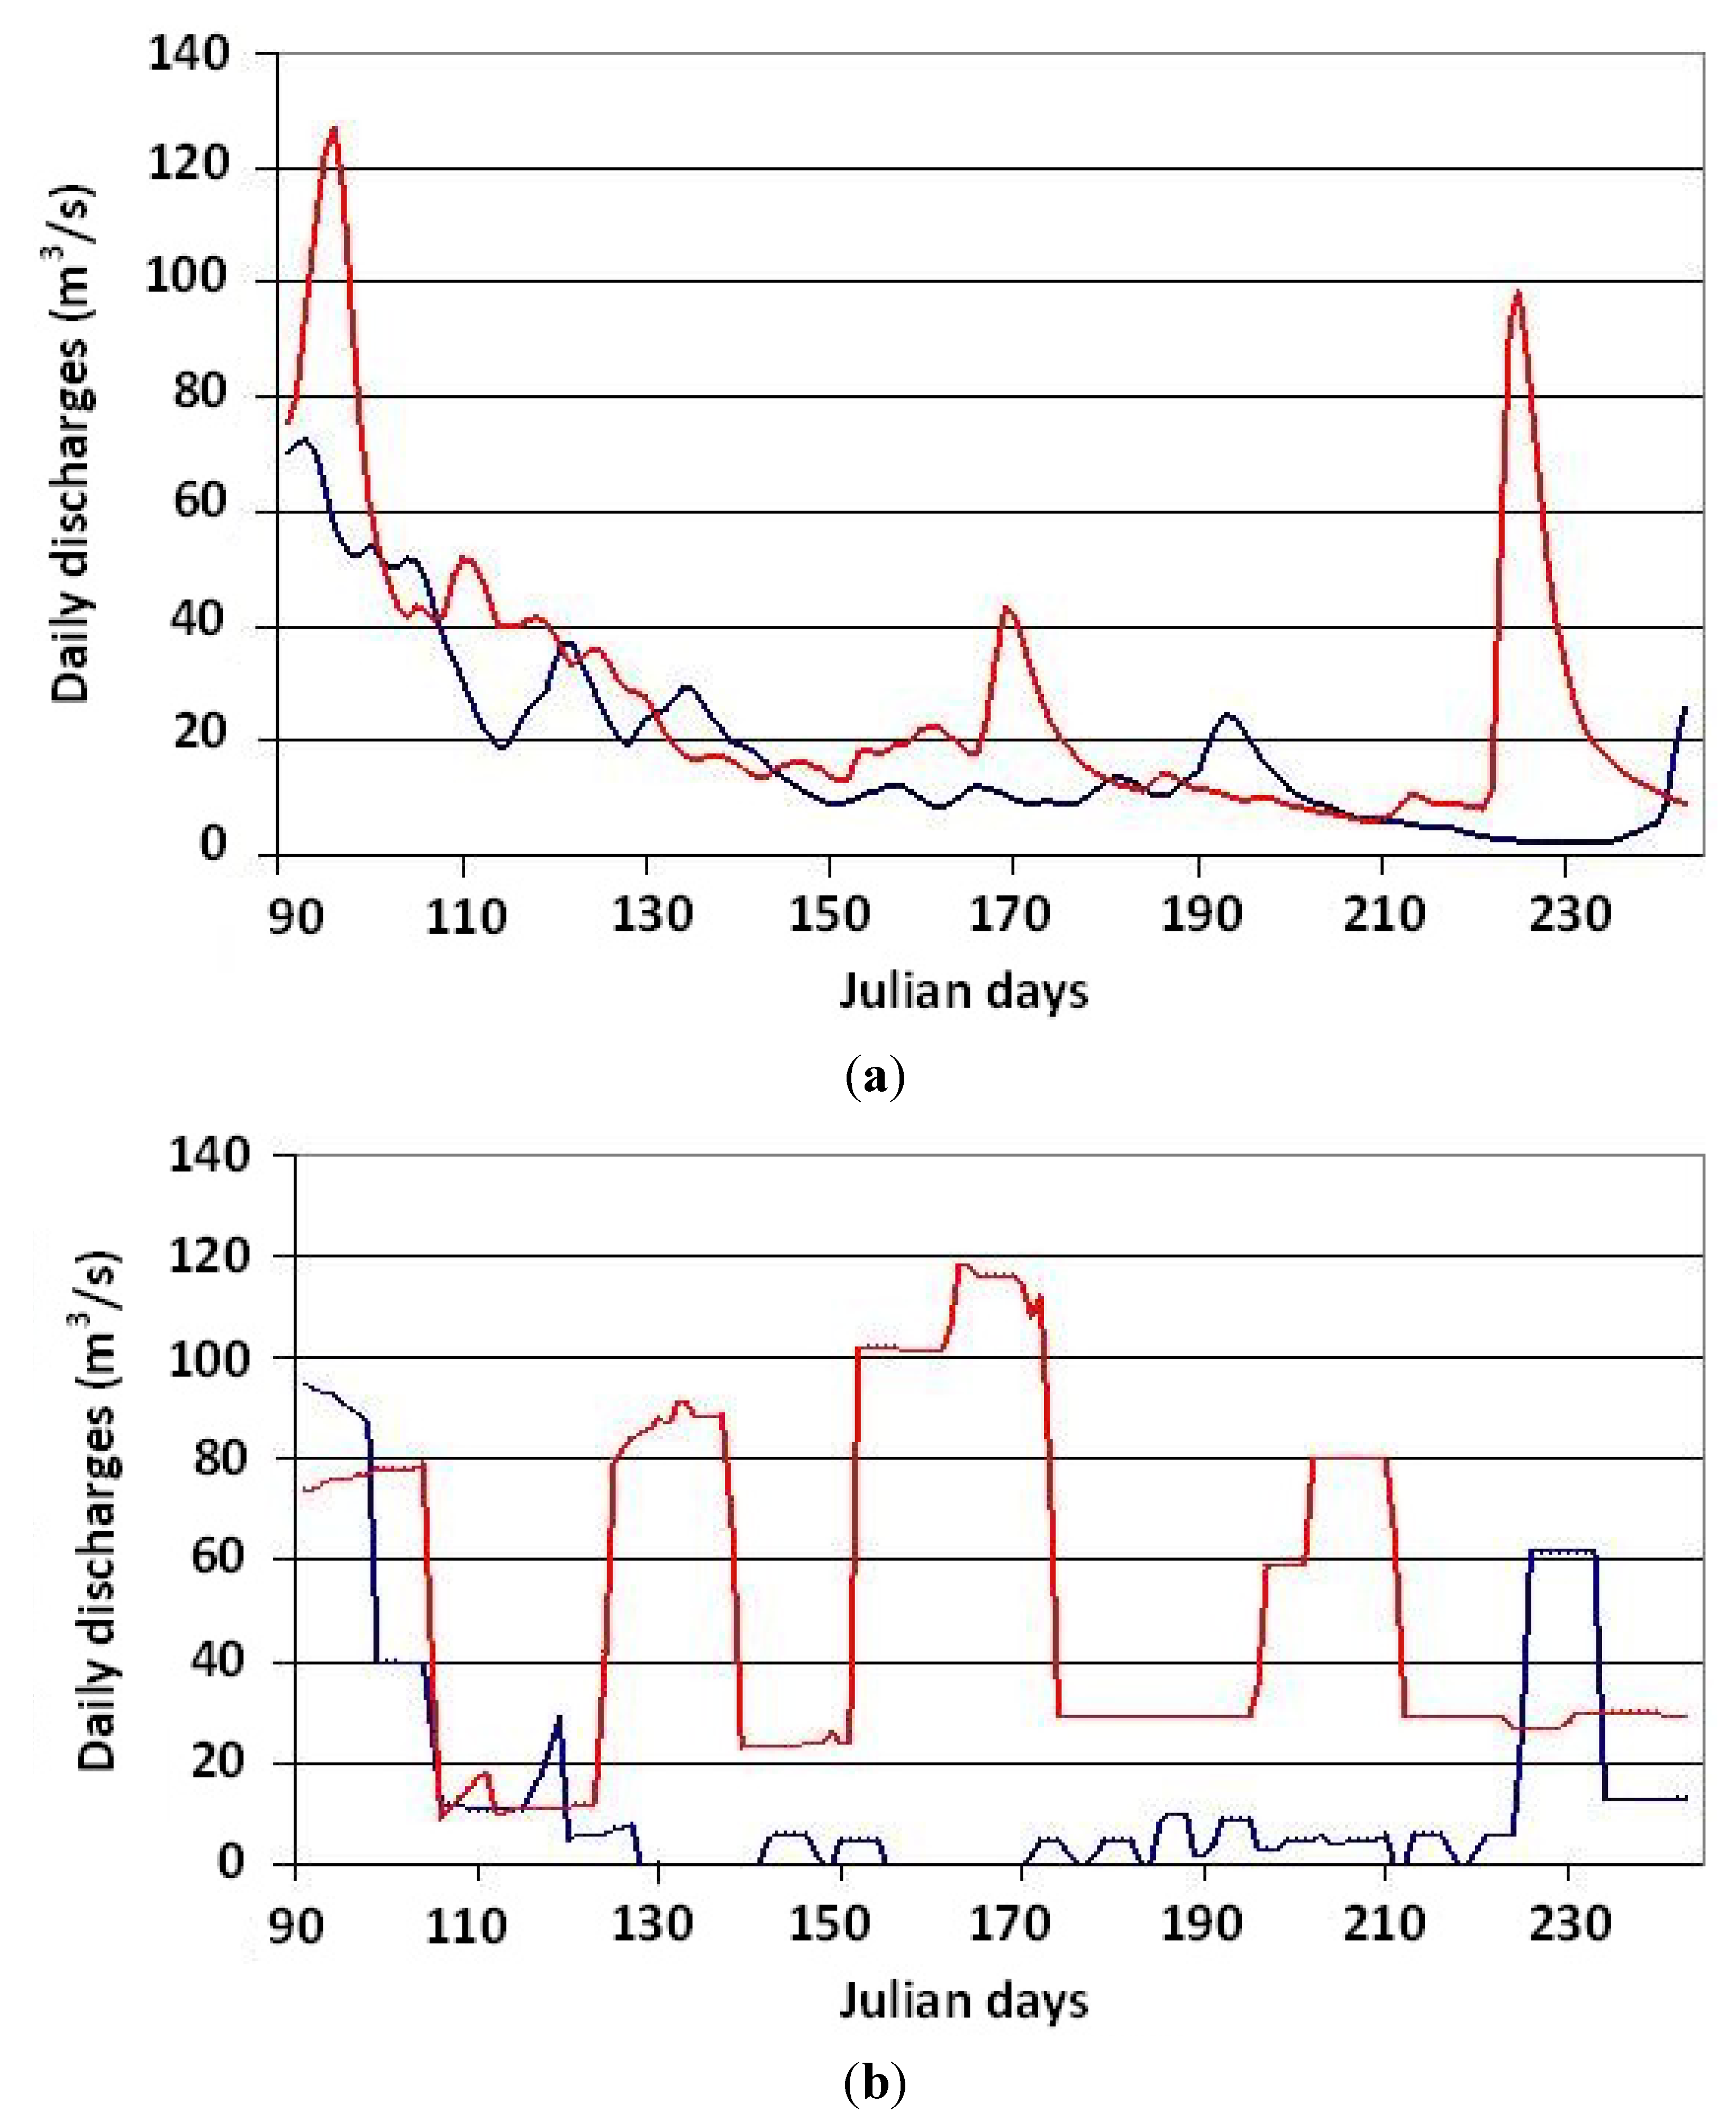
Table 1. These results reveal that there is no statistically significant difference between the two years. Thus, climate conditions for 2003 and 2004 are similar. As for streamflow (Figure 4), no significant difference was observed upstream from the dam between 2003 and 2004 at the monthly scale. At the daily scale, however, a significant difference is observed that is due to the fact that three floods occurred in 2004, while there were none in 2003 (Figure 4). In contrast, downstream from the dam, the difference in streamflow between the two years is large (Table 1). Over the growing season as a whole (except for a few days in August), flows are systematically lower in 2003 than in 2004. Indeed, mean daily and monthly flows during the growing season were roughly four times larger in 2004 than in 2003. The most important observation is the large number of days with very low daily flows (<1 L/s/km2) in 2003, including a total of 54 days during the growing season (Table 2). The longest sequence of no-flow days exceeds 15 days in June. As a result, the interannual variability of streamflow was higher downstream than upstream from the dam. This high variability, which is not observed in climate data and streamflow measurements upstream from the dam, is due to the mode of management of the dam, which consists in storing large amounts of water in the reservoir in the spring and summer for use in winter for hydroelectric power generation. There does not, however, seem to be any link between climate (temperature and precipitation) and the amount of water stored in the reservoir, as described below.
Table 1. Comparison of mean values of hydroclimatic variables measured in 2003 and 2004 using the paired t-test.
VariablesVariablesMean for 2003Mean for 2004p-value
Temperature (°C)Maximums10.5 (13.42)10.7 (12.18)0.800
Minimums−2.3 (13.72)−2.0 (12.70)0.690
Precipitations (mm)101.3 (50.80)90 (48.26)0.406
Monthly mean flows (m3/s) &Upstream from dam24.5 (14.28)35.4 (24.79)0.132
Downstream from dam14.5 (16.66)51.8 (21.08)0.068 *
Daily mean flows (m3/s) &Upstream from dam21.3 (19.91)33.9 (30.64)0.000
Downstream from dam14.4 (23.52)51.6 (33.30)0.000
Notes: ( ) = Standard deviation of the mean value; Statistically significant p-values are shown in bold; * = statistically significant value at the 10% level; & = measurements taken from April to August.
Figure 3. (a) Comparison of mean monthly temperatures measured at the Saint-Michel-des-Saints station in 2003 (blue curve) and 2004 (red curve); (b) Comparison of total monthly precipitation measured at the Saint-Michel-des-Saints station in 2003 (blue curve) and 2004 (red curve). SF = total snowfall in fall and winter.
Water 05 00875 g003
Table 2. Comparison of the total number of days for which daily specific flows during the growing season were nil or nearly so (<1 L/s/km2) downstream from the dam in 2003 and 2004.
YearAprilMayJuneJulyAugustTotal
20030172112454
2004000000
Figure 4. Comparison of daily flows in 2003 (blue curve) and 2004 (red curve) during the growing season, upstream (a); and downstream (b) from the Matawin dam.
Water 05 00875 g004

3.2. Comparison of Abiotic and Biotic Variables in 2003 and 2004

Results of grain-size distribution analysis for sediments from the six sand bars are presented in Table 3. No significant difference in grain-size distribution is observed between 2003 and 2004. Bars upstream and downstream from the dam are mainly comprised of sand. Moreover, no significant difference is observed in the chemistry of sediments sampled in 2003 and 2004 (Table 4). As for vegetation, a complete list of species collected on the six sites is presented in Table A1, Table A2. No significant change is observed from 2003 to 2004 on the three bars located upstream from the dam for ecological group species richness (Table 5). In contrast, downstream from the dam, two significant changes are observed and confirmed using the Chi-square test at the 5% significance level. The first change is a decrease in the total number of species per site. Thus, the average number of species per site fell by 23%, from 30 in 2003 to 23 in 2004. This decrease in the total number of species is due to a decrease in the number of terrestrial species (second change), the mean frequency per site for these species going from 25.4% in 2003 to 13% in 2004. Incidentally, a comparison of species frequency for the three ecological groups upstream and downstream from the dam reveals that obligate wetland species are more abundant than species in the other two groups and that the difference in the number of obligate wetland species and the number of species in the other two groups is higher upstream than downstream from the dam. Conversely, the proportion of terrestrial species becomes very small. Sand bars located at the edge of the low-flow channel are frequently and regularly submerged by flood waters, so that they are effectively wetlands. This likely accounts for the high frequency of obligate wetland species compared to species in the other two ecological groups, in particular terrestrial species. Sand bar submergence under flood waters is less frequent and regular downstream from the dam as a result of spring flood suppression and the storage of large amounts of water in the reservoir. This leads to the “terrestrialization” of bars located at the edge of the low-flow channel, which promotes their invasion by terrestrial plants which do not germinate effectively in sites characterized by prolonged, frequent and regular submergence (e.g., [38]). The loss of terrestrial species observed on the three bars downstream from the dam in 2004 is due to the fact that, unlike in 2003 when the lack of water releases meant that they were exposed for many days at a time, the bars remained submerged for long periods in 2004. It follows that man-made “artificial drought” affects terrestrial species more strongly than obligate wetland species in the low-flow channel downstream from the dam. In a study of species dynamics in the St. Lawrence River alluvial plain in Quebec, [22,23] observed that, in dry years (climate-induced drought), the number of aquatic species decreased while the number of exotic or aggressive terrestrial species increased.
Table 3. Grain-size distribution (%) in 2003 and 2004 in sites located upstream (UD) and downstream (DD) from the dam.
Grain-sizeUpstream from damDownstream from dam
2003200420032004
UD1UD2UD3UD1UD2UD3DD1DD2DD3DD1DD2DD3
Sand9898.697.697.998.497.698.098.698.097.998.498.1
Silt1.81.31.91.91.61.91.81.31.81.71.61.5
Clay0.20.10.50.10.00.50.20.10.20.600.4
Table 4. Nutrients concentration in three bars upstream and downstream from the dam in 2003 and 2004. TOC = total organic carbon (%); TN = total nitrogen (%); TP = total phosphorus (ppm).
NutrientsUpstream from damDownstream from dam
2003200420032004
UD1UD2UD3UD1UD2UD3DD1DD2DD3DD1DD2DD3
TOC1.230.120.061.460.120.040.490.740.570.440.620.55
TN0.090.020.100.0730.0120.100.020.020.020.020.020.02
TP64.99.911.963.49.611.929.336.336.730.33638.7
Table 5. Relative species abundance (%) by ecological group, upstream and downstream from the dam in 2003 and 2004. OBL = obligate wetland species; FAC = facultative wetland species; TS = terrestrial species.
Ecological groupUpstream from damDownstream from dam
2003200420032004
UD1UD2UD3UD1UD2UD3DD1DD2DD3DD1DD2DD3
OBL (%)6353.960.66353.960.640.638.737486047.7
FAC (%)25.933.327.325.933.327.334.432.340.8402433.3
TS (%)11.112.89.111.112.89.125.029.022.2121611.1
Total number273933273933323127252518
In contrast, these latter species disappeared when the alluvial plain was flooded while the number of aquatic plants increased. Similarly, in Australia, increases in the magnitude of flooding downstream from a dam led to the senescence of flood-intolerant species in the Murray River alluvial plain [38], an observation also confirmed by other authors (e.g., [39]). Very low water table variability in the low-flow channel relative to the alluvial plain could account for the maintenance of obligate wetland species abundance under drought conditions.
To constrain better the effect of the interannual variability of daily streamflow on the number of species downstream from the dam, we calculated the coefficients of correlation between abiotic and biotic variables and applied principal component analysis to the data shown in Table 5. Coefficients of correlation are shown in Table 6, which indicates that there is no significant difference in coefficient of correlation values between 2003 and 2004 due to the significant lack of variability in abiotic variables between the two years. However, for the two years, total nitrogen (TN) is positively correlated with the proportion of wetland obligate species (OBL) and, to a lesser extent, negatively correlated with the proportion of facultative species (FAC). It should also be pointed out that TN did not vary downstream from the dam from 2003 to 2004 (see Table 4), so that nitrogen cannot account for changes observed downstream from the dam in 2004.
Table 6. Coefficients of correlation calculated between abiotic and biotic variables for 2003–2004.
Abiotic variables2003 (n = 6)2004 (n = 6)2003 and 2004 (n = 12)
OBLFACTSOBLFACTSOBLFACTS
Sand−0.3430.2440.424−0.159−0.0480.846−0.3070.1230.461
Silt0.241−0.132−0.3190.680−0.349−0.5490.372−0.226−0.352
Clay0.470−0.406−0.538−0.4940.571−0.6270.0290.215−0.407
TOC0.001−0.1980.2070.358−0.3450.1020.129−0.2790.129
TN0.847−0.819−0.7630.668−0.493−0.6830.691 **−0.630 *−0.547
TP0.035−0.1810.1390.223−0.2800.0970.095−0.2300.097
Notes: ** = statistically significant value at the 5% level; * = statistically significant value at the 10% level; TOC = total organic carbon (%); TN = total nitrogen (%); TP = total phosphorus (ppm).
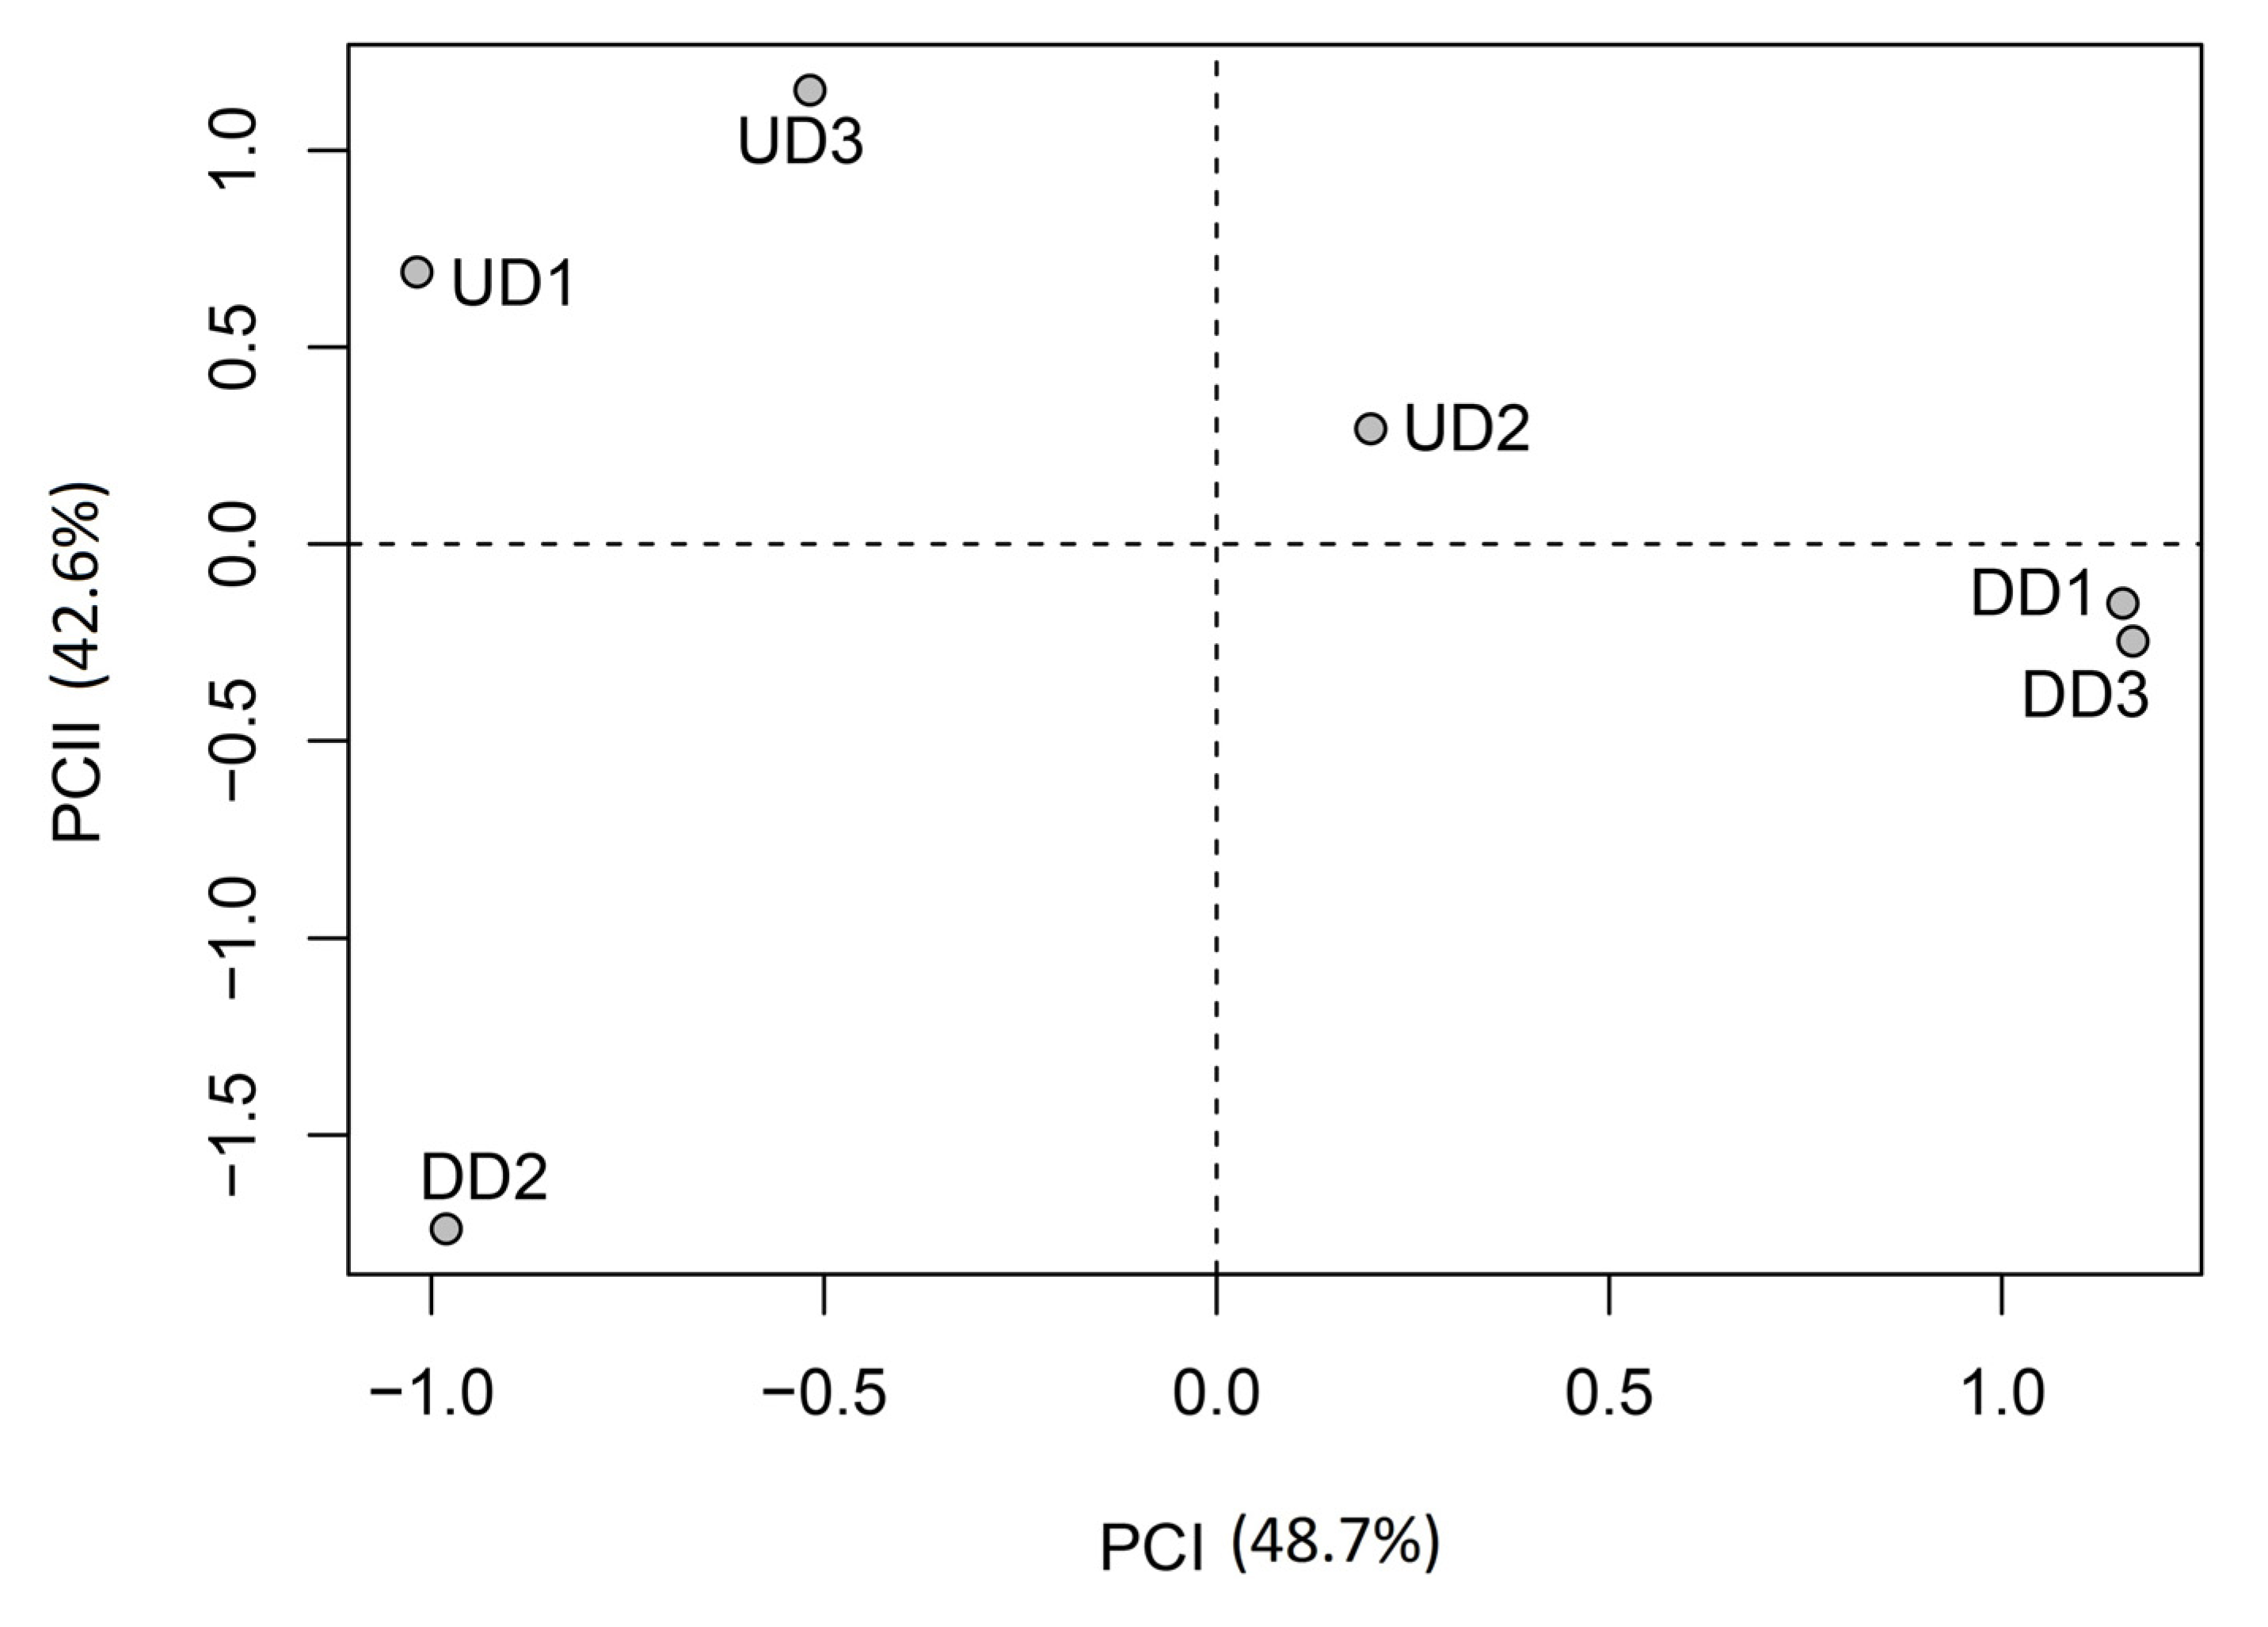
Results of principal component analysis are shown in Table 7 and Figure 5. Applying the Kayser criterion, only the first two components are found to be statistically significant, their eigenvalues being >1. Their cumulative total explained variance reaches 90%. Table 7 shows that analysis of loading values does not distinguish between the two years based on the variations in the proportions of species in each of the three ecological groups. Indeed, the two principal components are strongly correlated (loading values >0.800) to the proportions of species in two of the three ecological groups in 2003 and 2004. Thus, for instance, the first principal component is strongly correlated with proportions of OBL and FACW group species in 2004, and with the proportion of FACW group species in 2003 (Table 6). In contrast, principal component analysis highlighted variations between sites (Figure 5). Thus, sites with high proportions (>60%) of obligate wetland species during at least one year have negative scores on the first principal component while the other sites have positive scores. None of the abiotic factors analyzed seems to account for this grouping, that is, the difference in the number of species in each ecological group observed between sites. It should be noted that this difference may be explained by many other abiotic factors which were not analyzed and cannot all be listed, for one thing, and/or by various ecological processes (i.e., grazers, seed bank, etc.), for another. The second principal component, for its part, distinguishes between sites according to their location with respect to the dam. The three sites located upstream from the dam have positive scores on this component while the sites located downstream from the dam have negative scores. Thus, this component reflects the variation in species proportions observed between 2003 and 2004. As previously mentioned, sites located upstream from the dam show no change in species composition between 2003 and 2004, while in sites located downstream, the number of terrestrial species decreased in 2004. This diminution is thought to result from the high variability of streamflow observed between 2003 and 2004 downstream from the dam which, as previously noted, is due to the occurrence of episodes of nil or quasi nil flow (<1 L/s/km²) during the growing season. Thus, despite a significant increase in daily flows in 2004, no change in the number of species is observed in the three sites located upstream from the dam. Furthermore, from a hydroclimatic standpoint, 2002 was similar to 2004. Consequently, the absence of some species observed in 2003 downstream from dam can only be the result of the drought observed that year. Based on these observations, we conclude that the first principal component reflects the effect of variations in species proportions, particularly those of obligate wetland species, according to location (spatial effect), while the second component reflects the effect of the interannual variability of streamflow downstream from the dam on species proportions (temporal effect).
Table 7. Loading of species proportions in the three ecological groups on the first two significant principal components for 2003 and 2004. Results obtained after Varimax axis rotation.
Principal
component
20032004EV (%)
OBLFACTSOBLFACTS
PC I−0.5660.8080.310−0.9830.918−0.20848.7
PC II0.802−0.460−0.9140.1750.104−0.90642.6
Figure 5. Location of sites upstream (UD) and downstream (DD) from the dam in the space defined by the first two significant components.
Water 05 00875 g005
Many models have been proposed to account for the relationship between water levels and riparian and alluvial plain vegetation. Most of these models, however, were developed for lentic settings (e.g., [3,23,40,41,42]). In Quebec, for instance, [23] developed a model for the St. Lawrence River. For reasons already mentioned, the fact that this model was developed for a lentic fluvial setting with low interannual variability of water levels means that it is not applicable to the present case. Although a few models have been proposed for natural and regulated rivers (e.g., [9,23,40,41,42]), their generalization remains limited due to the complexity of factors which affect species abundance at any given site. In addition, our study aimed at measuring the extent of the presence of terrestrial plants in the low-flow channel downstream from the dam as it relates to flow inversion and man-made drought. In this perspective, the study did not consider some aspects such as the role of seed bank and the analysis of the frequency of drawdown. The effect of this factor has already been demonstrated by many authors (e.g., [3,4,8,38]). It is reasonable to expect that this factor could in part account for the variation in the number of species observed downstream from the dam between 2003 and 2004 on the one hand, and for the variation in the number of species observed between sites, on the other hand. Finally, models and theories developed for rivers are more applicable to riparian vegetation than to low-flow channel vegetation in a given river.

4. Conclusions

Although temperature and precipitation do not vary markedly between the 2003 and 2004 growing seasons, the variability of streamflow downstream from the Matawin dam is relatively high during these two years. This variability is reflected in the persistence of consecutive days without water release (no flow) downstream from the dam. While such flow interruptions have no effect on grain-size distribution and nutrients in the three sand bars analyzed, a marked decrease in the number of plant species was observed at all three sites which is linked to the loss of several terrestrial species. This species loss is interpreted to result from more prolonged submergence of the sites in 2004 than in 2003. From a management standpoint, frequent and regular water releases during the growing season are advisable to prevent invasion of the low-flow channel by terrestrial species downstream from the dam and the terrestrialization of many morphological sites in the low-flow channel of the river.

Conflict of Interest

The authors declare no conflict of interest.

Appendix

Table A1. List of species found upstream from the Matawin dam.
Species name20032004
UD1UD2UD3UD1UD2UD3
Acer rubrumb × ×
Agrostis stoloniferab ×× ××
Aulnus rigosac×× ××
Calamagrostis canadensisb × ×
Carex aquatilisa××××××
Carex crinitab××××××
Carex vesicariac××××××
Dulichium arundinaceuma× ×
Eleocharis acicularisa××××××
Eleocharis palustrisa××××××
Equisetum fluviatilea××××××
Equisetum palustreb××××××
Eupatorium maculatumc×× ××
Galium trifidumb ×× ××
Gentiana linearisa × ×
Glyceria borealisa××××××
Glyceria canadensisa × ×
Glyceria fernaldiic× ×
Hypericum borealea ×× ××
Hypericum ellipticuma××××××
Hypericum virginicum××××××
Iris versicolora×× ××
Juncus brevicaudatusa× × ××
Juncus effususb × ×
Juncus filiformisb××××××
Juncus teniusc × ×
Leersia oryzoïdesa × ×
Lysimachia terrestrisa××××××
Mimulus ringensa × ×
Myrica galea××××××
Onoclea sensibilisb × ×
Potamogeton epihydrusa××××××
Potamogeton pectinatusa× ×
Potamogeton spirillusa×× ××
Ranunculus reptansb ×× ××
Sagittaria latifoliaa××××××
Sagittaria rigidaa ×× ××
Salix discolorb××××××
Salix lucidab××××××
Salix rigidab ×× ××
Scirpus atrocinctusb××××××
Scirpus cyperinusa × ×
Sium suavea× ×
Sparganium angustifoliuma×× ××
Sparganium chlorocarpuma ×× ××
Sparganium fluctuansa × ×
Spiraea latifoliac × ×
Thalictrum pubescensb × ×
Viola pallensc ×× ××
Notes: a = obligate wetland species; b = facultative wetland species; c = terrestrial species.
Table A2. List of species found downstream from the Matawin dam.
Species name20032004
DD1DD2DD3DD1DD2DD3
Achillea millefoliumc ×
Acer rubrumb
Agrostis Albac ×
Agrostis scabra × ×
Agrostis stoloniferab
Anaphalis margaritaceac × ×
Anemone canadenseb××× ××
Aster Puniceus (syn. A. atrorubens)b× ×× ×
Aulnus rigosa
Calamagrostis canadensisb ×××××
Carex aquatilisa×
Carex crinitab××××××
Carex rostrata utriculataa ×
Carex scopariab ×
Carex vesicariac × ×
Carex vesicariaa × ×
Chelone glabraa ×
Dulichium arundinacuma
Eleocharis acicularisa
Eleocharis palustrisa
Epilobium leptophylluma ×
Equisetum fluviatilec× ×
Equisetum palustreb
Erigeron strigosusc×
Eupatorium maculatumc × ××
Fragaria americanac××
Galium asprelluma ×
Galium trifidumb
Gallium palustrea× × ×
Gentiana linearisa
Glyceria borealisa× ×
Glyceria canadensisa × ×××
Glyceria fernaldiic
Hypericum borealea × ×
Hypericum canadenseb ×××××
Hypericum ellipticuma
Hypericum virginicumc××××××
Impatiens capensis ×
Iris versicolora××××××
Juncus brevicaudatusa
Juncus effususb × ×
Juncus filiformisb××××××
Juncus teniusc ×
Leersia oryzoïdesa
Linnea borealisc ×
Lycopus americanusa× ××××
Lycopus uniflorusa× ×××
Lysimachia terrestrisa ×××××
Lythrum salicariab×
Mentha canadensisa××××××
Mimulus ringensa × ××
Myrica galea ×
Onoclea sensibilisb ×
Oxalis strictac×× ×
Plantago major×
Poa palustrisb×× ×
Polygonum hydropipera× ××
Potamogeton epihydrusa
Potamogeton pectinatusa
Potamogeton spirillusa
Potentilla palustrisa × ×
Prunus pensylvanica × ×
Ranunculus reptansb ×××
Rumex britanicac ×
Sagittaria latifoliaa ×
Sagittaria rigidaa
Salix discolorb
Salix lucidab × ×
Salix rigidab
Scirpus atrocinctusb×××× ×
Scirpus atrovirensa×
Scirpus cyperinusa×× ××
Scirpus rubrocinctus××
Scirpus sp. c ×
Scutellaria epilobiifoliac×
Scutellaria laterifoliuma ×
Sium suavea××××
Solidago canadensec×
Solidago gramilifoliac×× × ×
Sparganium angustifoliuma
Sparganium chlorocarpuma
Sparganium fluctuansa
Spiraea latifolia× ×
Thalictrum pubescensb×
Thuja occidentalisb × ×
Veronica scutellataa× ×× ×
Viola pallensc×××× ×
Notes: a = obligate wetland species; b = facultative wetland species; c = terrestrial species.

References

  1. Ritcher, B.D.; Baumgartner, J.V.; Braun, D.P.; Powell, J. A spatial assessment of hydrologic alteration within a river network. Regul. Rivers Res. Manag. 1998, 14, 329–340. [Google Scholar] [CrossRef]
  2. Beche, L.A.; McElravy, E.P.; Resh, V.H. Long-term seasonal variation in the biological traits of benthic-macroinvertebrates in two Mediterranean-climate streams in California, USA. Freshw. Biol. 2006, 51, 56–75. [Google Scholar] [CrossRef]
  3. Keddy, P.A.; Reznicek, A. Great Lakes vegetation dynamics: The role of fluctuating water levels and buried seeds. J. Great Lakes Res. 1986, 12, 25–36. [Google Scholar] [CrossRef]
  4. Farney, R.A.; Bookhout, T.A. Vegetation changes in a Lake Erie marsh (Winous Point, Ottawa County, Ohio) during high water years. Ohio J. Sci. 1982, 82, 103–106. [Google Scholar]
  5. Wilcox, D.A. Implications of hydrologic variability on the succession of plants in Great Lakes wetlands. Aquat. Ecosyst. Health Manag. 2004, 7, 223–231. [Google Scholar] [CrossRef]
  6. Wilcox, D.A.; Nichols, S.J. The effects of water-level fluctuations on vegetation in a Lake Huron wetland. Wetlands 2008, 28, 487–501. [Google Scholar] [CrossRef]
  7. Riis, T.; Hawes, I. Relationships between water level fluctuations and vegetation diversity in shallow water of New Zealand lakes. Aquat. Bot. 2002, 74, 133–148. [Google Scholar] [CrossRef]
  8. Bornette, G.; Amoros, C.; Piegay, H.; Tachet, J.; Hein, T. Ecological complexity of wetlands within a river landscape. Biol. Conserv. 1998, 85, 35–45. [Google Scholar] [CrossRef]
  9. Naiman, R.J.; Décamps, H.; McClain, M.E. Riparia: Ecology, Conservation, and Management of Streamside Communities; Elsevier: San Diego, CA, USA, 2005. [Google Scholar]
  10. Nilsson, C.; Grelsson, G.; Johansson, M.; Sperens, U. Patterns of plant species richness along riverbanks. Ecology 1989, 70, 77–84. [Google Scholar] [CrossRef]
  11. Cushman, R.M. Review of ecological effects of rapidly varying flows downstream from hydroelectric facilities. N. Am. J. Fish. Manag. 1985, 5, 330–339. [Google Scholar] [CrossRef]
  12. Petts, G.E. Impounded Rivers. Perspective for Ecological Management; Wiley: New York, NY, USA, 1984. [Google Scholar]
  13. Poff, N.L.; Allan, J.D.; Bain, M.B.; Karr, J.R.; Prestegaard, K.L.; Richter, B.D.; Sparks, R.E.; Stromberg, J.C. The natural flow regime. A paradigm for river conservation and restoration. BioScience 1997, 47, 769–784. [Google Scholar] [CrossRef]
  14. Nilsson, C.; Svedmark, M. Basic principles and ecological consequences of changing water regimes: Riparian plant. Environ. Manag. 2002, 30, 468–480. [Google Scholar] [CrossRef]
  15. Poff, N.L.; Julie, K.; Zimmerman, K.H. Ecological responses to altered flow regimes: A literature review to inform the science and management of environmental flows. Freshw. Biol. 2010, 55, 194–205. [Google Scholar] [CrossRef]
  16. Moyle, P.B.; Mount, J.F. Homogenous rivers, homogenous faunas. Proc. Natl. Acad. Sci. USA 2007, 104, 5711–5712. [Google Scholar] [CrossRef]
  17. Assani, A.A.; Stichelbout, E.; Roy, A.G.; Petit, F. Comparison of impacts of dams on the annual maximum flow characteristics in three regulated hydrological regimes in Québec (Canada). Hydrol. Process. 2006, 20, 3485–3501. [Google Scholar] [CrossRef]
  18. Lajoie, F.; Assani, A.A.; Roy, A.G.; Mesfioui, M. Impacts of dams on monthly flow characteristics. The influence of watershed size and seasons. J. Hydrol. 2007, 334, 423–439. [Google Scholar] [CrossRef]
  19. Matteau, M.; Assani, A.A.; Mesfioui, M. Application of multivariate statistical analysis methods to the dam hydrologic impact studies. J. Hydrol. 2009, 371, 120–128. [Google Scholar] [CrossRef]
  20. Assani, A.A.; Buffin-Bélanger, T.; Roy, A.G. Analyse des impacts d’un barrage sur le régime hydrologique de la rivière Matawin (Québec, Canada) [in French]. Rev. Sci. Eau 2002, 15, 557–574. [Google Scholar]
  21. Farrell, J.M.; Murry, B.A.; Leopold, D.J.; Halpern, A.; Rippke, M.; Godwin, K.S.; Hafner, S.D. Water-level regulation and coastal wetland vegetation in the upper St. Lawrence River: Inferences from historical aerial imagery, seed banks, and Typha dynamics. Hydrobiologia 2010, 647, 127–144. [Google Scholar] [CrossRef]
  22. Hudon, C. Impact of water level fluctuations on St. Lawrence River aquatic vegetation. Can. J. Fish. Aquat. Sci. 1997, 54, 2853–2865. [Google Scholar] [CrossRef]
  23. Hudon, C. Shift in wetland plant composition and biomass following low-level episodes in the St. Lawrence River: Looking into the future. Can. J. Fish. Aquat. Sci. 2004, 61, 603–617. [Google Scholar] [CrossRef]
  24. Hudon, C.; Gagnon, P.; Amyot, J.-P.; Létourneau, G.; Jean, M.; Plante, C.; Rioux, D.; Deschênes, M. Historical changes in herbaceous wetland distribution induced by hydrological conditions in Lake Saint-Pierre (St. Lawrence River, Quebec, Canada). Hydrobiologia 2005, 539, 205–224. [Google Scholar] [CrossRef]
  25. Jean, M.; Bouchard, A. Temporal changes in wetland landscapes of a section of the St. Lawrence River, Canada. Environ. Manag. 1991, 15, 241–250. [Google Scholar] [CrossRef]
  26. Jean, M.; Bouchard, A. Riverine wetland vegetation: Importance of small-scale and large-scale environmental variation. J. Veget. Sci. 1993, 4, 609–620. [Google Scholar] [CrossRef]
  27. Morin, J.; Leclerc, M. From pristine to present state: Hydrology evolution of Lake Saint-François, St. Lawrence River. Can. J. Civ. Eng. 1998, 25, 864–879. [Google Scholar] [CrossRef]
  28. Assani, A.A.; Gravel, E.; Buffin-Bélanger, T.; Roy, A.G. Impacts des barrages sur les débits annuels minimums en fonction des régimes hydrologiques artificialisés au Québec (Canada) [in French]. Rev. Sci. Eau 2005, 18, 103–127. [Google Scholar]
  29. Ouarda, T.B.M.J.; Rasmussen, P.F.; Cantin, J.-F.; Bobée, B.; Laurence, R.; Hoang, V.D.; Barabé, G. Identification d’un réseau hydrométrique pour le suivi des modifications climatiques dans la province de Québec [in French]. Rev. Sci. Eau 1999, 12, 425–448. [Google Scholar]
  30. Environment Canada Web Page. Données Hydrométriques. Available online: http://www.wsc.ec.gc.ca/applications/H2O/index-fra.cfm (accessed on 23 March 2010).
  31. Hogue, C.; Bolduc, A.; Larouche, D. Québec, un Siècle d’Électricité; Libre Expression: Montréal, Canada, 1979. [Google Scholar]
  32. Environment Canada Web Page. Archives Nationales d’Information et de Données Climatologiques. Available online: http://climat.meteo.gc.ca/advanceSearch/searchHistoricData_f.html (accessed on 23 March 2010).
  33. Assani, A.A.; Petit, F.; Leclercq, L. The relationship between geomorphological features and species richness in the low flow channel of the Warche, downstream from the Bütgenbach dam (Ardennes, Belgium). Aquat. Bot. 2006, 85, 112–120. [Google Scholar] [CrossRef]
  34. Bray, R.L.; Kurtz, L.T. Determination of total organic and available forms of phosphorous in soils. Soil Sci. 1945, 59, 39–45. [Google Scholar] [CrossRef]
  35. Yeomans, J.C.; Bremer, J.M. A rapid and precise method for routine determination of organic carbon in soil. Soil Sci. Plant Nutr. 1988, 19, 1467–1476. [Google Scholar] [CrossRef]
  36. Marie-Victorin, F.R.; Brouillet, L.; Hay, S.G.; Goulet, I.; Blondeau, M.; Cayoute, J.; Labrecque, J. Flore Laurentienne, 3rd ed; Gaëtan Morin: Montréal, Canada, 1995. [Google Scholar]
  37. Gauthier, B. Notes Explicatives sur la Ligne Naturelle des Hautes Eaux; Ministère de l’Environnement et de la Faune du Québec, Direction de la conservation et du patrimoine écologique: Québec, Canada, 1997. [Google Scholar]
  38. Siebentritt, M.A.; Ganf, G.G.; Walker, K.F. Effects of an enhanced flood on riparian plants of the River Murray, South Australia. River Res. Appl. 2004, 20, 765–774. [Google Scholar] [CrossRef]
  39. Nilsson, C.; Keddy, P.A. Predictability of change in shoreline vegetation in a hydroelectric reservoir, Northern Sweden. Can. J. Fish. Aquat. Sci. 1988, 45, 1896–1904. [Google Scholar] [CrossRef]
  40. Hill, N.M.; Keddy, P.A.; Wisheu, I.C. A hydrological model for predicting the effects of dams on the shoreline vegetation of lakes and reservoirs. Environ. Manag. 1998, 22, 723–736. [Google Scholar] [CrossRef]
  41. Van der Valk, A.G. Succession in wetlands: A Gleasonian approach. Ecology 1981, 62, 688–696. [Google Scholar] [CrossRef]
  42. Ye, F.; Chen, Q.; Li, R. Modelling the riparian vegetation evolution due to flow regulation of Lijiang River by unstructured cellurar automata. Ecol. Inform. 2010, 108–114. [Google Scholar]

