Article

Effects of Ocean Acidification and Warming on Sperm Activity and Early Life Stages of the Mediterranean Mussel (Mytilus galloprovincialis)

1
Faculty for Biosciences, Fisheries, and Economics, UiT The Arctic University of Norway,Tromsø 9037, Norway
2
Norwegian Polar Institute, Fram Centre, Tromsø 9296, Norway
3
Akvaplan-niva AS, Fram Centre, Tromsø 9296, Norway
4
Department of Global Change Research, Mediterranean Institute for Advanced Studies (IMEDEA, UIB-CSIC), Esporles 07190, Spain
5
University Centre on Svalbard (UNIS), Longyearbyen 9171, Norway
6
The UWA Oceans Institute and School of Plant Biology, University of Western Australia, 35 Stirling Highway, Crawley 6009, Australia
7
Department of Biological and Environmental Sciences – Tjärnö, University of Gothenburg, Strömstad 452 96, Sweden
*
Author to whom correspondence should be addressed.
Water 2013, 5(4), 1890-1915; https://doi.org/10.3390/w5041890
Submission received: 5 September 2013 / Revised: 7 November 2013 / Accepted: 13 November 2013 / Published: 19 November 2013

Abstract

:
Larval stages are among those most vulnerable to ocean acidification (OA). Projected atmospheric CO2 levels for the end of this century may lead to negative impacts on communities dominated by calcifying taxa with planktonic life stages. We exposed Mediterranean mussel (Mytilus galloprovincialis) sperm and early life stages to pHT levels of 8.0 (current pH) and 7.6 (2100 level) by manipulating pCO2 level (380 and 1000 ppm). Sperm activity was examined at ambient temperatures (16–17 °C) using individual males as replicates. We also assessed the effects of temperature (ambient and ≈20 °C) and pH on larval size, survival, respiration and calcification of late trochophore/early D-veliger stages using a cross-factorial design. Increased pCO2 had a negative effect on the percentage of motile sperm (mean response ratio R ¯ = 71%) and sperm swimming speed ( R ¯ = 74%), possibly indicating reduced fertilization capacity of sperm in low concentrations. Increased temperature had a more prominent effect on larval stages than pCO2, reducing performance ( R ¯ Size = 90% and R ¯ Survival = 70%) and increasing energy demand ( R ¯ Respiration = 429%). We observed no significant interactions between pCO2 and temperature. Our results suggest that increasing temperature might have a larger impact on very early larval stages of M. galloprovincialis than OA at levels predicted for the end of the century.

Graphical Abstract

1. Introduction

Ocean acidification (OA) results from the uptake of carbon dioxide in seawater due to anthropogenic emissions [1]. Together with global warming, it is predicted to cause significant changes in the marine environment over the coming century [2,3]. Such changes are already occurring: the average ocean surface pH has dropped by 0.1 units since the beginning of the industrial revolution [1], and the global average surface temperature has increased by 0.7 °C during the last century [4]. Atmospheric CO2 concentration is predicted to reach 540–1020 ppm by the end of this century, which will reduce the open ocean surface water pH by an additional 0.12–0.36 units depending on the latitude and ocean dynamics [5,6].
Increased pCO2 affects a range of ocean chemistry parameters, including pH, dissolved organic carbon (DIC), and calcium carbonate (CaCO3) saturation state [6]. Although it is still uncertain how these changes will impact the biological systems, their effects will likely vary among both taxa and life stages [7]. Larval stages, especially in calcifying species, are thought to represent the life-cycle bottleneck most vulnerable to OA [7,8,9,10,11]. They may be more sensitive to perturbations due to low energy storage levels, potential disruptions in development of vital structures, and possible delays in metamorphosis, which may increase vulnerability to predators or affect transport mechanisms, removing them from suitable habitats [12]. Moreover, many species already live close to their thermal tolerances [13,14], and increases in temperature can therefore further exacerbate the negative effects of climate change [15]. Thus, synergistic effects of increased temperature and acidification on calcifying larval-stages may have significant consequences for marine populations and community structure [12,16].
Marine taxa exhibit variable responses to OA. In general, non-calcifying autotrophs might benefit from higher CO2 availability, while calcifying organisms, apart from crustaceans, are negatively impacted, with bivalves and echinoderms being among the most vulnerable groups [7,8,10,11]. However, ocean pCO2 itself varies considerably with space, depth and time [17]. While open ocean pH is relatively stable at a given location, near shore habitats experience large diel, tidal, seasonal and stochastic variability [18], which can be larger than the predicted decrease in open ocean pH during this century [19]. Therefore, shallow-water benthic calcifying organisms might be expected to be adapted to a variable pH regime, and perhaps are not the most vulnerable taxa to OA [20].
Mytilus is a widespread genus of intertidal and shallow-water mussels consisting of several species worldwide [21,22]. The Mediterranean mussel (Mytilus galloprovincialis) is an important commercial species and is native to the Mediterranean with a range northwards along the Atlantic Coast of West Europe [23]. Due to its commercial importance and dispersal by shipping in ballast water, the mussel can be found in many regions worldwide (see a list of distribution records at [24]). Adult Mytilus shells consist of both calcite and aragonite, which are CaCO3 minerals [25], whereas larval shells consist mostly of aragonite [26]. The outermost CaCO3 shell layer of adult Mytilus consists of calcite, which is covered by an organic periostracum [25]. This organic layer may protect the CaCO3 layers from dissolution, and calcite is less soluble than aragonite in low pH seawater [27]. This may, therefore, result in adult and juvenile Mytilus being relatively robust to near future OA [20,28,29,30,31].
Effects of OA on Mytilus seem to be most often identified in the first aragonitic calcification stages. Embryogenesis of Mytilus appears to be unaffected by elevated pCO2 until the trochophore stage, after which growth, shell-strength, and normal development of calcified larvae become negatively affected [32,33,34]. To our knowledge, effects of OA on fertilization and sperm quality of Mytilus have not been reported, but effects can vary considerably among taxa and even between male-female pair within a population [35,36,37,38,39]. However, no study has followed OA effects on Mytilus from sperm activity to the early D-veliger stage, covering sperm kinetics, larval growth, and vital rates. This information is critical to evaluate hypotheses of high susceptibility of early life-stages, and to assess OA impacts on this key habitat-forming taxa with high commercial value. The aim of this study was to evaluate the effect of ocean acidification and warming on sperm activity, development, calcification and metabolism of early life-stages of M. galloprovincialis using a cross-factorial design and a high-end IPCC scenario predicted to occur by 2100 (SRES A2 [5]). In addition, we aimed to increase understanding in responses of early life-history stages of Mytilus genus to the climate change by comparing our results to the literature using meta-analysis.

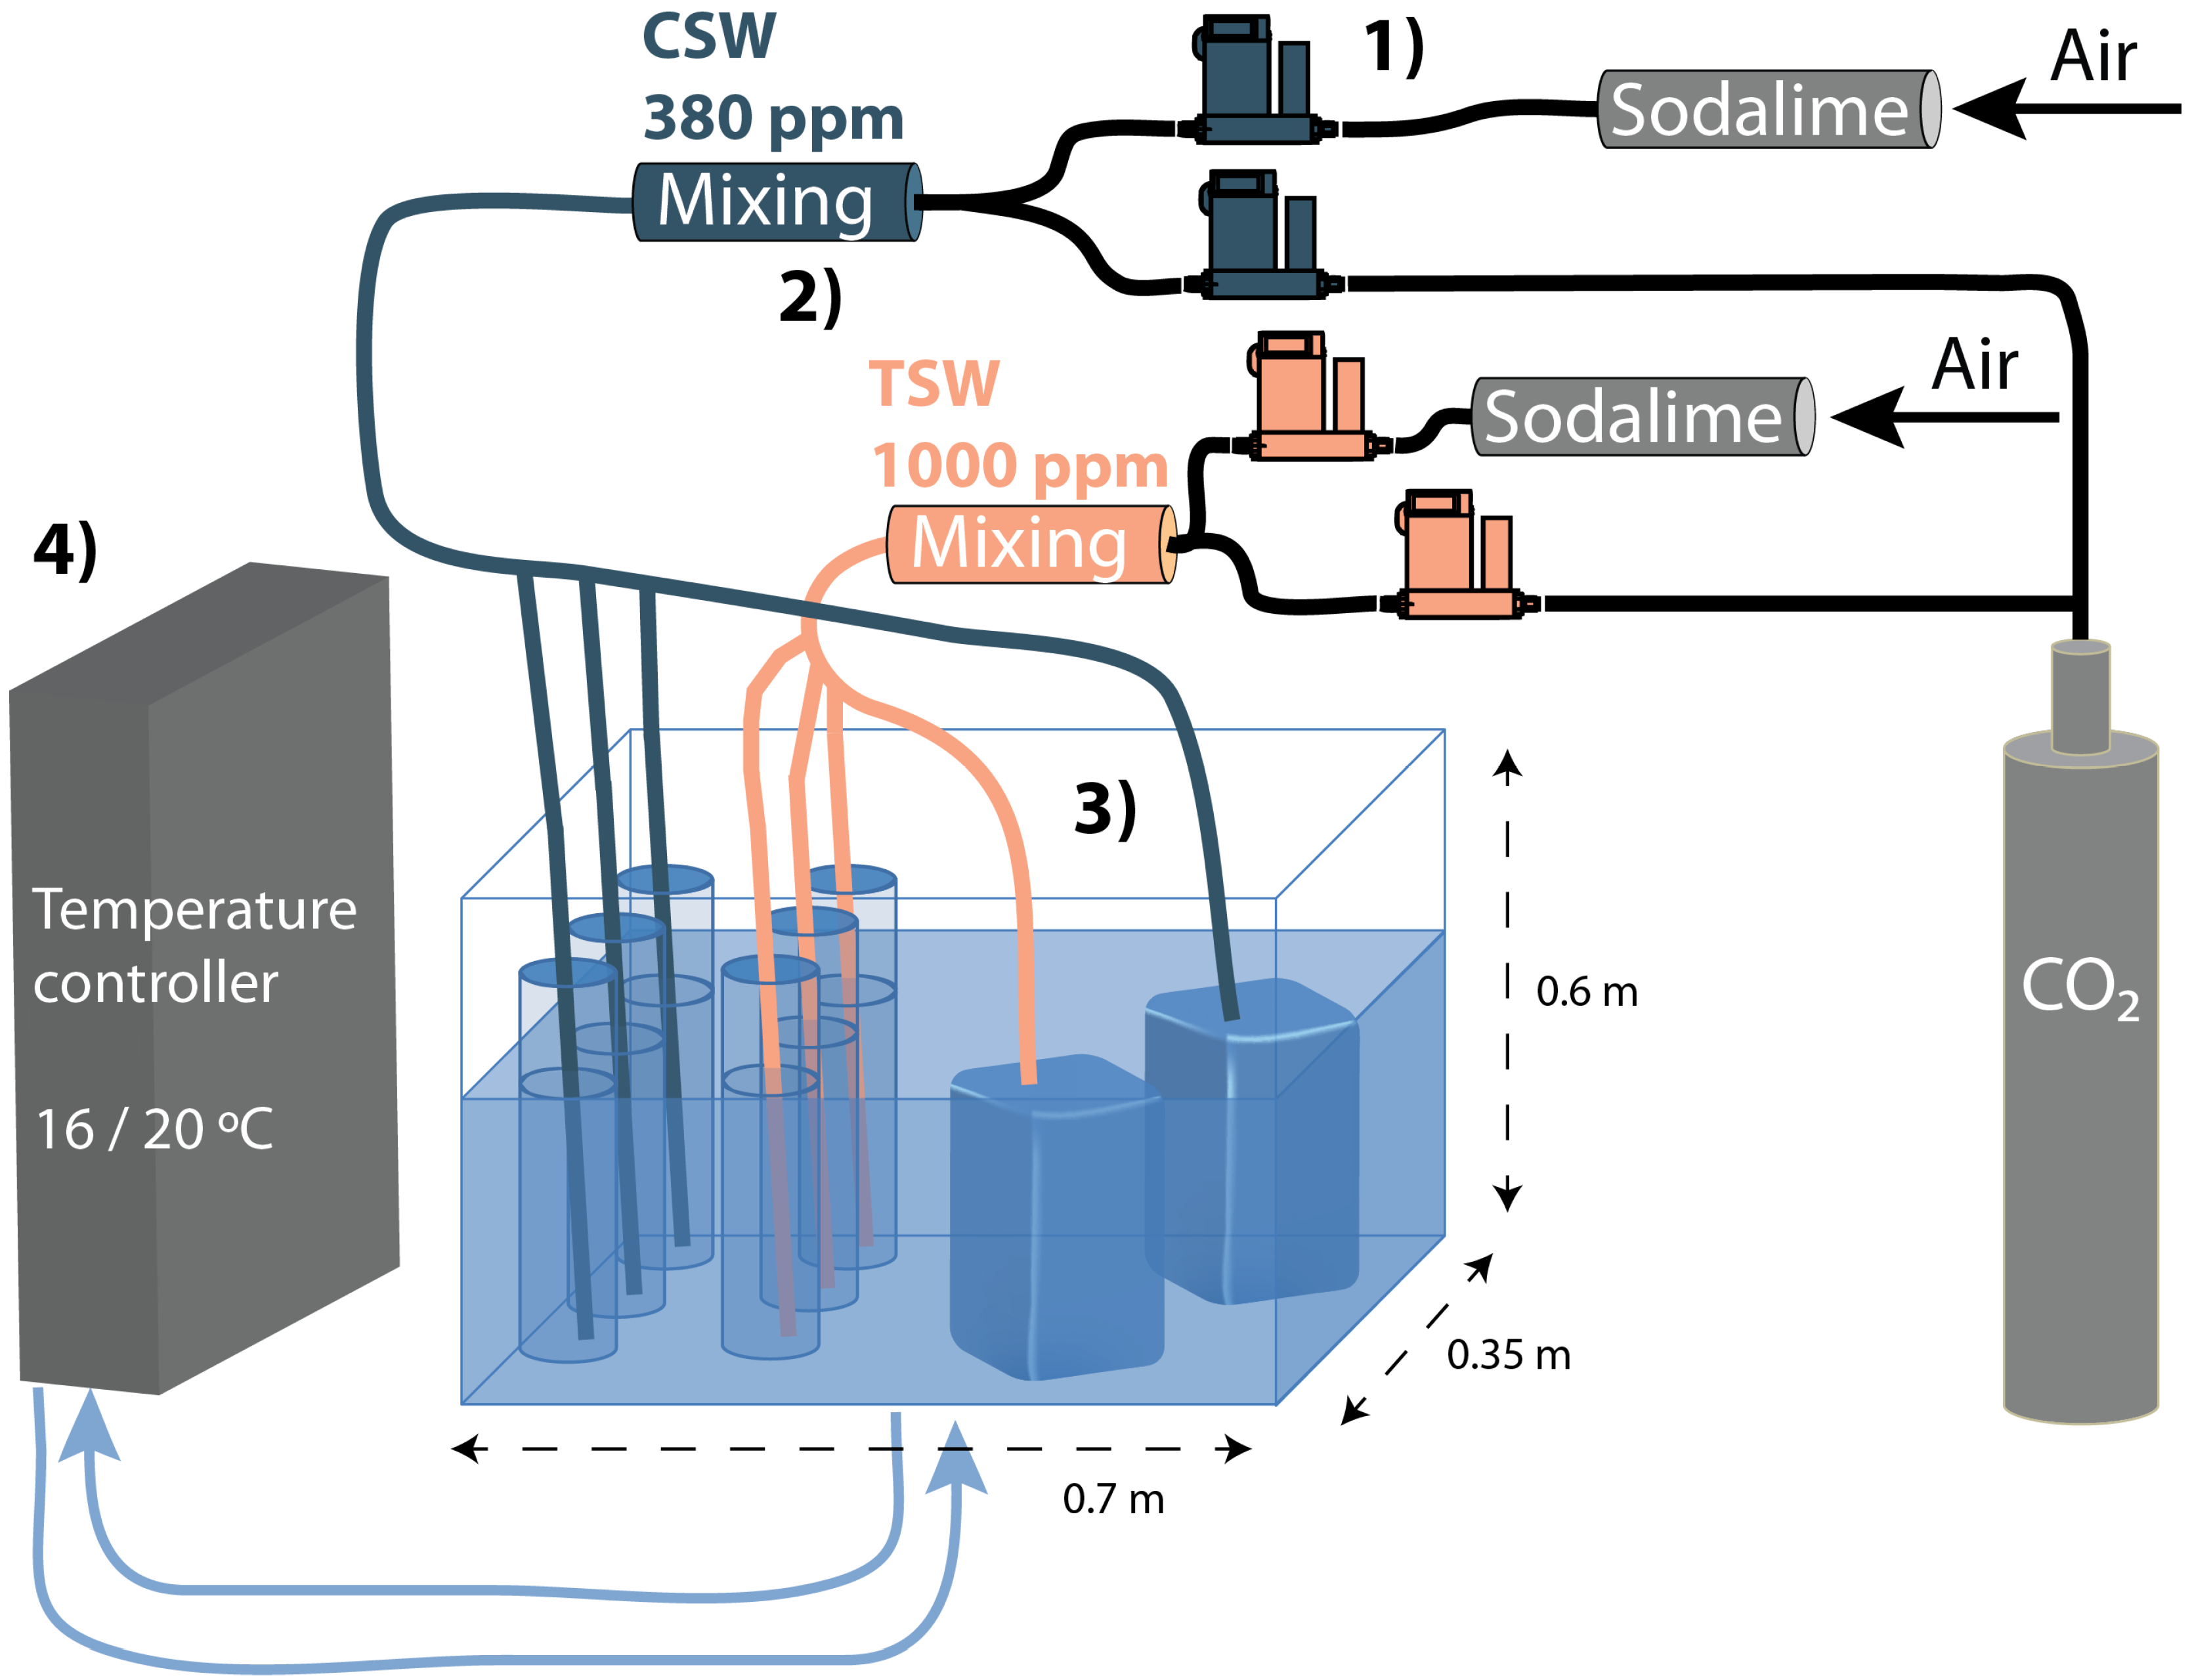
2. Material and Methods

Experiments were conducted in temperature regulated climate rooms at the Mediterranean Institute for Advanced Studies (Mallorca, Spain). Artificial seawater adjusted to a salinity of 35 was used in the experiments by blending a commercial salt mixture (Instant Ocean Sea Salt) with distilled water [40]. The water was mixed to ensure a complete dissolution of salt into the water and recirculated through a UV lamp for at least 24 h before use to reduce bacterial growth. The pH of the seawater was manipulated by aerating water with pCO2-adjusted air to each culture cylinder or tank separately (Figure A1). Ambient air was collected via aquarium pumps and passed through soda-lime columns. Precise volumes of CO2-stripped air and CO2 gas were administrated using mass-flow controllers (Aalborg GFC17) and mixed in a container filled with marbles to achieve pCO2 concentrations of 380 ppm (control, CSW) and 1000 ppm (treatment, TSW). These values correspond to the annual average atmospheric pCO2 level of 2005 [41] and to the high-end projected level for 2100 [5], respectively.

2.1. Study Organism and Collection of Gametes

Adult Mediterranean mussels (Mytilus galloprovincialis) of ≈7 cm in length were obtained from a commercial mussel farm (Manuel Cabrera e Hijo S.C.P) located in Mahòn, on the coast of Menorca, Spain on 11th and 14th of April 2011. Temperature and salinity, measured nearby, were 15.9 and 37.5 °C respectively. Mussels were placed into an aerated storage tank in a cold room set to 14 °C. Spawning was induced the next day for mussels that appeared to be in a good condition.
Gametes were collected from individual mussels after inducing spawning with a combination of temperature shock (at 22 °C) and fluoxetine as described in Honkoop et al. [42]. Typically, the mussels started to spawn 30 min after adding fluoxetine, which was then washed away by changing the water to freshly aerated seawater. The mussels were left to spawn for about 30 min. Sperm suspensions from individual males were pipetted from the highest concentrations close to the bottom of the beakers, and transferred to separate Eppendorf tubes for sperm activity experiments. Tubes containing sperm stock were stored in wet ice and used as soon after collection as possible (1 to 4.5 h after spawning). Eggs were collected from the beakers with a cut-tisp pipette to avoid damaging them.

2.2. Sperm Activity

A two-level experimental design (380 ppm = CSW, control; 1000 ppm = TSW, treatment) was used to assess pCO2 effects on sperm swimming speed and percentage of motile sperm (“sperm motility" hereafter). Water for the experiment was obtained from tanks treated similarly to the experimental cylinders (Figure A1). The experiment was conducted in a temperature controlled room approximately at 16 °C following the methodology in Havenhand and Schlegel [43]. A known volume (14–110 μL) of concentrated sperm stock (215–1777 × 103 cells μL−1, counted using haemacytometer and 8 replicate subsamples) from an individual male was mixed with 1500 μL of treatment (TSW) and control seawater (CSW) in separate Eppendorf tubes. Temperature of TSW and CSW was maintained at 16 °C using a water bath. The final concentration of the suspension (≈16 × 103 cells μL−1) was adjusted to provide an optimal number of sperm cells for filming (20–40 frame−1).
Immediately after mixing, a drop of sperm suspension was placed in one of the chambers of a Leja 4-chamber microscope slide (20 μm depth, SC-20-01-04-B), which was then set on the stage of a compound microscope (Leica Leitz Labor-Lux S, 20× objective) equipped with an infrared filter and connected to a Panasonic 1.2 megapixel video camera via CCD-Video camera module. The camera system was connected to a computer and calibrated for length and width of the field of view. A film clip was recorded, the clips were edited to constant length (1 s, 25 frames) and analyzed using CellTrak 1.5 software (Motion Analysis Corporation, Santa Rosa, CA, USA). Sperm swimming speed was determined as average curvilinear velocity of motile sperm cells in each film clip [44]. Sperm velocity threshold of less than 10 μm s−1 was used to calculate percentage of motile sperm. The threshold value was determined from histograms of speed data from multiple males.
This procedure was repeated 10 times for each sperm sample, in both treatment and control conditions. The mean of 10 replicate measurements was used in subsequent analyses as described in Havenhand et al. [35]. Thirteen males were used as statistical replicates to evaluate the variation within the population.

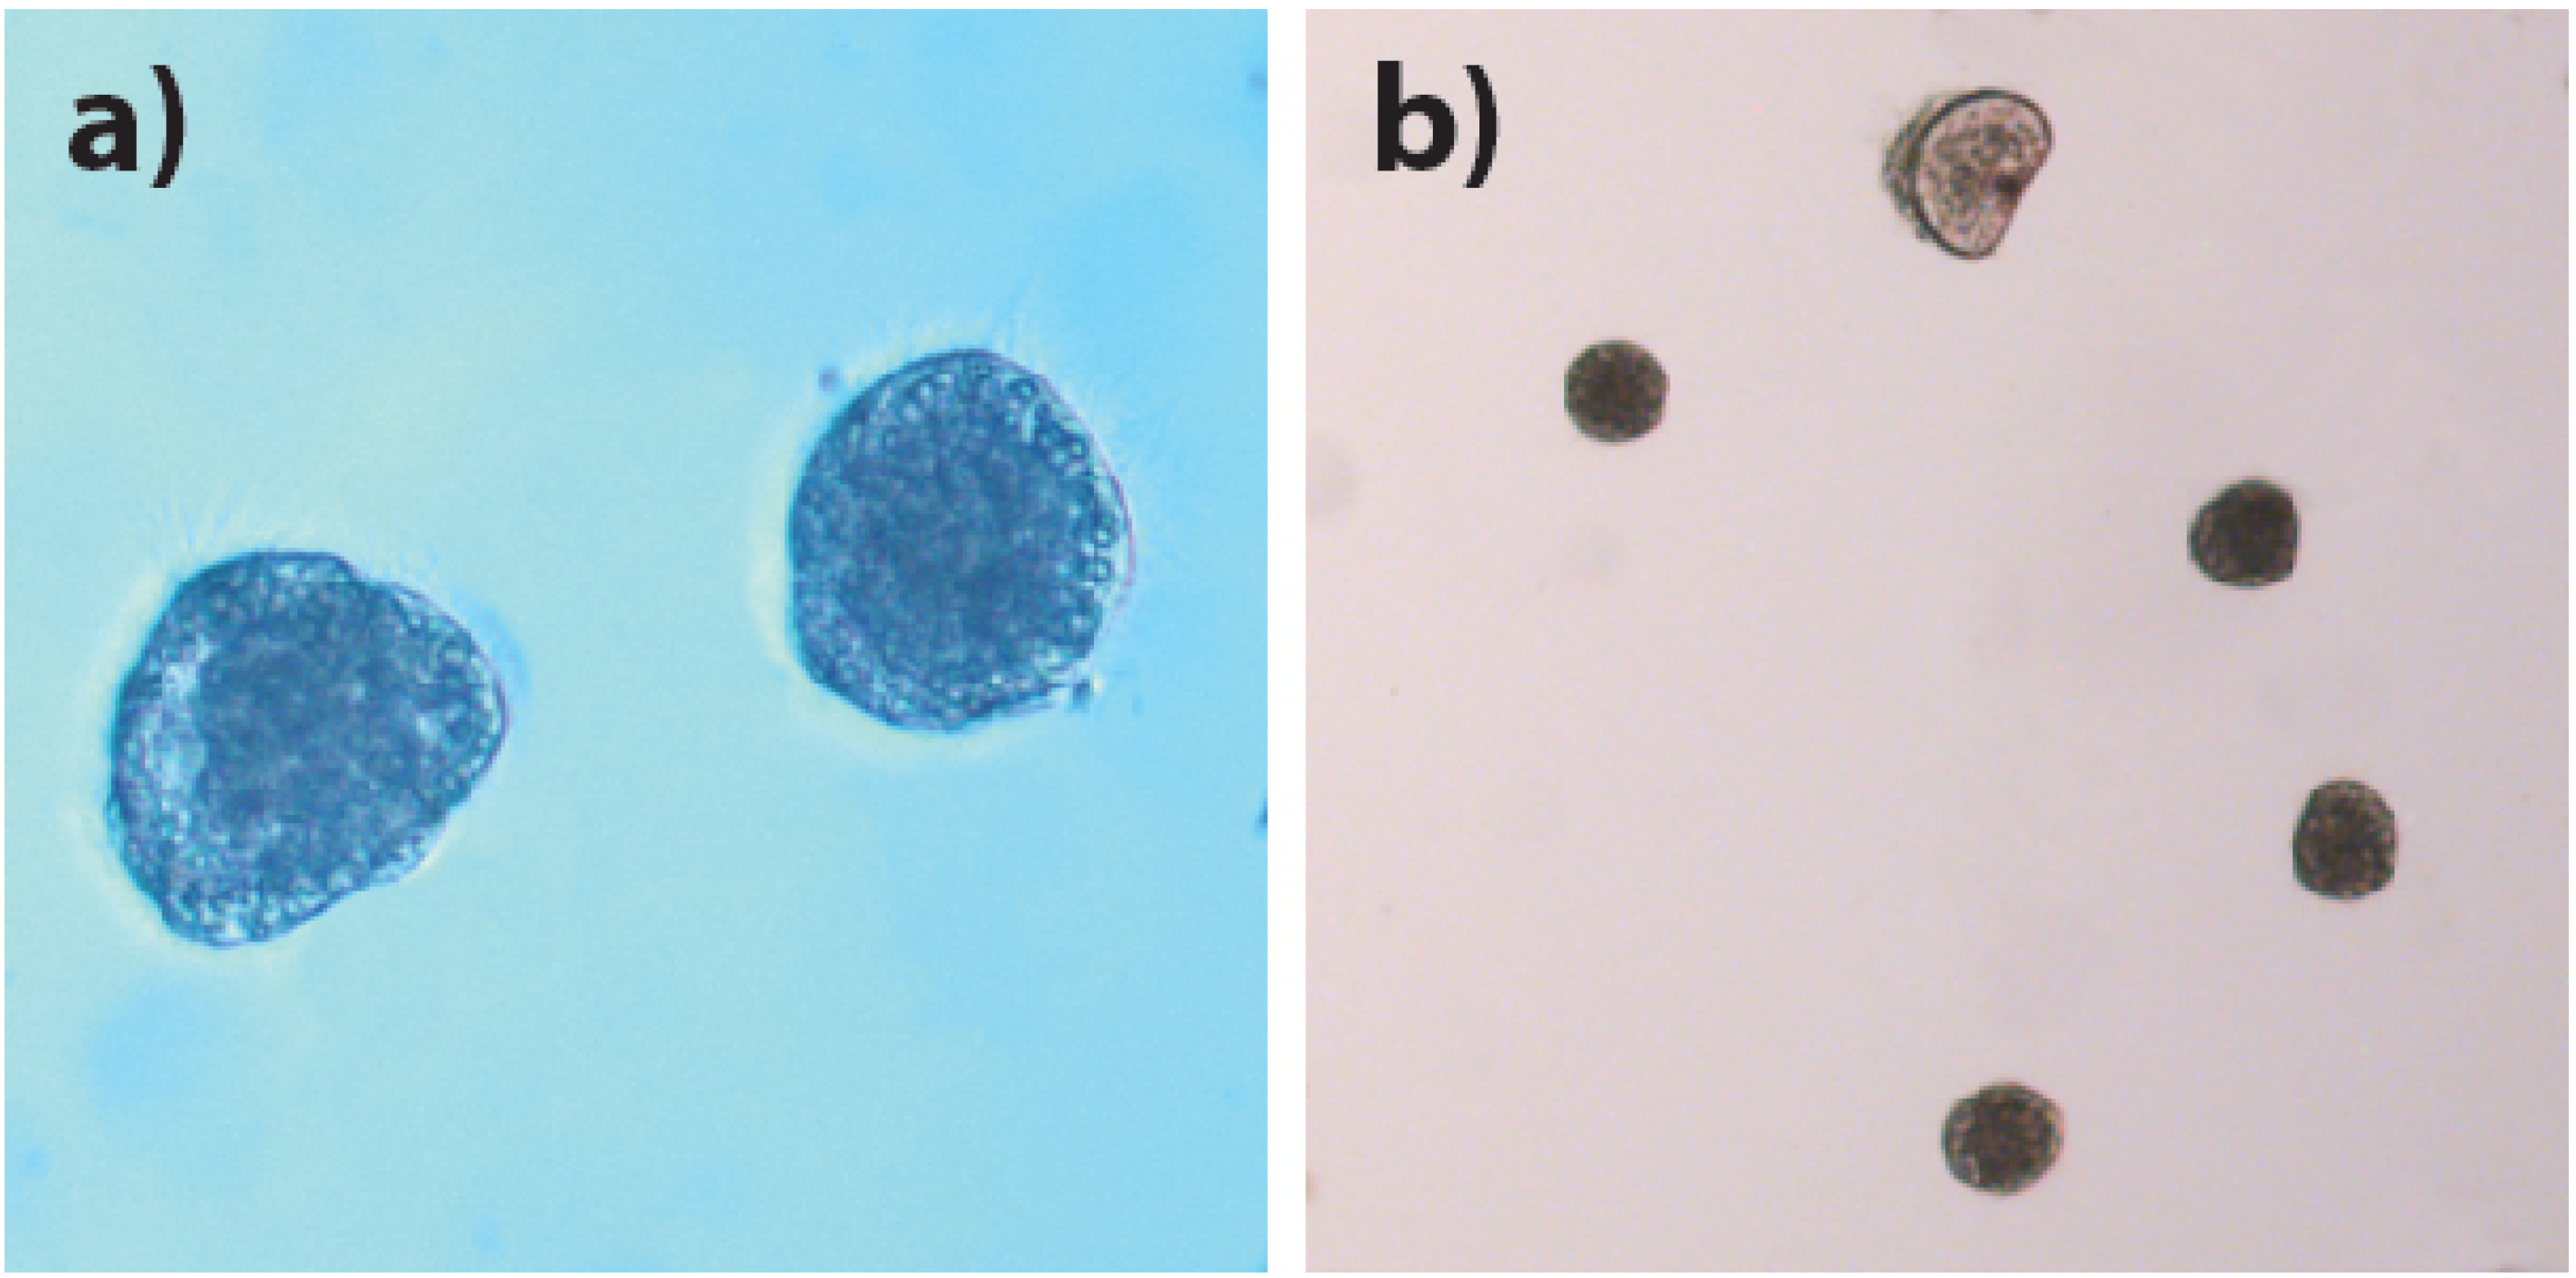
2.3. Larval Experiment

The larval development experiment used a two-variable factorial design, consisting of two temperature treatments (low ≈ 17 °C and high ≈ 20 °C; see Table 1) and two pCO2 treatments (380 and 1000 ppm). Each treatment combination was replicated three times, thus requiring twelve 6 L meta-acrylate cylinders (Figure A1). Cylinders had a funnel-shaped bottom and were aerated through a glass pipe from the bottom to equilibrate the water to the desired pCO2 and to prevent sedimentation of larvae. Cylinder lids were fitted with a sampling port consisting of a silicon tube reaching mid-way down the cylinder. A 35 μm mesh filter was attached to the sampling port to extract water samples while leaving the larvae in suspension.
Table 1. Mean (±1σ, n = 3) pH, carbon chemistry and calcite saturation state parameters of experimental seawater for pCO2 control (CSW, 380 ppm), treatment (TSW, 1000 ppm), temperature control (L, low) and treatment (H, high) cylinders 0.5 h after fertilization [(a.f., 2 h before addition of embryos (a.e.)] and 47.5 a.f. (44.5 h a.e.). S refers to salinity; T to temperature, pHT to pH in total scale; DIC to dissolved organic carbon; AT to total alkalinity; and ΩAr to aragonite saturation state. Measured parameters were obtained at 25 °C and calculated for experimental temperatures using CO2SYS.
Time
(h a.f.)
TreatmentMeasured parametersCalculated parameters
pCO2TS *T **
(°C)
pHTDIC
(μmol kg−1)
pHTpCO2
(ppm)
pCO2
(μatm)
AT
(μeq kg−1)
ΩAr
0.5CSWL3516.8 ± 0.57.93 ± 0.032903 ± 248.06 ± 0.03549 ± 43539 ± 423200 ± 333.6 ± 0.3
TSWL7.87 ± 0.092964 ± 328.00 ± 0.09662 ± 158651 ± 1563226 ± 683.3 ± 0.6
CSWH19.6 ± 0.27.92 ± 0.052911 ± 128.00 ± 0.05661 ± 76646 ± 753207 ± 293.7 ± 0.4
TSWH7.81 ± 0.072925 ± 487.88 ± 0.07890 ± 163870 ± 1593146 ± 222.9 ± 0.4
47.5CSWL3516.8 ± 0.57.97 ± 0.062850 ± 918.10 ± 0.06490 ± 64481 ± 633173 ± 1383.9 ± 0.6
TSWL7.60 ± 0.012859 ± 1767.73 ± 0.011210 ± 731189 ± 712969 ± 1811.7 ± 0.1
CSWH19.6 ± 0.28.02 ± 0.042834 ± 488.09 ± 0.04504 ± 60493 ± 583198 ± 214.4 ± 0.3
TSWH7.65 ± 0.012887 ± 957.71 ± 0.011293 ± 851263 ± 833018 ± 922.0 ± 0.1
Notes: * Salinity was adjusted to 35 by blending commercial salt mixture with distilled water; ** Average temperature is given for the entire larval experiment.
Experimental temperature treatments were maintained within ±0.1 °C (PolyScience 9600 series), and monitored with temperature sensors connected to a data logger. In addition, pH sensors were deployed in two cylinders of each treatment combination. Two additional 10 L tanks of sea water continuously aerated to the desired pCO2 concentrations were maintained at each temperature treatment to provide pretreated water at the relevant pCO2 and temperature for refilling the cylinders after sampling and for the sperm motility assessment (Section 2.2).
Gametes were obtained by the methods outlined above (Section 2.1). Eggs were gently rinsed over a 20 μm sieve and pooled in a 1 L container. Sperm was passed through a 63 μm sieve to remove debris. Eggs from five individual females were combined and fertilized with a diluted sperm sample combined from 16 males, and left for 2 h in aerated water. Embryos were then rinsed over a 20 μm sieve, and sub-sampled to determine fertilization success and egg concentration. A total of ≈98,000 embryos (16 embryos mL−1) were added to each cylinder. Statistical population for the larval study consisted therefore of five females and 16 males, which were in turn a random subsample of the population in the Menorcan mussel farm.

2.3.1. Calcification

Net larval calcification was determined 48–55 h after fertilization using a modified version of the micro-diffusion technique for measuring coccolithophore calcification [45]. Three replicates of unfiltered water containing larvae (40 mL each) were sampled from each cylinder, transferred into acid washed 60 mL polycarbonate bottles, and mixed with 147 kBq of 14C-bicarbonate. One of the three replicates served as a blank, and was poisoned with concentrated borax buffered formalin. Radioactivity added to each bottle was determined by preserving 250 μL of each sample in 1 mL of ethonolomine in a separate scintillation vial. All replicates were then placed in a temperature bath for 4–6 h. Samples were filtered, processed, and acidified according to Paasche and Brubak [45], and finally frozen until later analysis. Radioactivity was measured from each filter in a scintillation counter (Tri-Carb 2810TR, Perkin Elmer) more than 8 h after the addition of 5 mL of scintillation cocktail. Radioactivity in blank samples was variable. Thus, the minimum blank radioactivity measured across the experiment was used to subtract from radioactivity measured on the live sample filters. Net calcification rates (μg C L−1 d−1) were calculated using measured DIC concentrations with the standard formula from Parsons et al. [46] and standardized to the estimated number of larvae in the subsample at the end of the experiment (see Section 2.3.3.).

2.3.2. Metabolism

Larval respiration rates were measured at the end of the experiment (51–57 h after fertilization) by determining the change in oxygen content from three replicate samples taken at the beginning and end of a 4.5 h incubation period. Incubations were performed after sealing the experimental cylinders. A deflated O2 impermeable intravenous drip bag (medical supply PVC) was used to aid water sampling: Water was added to the drip bag through a silicon port which displaced the sample water inside the cylinders by pushing it out through the sampling port into 50 mL Winkler bottles, keeping the total volume of the cylinders stable and minimizing gas exchange. Oxygen content of the water samples was determined by the Winkler method [47] and determined by spectrophotometry at a wavelength of 466 nm [48]. Mean oxygen consumption values for each cylinder were used as statistical replicates after standardizing to the estimated number of larvae in a cylinder at the end of the experiment (see Section 2.3.3.).

2.3.3. Larval Size and Survival

The experiment ended 58 h after fertilization, when most of the larvae the were at the late trochophore stage and some had reached the early D-veliger stage (Figure 1). Three subsamples of larvae from each experimental cylinder were fixed in borax buffered formalin. The mean number of larvae remaining in each cylinder was divided by the initial number of embryos added (98,000) and used as the estimate of survival rate. Sizes of 50 larvae from each cylinder were measured along the longest axis. Mean values from each cylinder were used as statistical replicates.
Figure 1. Mytilus galloprovincialis larvae from the end of the experiment [58 h after fertilization (a.f.)]. (a) Late trochophore stage larvae incubated at control conditions (pCO2 = 380 ppm, T = 16 °C) showing the univalved shell; (b) The occasional early D-veliger larva with a bivalved shell among the majority of late trochophores.
Water 05 01890 g001

2.4. Carbonate System

Total hydrogen ion concentrations (pH) and dissolved inorganic carbon (DIC) were measured at the beginning [0.5 h after fertilization (a.f)] and near the end of the experiment (47.5 h a.f.) to determine if targeted CO2 concentrations were achieved. Seawater pH was measured following standard operating procedure (SOP 6b from DOE [49]) at 25 °C. Triplicate samples were collected with a silicon tube and directly siphoned into glass cuvettes previously rinsed with sample water. Cuvettes were submerged in a 25 °C temperature bath for at least 30 min prior to measurement in a Jasgo 7800 spectrophotometer. The temperature bath was connected to a continuous flow water jacket cuvette support inside the spectrophotometer to ensure temperature stability throughout the measurement. Samples for DIC were collected in 10 mL amber glass ampoules, poisoned with 0.2 μL HgCl2, flame sealed and processed at the National Oceanography Centre in Southampton (UK). Measurements were calibrated using Certified Reference Material from the Dickson lab at the Scripps Institute for Oceanography. Water pH, pCO2, total alkalinity (AT), and aragonite saturation state (ΩAr) were calculated for experimental temperatures with CO2SYS program [50] from pH and DIC as the carbon dioxide system parameters. Sensors were used to constantly monitor pH values during the experiment. Values measured with pH sensors are given in National Bureau of Standards scale (pHNBS), whereas pH values measured with spectrophotometer are in total pH scale (pHT). Therefore, pHNBS values are approximately 0.15 units higher than pHT values [51].

2.5. Statistical Analyses

The natural logarithm of the response ratio [ R = X ¯ Treatment / X ¯ Control ; ln ( R ) = L = ln ( X ¯ Treatment ) ln ( X ¯ Control ) ] was calculated from mean values obtained from replicate cylinders (n = 3) and males (sperm activity data, n = 13) [52]. Means and the 95% confidence intervals (CIs) for L were calculated using Equations 1 and 2 from Hedges et al. [53], with the exception that t- instead of z-distribution was used to obtain more reliable CIs for small samples. The method led to slightly wider CIs than directly following Hedges et al. [53]. Percentage values (survival and percentage of motile sperm) were arcsine-square root transformed before calculating L [54]. Interactions between pH and temperature in the larval experiment were assessed using two-factor analysis of variance (2-ANOVA). The effect of time lag between sperm activation and activity measurements was examined with analyses of covariance and regression analyses using R [55].
Literature of OA effects on Mytilus larvae was examined by searching with Google Scholar using keywords “Mytilus", “ocean acidification", and “larvae" (5 relevant studies found on 6 November 2013). As larval size was the only parameter measured by every study, it was further evaluated by extracting pH, mean response and standard deviation for pCO2 treatments and controls from the articles. L and 95% CIs were calculated assuming a normal distribution following Hedges et al. [53] directly. L was back-calculated to percentage response ratios (R) for graphical presentation only. Figures were made with ggplot2 package [56] for R.

3. Results

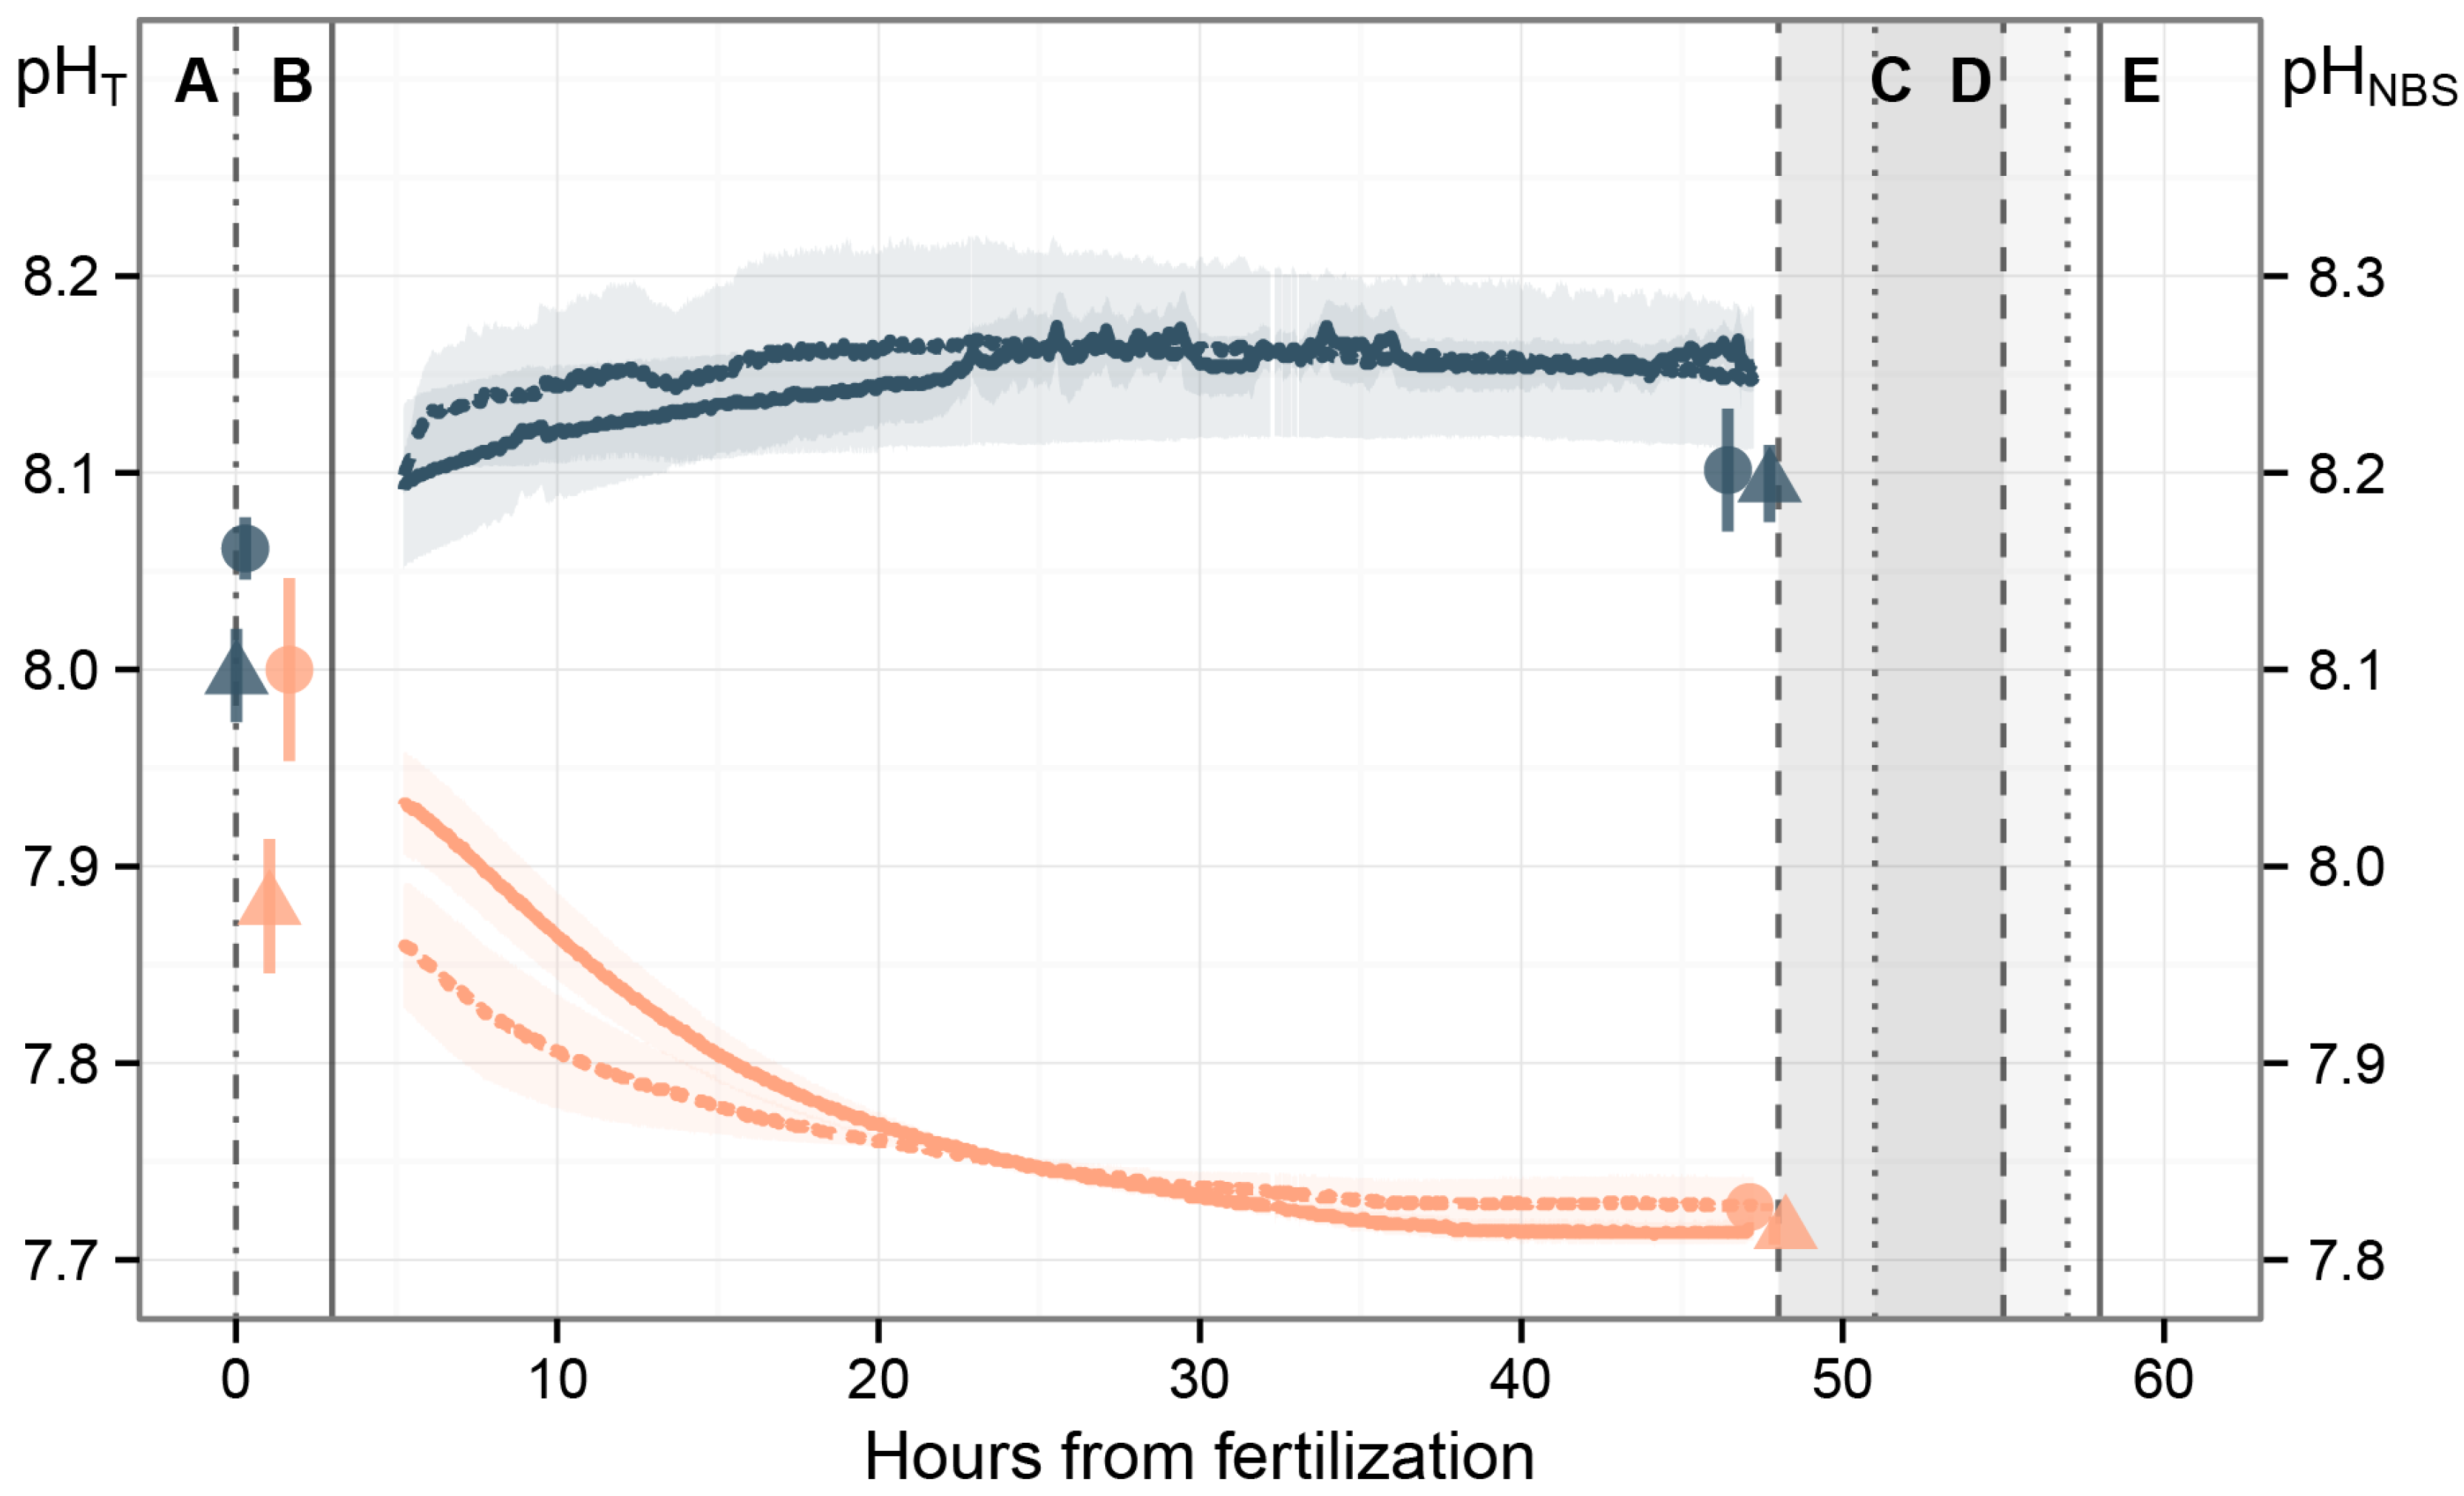
3.1. Carbonate System
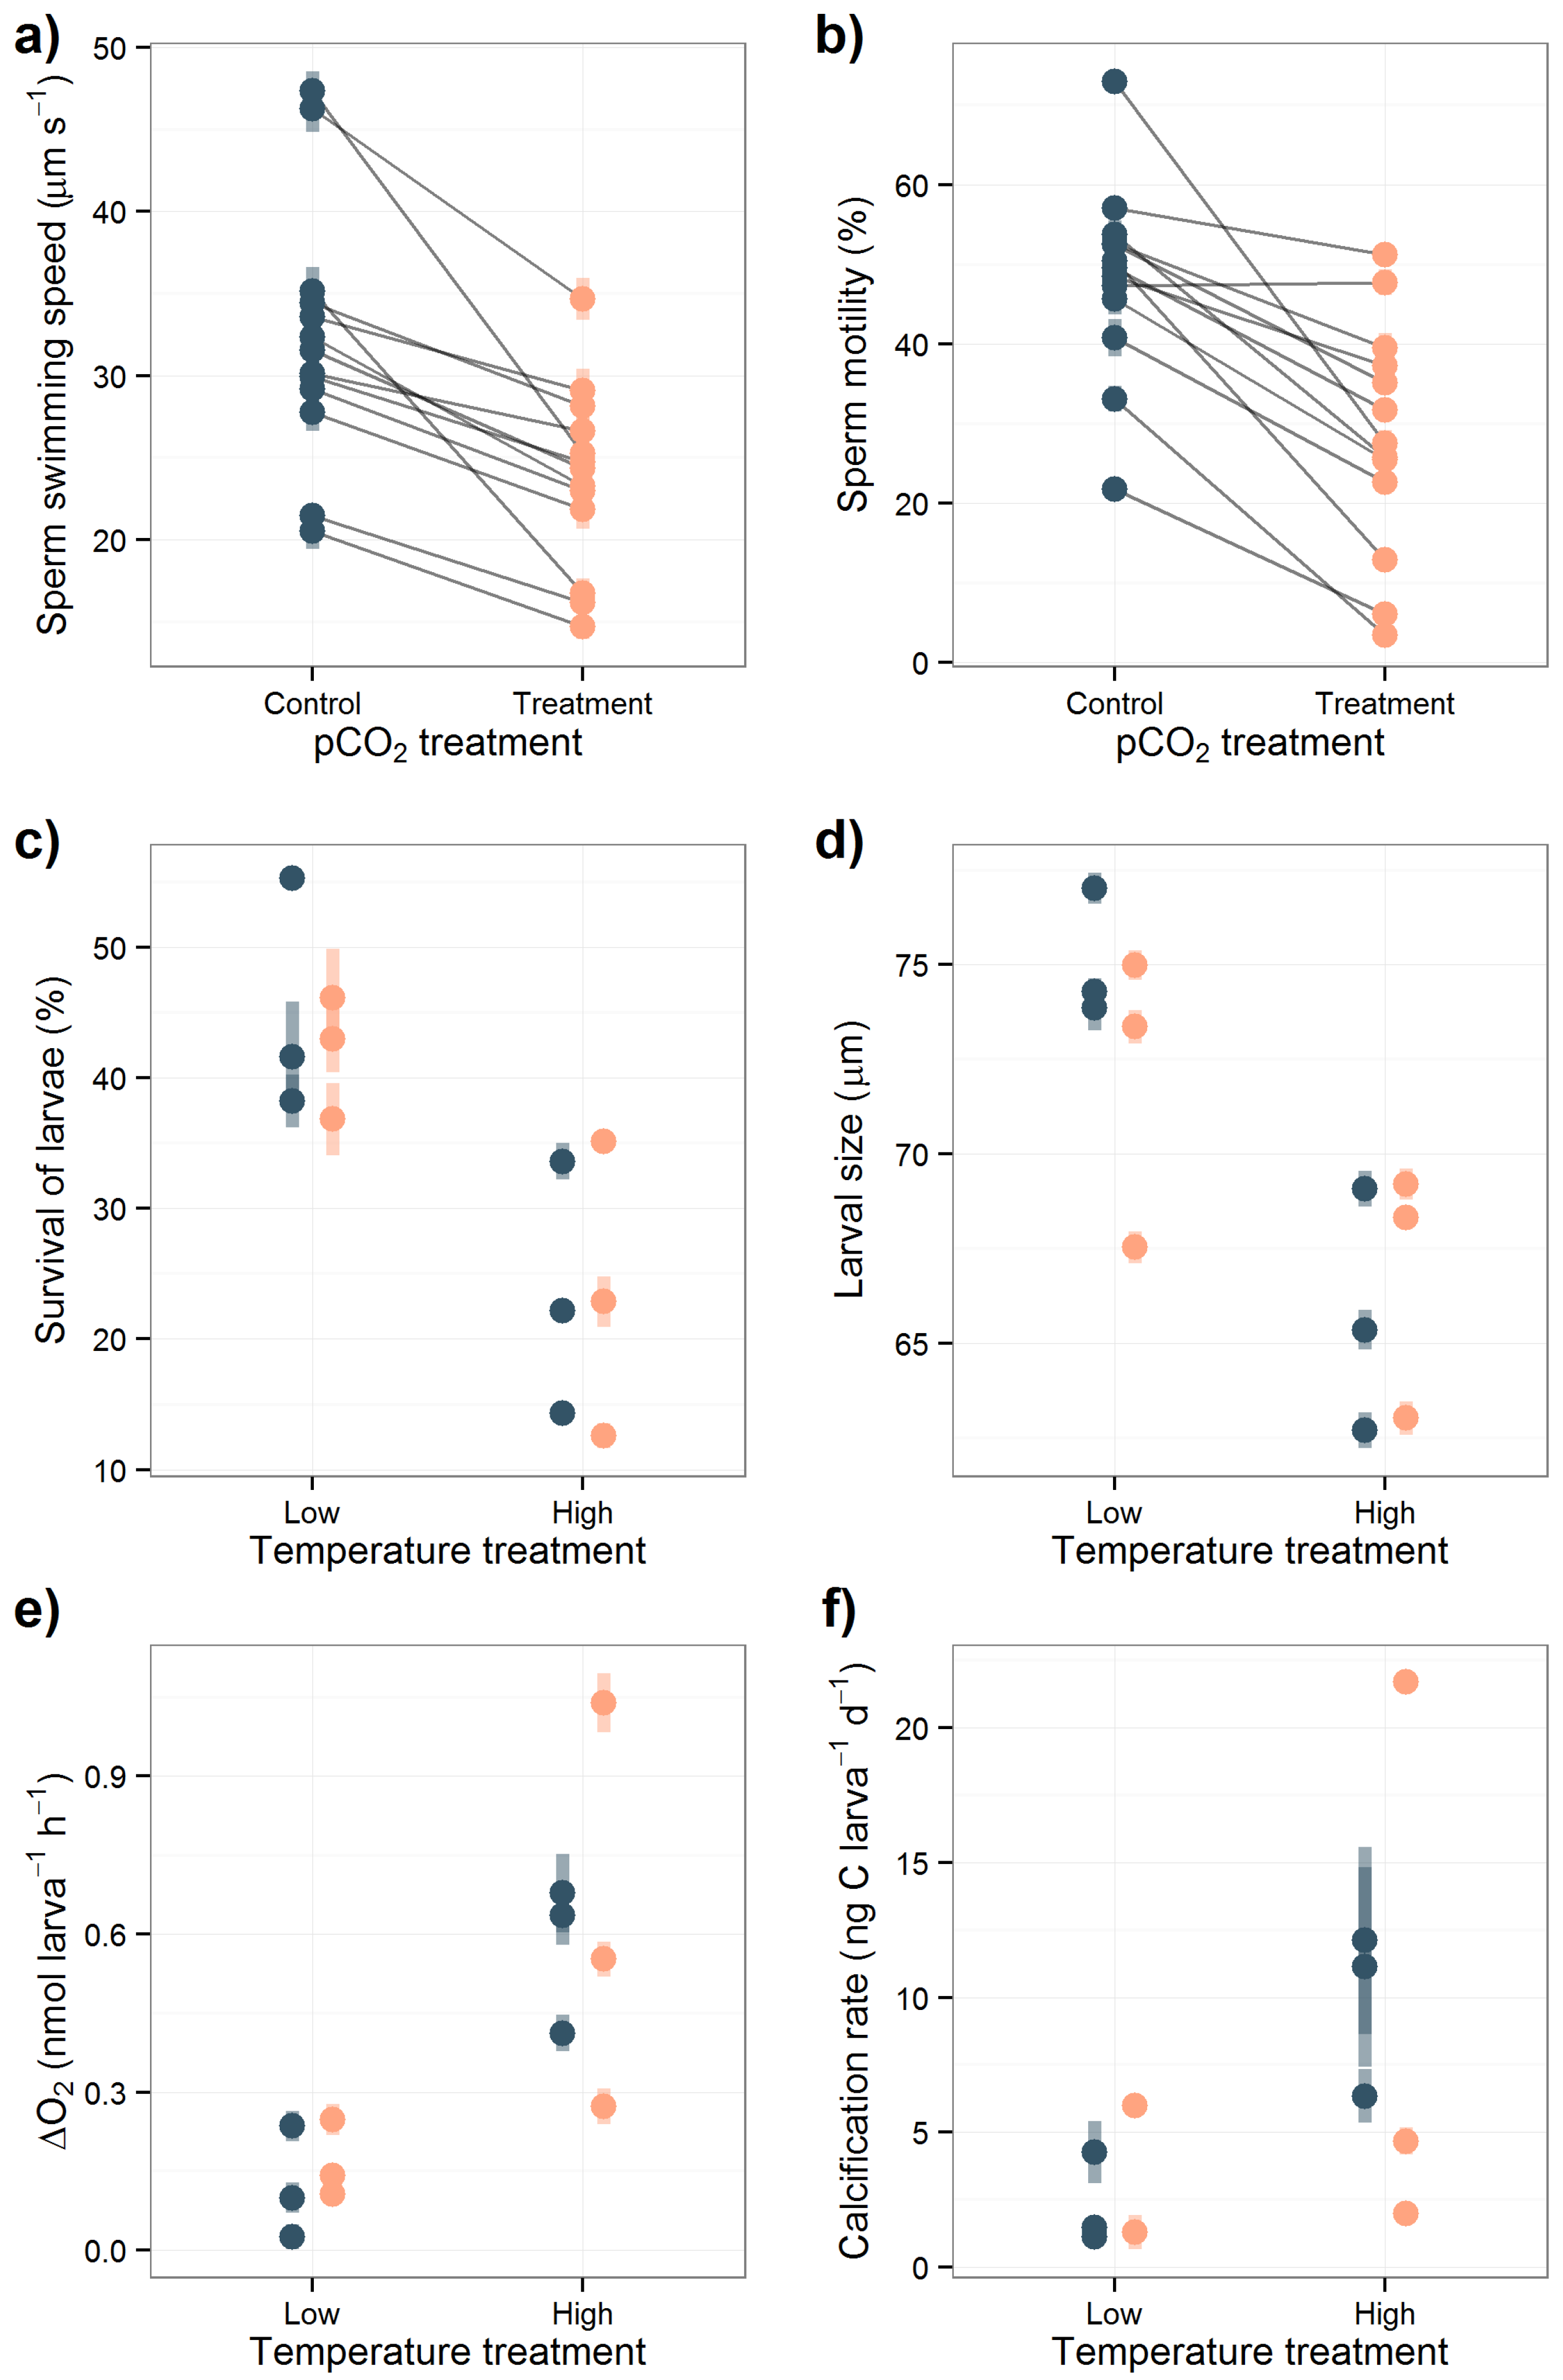
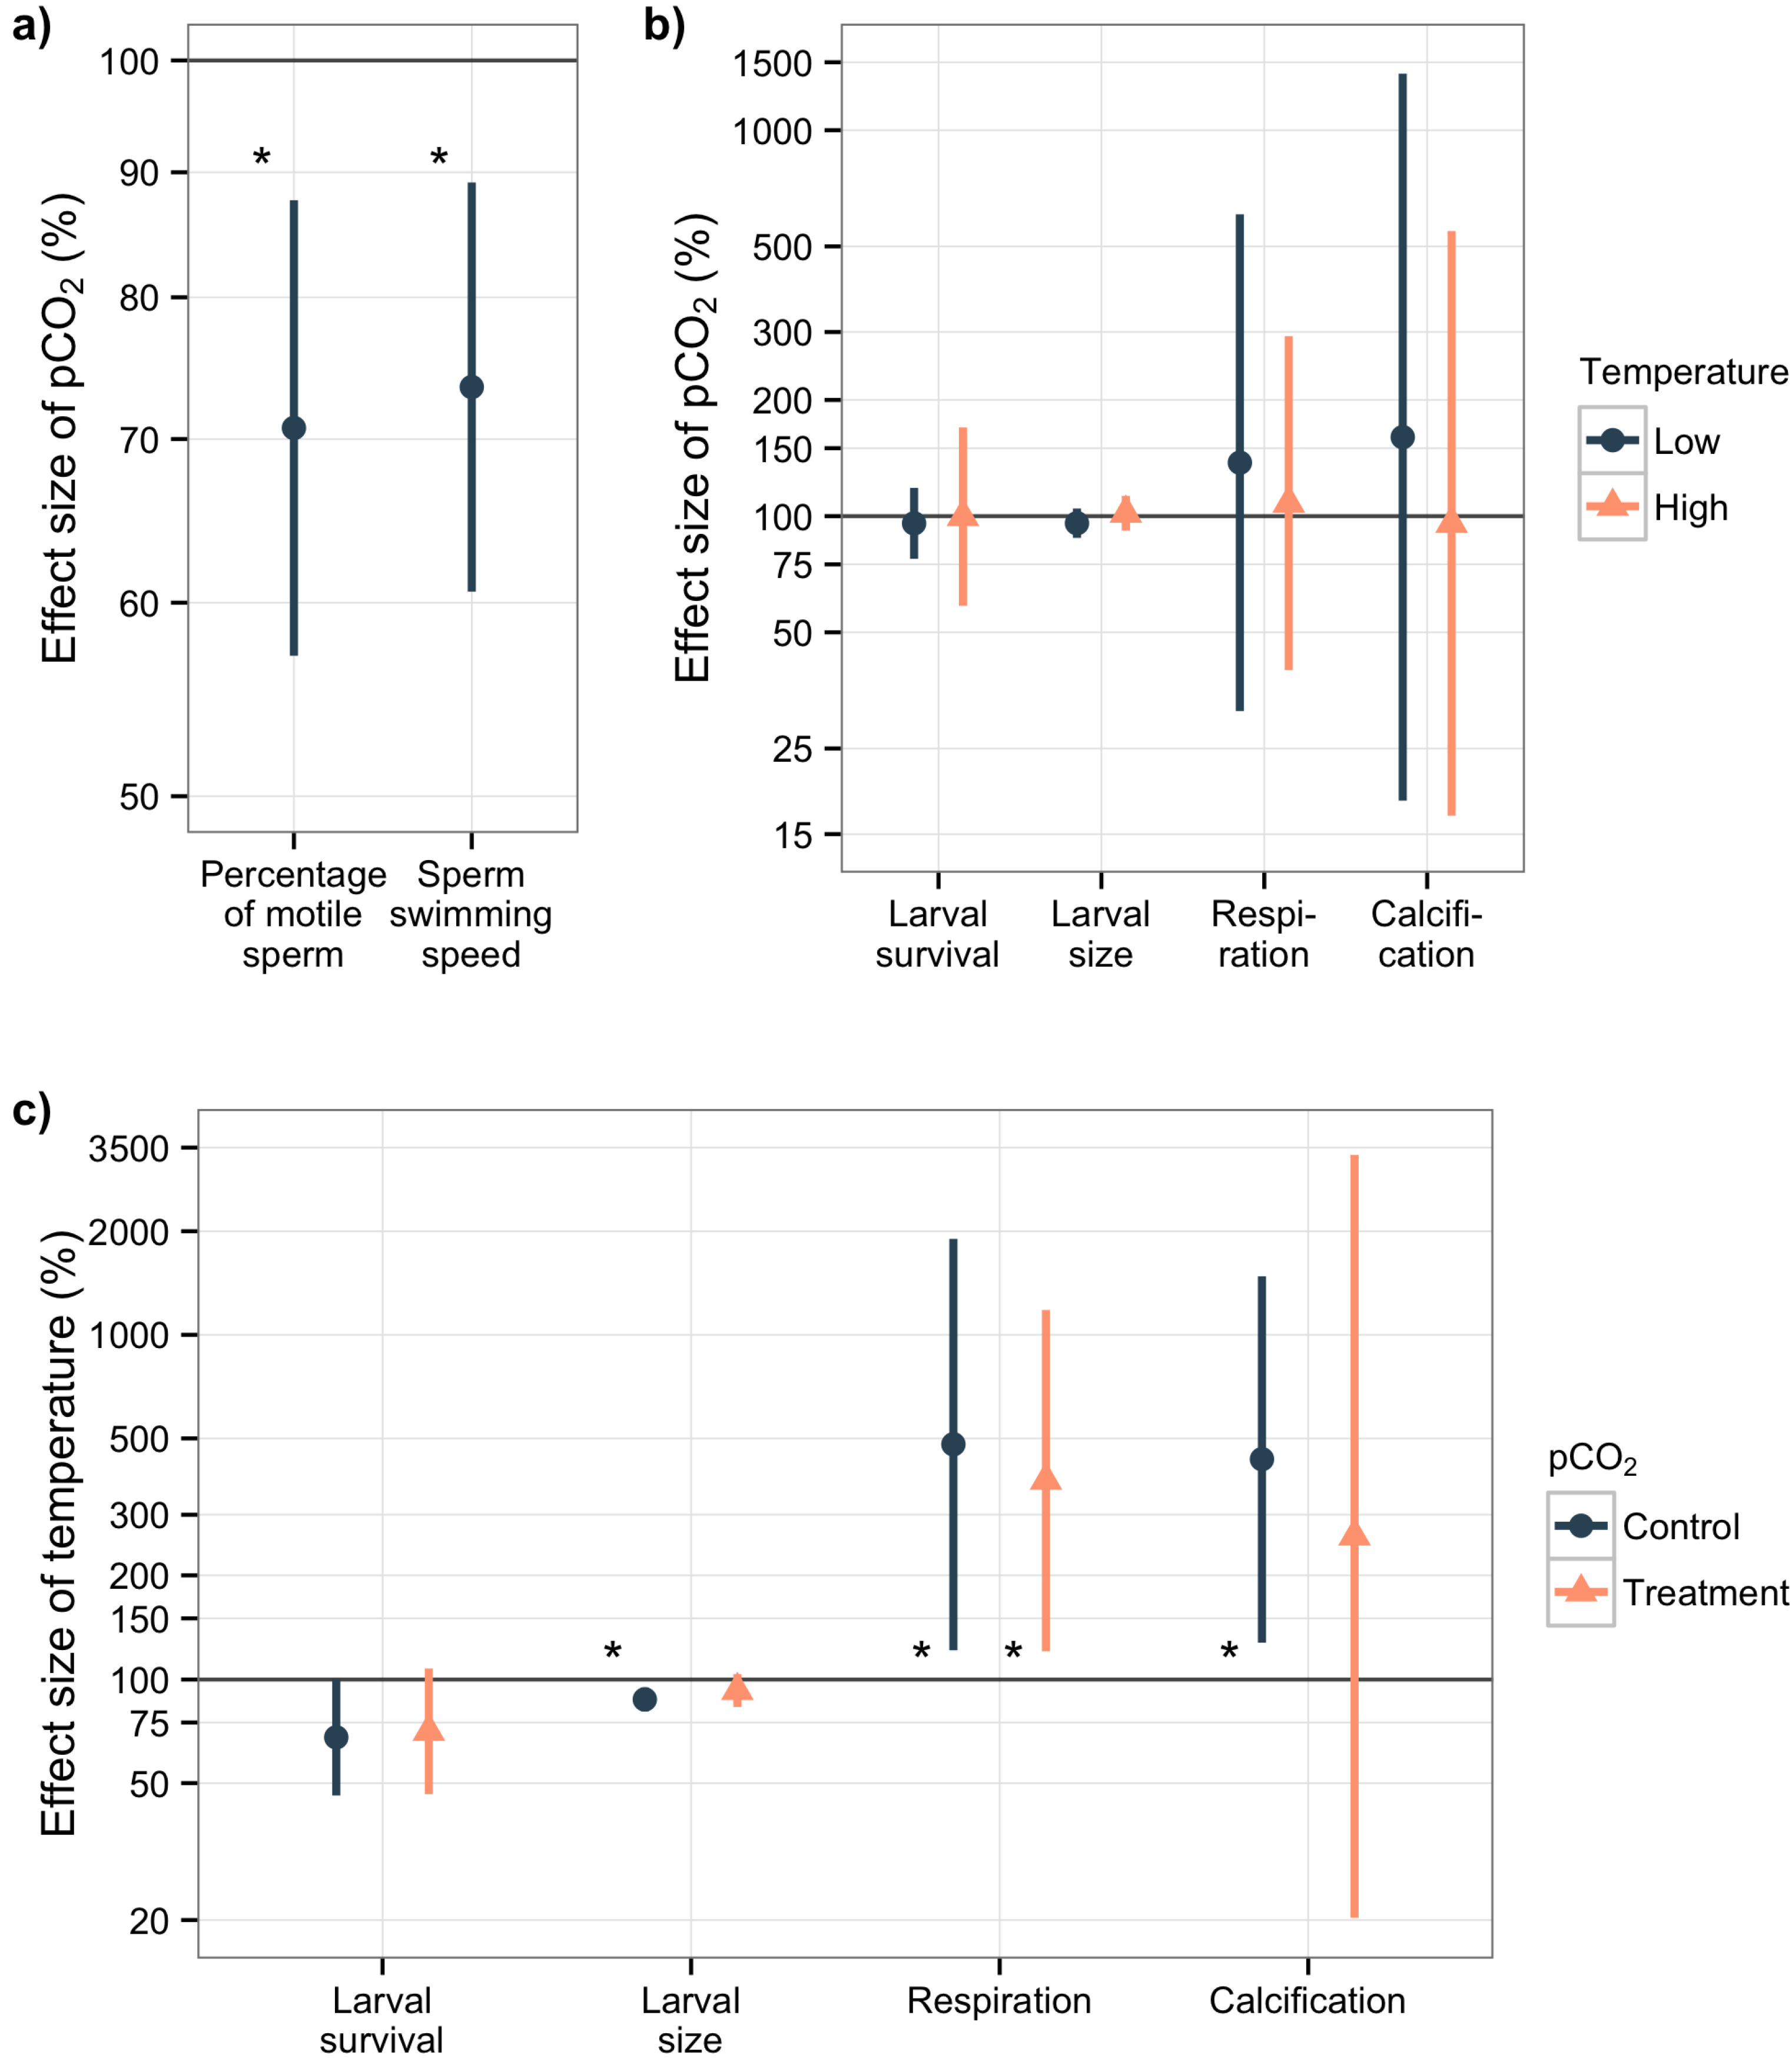
Average pH values in control cylinders remained between 8.0–8.1 pHT over the larval experiment, whereas pH in CO2 treatment cylinders decreased gradually (Figure 2). The difference in pH values between treatment and control cylinders was approximately 0.2 units 2 h after addition of embryos (a.e.) (4 h a.f.), 0.3 units 8 h a.e. (10 h a.f.), and stabilized to approximately 0.35 units at the middle of the experiment. The mean difference measured with spectrophotometer 44.5 h a.e. (47.5 h a.f.) was 0.37 and 0.38 pH units (Table 1), and the average difference measured with sensors over the entire experiment was 0.38 and 0.40 pH units for low and high temperature treatments, respectively. pHT values measured from tanks for sperm motility treatment water corresponded to averages measured from cylinders. Aragonite saturation state (ΩAr) stayed well over the under-saturation limit (1) during the entire experiment. Average total alkalinity (AT) calculated from pH and DIC varied between 2969 and 3226 μeq kg−1. Average DIC varied between 2834 and 2964 μ kg−1.

3.2. Sperm Activity

An increased pCO2 had a substantial and statistically significant negative effect on percentage of motile sperm (95% CIs for R = 57%–88%, R ¯ = 71%) and swimming speed (95% CIs for R = 61%–89%, R ¯ = 74%) (Figure 3a). Average percentage of motile sperm was 48.1 ± 12.1 (σ) % and 28.2 ± 14.6 (σ) % for control and treatment, respectively. Average sperm swimming speed was 32.2 ± 7.8 (σ) μm s−1 for control and 23.7 ± 5.6 (σ) μm s−1 for treatment (Figure A2). Time from spawning had a significant negative effect on sperm swimming speed (Table 2, Speed), but the rate of decrease was not significantly different between control (CSW) and treatment (TSW) [Table 2, Ln ( R ¯ Speed ) ]. Percentage of motile sperm was not significantly affected by time from spawning (Table 2, Motility). The pCO2 treatment effect was larger than the sperm activity decline over time for both sperm swimming speed and percentage of motile sperm.
Figure 2. Seawater pH in experimental cylinders over the larval experiment. Points with error bars show mean pHT (±0.5σ) derived from spectrophotometer measurements 0.5 h and 47.5 h after fertilization (left y-axis scale). Lines show average pHNBS measured with sensors from two cylinders per treatment combination (shading: ±0.5σ; right y-axis scale). Light orange refers to the high pCO2 treatment (TSW) and dark blue to the control (CSW). Dots and solid line refer to the low, and triangles and dotted lines to the high temperature treatment. Dot-dashed vertical line shows the time of fertilization (A), solid line the time when embryos were introduced (B), dark gray shading between dashed lines the time frame of calcification measurements (C), light gray shading between dotted lines the time of metabolism measurements (D; C and D overlapped, hence the dark grey zone), and solid line both, the end of the larval experiment, and the time of larval size and survival measurements (E).
Water 05 01890 g002

3.3. Larval Experiment

There were no significant interactions between pCO2 and temperature treatments in the larval experiment (Table A1). None of the studied parameters were significantly affected by the elevated pCO2 treatment (Figure 3b), whereas increased temperature had a large significant effect on larval metabolism increasing the respiration rate by a factor of four (Figure 3c). Mean responses of larval survival and size in elevated pCO2 were almost identical to those in controls (survival R ¯ Low = 96% and R ¯ High = 100%; size R ¯ Low = 96% and R ¯ High = 102%) and 95% CIs were small (survival RLow = 78%–118% and RHigh = 59%–170%; size RLow = 88%–105% and RHigh = 92%–113%). On the other hand, 95% CIs of effect sizes for respiration (RLow = 31%–605% and RHigh = 40%–293%) and calcification rate (RLow = 18%–1401% and RHigh = 17%–548%) had a wide range indicating large variation in responses for these variables.
Figure 3. Effect size (R) for a range of sperm activity and early life-stage parameters of M. galloprovincialis: (a) sperm motility and sperm swimming speed between treatment and control pCO2 at control temperature; (b) larval parameters (survival rate and size 58 h after fertilization (a.f), larval respiration rate 51–57 h a.f., and calcification rate 48–55 h a.f.) between treatment and control pCO2; and (c) larval parameters between treatment and control temperature. Dots and triangles represent mean effect sizes ( R ¯ ), and error bars give the 95% CIs. CIs crossing the black line at 100% indicate no significant difference between pCO2 treatment and control (a and b) or high and low temperature treatments (c). Values less than 100% indicate that either the elevated pCO2 or the high temperature treatment resulted in lower values compared to the respective control. Asterisks (∗) indicate statistically significant effects, i.e., when the 95% CIs did not cross the 100% line. Note the different logarithmic scales on y-axes.
Water 05 01890 g003
Table 2. Analysis of Covariance parameters for sperm swimming speed (Speed) and percentage of motile sperm (Motility), and regression analysis parameters for Ln response ratio Ln ( R ¯ ) of sperm swimming speed and percentage of motile sperm. Time (h) means hours from spawning, and pCO2 (TSW) is the independent variable and states the estimated difference from control pCO2 conditions. Df means degrees of freedom and SE standard error.
ResponseFactorDfEstimateSEt valuePR2
SpeedIntercept41.204.598.97<0.001
time (h)1−3.201.52−2.100.047
pCO2 (TSW)1−8.562.492−3.440.002
Residuals236.35
Total250.0020.41
MotilityIntercept56.179.735.77<0.001
time (h)1−2.873.21−0.890.382
pCO2 (TSW)1−19.985.28−3.78<0.001
Residuals2313.46
Total250.0030.40
Ln ( R ¯ Speed ) Intercept79.0412.126.52<0.001
time (h)1−1.624.16−0.390.704
Residuals1112.30
Total120.7040.01
Ln ( R ¯ Motility ) Intercept91.7524.703.720.003
time (h)1−12.618.48−1.490.165
Residuals1125.07
Total120.1650.17
Temperature significantly increased larval metabolism in both pCO2 treatments ( R ¯ CSW = 481% and R ¯ TSW = 378%), although the 95% CIs around the mean response ratios were broad ( R ¯ CSW = 122%–1900% and R ¯ TSW = 121%–1181%). Temperature had a positive mean effect on calcification (348%), but the effect was not as strong in the high pCO2 treatment as in the low pCO2 treatment ( R ¯ CSW = 435% and R ¯ TSW = 260%). Variation in calcification rate with temperature was high as indicated by very large 95% CIs (RCSW = 128%–1480% and RTSW = 20%–3334%). Despite this high variability, there was a significant effect of temperature at control levels of pCO2, while the effect of temperature on calcification rate at high pCO2 was non-significant. Larval survival declined at higher temperatures ( R ¯ CSW = 68% and R ¯ TSW = 71%), although the response ratios were marginally non-significant (RCSW = 46%–100% and RTSW = 46%–108%). The relatively large effect size and consistent differences between treatment and control cylinders for larval survival (see Figure A2) suggest that the statistical non-significance was due to the conservative method for calculating 95% CIs (i.e., if the method from [53] had been used directly, 95% CIs would have been RCSW = 50%–91% and RTSW = 51%–97%). In contrast, the effect sizes of temperature on larval size were small ( R ¯ CSW = 88% and R ¯ TSW = 93%), but statistically significant for control pCO2 due to narrow 95% CIs (RCSW = 81%–95% and RTSW = 83%–104%).

4. Discussion

4.1. Carbonate System

Open ocean, near-surface, pH values in the Western Mediterranean varied between 8.05 and 8.23 on the NBS scale in 1970s [57], and average surface pCO2 vary between 395 and 442 μatm [17]. Our experimental values (Figure 2) for control cylinders are close to these historical values, and treatment pH values are slightly lower than open ocean scenarios for the end of 2100 [5], yet within a reasonable range considering the variability of pH values in coastal systems [17,19,58]. Ocean pH can be highly variable in near-shore locations: Hofmann et al. [18] reports daily variations of 0.2–0.3 pH units for estuarine/near-shore locations and stochastic short term variations of more than 0.6 units. Therefore, it is possible that M. galloprovincialis populations may already experience treatment pH values for short periods [19]. The gradually decreasing trend of pH values in the high pCO2 treatment (Figure 2) may have reduced the potential pH shock experienced by the embryos and led to a gradual acclimation as recommended by Riebesell et al. [59].
The use of a commercial salt mixture (Instant Ocean) led to approximately 500–750 μ kg−1 higher total alkalinity (AT) and dissolved organic carbon (DIC) values in control cylinders than has been measured for the Mediterranean Sea [57,60,61] (Table 1). Furthermore, DIC and AT remained at higher levels in both control and treatment cylinders compared to the predictions for the end of the 21st century [62]. Despite these high values, aragonite saturation state (ΩAr) remained within an expected range in control [57,60] and treatment [62] cylinders. Whereas pH values were within an expected range, pCO2 values were higher both in control [57] and treatment [62] than expected, indicating that a higher amount of CO2 was required to acidify water in this experiment [51], hence explaining the high DIC values. Although we are not aware of any mechanisms by which AT directly affects fertilization or early development of bivalve larvae, it is possible that our ΩAr for pCO2 treatments would have been lower had we not used artificial seawater. Consequently, high AT could partly explain the lack of significant pCO2 effects on calcification and shell growth (see Section 4.3.1. and Section 4.3.3.) as discussed by Range et al. [63]. On the contradictory, higher concentration of CO2 could have caused an increased stress to the larvae [58,64], which could potentially increase the probability of detecting a pCO2 effect on larval growth and calcification. Nevertheless, high AT must be considered as an explanation contributing to our lack of significant effects.

4.2. Acidification Effects on Sperm Activity

We found a significant 25% reduction in percentage of motile sperm and sperm swimming speed as a result of elevated pCO2 (Figure 3a). Reports for sea-urchins suggest sperm motility is negatively impacted by acidification [35,65]. Negative effects of OA on sperm motility have also been reported for corals and sea cucumbers [66,67], while positive effects have been reported in one species of sea urchin [39]. Reduced sperm swimming performance in marine broadcast spawners is likely to decrease fertilization in sperm limited low density populations [68,69,70,71,72,73]. However, fertilization in broadcast spawners is a complex process affected by a range of parameters, such as egg size [68], gamete age [74], distance between individuals [75], chemical signals [76], gamete compatibility [77], and water movements [78,79]. Predicting how reduced sperm swimming performance will impact fertilization success in a population, let alone the entire geographical range of a species, therefore, requires knowledge of the particular habitat the population is occupying. Nonetheless, the large changes in sperm swimming performance observed in our experiments are likely to have flow-on effects for fertilization success in free-spawning species such as M. galloprovincialis as the ocean pH decreases. Although temperature was not included in our sperm activity assessment, temperatures outside of a species’ optimal range are likely to lead to a reduced sperm fertilization capability. Higher temperatures might also increase the swimming speed and decrease the longevity of sperm [72,80].
A potential bias in this study was caused by us not using ‘dry-sperm’, but introducing spawning with a temperature shock. This resulted in sperm being activated only at control pH and temperature, and lead to a variable time lag (1–4.5 h) between recording of sperm activity and activation of sperm. Although similar method has been used previously [67,73] in sperm studies, we have no way knowing to what degree, if any the pH shock affected sperm activity. Further studies are needed to judge whether this could cause a significant bias. Although the time lag had a significant effect on sperm swimming speed (Table 2), the rate at which the sperm swimming speed declined did not significantly differ between treatment and control. This makes us relatively confident that the observed effect was not caused by the time lag between sperm activity measurements and sperm activation.

4.3. Overall Effects in the Larval Experiment

We did not observe significant interactions between pH and temperature treatments (Table A1). Overall, warming had a more prominent effect on larval stages than pCO2, reducing performance (growth and survival) and increasing energy demand (respiration and calcification) (Figure 3b,c). Although the temperature effect is dependent on a species optimal temperature range, this finding is generally in line with observations on calcifying larvae [12,16]. We did not observe significant effects of pCO2 on larval survival, size, respiration or calcification (Figure 3b).

4.3.1. Acidification Effects on Larval Survival and Size

Relatively narrow 95% CIs and small effect sizes of pCO2 for larval survival and size indicate that the lack of a significant response is not due to high variability in measured values, and that pCO2 is likely to have a negligible effect for these variables (Figure 3b). The lack of a pCO2 effect on larval survival is supported by Gazeau et al. [33], who found no effect for Mytilus edulis for the near-future pH range evaluated in this study. In contrast, increased pCO2 over a range predicted to occur by 2100 has been reported to reduce larval growth of Mytilus (Figure 4). These effects [33,34,81] fall within the 95% CIs of our study indicating that our study design may not have been able to detect such small effects. Three studies with comparable ΔpH [33,34,82] had all lower ΩAr values for pCO2 treatments than we measured, highlighting the possibility that the usage of artificial seasalt might have attenuated the detrimental effect of pCO2 treatment on larval calcification. Also, the short development time (55 h, until late trochophore—early D-veliger) could explain the lack of a significant effect in this study, although Gazeau et al. [33] found a significant effect already after 48 h of development in M. edulis. Bechmann et al. [82] reported a significant reduction in larval growth of M. edulis over a greater ΔpH than used in in this study. Reanalysis of their data using mean and standard deviation values for number of chambers (n = 7) as replicates (avoiding pseudoreplication [83,84]) gives a considerable negative effect size, but with large 95% CIs that indicate a non-significant effect of pCO2 (Figure 4). From the few studies conducted across the Mytilus genus, it appears that larval growth is reduced by approximately 5% for a ∼0.3 unit decrease in pH, which is within the range of fossil fuel intensive ICPP scenarios for 2100 [5]. It is not until OA levels beyond those estimated for 2100 that growth is reduced by more than 10%.
Figure 4. Mean effect size of pCO2 on growth of Mytilus larvae 48–360 h after fertilization extracted from five experimental studies. Colors and symbols represent different studies. Abbreviation after the reference in legend indicates the studied species (MG = M. galloprovincialis, ME = M. edulis, MC = M. californianus, and MT = M. trossulus). Double point for a single pH difference in a study indicates the effect measured at different times during the experiment (darker hue pinpoints the later measurement). Error bars show the 95% CIs estimated assuming a normal distribution. Rectangles with grey shading illustrate the range of IPCC SRES projected global average surface pH pathways (2100 range) [5,85] and projected IS92a maximum pH reduction following the burning of the remaining fossil-fuel resources (Max) [1]. Red points [82] have been recalculated to reflect proper levels of replication (see Section 4.3.1.).
Water 05 01890 g004
This does present a paradox as near-shore Mytilus habitats are naturally exposed to such daily to seasonal pH differences due to metabolic activity of organisms in the euphotic zone, and fresh-water discharge [18,19,58,86,87]. Pelagic larval stages may be a strategy to avoid such pH fluctuations during development, resulting in their continued sensitivity to experimental OA. Consequently, the pH variability might contribute to inter-population and site-specific variation in Mytilus reproductive success. It should be noted however, that the meta-analysis presented in Figure 4 does not consider long-term effects [88], genetic variability [81], trans-generational effects [89], nor effects of adult exposure during reproductive conditioning [90]. It is possible that the effect of OA in the figure is over-stated, and that the Mediterranean population of M. galloprovincialis is more adapted to variable pH regime than populations that experience less pH variation. However, if Mytilus populations were not able to adapt to decreasing pH, ocean acidification may subject Mytilus larvae to even lower pH values, and larger fluctuations, than currently experienced, with potential negative consequences.

4.3.2. Temperature Effects on Metabolism, Larval Survival and Size

Positive effects of temperature on respiration rates are consistent with known effects of temperature on ectotherm metabolism [91,92,93], and demonstrate that our experimental design was capable of detecting differences, even when variation among replicates was high for some response variables (Figure 3c). We found modest negative mean effects of warming on larval survival and size (=growth) between 17 °C (TLow) and 20 °C (THigh), although the effect size of temperature on larval size was only around 10% and the effect of larval survival was barely non-significant. These negative effects are in contrast to those reported by Sánchez-Lazo and Martínez-Pita [94], who found increased larval performance (increased growth and survival, and faster development) for M. galloprovincialis larvae grown at warmer temperatures (20 or 24 °C instead of 17 °C. Sánchez-Lazo and Martínez-Pita [94] tested larvae from mussels growing in Southern Andalucia, approximately 900 km southwest of the site in Menorca where our mussels were collected. Optimal growth temperatures of 20–25 °C for M. galloprovincialis larvae have been reported by several studies [95,96,97], however, the performance of M. galloprovincialis larvae is known to vary depending on the population even within a small geographical range [98,99]. Both adult and larvae of M. galloprovincialis seem to be sensitive to temperatures higher than 24–26 °C, after which the growth decreases and mortality increases [14,95,100]. Adaptation of M. galloprovincialis populations to temperatures of their respective habitats could explain the observed difference between previous studies [94,95,96,97] and our results.

4.3.3. Calcification

The response of calcification to increased pCO2 was non-significant (Figure 3b), while the effect of temperature was accompanied by large effect sizes, which were significant under control conditions and non-significant in the high pCO2 treatment (Figure 3c). Aragonite saturation (ΩAr) values for the high pCO2 treatment cylinders varied between 1.6 and 2.0. These values are above saturation (1), but within a range expected for 2100 (see Section 4.1). Studies have reported generally negative relationships between calcification rate and saturation state the effects starting well before under-saturation [31,101,102,103]. Gazeau et al. [103] demonstrated a linearly declining calcification rate with increasing pCO2 on adult and juvenile M. edulis, with significant negative effects starting at ΩAr values similar to our treatment values. The effect sizes calculated from Gazeau et al. [103] for treatment ΩAr values between 1.6 and 2.0 are within the 95% CIs in our study indicating that the variability in our calcification results may mask biologically relevant effects. However, it should be noted that Gazeau et al. [103] studied adults during two hour incubations, and these results may not be directly comparable to ours.
It is more likely that our results reflect a biologically relevant signal for the studied ΩAr values. Calcification measurements were conducted 48–55 h after fertilization, when most larvae were in late trochophore stage with occasional early D-veligers (Figure 1). Although M. galloprovincialis larvae in late veliger stage are known to calcify [104], their calcification rate is likely much lower compared to D-veliger stage [32]. Hence, D-veligers could be responsible for most of the calcification measured in the cylinders, and uneven number of them among cylinders could explain the high variability in the calcification data. Temperature, however, seems to have a negative effect on calcification starting already at the early stages in this study. Malone and Dodd [105] reported a positive effect of temperature on calcification rates of adult M. edulis, but also that variability among individuals increased strongly with increasing temperature. This variation was partly explained by some individuals that did not calcify during the 24-h experimental period. Large variation is also evident in our data, both for temperature and pCO2 effects, although the increasing variation with temperature is not strongly supported (Figure A2). Our results are in conflict with Duarte et al. [106], who found a decreasing net calcification rate with increasing pCO2 and no temperature effect on juvenile Mytilus chilensis. This suggests that there may be an interspecific or life-stage dependent response to temperature within the Mytilus genus.
The method we used to measure calcification (microdiffusion technique using radiolabeled 14C bicarbonate as a substrate) was developed for phytoplankton [45] and relies on the assumption that calcifiers are evenly distributed in the sampling population. We extracted small subsamples (40 mL each) from each cylinder using two subsamples as replicates assuming an even distribution of bivalve larvae in the cylinders. This is a reasonable assumption as the bubbling design should have mixed the larvae evenly, but it is possible that our subsamples did not contain a similar number of larvae, as it was not possible to count the number of larvae in the subsamples. However, as calcification values varied ten-fold between replicates (Figure A2), it is unlikely that the subsampling explains all of the variation between replicates.

5. Conclusions

Although M. galloprovincialis is already likely to be exposed for short periods to pH values corresponding to the treatments in this study, we found a substantial reduction in sperm activity when exposed to the high pCO2 treatment. Even though we cannot demonstrate that this reduction translates into lower fertilization success, modeling and experimental manipulations show that such a reduction typically leads to poorer fertilization ability of sperm in low sperm concentrations [65,68,69]. Our results from the larval study indicate that ocean warming may have a larger negative effect on very early life-stages (until late trochophore—early D-veliger) of M. galloprovincialis than near-future OA. Nevertheless, the negative effects of temperature on larval survival and size are in contrast with earlier studies showing the optimal temperature range of M. galloprovincialis to be between 20 and 25 °C [94,95,96,97]. These results may indicate variability among populations of M. galloprovincialis as a factor that should also be considered when assessing the impact of climate change on species and ecosystems [84]. Mytilus species are naturally exposed to a highly variable pH regime [19,87], and spatial and temporal variability in pH may contribute to inter-population and site-specific variation in this mortality. Ocean acidification, even though not the main source of reduced performance and decreased growth in our experiments, might act synergistically with the stress of expected temperature increases to negatively affect the early life-stages of M. galloprovincialis. As the pelagic phase is crucial for maintaining populations and dispersal of this species [107], these impacts may have repercussions at the population level in the future. Because genetically inherited traits play a key role in recruitment processes for benthic species with planktonic larvae [108], genotypes more resistant to OA and warming will be favored in the future, which, in turn, could alter the population sensitivity to future environmental fluctuations. Our results provide an insight into a subset of a M. galloprovincialis population from a commercial farm in the Mediterranean. Considering the conflicting results by studies on Mytilus, more research is needed to provide a robust synthesis on climate change effects on this wide-spread, ecologically and commercially important genus. The future studies should test the individual variability with respect to increased pCO2 and temperature, and consider habitat-specific variation in pH values for the study organism.

Acknowledgments

This research was financed through the EU 7th Framework Program projects Arctic Tipping Points (contract number FP7-ENV-2009-226248) and MedSEA (FP7-ENV-2010-265103), the Fram Centre Ocean Acidification Flagship, the Linnaeus Centre for Marine Evolutionary Biology, the Spanish Ministry of Economy and Competitivity project ESTRESX (CTM2012-32603), and University of Tromsø Open Access Fund. We thank Inés Mazarassa, Martina Jönsson, Clara Gallego and Regino Martinez for their invaluable help in the laboratory, and Amanda Dorsett for providing the Table of Contents Graphic. We are grateful to Marianne Frantzen for loan of camera equipment and guidance with sperm motility assessment.

Conflicts of Interest

The authors declare no conflict of interest.

References

  1. Caldeira, K.; Wickett, M.E. Oceanography: Anthropogenic carbon and ocean pH. Nature 2003, 425, 365. [Google Scholar] [CrossRef] [PubMed]
  2. Hoegh-Guldberg, O.; Bruno, J.F. The impact of climate change on the world’s marine ecosystems. Science 2010, 328, 1523–1528. [Google Scholar] [CrossRef] [PubMed]
  3. Doney, S.C.; Ruckelshaus, M.; Duffy, J.E.; Barry, J.P.; Chan, F.; English, C.A.; Galindo, H.M.; Grebmeier, J.M.; Hollowed, A.B.; Knowlton, N.; et al. Climate change impacts on marine ecosystems. Annu. Rev. Mar. Sci. 2012, 4, 11–37. [Google Scholar] [CrossRef] [PubMed] [Green Version]
  4. Intergovernmental Panel on Climate Change (IPCC). Climate Change 2007: Synthesis Report. Contribution of Working Groups I, II and III to the Fourth Assessment Report of the Intergovernmental Panel on Climate Change; IPCC: Geneva, Switzerland, 2007; pp. 1–104. [Google Scholar]
  5. Meehl, G.A.; Stocker, T.F.; Collins, W.D.; Friedlingstein, P.; Gaye, A.; Gregory, J.M.; Kitoh, A.; Knutti, R.; Murphy, J.M.; Noda, A.; et al. Global Climate Projections. In Climate Change 2007: The Physical Science Basis. Contribution of Working Group I to the Fourth Assessment Report of the Intergovernmental Panel on Climate Change; Solomon, S., Qin, D., Manning, M., Chen, Z., Marquis, M., Averyt, K.B., Tignor, M., Miller, H.L., Eds.; Cambridge University Press: Cambridge, UK; New York, NY, USA, 2007; pp. 749–845. [Google Scholar]
  6. Orr, J.C. Recent and Future Changes in Ocean Carbonate Chemistry. In Ocean Acidification, 1st ed.; Gattuso, J.P., Hansson, L., Eds.; Oxford University Press: New York, NY, USA, 2011; pp. 41–63. [Google Scholar]
  7. Kroeker, K.J.; Kordas, R.L.; Crim, R.; Hendriks, I.E.; Ramajo, L.; Singh, G.S.; Duarte, C.M.; Gattuso, J.P. Impacts of ocean acidification on marine organisms: Quantifying sensitivities and interaction with warming. Glob. Chang. Biol. 2013, 19, 1884–1896. [Google Scholar] [CrossRef] [PubMed]
  8. Hendriks, I.; Duarte, C.; Álvarez, M. Vulnerability of marine biodiversity to ocean acidification: A meta-analysis. Estuar. Coast. Shelf Sci. 2010, 86, 157–164. [Google Scholar] [CrossRef]
  9. Dupont, S.; Dorey, N.; Thorndyke, M. What meta-analysis can tell us about vulnerability of marine biodiversity to ocean acidification? Estuar. Coast. Shelf Sci. 2010, 89, 182–185. [Google Scholar] [CrossRef]
  10. Ross, P.M.; Parker, L.; O’Connor, W.A.; Bailey, E.A. The impact of ocean acidification on reproduction, early development and settlement of marine organisms. Water 2011, 3, 1005–1030. [Google Scholar] [CrossRef]
  11. Kroeker, K.J.; Kordas, R.L.; Crim, R.N.; Singh, G.G. Meta-analysis reveals negative yet variable effects of ocean acidification on marine organisms. Ecol. Lett. 2010, 13, 1419–1434. [Google Scholar] [CrossRef] [PubMed]
  12. Byrne, M. Impact of OceanWarming and Ocean Acidification on Marine Invertebrate Life History Stages: Vulnerabilities and Potential for Persistence in a Changing Ocean. In Oceanography and Marine Biology—An Annual Review; Gibson, R.N., Atkinson, R.J.A., Gordon, J.D.M., Eds.; CRC Press: Boca Raton, FL, US, 2011; Volume 49, pp. 1–42. [Google Scholar]
  13. Somero, G.N. Thermal physiology and vertical zonation of intertidal animals: Optima, limits, and costs of living. Integr. Comp. Biol. 2002, 42, 780–789. [Google Scholar] [CrossRef] [PubMed]
  14. Anestis, A.; Lazou, A.; Pörtner, H.O.; Michaelidis, B. Behavioral, metabolic, and molecular stress responses of marine bivalve Mytilus galloprovincialis during long-term acclimation at increasing ambient temperature. Am. J. Physiol. Reg. I 2007, 293, R911–R921. [Google Scholar] [CrossRef] [PubMed]
  15. Harley, C.D.G.; Randall Hughes, A.; Hultgren, K.M.; Miner, B.G.; Sorte, C.J.B.; Thornber, C.S.; Rodriguez, L.F.; Tomanek, L.; Williams, S.L. The impacts of climate change in coastal marine systems. Ecol. Lett. 2006, 9, 228–241. [Google Scholar] [CrossRef] [PubMed]
  16. Byrne, M.; Przeslawski, R. Multistressor impacts of warming and acidification of the ocean on marine invertebrates’ life histories. Integr. Comp. Biol. 2013, 53, 582–596. [Google Scholar] [CrossRef] [PubMed]
  17. McElhany, P.; Shallin Busch, D. Appropriate pCO2 treatments in ocean acidification experiments. Mar. Biol. 2012, 159, 1–6. [Google Scholar] [CrossRef]
  18. Hofmann, G.E.; Smith, J.E.; Johnson, K.S.; Send, U.; Levin, L.A.; Micheli, F.; Paytan, A.; Price, N.N.; Peterson, B.; Takeshita, Y.; et al. High-frequency dynamics of ocean pH: A multi-ecosystem comparison. PLoS One 2011, 6, e28983:1–e28983:11. [Google Scholar]
  19. Duarte, C.M.; Hendriks, I.E.; Moore, T.S.; Olsen, Y.S.; Steckbauer, A.; Ramajo, L.; Carstensen, J.; Trotter, J.A.; McCulloch, M. Is ocean scidification an open-ocean syndrome? Understanding anthropogenic impacts on seawater pH. Estuar. Coasts 2013, 36, 221–236. [Google Scholar] [CrossRef]
  20. Thomsen, J.; Gutowska, M.A.; Saphörster, J.; Heinemann, A.; Trübenbach, K.; Fietzke, J.; Hiebenthal, C.; Eisenhauer, A.; Körtzinger, A.; Wahl, M.; et al. Calcifying invertebrates succeed in a naturally CO2-rich coastal habitat but are threatened by high levels of future acidification. Biogeosciences 2010, 7, 3879–3891. [Google Scholar] [CrossRef] [Green Version]
  21. Soot-Ryen, T. A report on the family Mytilidae (Pelecypoda). Allan Hancock Pacif. Exped. 1955, 20, 1–175. [Google Scholar]
  22. Seed, R. Ecology. In Marine Mussels, Their Ecology and Physiology; Bayne, B.L., Ed.; Cambridge University Press: London, UK, 1976; pp. 13–66. [Google Scholar]
  23. Gosling, E.M. The systematic status of Mytilus galloprovincialis in Western Europe. Malacologia 1984, 25, 551–568. [Google Scholar]
  24. Invasive Species Specialist Group Homepage. Available online: http://www.issg.org/ (accessed on 31 March 2013).
  25. Dodd, J. Environmentally controlled variation in the shell structure of a pelecypod species. J. Paleontol. 1964, 38, 1065–1071. [Google Scholar]
  26. Fuller, S.; Lutz, R. Early shell mineralogy, microstructure, and surface sculpture in five mytilid species. Malacologia 1988, 29, 363–371. [Google Scholar]
  27. Andersson, A.J.; Mackenzie, F.T.; Gattuso, J.P. Effects of Ocean Acidification on Benthic Processes, Organisms, and Ecosystems. In Ocean Acidification, 1st ed.; Gattuso, J.P., Hansson, L., Eds.; Oxford University Press: New York, NY, USA, 2011; pp. 140–141. [Google Scholar]
  28. Navarro, J.M.; Torres, R.; Acuña, K.; Duarte, C.; Manriquez, P.H.; Lardies, M.; Lagos, N.A.; Vargas, C.; Aguilera, V. Impact of medium-term exposure to elevated pCO2 levels on the physiological energetics of the mussel Mytilus chilensis. Chemosphere 2012, 90, 1242–1248. [Google Scholar] [CrossRef] [PubMed]
  29. Thomsen, J.; Melzner, F. Moderate seawater acidification does not elicit long-term metabolic depression in the blue mussel Mytilus edulis. Mar. Biol. 2010, 157, 2667–2676. [Google Scholar]
  30. Fernández-Reiriz, M.J.; Range, P.; Álvarez Salgado, X.A.; Espinosa, J.; Labarta, U. Tolerance of juvenile Mytilus galloprovincialis to experimental seawater acidification. Mar. Ecol. Prog. Ser. 2012, 454, 65–74. [Google Scholar]
  31. Ries, J.B.; Cohen, A.L.; McCorkle, D.C. Marine calcifiers exhibit mixed responses to CO2-induced ocean acidification. Geology 2009, 37, 1131–1134. [Google Scholar] [CrossRef]
  32. Kurihara, H.; Asai, T.; Kato, S.; Ishimatsu, A. Effects of elevated pCO2 on early development in the mussel Mytilus galloprovincialis. Aquat. Biol. 2008, 4, 225–233. [Google Scholar] [CrossRef]
  33. Gazeau, F.; Gattuso, J.P.; Dawber, C.; Pronker, A.E.; Peene, F.; Peene, J.; Heip, C.H.R.; Middelburg, J.J. Effect of ocean acidification on the early life stages of the blue mussel Mytilus edulis. Biogeosciences 2010, 7, 2051–2060. [Google Scholar]
  34. Gaylord, B.; Hill, T.M.; Sanford, E.; Lenz, E.A.; Jacobs, L.A.; Sato, K.N.; Russell, A.D.; Hettinger, A. Functional impacts of ocean acidification in an ecologically critical foundation species. J. Exp. Biol. 2011, 214, 2586–2594. [Google Scholar]
  35. Havenhand, J.N.; Buttler, F.R.; Thorndyke, M.C.; Williamson, J.E. Near-future levels of ocean acidification reduce fertilization success in a sea urchin. Curr. Biol. 2008, 18, 651–652. [Google Scholar]
  36. Foo, S.A.; Dworjanyn, S.A.; Poore, A.G.B.; Byrne, M. Adaptive capacity of the habitat modifying sea urchin Centrostephanus rodgersii to ocean warming and ocean acidification: Performance of early embryos. PLoS One 2012, 7, e42497:1–e42497:9. [Google Scholar]
  37. Schlegel, P.; Havenhand, J.N.; Gillings, M.R.; Williamson, J.E. Individual variability in reproductive success determines winners and losers under ocean acidification: A case study with sea urchins. PLoS One 2012, 7, e53118:1–e53118:8. [Google Scholar]
  38. Barros, P.; Sobral, P.; Range, P.; Chícharo, L.; Matias, D. Effects of sea-water acidification on fertilization and larval development of the oyster Crassostrea gigas. J. Exp. Mar. Biol. Ecol. 2013, 440, 200–206. [Google Scholar]
  39. Caldwell, G.S.; Fitzer, S.; Gillespie, C.S.; Pickavance, G.; Turnbull, E.; Bentley, M.G. Ocean acidification takes sperm back in time. Invertebr. Reprod. Dev. 2011, 55, 217–221. [Google Scholar]
  40. His, E.; Seaman, M.N.L.; Beiras, R. A simplification the bivalve embryogenesis and larval development bioassay method for water quality assessment. Water Res. 1997, 31, 351–355. [Google Scholar]
  41. Tans, P.; Keeling, R. Trends in Atmospheric Carbon Dioxide. Available online: http://www.esrl.noaa.gov/gmd/ccgg/trends/ (accessed on 31 March 2013).
  42. Honkoop, P.J.C.; Luttikhuizen, P.C.; Piersma, T. Experimentally extending the spawning season of a marine bivalve using temperature change and fluoxetine as synergistic triggers. Mar. Ecol. Prog. Ser. 1999, 180, 297–300. [Google Scholar]
  43. Havenhand, J.N.; Schlegel, P. Near-future levels of ocean acidification do not affect sperm motility and fertilization kinetics in the oyster Crassostrea gigas. Biogeosciences 2009, 6, 3009–3015. [Google Scholar]
  44. Hinting, A.; Comhaire, F.; Schoonjans, F. Capacity of objectively assessed sperm motility characteristics in differentiating between semen of fertile and subfertile men. Ferlil. Steril. 1988, 20, 635–639. [Google Scholar]
  45. Paasche, E.; Brubak, S. Enhanced calcification in the coccolithophorid Emiliania huxleyi (Haptophyceae) under phosphorus limitation. Phycologia 1994, 33, 324–330. [Google Scholar]
  46. Parsons, T.R.; Maita, Y.; Lalli, C.M. A Manual of Chemical and Biological Methods for Seawater Analysis, 1st ed.; Pergamon Press: New York, NY, USA, 1984; pp. 1–173. [Google Scholar]
  47. Carpenter, J.H. The Chesapeake Bay Institute technique for the Winkler dissolved oxygen method. Limnol. Oceanogr. 1965, 10, 141–143. [Google Scholar]
  48. Labasque, T. Spectrophotometric Winkler determination of dissolved oxygen: Re-examination of critical factors and reliability. Mar. Chem. 2004, 88, 53–60. [Google Scholar]
  49. Department of Energy. Recommended Standard Operating Procedures (SOPs). In Handbook of Methods for the Analysis of the Various Parameter of the Carbon Dioxide System in Sea Water, 2nd ed.; Dickson, A.G., Goyet, C., Eds.; ORNL/CDIAC-74: Oak Ridge, TN, US, 1994; pp. 30–96. [Google Scholar]
  50. Lewis, E.; Wallace, D. Program Developed for CO2 System Calculations; Carbon Dioxide Information Analysis Center, Oak Ridge National Laboratory: Oak Ridge, TN, USA, 1998; pp. 1–21. [Google Scholar]
  51. Gattuso, J.P.; Hansson, L. Ocean Acidification: Background and History. In Ocean Acidification, 1st ed.; Gattuso, J.P., Hansson, L., Eds.; Oxford University Press: New York, NY, USA, 2011; pp. 1–20. [Google Scholar]
  52. Nakagawa, S.; Cuthill, I.C. Effect size, confidence interval and statistical significance: A practical guide for biologists. Biol. Rev. Camb. Philos. 2007, 82, 591–605. [Google Scholar]
  53. Hedges, L.V.; Gurevitch, J.; Curtis, P.S. The meta-analysis of response ratios in experimental ecology. Ecology 1999, 80, 1150–1156. [Google Scholar]
  54. Ahrens, W.H.; Cox, D.J.; Budhwar, G. Use of the arcsine and square root transformations for subjectively determined percentage data. Weed Sci. 1990, 38, 452–458. [Google Scholar]
  55. R Core Team. R: A Language and Environment for Statistical Computing; R Foundation for Statistical Computing: Vienna, Austria, 2013. [Google Scholar]
  56. Wickham, H. ggplot2: Elegant Graphics for Data Analysis, 1st ed.; Springer: New York, NY, USA, 2009; pp. 1–211. [Google Scholar]
  57. Millero, F.; Morse, J.; Chen, C. The carbonate system in the western Mediterranean Sea. Deep Sea Res. 1979, 26A, 1395–1404. [Google Scholar]
  58. Melzner, F.; Thomsen, J.; Koeve, W.; Oschlies, A.; Gutowska, M.A.; Bange, H.W.; Hansen, H.P.; Körtzinger, A. Future ocean acidification will be amplified by hypoxia in coastal habitats. Mar. Biol. 2013, 160, 1875–1888. [Google Scholar] [CrossRef]
  59. Guide to Best Practices for Ocean Acidification Research and Data Reporting; Riebesell, U.; Fabry, V.; Hansson, L.; Gattuso, J. (Eds.) Publications Office of the European Union: Luxembourg, 2010; pp. 1–260.
  60. Schneider, A.; Wallace, D.W.R.; Körtzinger, A. Alkalinity of the Mediterranean Sea. Geophys. Res. Lett. 2007, 34, L15608:1–L15608:5. [Google Scholar] [CrossRef]
  61. Gazeau, F.; Duarte, C.M.; Gattuso, J.P.; Barrón, C.; Navarro, N.; Ruíz, S.; Prairie, Y.T.; Calleja, M.; Delille, B.; Frankignoulle, M.; et al. Whole-system metabolism and CO2 fluxes in a Mediterranean Bay dominated by seagrass beds (Palma Bay, NW Mediterranean). Biogeosciences 2005, 2, 43–60. [Google Scholar] [CrossRef]
  62. Gattuso, J.P.; Lavigne, H. Technical note: Approaches and software tools to investigate the impact of ocean acidification. Biogeosciences 2009, 6, 2121–2133. [Google Scholar] [CrossRef]
  63. Range, P.; Piló, D.; Ben-Hamadou, R.; Chícharo, M.; Matias, D.; Joaquim, S.; Oliveira, A.; Chícharo, L. Seawater acidification by CO2 in a coastal lagoon environment: Effects on life history traits of juvenile mussels Mytilus galloprovincialis. J. Exp. Mar. Biol. Ecol. 2012, 424–425, 89–98. [Google Scholar] [CrossRef]
  64. Pörtner, H. Ecosystem effects of ocean acidification in times of ocean warming: A physiologist’s view. Mar. Ecol. Prog. Ser. 2008, 373, 203–217. [Google Scholar] [CrossRef]
  65. Reuter, K.E.; Lotterhos, K.E.; Crim, R.N.; Thompson, C.A.; Harley, C.D.G. Elevated pCO2 increases sperm limitation and risk of polyspermy in the red sea urchin Strongylocentrotus franciscanus. Glob. Chang. Biol. 2011, 17, 163–171. [Google Scholar] [CrossRef]
  66. Nakamura, M.; Morita, M. Sperm motility of the scleractinian coral Acropora digitifera under preindustrial, current, and predicted ocean acidification regimes. Aquat. Biol. 2012, 15, 299–302. [Google Scholar] [CrossRef]
  67. Morita, M.; Suwa, R.; Iguchi, A.; Nakamura, M.; Shimada, K.; Sakai, K.; Suzuki, A. Ocean acidification reduces sperm flagellar motility in broadcast spawning reef invertebrates. Zygote 2010, 18, 103–107. [Google Scholar] [CrossRef] [PubMed]
  68. Vogel, H.; Czihak, G.; Chang, P.; Wolf, W. Fertilization kinetics of sea urchin eggs. Math. Biosci. 1982, 58, 189–216. [Google Scholar] [CrossRef]
  69. Styan, C.A. Polyspermy, egg size, and the fertilization kinetics of free-spawning marine invertebrates. Am. Nat. 1998, 152, 290–297. [Google Scholar] [CrossRef] [PubMed]
  70. Albright, R.; Mason, B. Projected near-future levels of temperature and pCO2 reduce coral fertilization success. PLoS One 2013, 8, e56468:1–e56468:8. [Google Scholar]
  71. Levitan, D.R.; Petersen, C. Sperm limitation in the sea. Trends Ecol. Evol. 1995, 10, 228–231. [Google Scholar] [CrossRef]
  72. Levitan, D.R. Sperm velocity and longevity trade off each other and influence fertilization in the sea urchin Lytechinus variegatus. Proc. R. Soc. B 2000, 267, 531–534. [Google Scholar] [CrossRef] [PubMed]
  73. Stewart, D.T.; Jha, M.; Breton, S.; Hoeh, W.R.; Blier, P.U. No effect of sperm interactions or egg homogenate on sperm velocity in the blue mussel, Mytilus edulis (Bivalvia: Mytilidae). Can. J. Zool. 2012, 90, 1291–1296. [Google Scholar] [CrossRef]
  74. Williams, M.E.; Bentley, M.G. Fertilization success in marine invertebrates: The influence of gamete age. Biol. Bull. 2002, 202, 34–42. [Google Scholar] [CrossRef] [PubMed]
  75. Pennington, J.T. The ecology of fertilization of echinoid eggs: The consequences of sperm dilution, adult aggregation, and synchronous spawning. Biol. Bull. 1985, 169, 417–430. [Google Scholar] [CrossRef]
  76. Evans, J.P.; Sherman, C.D.H. Sexual selection and the evolution of egg-sperm interactions in broadcast-spawning invertebrates. Biol. Bull. 2013, 224, 166–183. [Google Scholar] [PubMed]
  77. Palumbi, S.R. All males are not created equal: Fertility differences depend on gamete recognition polymorphisms in sea urchins. Proc. Natl. Acad. Sci. USA 1999, 96, 12632–12637. [Google Scholar] [CrossRef] [PubMed]
  78. Levitan, D.R.; Sewell, M.A.; Chia, F.S. How distribution and abundance influence fertilization success in the sea urchin Strongylocentotus franciscanus. Ecology 1992, 73, 248–254. [Google Scholar] [CrossRef]
  79. Crimaldi, J.P.; Zimmer, R.K. The physics of broadcast spawning in benthic invertebrates. Annu. Rev. Mar. Sci. 2014, 6. [Google Scholar] [CrossRef] [PubMed]
  80. Kupriyanova, E.K.; Havenhand, J.N. Effects of temperature on sperm swimming behaviour, respiration and fertilization success in the serpulid polychaete, Galeolaria caespitosa (Annelida: Serpulidae). Invertebr. Reprod. Dev. 2005, 48, 7–17. [Google Scholar] [CrossRef]
  81. Sunday, J.M.; Crim, R.N.; Harley, C.D.G.; Hart, M.W. Quantifying rates of evolutionary adaptation in response to ocean acidification. PLoS One 2011, 6, e22881:1–e22881:8. [Google Scholar] [CrossRef] [PubMed]
  82. Bechmann, R.K.; Taban, I.C.; Westerlund, S.; Godal, B.F.; Arnberg, M.; Vingen, S.; Ingvarsdottir, A.; Baussant, T. Effects of ocean acidification on early life stages of shrimp (Pandalus borealis) and mussel (Mytilus edulis). J. Toxicol. Environ. Health A 2011, 74, 424–438. [Google Scholar] [CrossRef] [PubMed]
  83. Hurlbert, S.H. Pseudoreplication and the design of ecological field experiments. Ecol. Monogr. 1984, 54, 187–211. [Google Scholar] [CrossRef]
  84. Havenhand, J.N.; Dupont, S.T.; Quinn, G.P. Designing Ocean Acidification Experiments to Maximise Inference. In Guide to Best Practices for Ocean Acidification Research and Data Reporting; Riebesell, U., Fabry, V.J., Hansson, L., Gattuso, J.P., Eds.; Publications Office of the European Union: Luxembourg, 2010; pp. 67–79. [Google Scholar]
  85. Caldeira, K.; Wickett, M.E. Ocean model predictions of chemistry changes from carbon dioxide emissions to the atmosphere and ocean. J. Geophys. Res. 2005, 110, C09S04:1–C09S04:12. [Google Scholar] [CrossRef]
  86. Borges, A.; Frankignoulle, M. Daily and seasonal variations of the partial pressure of CO2 in surface seawater along Belgian and southern Dutch coastal areas. J. Mar. Syst. 1999, 19, 251–266. [Google Scholar] [CrossRef]
  87. Thomsen, J.; Casties, I.; Pansch, C.; Körtzinger, A.; Melzner, F. Food availability outweighs ocean acidification effects in juvenile Mytilus edulis: Laboratory and field experiments. Glob. Chang. Biol. 2013, 19, 1017–1027. [Google Scholar] [CrossRef] [PubMed] [Green Version]
  88. Godbold, J.A.; Solan, M. Long-term effects of warming and ocean acidification are modified by seasonal variation in species responses and environmental conditions. Philos. Trans. R. Soc. B 2013, 368, 20130186:1–20130186:11. [Google Scholar] [CrossRef] [PubMed]
  89. Dupont, S.; Dorey, N.; Stumpp, M.; Melzner, F.; Thorndyke, M. Long-term and trans-life-cycle effects of exposure to ocean acidification in the green sea urchin Strongylocentrotus droebachiensis. Mar. Biol. 2013, 160, 1835–1843. [Google Scholar] [CrossRef] [Green Version]
  90. Parker, L.M.; Ross, P.M.; O’Connor, W.A.; Borysko, L.; Raftos, D.A.; Portner, H.O. Adult exposure influences offspring response to ocean acidification in oysters. Glob. Chang. Biol. 2012, 18, 82–92. [Google Scholar] [CrossRef]
  91. Kennedy, V.; Mihursky, J. Effects of temperature on the respiratory metabolism of three Chesapeake Bay bivalves. Chesap. Sci. 1972, 13, 1–22. [Google Scholar] [CrossRef]
  92. Widdows, J. The effects of temperature on the metabolism and activity of Mytilus edulis. Neth. J. Sea Res. 1973, 7, 387–398. [Google Scholar] [CrossRef]
  93. Jansen, J.M.; Hummel, H.; Bonga, S.W. The respiratory capacity of marine mussels (Mytilus galloprovincialis) in relation to the high temperature threshold. Comp. Biochem. Phys. A 2009, 153, 399–402. [Google Scholar] [CrossRef] [PubMed]
  94. Sánchez-Lazo, C.; Martínez-Pita, I. Effect of temperature on survival, growth and development of Mytilus galloprovincialis larvae. Aquac. Res. 2012, 43, 1127–1133. [Google Scholar] [CrossRef]
  95. His, E.; Robert, R.; Dinet, A. Combined effects of temperature and salinity on fed and starved larvae of the Mediterranean mussel Mytilus galloprovincialis and the Japanese oyster Crassostrea gigas. Mar. Biol. 1989, 100, 455–463. [Google Scholar] [CrossRef]
  96. Beaumont, A.R.; Turner, G.; Wood, A.R.; Skibinski, D.O. Hybridisations between Mytilus edulis and Mytilus galloprovincialis and performance of pure species and hybrid veliger larvae at different temperatures. J. Exp. Mar. Biol. Ecol. 2004, 302, 177–188. [Google Scholar] [CrossRef]
  97. Ruiz, M.; Tarifeño, E.; Llanos-Rivera, A.; Padget, C.; Campos, B.Y. Efecto de la temperatura en el desarrollo embrionario y larval del mejillón, Mytilus galloprovincialis (Lamarck, 1819). Rev. Biol. Mar. Oceanog. 2008, 1, 51–61. [Google Scholar] [CrossRef]
  98. Fuentes, J.; Reyero, I.; Zapata, C.; Alvarez, G. Influence of stock and culture site on growth rate and mortality of mussels (Mytilus galloprovincialis Lmk.) in Galicia, Spain. Aquaculture 1992, 105, 131–142. [Google Scholar] [CrossRef]
  99. Bayne, B.L. Growth and the delay of metamorphosis of the larvae of Mytilus edulis (L.). Ophelia 1965, 2, 1–47. [Google Scholar] [CrossRef]
  100. Anestis, A.; Pörtner, H.O.; Karagiannis, D.; Angelidis, P.; Staikou, A.; Michaelidis, B. Response of Mytilus galloprovincialis (L.) to increasing seawater temperature and to marteliosis: Metabolic and physiological parameters. Comp. Biochem. Phys. A 2010, 156, 57–66. [Google Scholar] [CrossRef] [PubMed]
  101. Langdon, C.; Takahashi, T.; Sweeney, C.; Chipman, D.; Goddard, J.; Marubini, F.; Aceves, H.; Barnett, H.; Atkinson, M.J. Effect of calcium carbonate saturation state on the calcification rate of an experimental coral reef. Glob. Biogeochem. Cycles 2000, 14, 639–654. [Google Scholar] [CrossRef]
  102. Gattuso, J.P.; Frankignoulle, M.; Bourge, I.; Romaine, S.; Buddemeier, R.W. Effect of calcium carbonate saturation of seawater on coral calcification. Glob. Planet Chang. 1998, 18, 37–46. [Google Scholar] [CrossRef]
  103. Gazeau, F.; Quiblier, C.; Jansen, J.M.; Gattuso, J.P.; Middelburg, J.J.; Heip, C.H.R. Impact of elevated CO2 on shellfish calcification. Geophys. Res. Lett. 2007, 34, L07603:1–L07603:5. [Google Scholar] [CrossRef]
  104. Hayakaze, E.; Tanabe, K. Early larval shell development in mytilid bivalve Mytilus galloprovincialis. Jpn. J. Malacol. 1999, 58, 119–127. [Google Scholar]
  105. Malone, P.G.; Dodd, R. Temperature and salinity effects on calcification rate in Mytilus edulis and its paleoecological implicatons. Limnol. Oceanogr. 1967, 12, 432–436. [Google Scholar] [CrossRef]
  106. Duarte, C.; Navarro, J.M.; Acuña, K.; Torres, R.; Manríquez, P.H.; Lardies, M.A.; Vargas, C.A.; Lagos, N.A.; Aguilera, V. Combined effects of temperature and ocean acidification on the juvenile individuals of the mussel Mytilus chilensis. J. Sea Res. 2014, 85, 308–314. [Google Scholar] [CrossRef]
  107. Pineda, J.; Porri, F.; Starczak, V.; Blythe, J. Causes of decoupling between larval supply and settlement and consequences for understanding recruitment and population connectivity. J. Exp. Mar. Biol. Ecol. 2010, 392, 9–21. [Google Scholar] [CrossRef]
  108. Giménez, L. Marine community ecology: Importance of trait-mediated effects propagating through complex life cycles. Mar. Ecol. Prog. Ser. 2004, 283, 303–310. [Google Scholar] [CrossRef]

Appendix

Table A1. Two-factor ANOVA results for the response parameters in the larval experiment. SS refers to sum of squares, MS to mean squares, T to temperature and pCO2 × T to the interaction term.
ResponseFactorDfSSMSF valueP
SurvivalpCO217.83 × 10−47.83 × 10−40.0740.793
T11.46 × 10−11.46 × 10−113.7330.006
pCO2 × T16.50 × 10−46.50 × 10−40.0610.811
Residuals88.52 × 10−21.06 × 10⁻²
SizepCO212.872.870.2890.606
T11.57 × 1021.57 × 10215.7640.004
pCO2 × T11.35 × 1011.35 × 1011.3540.278
Residuals87.969.94
RespirationpCO216.27 × 10−96.27 × 10−90.1340.724
T16.25 × 10−76.25 × 10−713.3200.006
pCO2 × T10.000.000.0000.995
Residuals83.75 × 10−74.69 × 10⁻⁸
CalcificationpCO213.04 × 10−63.04 × 10−60.0800.785
T11.25 × 10−41.25 × 10−43.3020.112
pCO2 × T12.11 × 10−62.11 × 10−60.0560.820
Residuals72.65 × 10−43.79 × 10⁻⁵
Figure A1. Schematic representation of the setup for the larval development experiment. (1) Ambient air was collected via aquarium pumps and stripped of CO2 by soda-lime columns; CO2 gas was obtained from tanks (2) Gasses were mixed in marble filled containers using mass flow controllers to achieve the precise ratio of stripped air and CO2 gas and derive pCO2 concentrations of 380 (control, CSW) and 1000 ppm (treatment, TSW); (3) Three replicate cylinders and one 10 L tank per treatment were bubbled with CO2 controlled air. Sensors measuring pH were deployed in two cylinders for each treatment combination; (4) Cylinders were submerged into two separate tanks containing fresh water, which was passed through temperature control units set at 16 °C and 20 °C. See Table 1 for actual experimental temperatures and pCO2 values.
Water 05 01890 g005
Figure A2. Raw data used for calculating the effect sizes (Figure 3): (a) sperm swimming speed and (b) sperm motility measured at 16 °C. Lines between points mark individuals; (c) survival rate; (d) larval size; (e) respiration and (f) calcification rate of larvae measured in low (≈17 °C) and high temperature (≈20 °C) treatments. Dots indicate mean values for replicates (n = 13 for (a,b), 3 for (ce), 2 for low temperature TSW, otherwise 3 in (f)) and error bars show SE X ¯ . Measurements without error bars lack measurement replication in (f). Dark blue indicates control pCO2 treatment, while light orange high pCO2 treatment.
Water 05 01890 g006

