4.1. Comparison of in Situ and Laboratory Instrumentation
The
in situ and laboratory data were highly correlated for all 5 measurements considered (
Table 5). The “goodness of fit” statistics calculated (RMSD and Nash-Sutcliffe) also indicate that for TRP, NO
3, temperature and conductivity there is a high degree of consistency between both sets of measurements (
Table 5). However, the
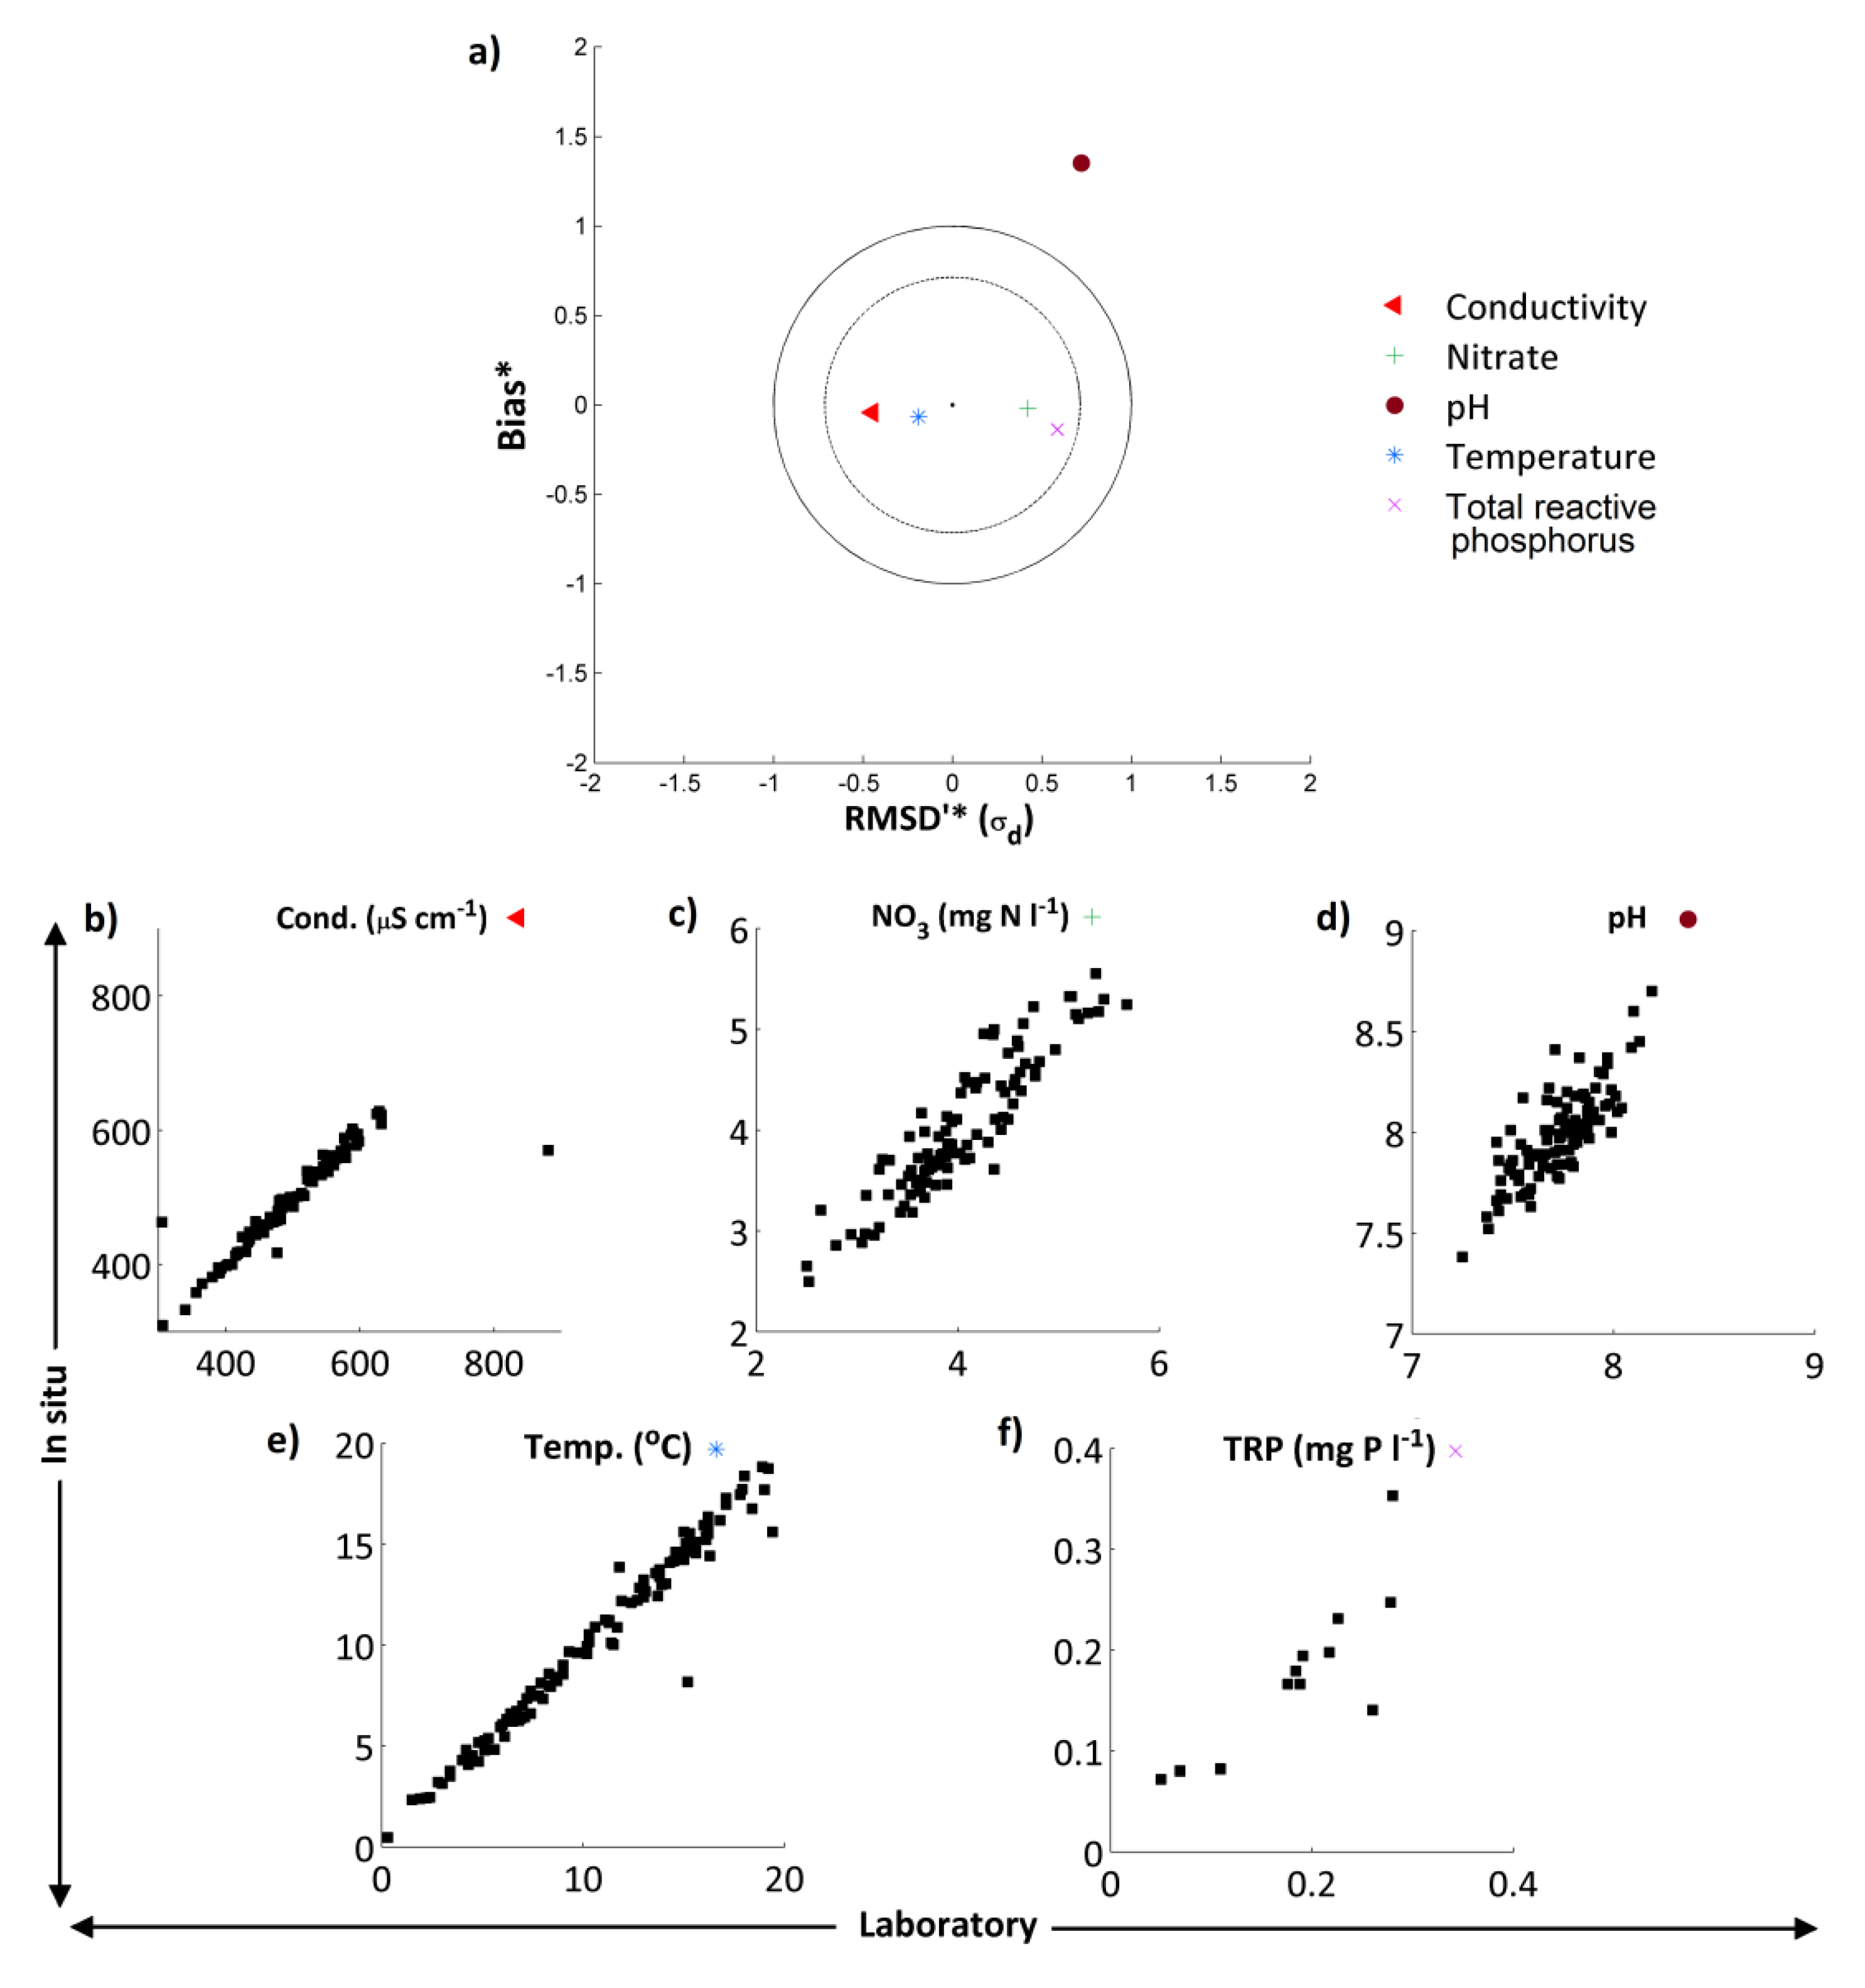
in situ and laboratory pH measurements did show marked differences. These results are summarised in the normalised target diagram (
Figure 3a). These diagrams were introduced by Jolliff
et al. [
58] as a visual comparison of modelled and observed data, but can also be used (as here) to compare any two sets of data.
For TRP, NO
3, temperature and conductivity, agreement was excellent whereas for pH the high-frequency data showed a positive bias and the dataset had a larger standard deviation (
Figure 3). These features are evident when the two pH time series are compared, with pH of the weekly grab sample data in general slightly lower than the pH recorded by the
in situ instrumentation (
Table 5 and
Figure 4). The occurrence of lower pH measurements in the laboratory analysis may result from nitrification of ammonium (NH
4) and dissolved organic nitrogen (DON) or through ammonia (NH
3) degassing in the water sample prior to analysis. pH electrodes can also suffer problems such as accurate calibration and drift [
39]. Despite these observations, the average difference in pH between the two measurements was only 0.25, and both datasets displayed the same pattern and range in pH. Given these small differences between the
in situ and laboratory readings, for the purposes of this work the high-frequency pH datasets have been utilised.
Table 5.
Goodness of fit statistics between the traditional laboratory hydrochemical measurements (Lab) and the measurements made in situ by the high-frequency equipment (HF).
Table 5.
Goodness of fit statistics between the traditional laboratory hydrochemical measurements (Lab) and the measurements made in situ by the high-frequency equipment (HF).
| Statistic | Dataset | TRP | NO3 | Temperature | Conductivity | pH |
|---|
| Mean | HF | 0.18 | 4.01 | 10.3 | 492 | 7.98 |
| Lab | 0.19 | 4.02 | 10.7 | 496 | 7.73 |
| Standard Deviation | HF | 0.08 | 0.68 | 4.61 | 72.0 | 0.22 |
| Lab | 0.07 | 0.66 | 4.84 | 85.2 | 0.19 |
| No. Measurements | | 12 | 101 | 107 | 89 | 106 |
| Pearson’s Correlation Coefficient (r)—[Equation (3)] | 0.84 *** | 0.92 *** | 0.98 *** | 0.90 *** | 0.80 *** |
| Coefficient of determination (r2) | 0.70 | 0.84 | 0.97 | 0.80 | 0.64 |
| Normalised Unbiased Root Mean Squared Difference [RMSD*'—Equation (6)] | 0.59 | 0.42 | 0.19 | 0.45 | 0.72 |
| Nash Sutcliffe [NS—Equation (4)] | 0.64 | 0.82 | 0.96 | 0.80 | −1.34 |
4.2. Mass Balance of Catchment Nutrients
To further characterise the catchment, the major inputs and outputs of N and P were calculated (
Table 6—methods given in
Section 2.2). For both N and P, agricultural fertiliser inputs, especially to arable land, dominate the input loads, though atmospheric N deposition was also significant. Inputs from human sewage, whether from STWs or STSs, are much smaller. However, this is not necessarily reflected in their influence on the river (see below). Of the estimated annual loads received by the catchment, approximately only 4% of the P and 9% of the N leaves the catchment in the river. This is however only a partial mass balance performed to illustrate the relative importance of these sources and sinks to the system. Although not monitored as part of this work, water, and thus N and P, can also enter and leave the catchment in groundwater, and as the Enborne is a groundwater-dominated catchment this may be a significant source and/or sink. Historic groundwater monitoring in the wider Kennet catchment has previously identified significant N and P pollution, with mean NO
3 concentrations between 1998 and 2000 ranging between 4.6 and 5.9 mg N L
−1 in the upper Kennet [
45]. In addition, water, N and P are exported in agricultural products, and there may be more agricultural inputs in the form of animal feedstuffs. Nevertheless it illustrates that to understand the controls on N and P concentrations in the river, the fate of the N and P from individual sources must be carefully modelled [
67].
Figure 3.
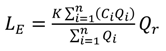
(a) Target diagram showing normalised unbiased RMSD [RMSD*—Equation (6)] multiplied by the sign of the standard deviation difference [σd— Equation (8)] against the normalised bias [B*— Equation (7)] between the high-frequency/laboratory results. Results in the inner circle are considered to have excellent agreement, those in the outer circle to have good agreement. Subplots (b)–(f) show the in situ high-frequency measurements (y-axis) plotted against the laboratory measurements (x-axis) for each determinand.
Figure 3.
(a) Target diagram showing normalised unbiased RMSD [RMSD*—Equation (6)] multiplied by the sign of the standard deviation difference [σd— Equation (8)] against the normalised bias [B*— Equation (7)] between the high-frequency/laboratory results. Results in the inner circle are considered to have excellent agreement, those in the outer circle to have good agreement. Subplots (b)–(f) show the in situ high-frequency measurements (y-axis) plotted against the laboratory measurements (x-axis) for each determinand.
Table 6.
Partial mass balance for P and N in the Enborne catchment *.
Table 6.
Partial mass balance for P and N in the Enborne catchment *.
| System inputs | Estimated annual load (kg P yr−1) | % of total load | Estimated annual load (kg N yr−1) | % of total load |
|---|
| Atmospheric deposition | 3,150 | 3.7 | 233,000 | 19.2 |
| Sewage: STWs | 6,570 | 7.8 | 28,500 | 2.4 |
| STSs | 3,730 | 4.4 | 17,300 | 1.4 |
| Fertiliser: Arable | 56,000 | 66.6 | 691,000 | 57.1 |
| Grassland | 14,600 | 17.4 | 241,000 | 19.9 |
| Total | 84,050 | 100.0 | 1,210,800 | 100.0 |
| System Outputs | | | | |
| Riverine load | 3,100 | 3.7 | 107,200 | 8.9 |
4.3. Overall Water Chemistry
Water quality statistics for the River Enborne are shown in
Table 7. Where available, data are shown for three independent datasets: the high-frequency data (HF) were measured hourly as described in
Section 2.1, and there were two datasets of weekly measurements, measured on different days: Thames Initiative (TI) data and LIMPIDS ground-truthing data (GT) [
38]. Time courses for selected determinands from the weekly and hourly datasets are shown in
Figure 4. Only some of the major features of these data will be discussed in this paper—subsequent papers will examine the data in more detail. Baseflow water in the river is dominated by calcareous groundwater from the chalk aquifer, accounting for the high alkalinity, high calcium (Ca) and conductivity, and pH in the upper 7–8 range. During stormflow Ca concentrations are approximately halved on average, but concentrations remains high, with alkalinity and conductivity responding in the same way (
Table 7,
Figure 4).
Table 8 shows rank correlation coefficients between the concentrations of various determinands. Positive correlations with Ca may imply a groundwater source—this applies to silicon (Si), for instance, while dissolved organic carbon (DOC) has a strong negative correlation, showing an origin in surface runoff, as expected. N and P species also have a highly significant correlation with Ca. However, periods with a high groundwater contribution are low flow periods when the dilution capacity of the system is also reduced. Therefore, higher N and P concentrations observed at these times may be the result of poor dilution of agricultural and sewage nutrient sources under low flows, rather than an increased contribution of nutrient enriched groundwater. Indeed, TRP correlates (negatively) with flow even better than it does with Ca, suggesting that poorer dilution of a constant point source is the predominant explanation, whereas NO
3 correlates better with Ca than with flow, suggesting that there is a groundwater contribution to river NO
3, which is consistent with the high groundwater NO
3 concentrations in the adjacent Pang and Lambourn catchments and upper reaches of the Kennet [
45,
68]. Other features of the overall water chemistry show clear anthropogenic influences in the high N and P concentrations and other markers such as boron (largely derived from detergents). Dissolved oxygen is clearly also affected but still at an acceptable level.
4.4. Nitrogen and Phosphorus Speciation
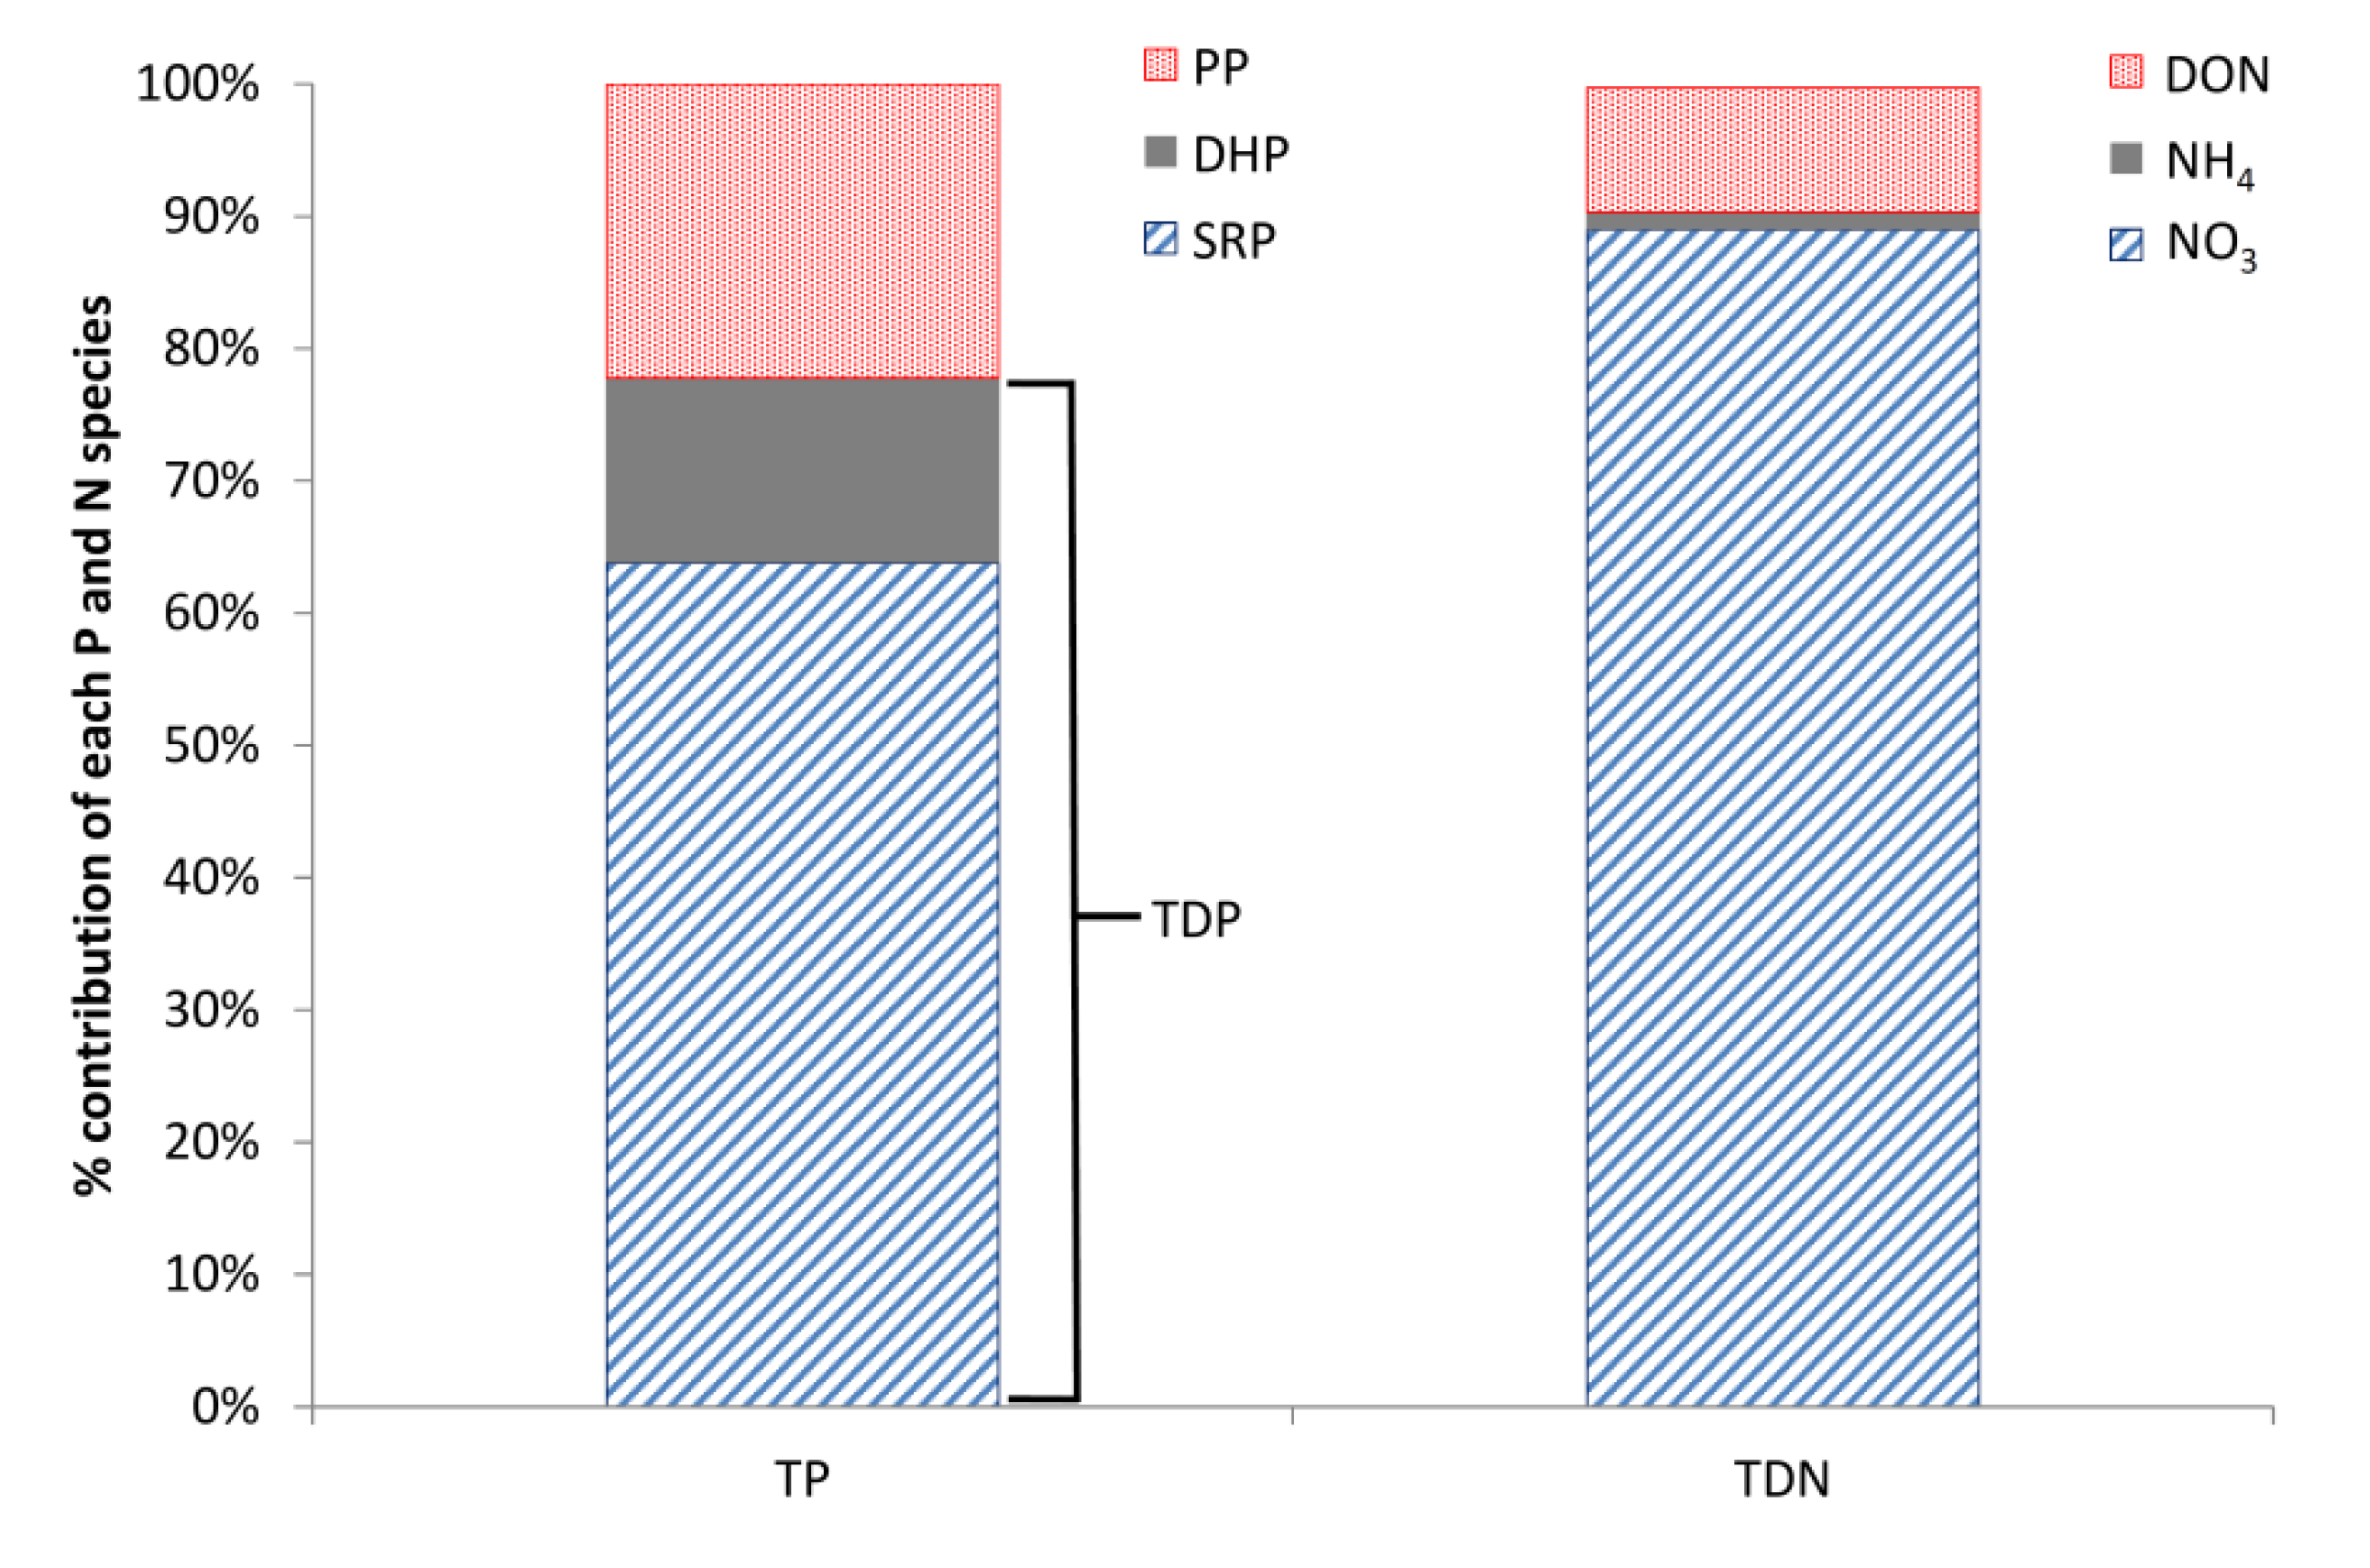
Based on the weekly grab samples, dissolved P was also found to dominate the P composition, with total dissolved P (TDP) accounting for, on average, 78% of the total P (TP) and particulate P (PP) only 22% (
Figure 5). In addition, the majority of the TDP, on average 81%, was in soluble reactive form (SRP;
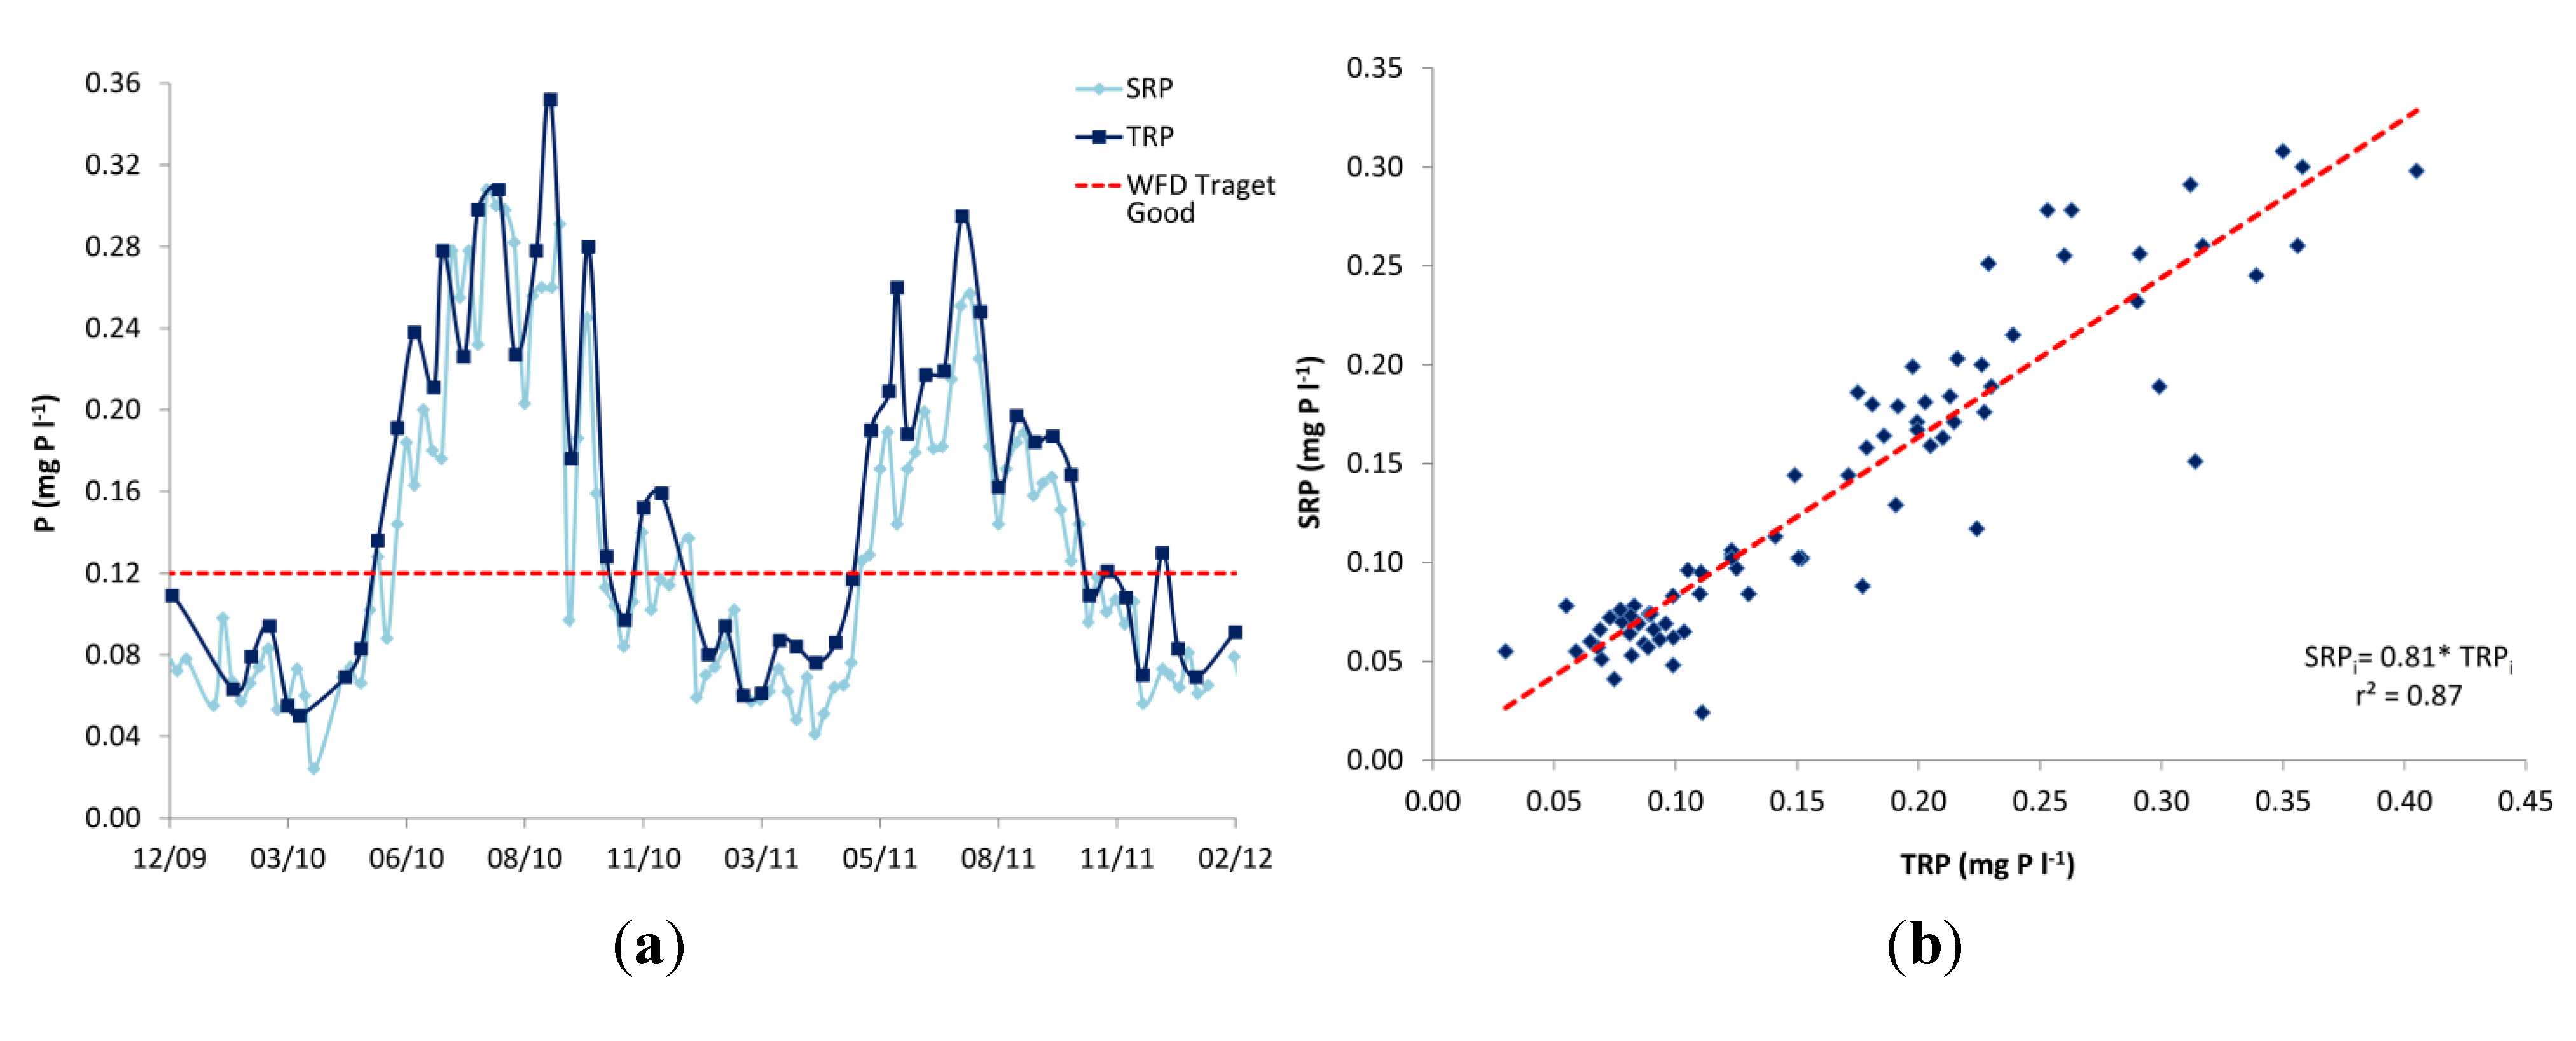
Figure 5). The monitoring equipment used in the Enborne high-frequency monitoring scheme measured TRP instead of SRP. SRP is traditionally regarded as a better measure of bioavailable P and is the basis for UK legislative standards. The difference between these two P fractions is that for SRP the sample is filtered prior to analysis, consequently TRP concentrations are usually slightly higher as readily hydrolysable-particulate P fractions are included in the measurement. Weekly measurements of TRP and SRP were performed on different days (
Table 7), but a good correspondence between them was observed, and the weekly SRP measurements were significantly positively correlated to the high-frequency TRP recorded on the same hour as sample collection (ρ = 0.89,
p < 0.001; SRP
i = 0.81*TRP
i;
Figure 6). Therefore, the recorded TRP concentrations on the Enborne are assumed to provide a reasonable estimate of the streamwater SRP concentrations.
Table 7.
Water quality statistics for the River Enborne.
Table 7.
Water quality statistics for the River Enborne.
| Determinand | Units | Dataset* | Mean | Stormflow Mean | Baseflow Mean | Min | Max |
|---|
| Flow | m3 s−1 | 15 min | 1.07 | 4.76 | 0.14 | 0.09 | 25.1 |
| Temperature | °C | TI | 10.4 | 6.58 | 15.0 | −0.2 | 19.4 |
| | HF | 10.3 | 6.71 | 14.4 | 0.19 | 20.3 |
| pH | n/a | TI | 7.72 | 7.48 | 7.76 | 7.25 | 8.19 |
| | HF | 7.97 | 7.71 | 7.95 | 7.24 | 8.94 |
| Conductivity | µS cm−1 | GT | 496 | 360 | 568 | 305 | 881 |
| | HF | 477 | 344 | 559 | 215 | 769 |
| Alkalinity | µEq L−1 | TI | 2800 | 1850 | 3430 | 1190 | 4350 |
| Turbidity | NTU | HF | 8.74 | 31.3 | 6.09 | 2 | 387 |
| DO | % Sat | HF | 90.3 | 95.8 | 73.5 | 53 | 170 |
| TDP + | mg P L−1 | TI | 0.16 | 0.09 | 0.23 | 0.07 | 0.34 |
| SRP | mg P L−1 | TI | 0.13 | 0.07 | 0.2 | 0.02 | 0.31 |
| TRP | mg P L−1 | HF | 0.17 | 0.08 | 0.23 | 0.00 | 0.6 |
| | GT | 0.15 | 0.09 | 0.23 | 0.05 | 0.35 |
| PP | mg P L−1 | TI | 0.04 | 0.08 | - | 0.02 | 0.12 |
| TP | mg P L−1 | TI | 0.20 | 0.17 | 0.27 | 0.09 | 0.45 |
| NO3 | mg N L−1 | HF | 3.96 | 3.28 | 4.35 | 1.7 | 6.24 |
| | TI | 3.97 | 3.38 | 4.44 | 2.41 | 5.68 |
| NH4 | mg N L−1 | TI | 0.06 | 0.07 | 0.04 | 0.00 | 0.28 |
| DON ± | mg N L−1 | TI | 0.43 | 0.45 | 0.30 | 0.00 | 1.19 |
| TDN | mg N L−1 | TI | 4.35 | 3.88 | 4.61 | 2.4 | 6.31 |
| DOC † | mg L−1 | TI | 5.81 | 7.84 | 3.83 | 1.19 | 11.8 |
| Si | mg L−1 | TI | 7.00 | 5.40 | 8.61 | 2.96 | 9.9 |
| Na | mg L−1 | TI | 19.1 | 15.1 | 24.8 | 11.1 | 31.4 |
| K | mg L−1 | TI | 3.73 | 3.67 | 4.47 | 2.49 | 6.15 |
| Ca | mg L−1 | TI | 68.5 | 48.1 | 81.5 | 36.5 | 99.5 |
| Mg | mg L−1 | TI | 4.41 | 4.45 | 4.15 | 2.75 | 6.02 |
| Cl | mg L−1 | TI | 36.8 | 29.4 | 45.0 | 22.4 | 60.1 |
| SO4 | mg S L−1 | TI | 9.16 | 8.15 | 8.43 | 6.36 | 12.0 |
| B | µg L−1 | TI | 26.8 | 24.5 | 29.2 | 20.8 | 37.5 |
| Al | µg L−1 | TI | 22.3 | 108 | 6.90 | 1.08 | 184 |
| Fe | µg L−1 | TI | 116 | 250 | 56.6 | 19.2 | 434 |
Table 8.
Spearman’s rank correlation coefficients (ρ) between the water quality parameters (*** p < 0.001; ** p < 0.01; * p < 0.05).
Table 8.
Spearman’s rank correlation coefficients (ρ) between the water quality parameters (*** p < 0.001; ** p < 0.01; * p < 0.05).
| | Flow | Temp. | pH | Cond. | Turb. | DO | TRP | PP | TP | NO3 | DON | TDN | DOC | Si | Ca | Cl |
|---|
| Flow | | | | | | | | | | | | | | | | |
| Temp. | −0.65 *** | | | | | | | | | | | | | | | |
| pH | −0.32 *** | 0.33 *** | | | | | | | | | | | | | | |
| Cond. | −0.82 *** | 0.71 *** | 0.63 *** | | | | | | | | | | | | | |
| Turb. | 0.06 | 0.21 * | −0.41 *** | −0.04 | | | | | | | | | | | | |
| DO | 0.67 *** | −0.62 *** | 0.19 | −0.51 *** | −0.39 *** | | | | | | | | | | | |
| TRP | −0.77 *** | 0.59 *** | 0.21 | 0.79 *** | 0.19 | −0.69 *** | | | | | | | | | | |
| PP | −0.12 | 0.37 *** | −0.11 | 0.21 * | 0.63 *** | −0.35 *** | 0.32 ** | | | | | | | | | |
| TP | −0.65 *** | 0.72 *** | 0.1 | 0.67 *** | 0.52 *** | −0.76 *** | 0.81 *** | 0.60 *** | | | | | | | | |
| NO3 | −0.46 *** | 0.59 *** | 0.45 *** | 0.73 *** | 0.2 * | −0.41 *** | 0.55 *** | 0.22 * | 0.52 *** | | | | | | | |
| DON | −0.04 | 0.18 | 0.00 | 0.03 | 0.22 | 0.00 | 0.13 | 0.25 * | 0.08 | 0.15 | | | | | | |
| TDN | −0.26 ** | 0.31 ** | 0.41 *** | 0.55 *** | 0.13 | −0.16 | 0.45 *** | 0.14 | 0.29 ** | 0.82 *** | 0.36 *** | | | | | |
| DOC | 0.36 ** | −0.27 * | −0.71 *** | −0.54 *** | 0.11 | 0.04 | −0.23 | 0.07 | −0.19 | −0.56 *** | 0.14 | −0.44 *** | | | | |
| Si | −0.74 *** | 0.52 *** | 0.08 | 0.69 *** | 0.10 | −0.66 *** | 0.8 *** | 0.13 | 0.67 *** | 0.45 *** | −0.11 | 0.36 *** | −0.25 | | | |
| Ca | −0.68 *** | 0.68 *** | 0.74 *** | 0.94 *** | −0.14 | −0.34 *** | 0.63 *** | 0.11 | 0.50 *** | 0.78 *** | 0.04 | 0.58 *** | −0.72 *** | 0.56 *** | | |
| Cl | −0.74 *** | 0.39 *** | 0.13 | 0.74 *** | 0.12 | −0.61 *** | 0.82 *** | 0.18 | 0.60 *** | 0.30 ** | −0.01 | 0.15 | −0.23 | 0.62 *** | 0.41 *** | |
| B | −0.63 *** | 0.67 *** | −0.09 | 0.42 *** | 0.24 * | −0.74 *** | 0.58 *** | 0.32 *** | 0.69 *** | 0.35 *** | 0.10 | 0.08 | 0.08 | 0.45 *** | 0.31 *** | 0.34 *** |
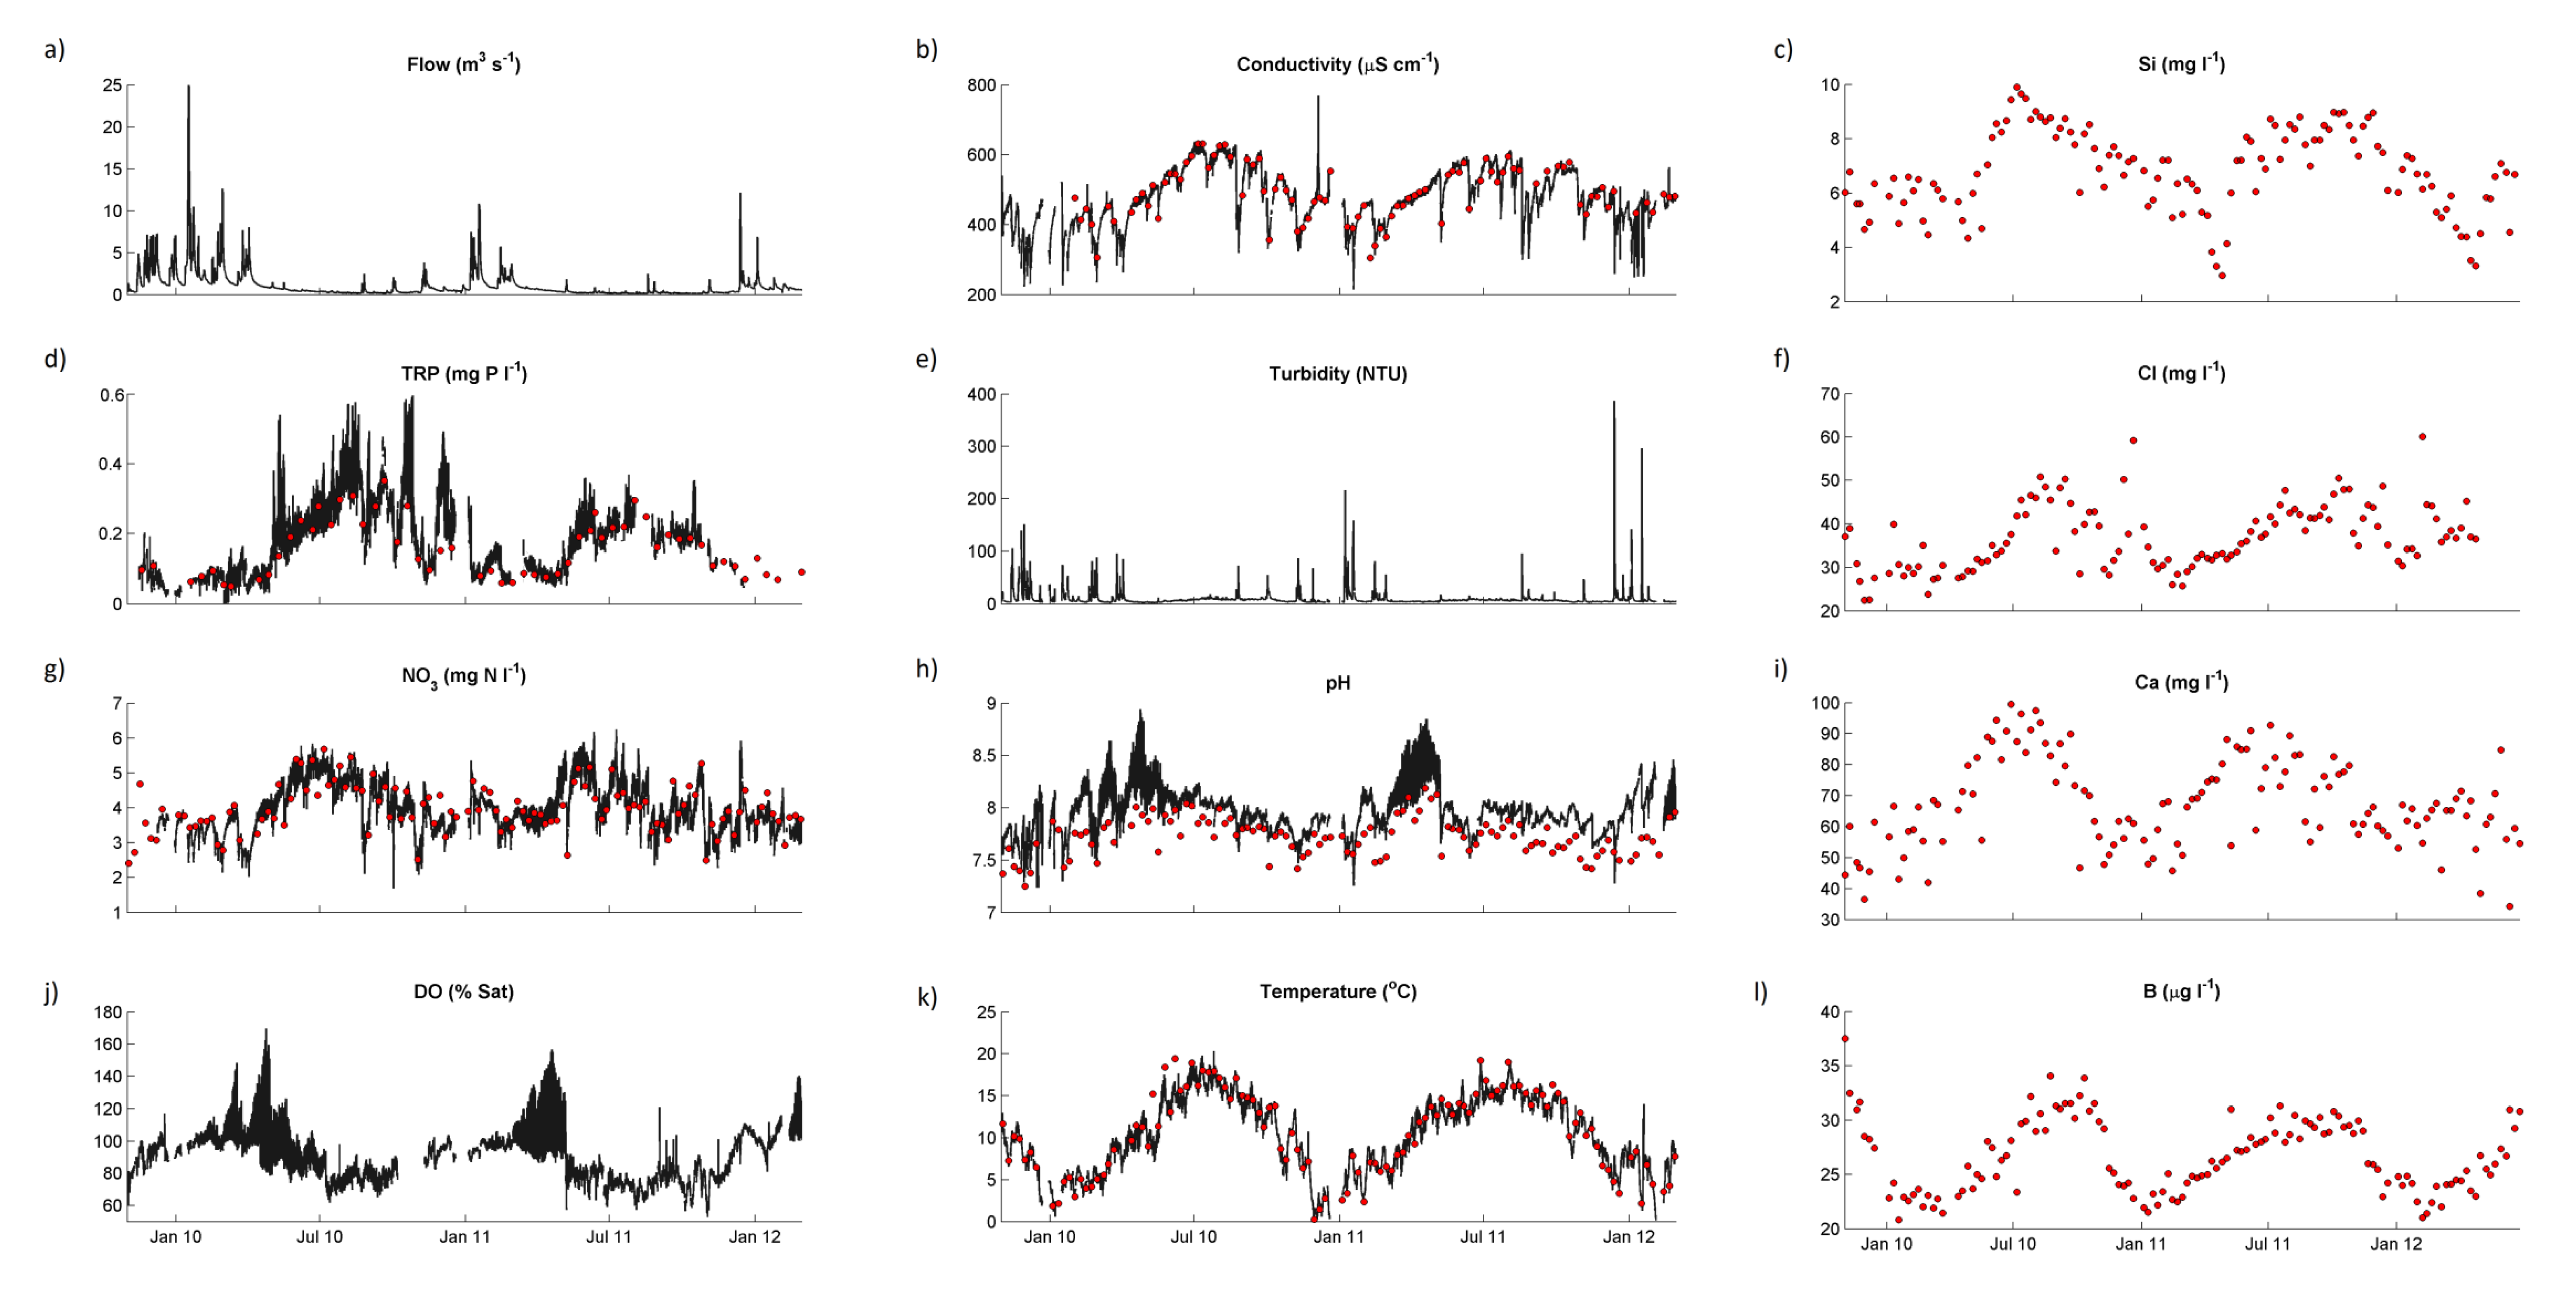
Figure 4.
Concentrations of selected chemical determinands in the River Enborne at Brimpton during the study period: black lines, hourly data; red points, weekly data. (a) Flow; (b) Conductivity; (c) Silicon; (d) Total reactive phosphorus; (e) Turbidity; (f) Chloride; (g) Nitrate; (h) pH; (i) Calcium; (j) Dissolved oxygen; (k) Temperature; and (l) Boron.
NO
3 was the dominant form of N in the Enborne, accounting for on average 89% of the total dissolved N (TDN); with nitrite (NO
2) accounting for less than 1%, ammonium (NH
4) for approximately 1% and dissolved organic nitrogen (DON) approximately 9% (
Figure 5). The high proportion of NO
3 reflects the view of the EU Nitrogen Assessment [
14] that systems like the Enborne are at the high end of the oligotrophic—hypertrophic gradient and, although DON concentrations are also high, they form a smaller proportion of the total dissolved N. No seasonality was observed within the nutrient species composition, with NO
3 and SRP dominating the N and P composition throughout both years.
Figure 5.
Mean annual percentages of different P and N species in the Enborne. SRP, soluble reactive P; DHP, dissolved hydrolysable P; PP, particulate P; TDP, total dissolved P; DON, dissolved organic N.
Figure 5.
Mean annual percentages of different P and N species in the Enborne. SRP, soluble reactive P; DHP, dissolved hydrolysable P; PP, particulate P; TDP, total dissolved P; DON, dissolved organic N.
Figure 6.
(a) Soluble reactive P (SRP) and total reactive P (TRP) concentrations in weekly grab samples (on different days) in the Enborne at Brimpton. The mean annual target concentration under the Water Framework Directive is also shown; (b) The relationship between SRP in the grab samples and TRP in the high-frequency samples taken at the same time.
4.5. Chemical Dynamics
The 2-year time series is too short to provide an indication of trends over time. However, the variability in concentrations is dominated by seasonal variation (
Figure 4), and some mechanistic deductions can be made from these data.
Figure 4a shows the Enborne responding rapidly to rainfall events, especially in the winter and spring when the catchment soils are wet. In the summer there are long periods of low flows when the river is sustained by groundwater and inputs from human sources.
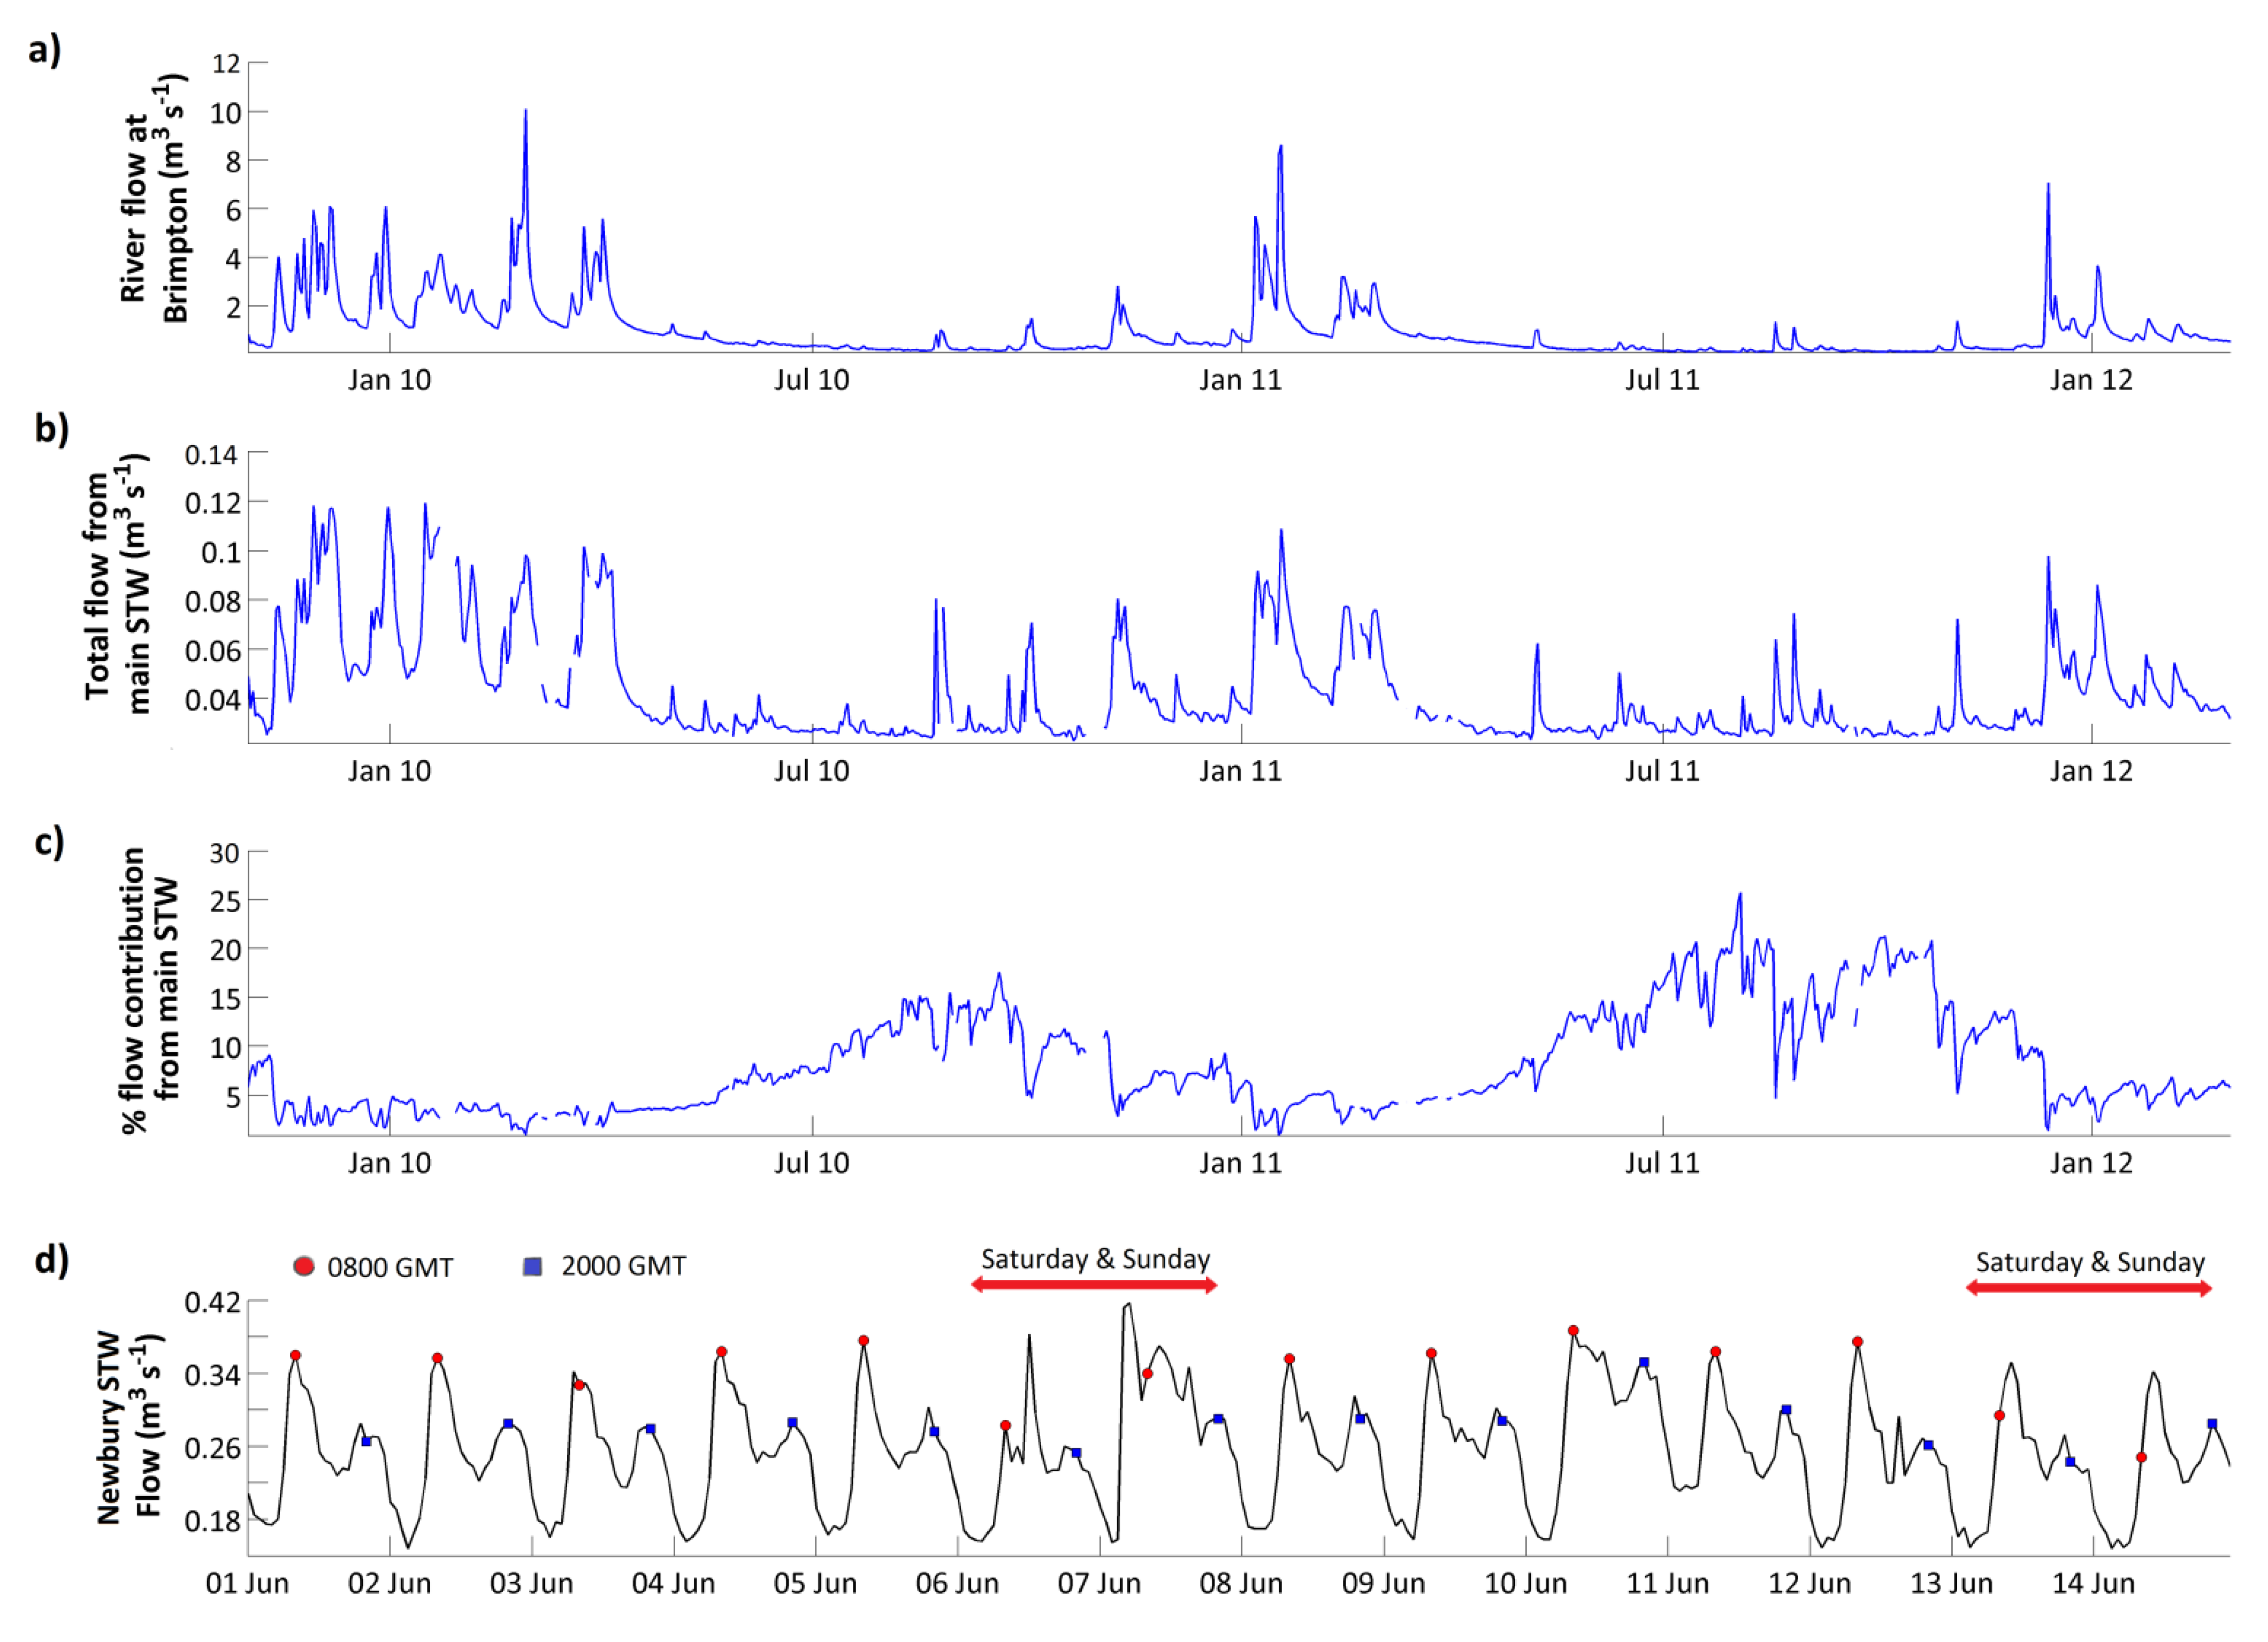
Figure 7a–c shows river flow at the Brimpton monitoring point and discharges from the major STWs over the same period. During the winter and in storm events, the STWs contribute around 4% of the overall river flow, even though water flux through the STWs increases during storm events (
Figure 7b). During low flows, however, the STWs contribute a much higher proportion of river flow, reaching 27.6% in summer 2011 (
Figure 7c;
Table 3), so that the average contribution of STWs to flow during the entire monitoring period is 8.1% (
Table 3). Wade
et al. [
38] also identified a two-peak diurnal cycle in the Brimpton flow, TRP and NO
3 time series during periods of low flow. This was linked to periods of greater domestic water consumption in the morning and evening [
24,
69,
70]. High-frequency discharge measurements are not available from the Enborne catchment STWs, but
Figure 7d, showing discharge from the adjacent Newbury STW during 2009, shows this very clearly, with a sharp morning peak and a broader peak in the evening during the working week, and a more irregular pattern at weekend.
A seasonal pattern of concentration can be seen very clearly in most of the determinands in
Figure 4, with generally higher concentrations in summer. Much of this can be explained by the lower dilution capacity of the river in summer. There are also strong correlations with flow, mostly negative (
Table 8). However, the high-frequency nutrient measurements reveal a complex system with subtle variations in dilution and concentration. The complex TRP-flow dynamics are discussed in detail in Wade
et al. [
38] and result from the combination of both point and diffuse sources of P as well as resuspension of bed material. For NO
3 the negative relationships with flow arose because the time series was dominated by significant dilutions of NO
3 concentration during high flow events, although occasional increases in NO
3 concentration with flow can be observed, for example in January 2011 (
Figure 4).
Figure 4 also shows that responses and relationships can differ with season. Diurnal variation in pH (
Figure 4h) and dissolved oxygen (
Figure 4j), visible as a thick line in the Figure, are clearly related and have an especially large amplitude in spring. This is due to the photosynthesis—respiration diurnal cycle which affects both variables, but the relationship breaks down at other times of year, and thus the overall correlation in
Table 8 is not significant. These more complex relationships will be addressed in subsequent papers using the high-frequency data. In this paper, we will only consider the high-frequency data in relation to turbidity and conductivity (see
Section 4.6 below).
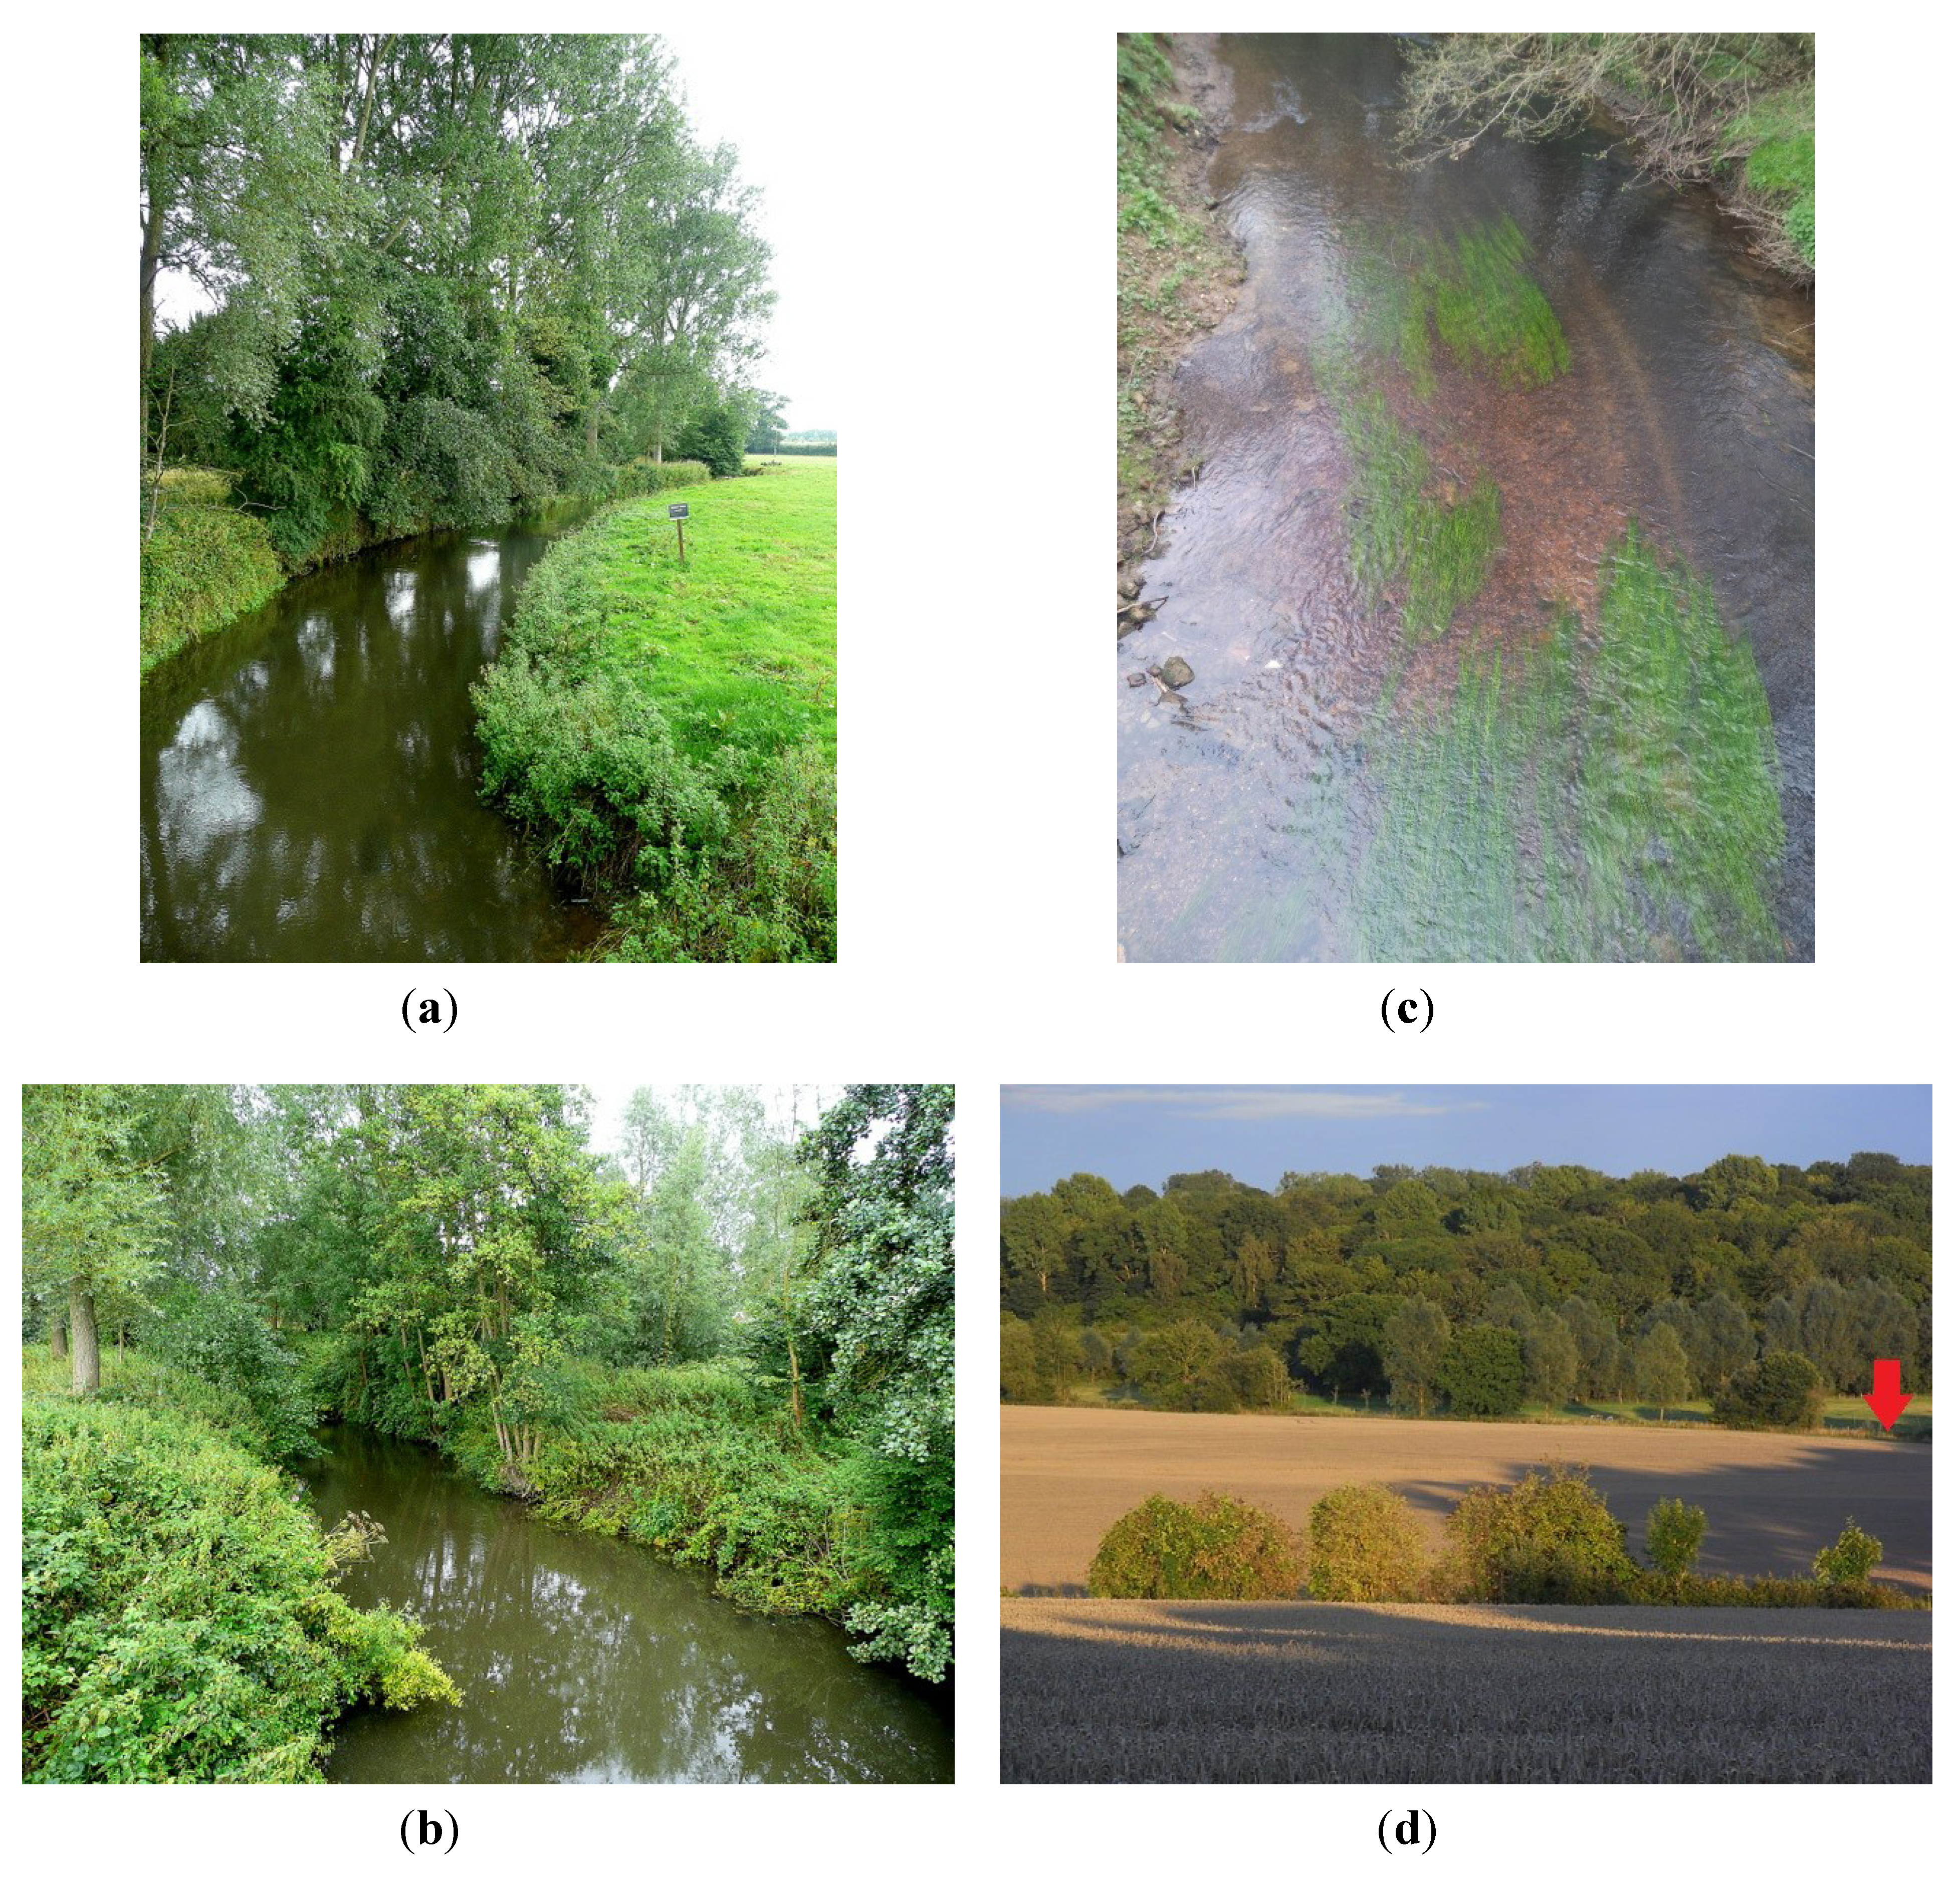
Unusually high chloride (Cl) peaks in winter (
Figure 4f) correlate with unusually high sodium (Na) peaks and are almost certainly due to washoff of de-icing salt from roads—a major trunk road, the A34, crosses the upper part of the river near the Washwater STW (
Figure 1a). Otherwise Cl is influenced by seasalt deposition, both current and preserved in groundwater, and sewage effluent. The predominantly “hard” water in the area implies use of NaCl to regenerate water softeners, and this NaCl appears in the STW and septic tank effluents.
Figure 7.
(
a) Measured flow at Brimpton; (
b) measured discharges from the three major sewage treatment works (
Table 3); (
c) Percentage contribution of STW discharges to observed river flow at Brimpton; (
d) discharge from Newbury STW in June 2009, showing diurnal patterns.
Figure 7.
(
a) Measured flow at Brimpton; (
b) measured discharges from the three major sewage treatment works (
Table 3); (
c) Percentage contribution of STW discharges to observed river flow at Brimpton; (
d) discharge from Newbury STW in June 2009, showing diurnal patterns.
4.6. High Frequency Analysis of Turbidity and Conductivity Data
Turbidity on the Enborne ranged from 2 to 387 Nephelometric Turbidity Units (NTU), with a mean value of 8.7 NTU (
Figure 8;
Table 7). Overall, the turbidity time series was dominated by large peaks associated with high flow events (
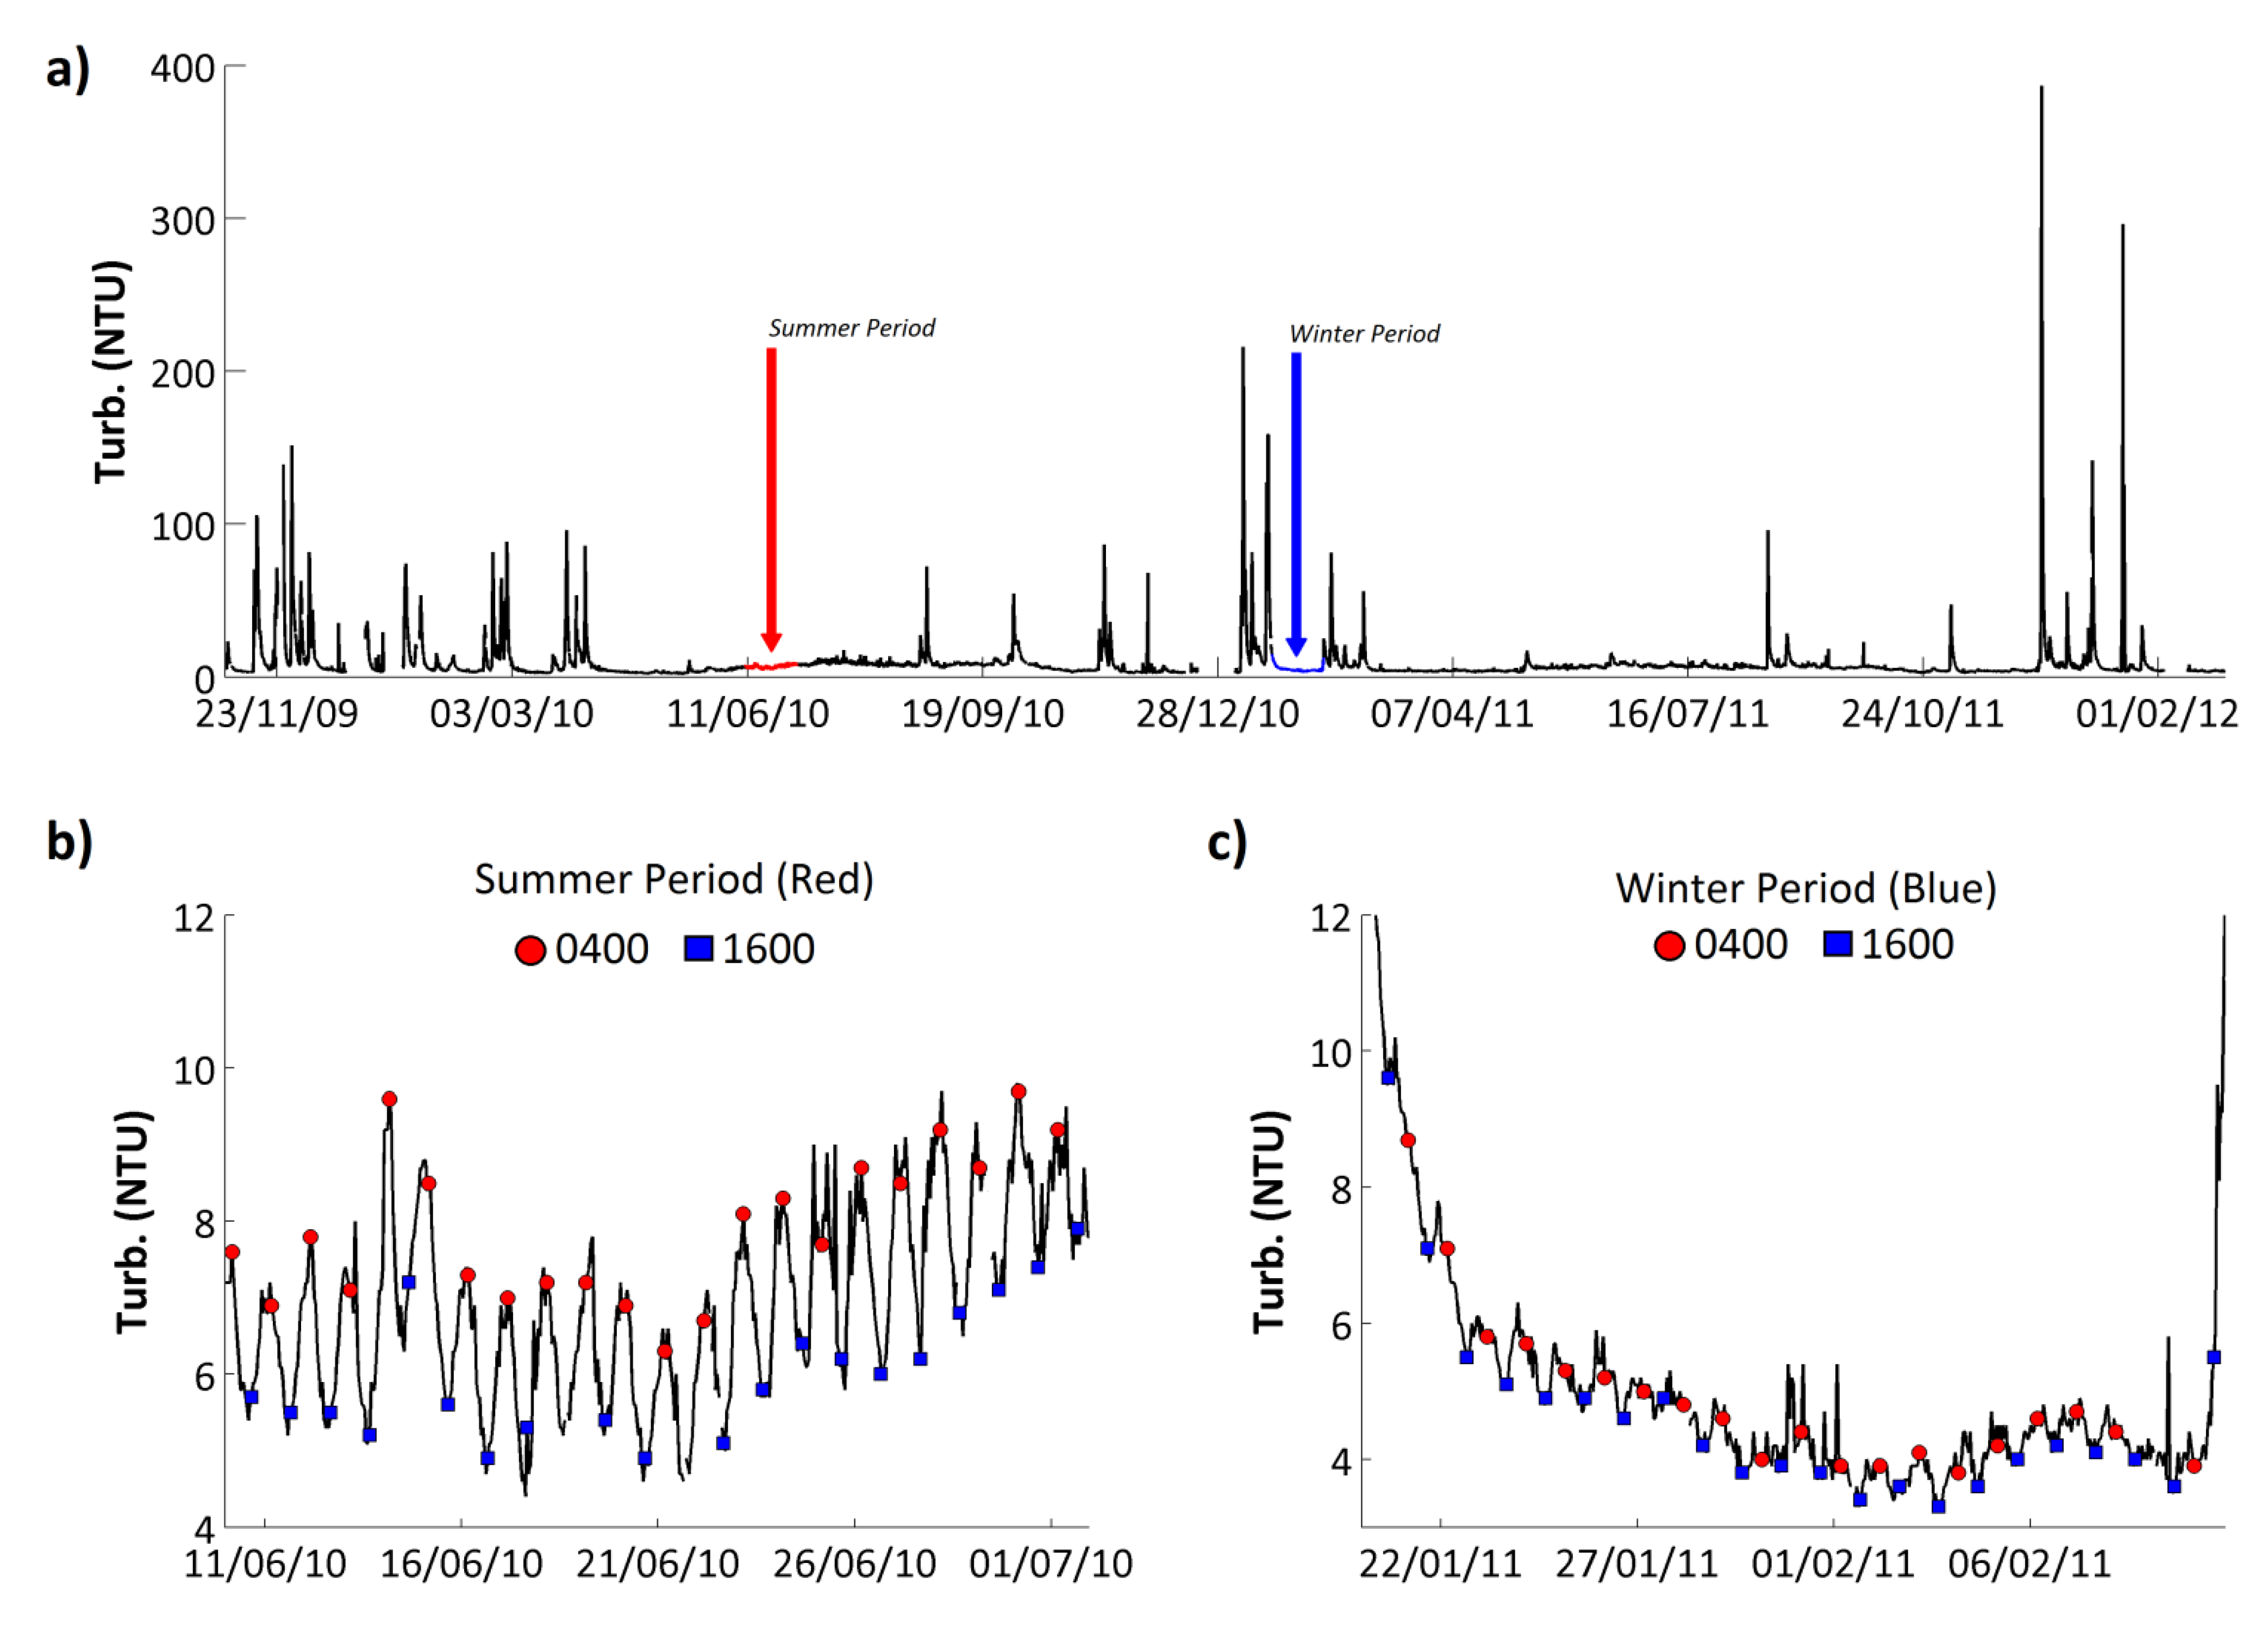
Figure 8a), with turbidity values increasing by over 3 orders of magnitude in one day, before dropping back to the baseline value. Because high flows tend to occur in the winter months, the highest turbidity values tend to occur in winter too. A strong but small amplitude diurnal cycle was identified in the turbidity time series during low flow periods (
Figure 8b,c). The amplitude of the diurnal variations were larger in the spring and summer months, >4 NTU (
Figure 8b), and decreased in the autumn and winter, <1 NTU, with the signal completely disappearing during high flow events (
Figure 8c).
The phase of the diurnal turbidity cycle was consistent, with peak turbidity observed in the night at approximately 0400 GMT and minimum turbidity levels in the afternoon at approximately 1600 GMT (
Figure 8b,c). This type of turbidity cycle has been identified in other rivers and attributed to nocturnal feeding and movement of fish, invertebrates and other stream biota [
71,
72]. In one of these papers high nighttime turbidity values coincided with increased total suspended P loading [
71]. This was also found on the Enborne, with a strong positive correlation between PP and turbidity (
Table 8). In addition, at certain periods throughout the study, particularly in the mid to late summer, elevated TRP concentrations were also observed in the night alongside maximum turbidity concentrations.
Figure 8.
(a) Hourly turbidity record from the River Enborne at Brimpton. Two low-flow periods, one in summer (b) and one in winter (c), are highlighted and shown in expanded form, respectively. In these figures, the 0400 and 1600 GMT data points are highlighted for convenience.
Figure 8.
(a) Hourly turbidity record from the River Enborne at Brimpton. Two low-flow periods, one in summer (b) and one in winter (c), are highlighted and shown in expanded form, respectively. In these figures, the 0400 and 1600 GMT data points are highlighted for convenience.
Conductivity ranged from 215 to 769 μS cm
−1 and had a mean value of 477 μS cm
−1 on the Enborne (
Figure 9;
Table 7). Conductivity is affected by any charged species, and the causes of the observed patterns varied over time. Based on an analysis of the determinands measured as part of the weekly grab sampling programme, conductivity was high on the Enborne as a result of high Ca concentrations (accounting for approximately 37% of the conductivity); and high Cl concentrations (15%). Overall the conductivity signal showed a very similar seasonality to the NO
3 signal (
Figure 4), with peak values in the late spring/early summer. Additionally conductivity was closely related to flow with large flow peaks corresponding directly to significant reductions in conductivity (ρ = −0.40,
p < 0.001, for high-frequency data;
Table 8). Even small flow events were found to significantly reduce the streamwater conductivity when the antecedent catchment conditions had been very dry.
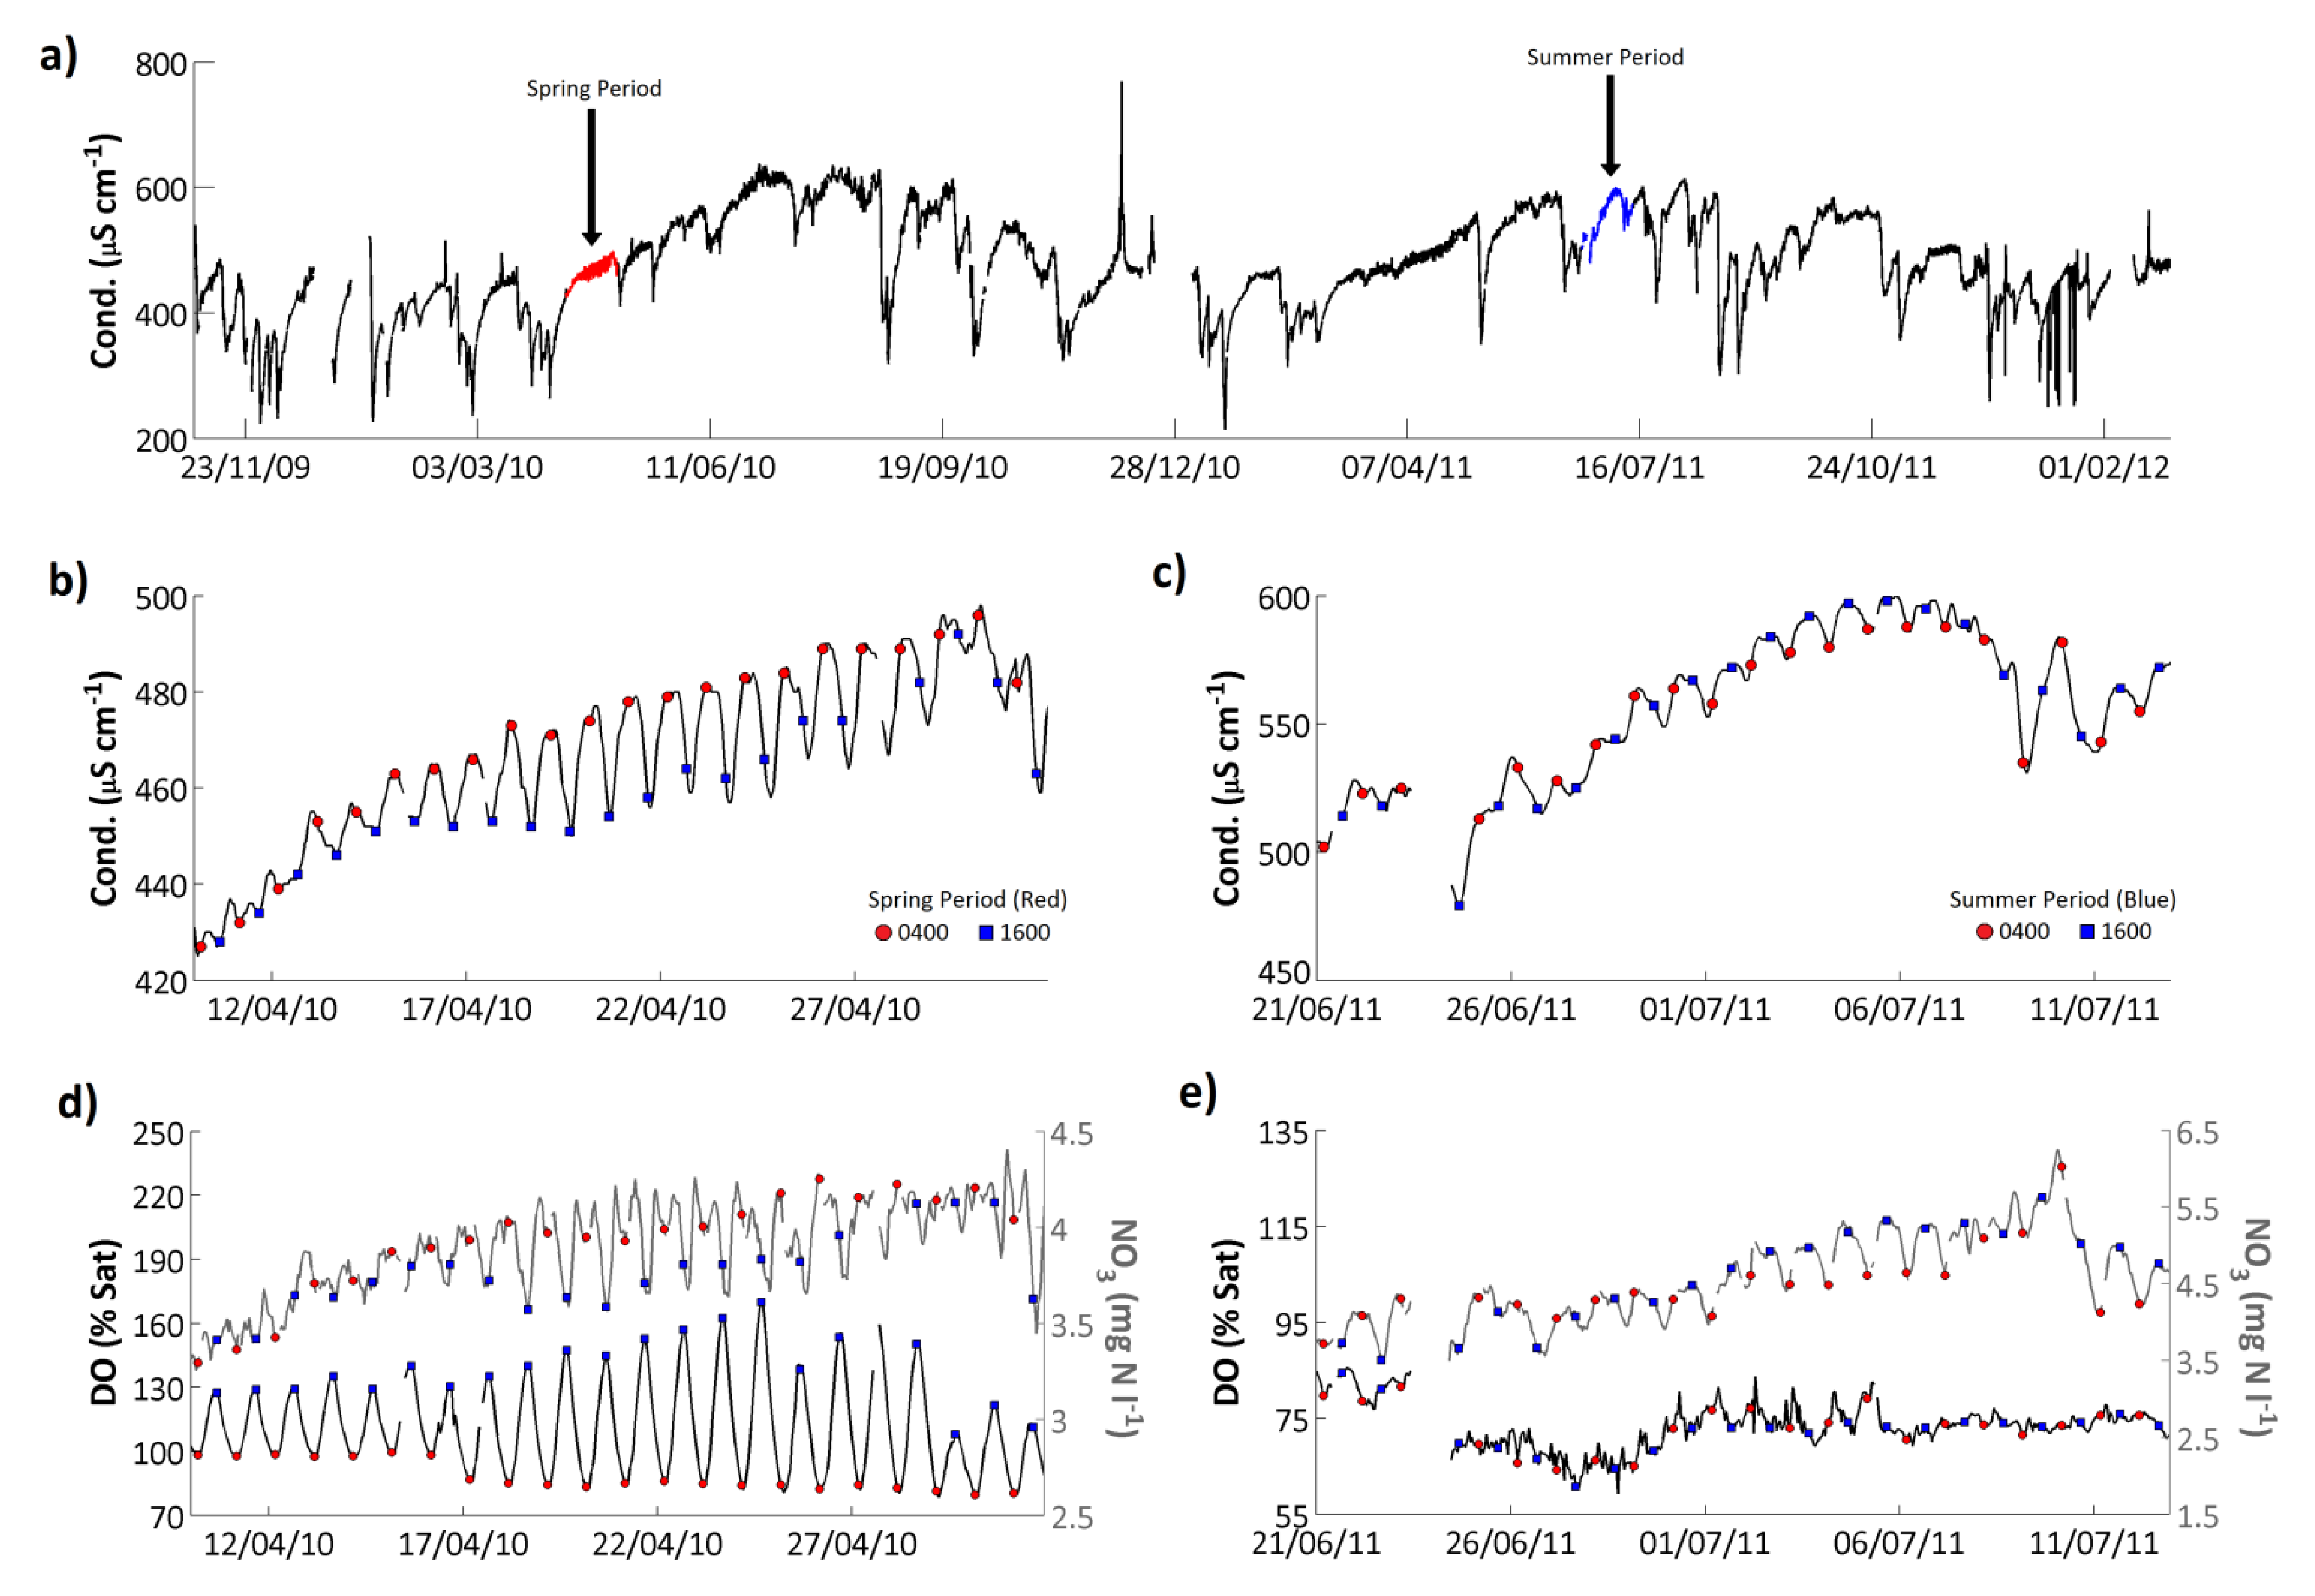
Figure 9.
(a) Hourly conductivity record from the River Enborne at Brimpton. Representative (b) spring and (c) summer periods are highlighted and shown in expanded form, respectively; (d) shows dissolved oxygen and (e) nitrate concentrations for the same periods; In (b–d), the 0400 and 1600 GMT data points are highlighted for convenience.
Although, as with turbidity, larger amplitude fluctuations in conductivity were controlled by the changes in flow, relatively small amplitude, on average 25 μS cm
−1, diurnal fluctuations can also be observed within the time series (
Figure 9b,c). Although these diurnal variations in conductivity are small compared to the full conductivity range on the Enborne, in comparison to the range of conductivity values observed in UK rivers, as low as 30 μS cm
−1 in some upland systems, these diurnal variations are significant. The diurnal cycle phase was highly variable. In the early spring a one-peak cycle was dominant in which conductivity peaked in the early morning and reached a minimum in the evening (
Figure 9b). These springtime daily variations in streamwater conductivity were likely caused by the diurnal changes in respiration/photosynthesis. This was supported by the occurrence of minimum dissolved oxygen at the same time as maximum conductivity (0400 GMT;
Figure 9d), which also coincides with a pH minimum, consistent with the night-time increase in carbonic acid species through the release of CO
2 during respiration. The night-time increase in conductivity was thus largely due to increased bicarbonate (HCO
3−) concentrations derived from respired CO
2. In the late summer, peak conductivity timing changed to during the late afternoon (
Figure 9c). Although bicarbonate would still have been relatively low at this time, the photosynthetically-driven cycle of bicarbonate concentration was reduced in the summer, probably as a result of riparian shading along the course of the river, as evidenced by the irregular dissolved oxygen cycle at this time (
Figure 9e). Instead during the summer the bicarbonate signal is swamped by the larger-amplitude cycle of nitrate concentrations, which peak in the daytime due to increased nitrification (
Figure 9e). Additionally, the two peak diurnal cycles observed in the N and P signals at low flow periods, resulting from the influence of STW discharges, could also be contributing to the diurnal dynamics observed in the conductivity signal. This is supported, at certain periods, by the occurrence of two peak structure in the conductivity diurnal dynamics, however the amplitude of the two peak structure is extremely small (<5 μS cm
−1). These considerations illustrate the difficulties of interpreting detailed conductivity data without supporting concentration measurements.

