Article

Sensitivity of Surface Runoff to Drought and Climate Change: Application for Shared River Basins

by
Furat A. M. Al-Faraj
1,
Miklas Scholz
1,* and
Dimitris Tigkas
2
1
School of Computing, Science and Engineering, The University of Salford, Salford, Greater Manchester M5 4WT, UK
2
Laboratory of Reclamation Works and Water Resources Management, School of Rural and Surveying Engineering, National Technical University of Athens, Iroon Polytechniou 9, Athens 15780, Greece
*
Author to whom correspondence should be addressed.
Water 2014, 6(10), 3033-3048; https://doi.org/10.3390/w6103033
Submission received: 5 August 2014 / Revised: 8 September 2014 / Accepted: 30 September 2014 / Published: 13 October 2014

Abstract

:
This study quantifies the sensitivity of surface runoff to drought and climate change in the Diyala watershed shared between Iraq and Iran. This was achieved through a combined use of a wide range of changes in the amount of precipitation (a decline between 0% and −40%) and in the potential evapotranspiration rate (an increase between 0% and +30%). The Medbasin-monthly rainfall-runoff model (Medbasin-M) was used for runoff simulation. The model was calibrated for twelve hydrologic years (1962−1973), and the simulation results were validated with the observed annual runoff for nine water years (1974−1982). For the calibration period, the correlation coefficient (r), the root mean squared error (RMSE), the mean absolute error (MAE) and the index of agreement (IoA) were 0.893, 2.117, 1.733 and 0.852, respectively. The corresponding values for validation were 0.762, 1.250, 1.093 and 0.863, in this order. The Reconnaissance Drought Index (RDI) and the Streamflow Drought Index (SDI) were analysed using DrinC software. Three nomographs were introduced to quantify the projected reductions in the annual runoff and the anticipated RDI and SDI values, respectively. The proposed methodology offers a simple, powerful and generic approach for predicting the rate of change (%) in annual runoff under climate change scenarios.

Graphical Abstract

1. Introduction

The sustainable management of water resources in transboundary river basins has become a continuous challenge for riparian states. The differences in policies, development perspectives and priorities make it difficult to achieve a common understanding of the rational use of water. One major point of interest for all shared watercourses is the available volume of runoff, which is an important and crucial factor to meet the water demands of many sectors, such as agriculture, public water supply and fish farms. Drought and climate change are likely to put considerable pressure on water resources management and augment the level of vulnerability, particularly of the downstream countries in transboundary river basins. Climate alteration is anticipated to escalate the recurrence, strength and duration of drought episodes in some regions.
The Intergovernmental Panel on Climate Change (IPCC) reported that the Global Circulation Models have produced a range of likely climate change scenarios according to various simulations [1]. Among others, two main predictions are relevant to droughts: increase in temperature and decrease in precipitation amount in some regions. Drought is a natural phenomenon that can be characterized by three dimensions (variables): severity, duration and spatial extent. Conventionally, droughts are categorized as meteorological, hydrological, agricultural and socio-economic phenomena. Numerous drought indices have been introduced in the literature [2,3,4,5,6,7,8,9,10,11,12,13,14,15,16,17,18]. Among the commonly used indices are the Rainfall Anomaly Index (RAI), Percentage of Normal Precipitation (PNPI), Percent of Normal Index (PNI), Deciles Index (DI), Standardized Precipitation Index (SPI), Standardized Precipitation Evapotranspiration Index (SPEI), Palmer Drought Severity Index (PDSI), Reconnaissance Drought Index (RDI), Crop Moisture Index (CMI), Surface Water Supply Index (SWSI), Streamflow Drought Index (SDI) and Truncation Threshold Level (TTL; also called Drought Threshold Level (DTL)).
The topic of drought severity has occupied a notable proportion of drought studies, which have been conducted in many countries, such as Iran [4,5], Iraq [6,7], Greece [8,9], Turkey [10], Jordan [11] and Saudi Arabia [12]. Recent articles have pointed out the promising usage of the RDI to quantify the severity of drought [4,13,14,15]. Precipitation (P) and potential evapotranspiration (PET; directly related to air temperature) are the two key parameters used in RDI. In this paper, the severity of drought was judged by means of RDI, and the hydrological drought (denoted in this paper as a decline in runoff volume) was characterized by using SDI [16,17,18].
The assessment of the impacts of droughts and of the anticipated climate change on runoff volume is important for providing a common ground for communication between the riparian countries. This study quantifies the impact of possible climate alterations and droughts anticipated in the downstream country Iraq. This was achieved through a mutual usage of a wide array of potential future climate shifts in P and PET and the Medbasin-M rainfall-runoff model.
The overall aim of the article is to quantify the impact of the anticipated drought and climate change on streamflow available for the lower riparian country, Iraq. The main objectives of this paper are to:
(1)
predict the likely proportional change (%) in the annual runoff available for the downstream country; and
(2)
anticipate the standardized Reconnaissance Drought Index (RDIst) and SDI values due to a wide range of possible future climate change.
This study offers a generic, simple and solid tool to support water managers and decision-makers in shaping better management plans and strategies for water resources that are anticipated to be available in the short to long term.

2. Materials and Methods

2.1. Meteorological Drought Severity (MDS)

Drought severity was assessed through the computation of the RDI, more precisely through its standardised form. The initial value ( α k ) of RDI is calculated for the i-th year for a reference period of k months according to Equation (1):
α k ( i ) = j = 1 k P i j j = 1 k P E T i j , i =  1 ( 1 ) N    and    j  =  1 ( 1 ) k
where P i j and P E T i j are precipitation and potential evapotranspiration of the j-th month of the i-th year and N is the total number of years of the available data. The values of α k follow satisfactorily both the lognormal and the gamma distributions in a wide range of locations and different reference periods for which they were tested [8,19]. By assuming that the lognormal distribution is applied, Equation (2) can be used for the calculation of the R D I st :
R D I s t ( i ) = y ( i ) y ¯ σ ̂ y
where y ( i ) is ln α k ( i ) ); y ¯ is its arithmetic mean; and σ ̂ y is its standard deviation (SD). In the case that the gamma distribution is applied, R D I st can be calculated by fitting the gamma probability density function (pdf) to the given frequency distribution of α k [8,19]. For short reference periods (e.g., monthly or 3-months), which may include zero values for the cumulative precipitation, R D I st can be calculated based on a composite cumulative distribution function, including the probability of zero precipitation, and the gamma cumulative probability. Positive values of R D I st indicate wet periods, while negative values indicate dry periods compared with the normal conditions of the area. The severity of drought events increases when R D I st values are highly negative.

2.2. Streamflow Drought Index

According to [16], if a time series of monthly streamflow volumes Q i j is available, in which i denotes the hydrological year and j the month within that hydrological year (j = 1 for October and j = 12 for September), V i , k can be obtained based on Equation (3):
V i , k = j = 1 3 k Q i j
where i = 1,2,…,N,j = 1,2,…,12 and k = 1,2,3,4. V i , k is the cumulative streamflow volume for the i-th hydrological year and the k-th reference period, k = 1 for October−December, k = 2 for October−March, k = 3 for October−June and k = 4 for October−September. Based on the cumulative streamflow volumes V i , k , the Streamflow Drought Index (SDI) is defined for each reference period k of the i-th hydrological year (Equation (4)):
S D I i , k = V i , k V ¯ k S k
where i = 1,2,…,N and k = 1,2,3,4. V ¯ k and S k are the mean and SD, respectively, of the cumulative streamflow volumes of the reference period k, as these are estimated over a long period of time. In this definition, the truncation level is set to V ¯ k , although other values based on rational criteria could be also used.
Streamflow may follow a skewed probability distribution, which can be approximated well by the family of the gamma distribution functions. The distribution is then transformed to be normal. Using the two-parameter log-normal distribution (for which the normalization is simply reclaiming the natural logarithms of streamflow), the SDI index is defined in Equations (5) and (6) are the natural logarithms of cumulative streamflow with mean y ¯ k and SD S y , k , as these statistics are estimated over a long period of time.
S D I i , k = y i , k y ¯ k S y , k
where i = 1,2,…,N and k = 1,2,3,4 and:
y i , k   =   ln ( V i , k ) ,   i = 1 , 2 , , N   and   k = 1 , 2 , 3 , 4
The annual SDI index was computed over the period of 30 years between 1962 and 1991. Quantities and descriptive situations of the SDI and the RDIst indices, which are provided in the literature [4,17,20,21,22], were considered in this paper to provide a better representation of drought in spatial distribution mapping (Table 1).
In this study, the calculations were performed using DrinC software [23,24]. DrinC has been recently used in several studies for drought assessment and monitoring [19], predominantly in arid to semi-arid areas, such as Iraq and Iran [25,26]. In this study, the annual RDIst and SDI indices were computed over the period of the normal climatic period from 1975 to 1982. The precipitation and runoff data were fitted to the log-normal distribution function in the computation process. The estimation of potential evapotranspiration used in the calculation of RDI was obtained through DrinC by using the Blaney−Criddle method [27]. Finally, the RDIst and SDI nomographs were developed, which describe the ‘departure’ from the normal condition based on the “0 scenario”. The reference mean annual runoff volume indicating the condition of zero change in both P and PET is referred to as the “0 scenario”.
Table 1. Classification of drought conditions based on the standardized Reconnaissance Drought Index (RDIst) and Streamflow Drought Index (SDI) values.
ConditionRange
Extremely wet(SDI and RDIst) ≥2.00
Very wet1.5 ≤ (SDI and RDIst) < 2.00
Moderately wet1.00 ≤ (SDI and RDIst) < 1.50
Near normal−1.00 < (SDI and RDIst) < 1.00
Moderately dry−1.50 < (SDI and RDIst) ≤ −1.00
Severely dry−2.00 < (SDI and RDIst) ≤ −1.50
Extremely dry(SDI and RDIst) ≤ 2.00

2.3. Rainfall-Runoff Model

The simulation of the river runoff is typically performed through rainfall-runoff models implementing different approaches and various levels of complexity. In this study, the monthly rainfall-runoff model (Medbasin-M) [28,29] was used to simulate the runoff reaction under various climatic conditions on an annual basis. The model uses three calibration parameters. These are the maximum soil storage capacity (Smax), the coefficient of the deep percolation (C) and the monthly delay factor (a), which is used to adjust the monthly runoff distribution [30]. The required input data for the model are monthly precipitation and PET data.
A detailed soil and land survey provides the most reliable data, which can be used for estimating the soil storage capacity (S) and obtaining the runoff curve number (CN) as part of the model requirements. However, essential data are not always available and not simply accessible. For this study, the Smax was estimated using Equation (7), which has been developed by the Natural Resources Conservation Service (NRCS, formerly known as the Soil Conservation Service), which relates Smax to CN [31,32].
  S max = 25.4 ( 1 , 000 C N 10 )
The runoff curve number is an empirical parameter, which is mainly a function of the hydrologic soil group, cover type, treatment, hydrologic condition and antecedent runoff condition. References, such as [33], provide detailed guidelines to aid in selecting the appropriate CN values considering the basin characteristics. The CN is an alternative way to estimate the model’s parameter Smax. However, in this study, there is not sufficient and reliable information, such as land use and soil types, for an accurate calculation of the CN. Therefore, Smax was calculated through a model calibration process.
Initial values of CN and C were first assumed. A two-stage process was conducted for the calibration of the model parameters. The first stage involved matching the volumes of observed and simulated hydrographs on an annual basis. In the second stage, the shape of the simulated hydrograph was compared with the shape of the observed hydrograph. A trial and error approach was utilized until the best fit was achieved. The goodness-of-fit indicators, r, RMSE, MAE and index of agreement (IoA), were used for assessing the model performance.

2.4. Methodological Approach

The following steps describe the methodology followed in this paper:
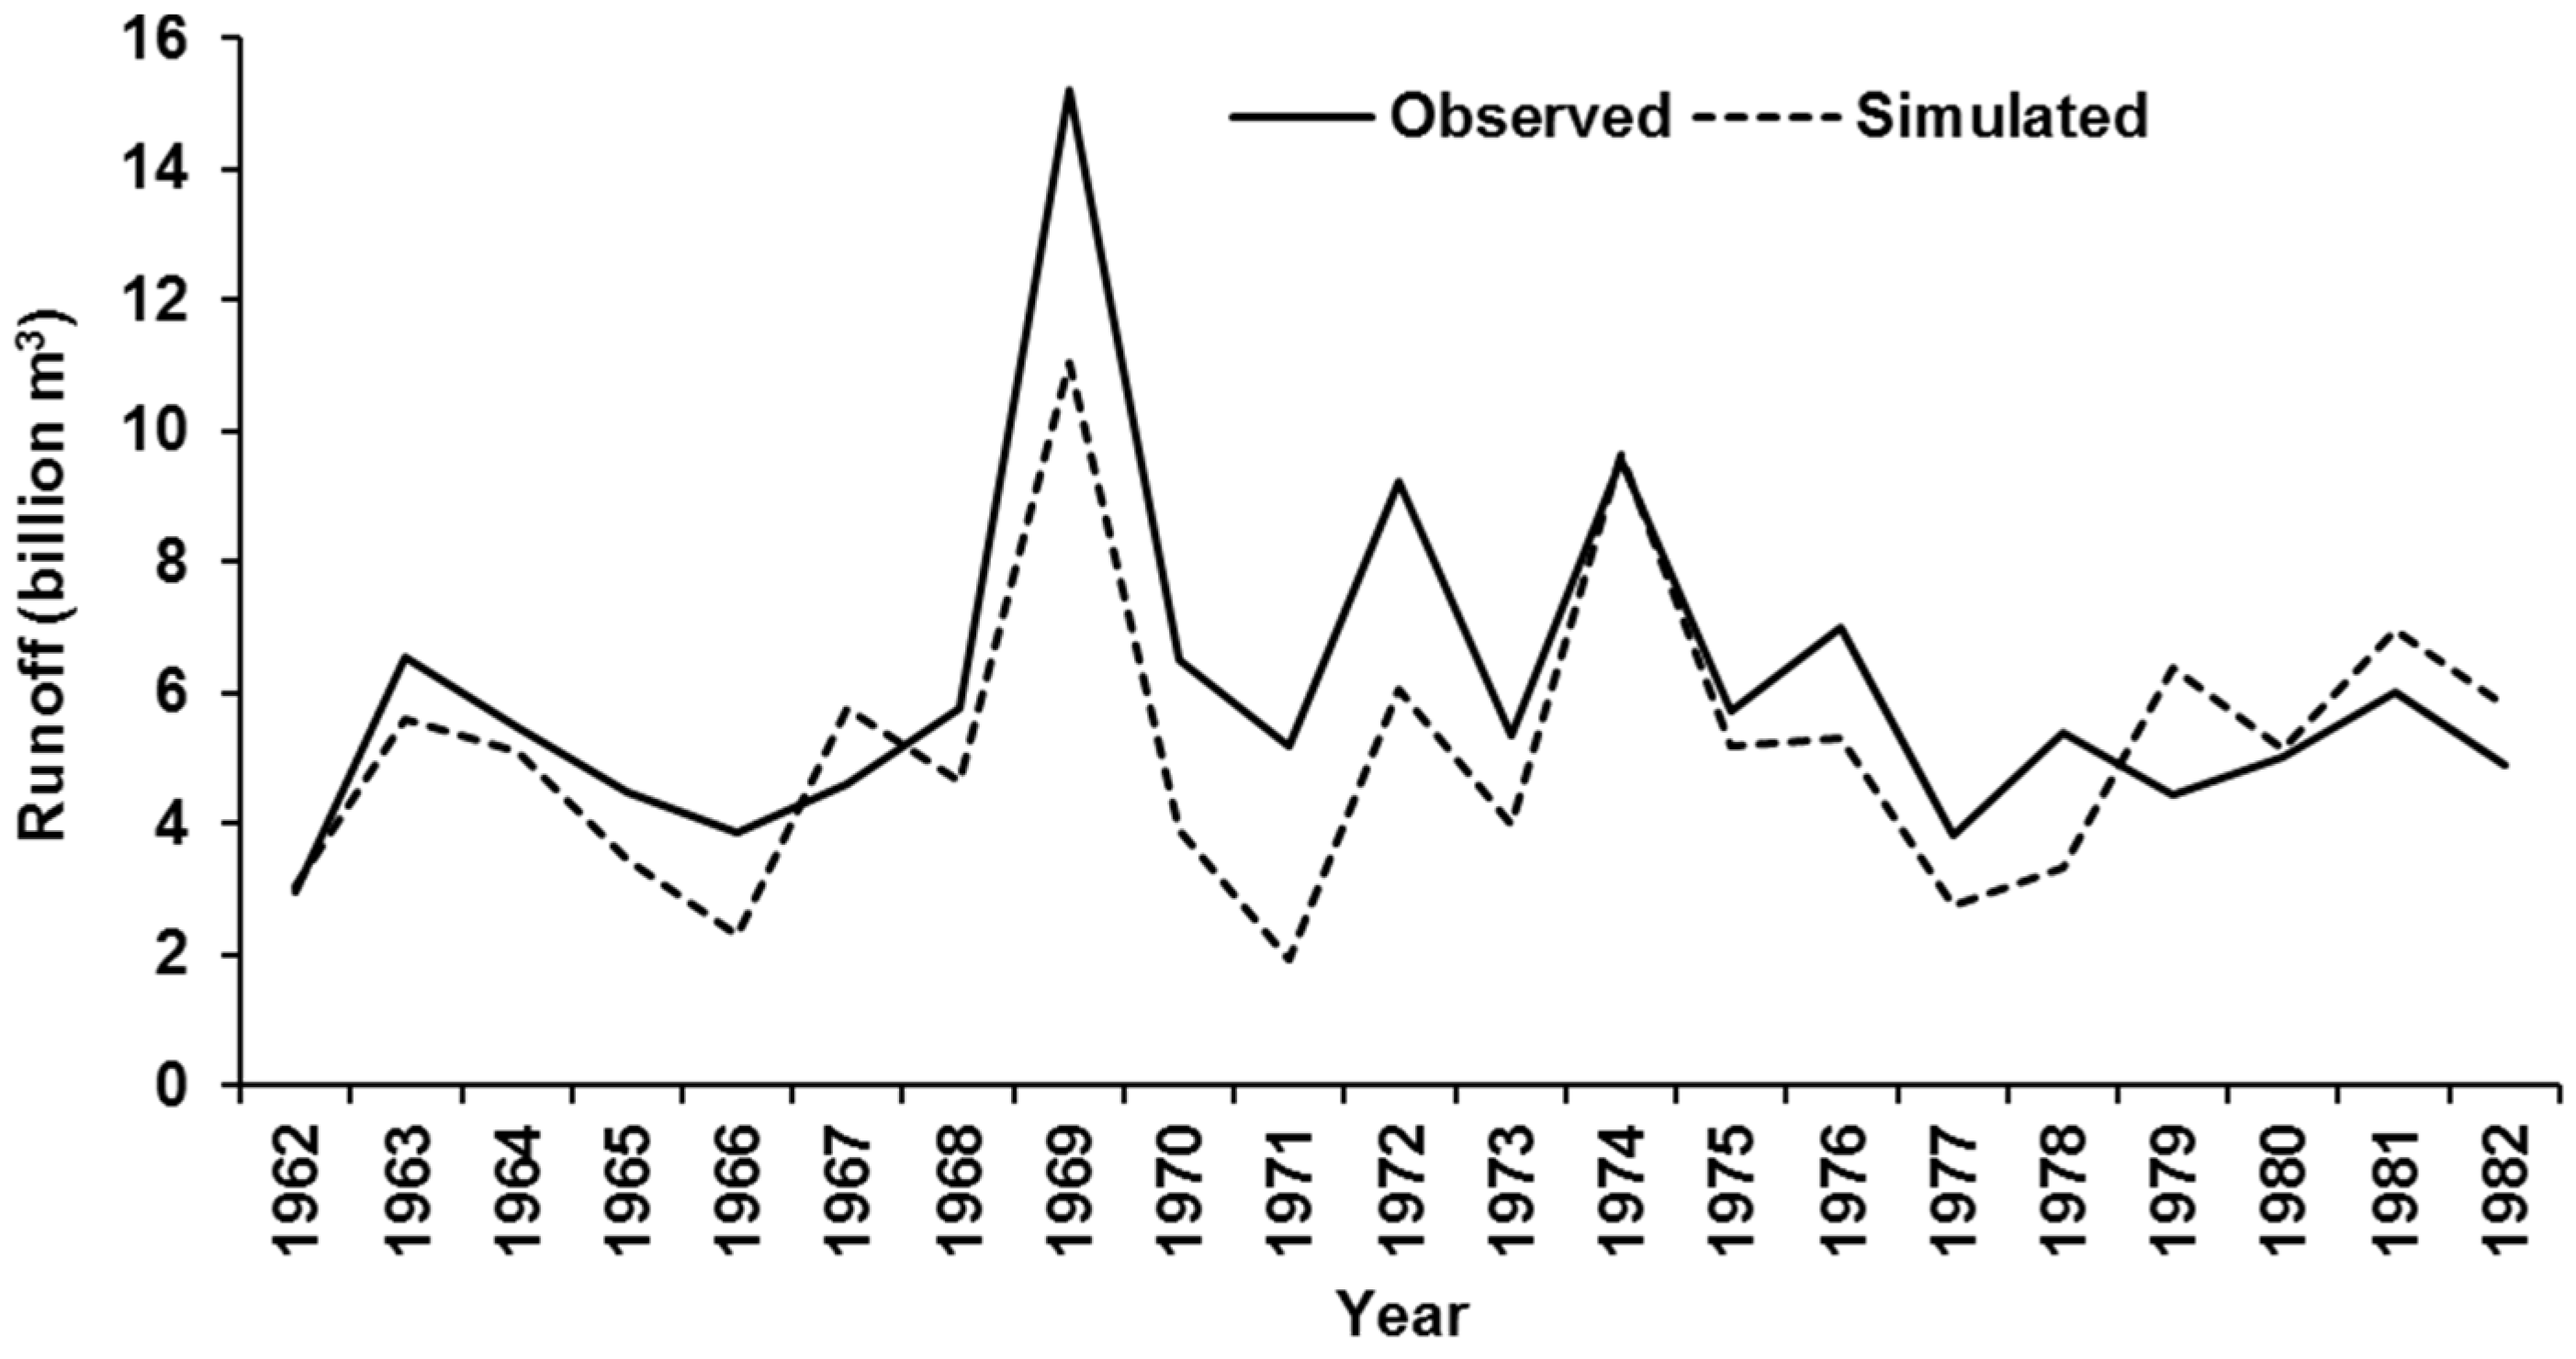
  • The Medbasin-M rainfall-runoff model was calibrated using the monthly P and PET data for the period of twelve hydrologic years (1962−1973) for which unimpaired streamflow data were observed and used for model calibration. The climatic conditions for the calibration period were mostly near to normal, with some years characterised by moderately wet or moderately dry conditions (Table 1). This allowed the unbiased calibration of the model. About 75% and 92% of the annual precipitations during the calibrated period were between the mean −SD and the mean +SD, and between mean − 2SD and mean + 2SD, respectively. The minimum, mean and the maximum annual precipitations were 520 mm, 729 mm and 1,187 mm, respectively. The SD was approximately 201 mm. The annual precipitation observed in 1969 was interpreted as an outlier. No other outliers were observed over the calibration time interval. The minimum, mean and maximum PET values were 1,215 mm, 1,287 mm and 1,364 mm, respectively. The SD was about 58 mm. No outliers were observed.
  • The simulation results were validated using monthly climatic data (P and PET) and the unregulated observed runoff for a period of nine water years (1974−1982). Some statistical goodness-of-fit tools were employed for calibrating the model and validating the simulation results. These measures are r, RMSE, MAE and IoA ([34,35] for the latter). The following formulas (Equations (8) to (11)) were applied:
    r = i = 1 n [ ( R o b s ) i R ¯ o b s ] [ ( R o b s ) i R ¯ s i m ] { i = 1 n [ ( R o b s ) i R ¯ o b s ] } 0.5 { i = 1 n [ ( R s i m ) i R ¯ s i m ] } 0.5
    RMSE = 1 n i = 1 n [ ( R o b s ) i ( R s i m ) i ] 2
    MAE = 1 n i = 1 n | ( R o b s ) i ( R s i m ) i |
    I o A = 1 i = 1 n [ ( R o b s ) i ( R s i m ) i ] 2 i = 1 n [ | ( R o b s ) i R ¯ o b s | + | ( R s i m ) i R ¯ o b s | ] 2
    where   R o b s , R s i m ,   R ¯ o b s and R ¯ s i m are the observed runoff, simulated runoff and the means of the observed and simulated runoffs, respectively. N is the number of years and i is the time step.
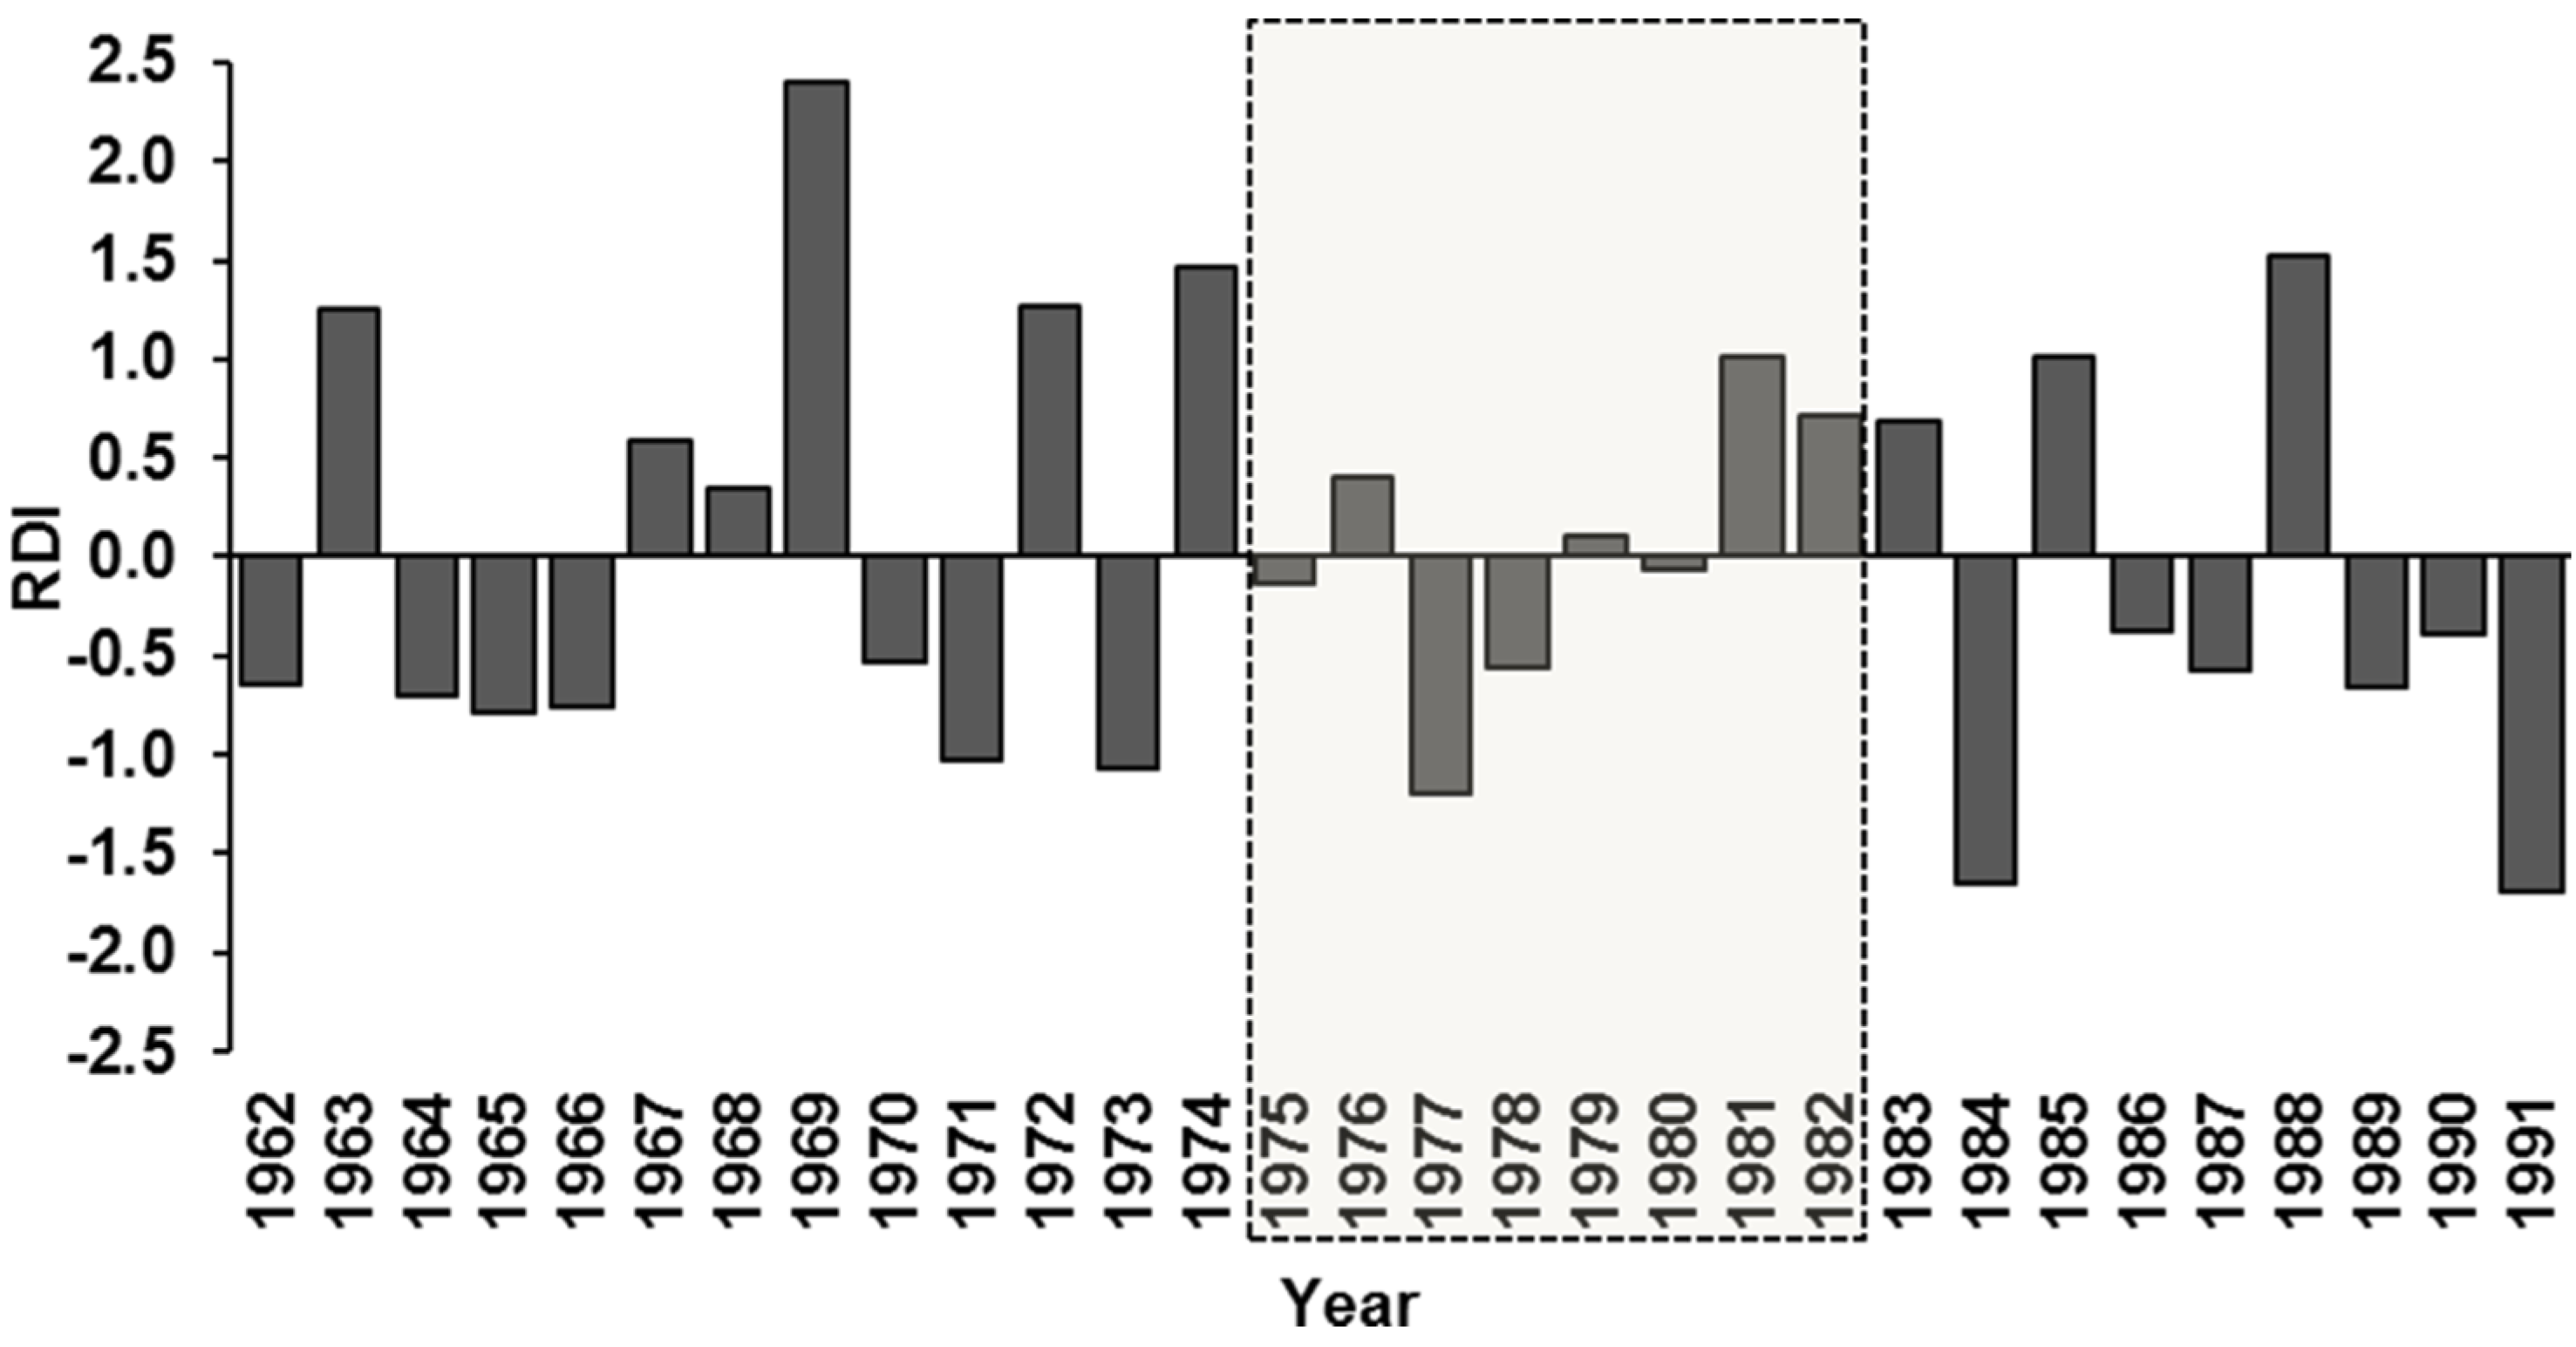
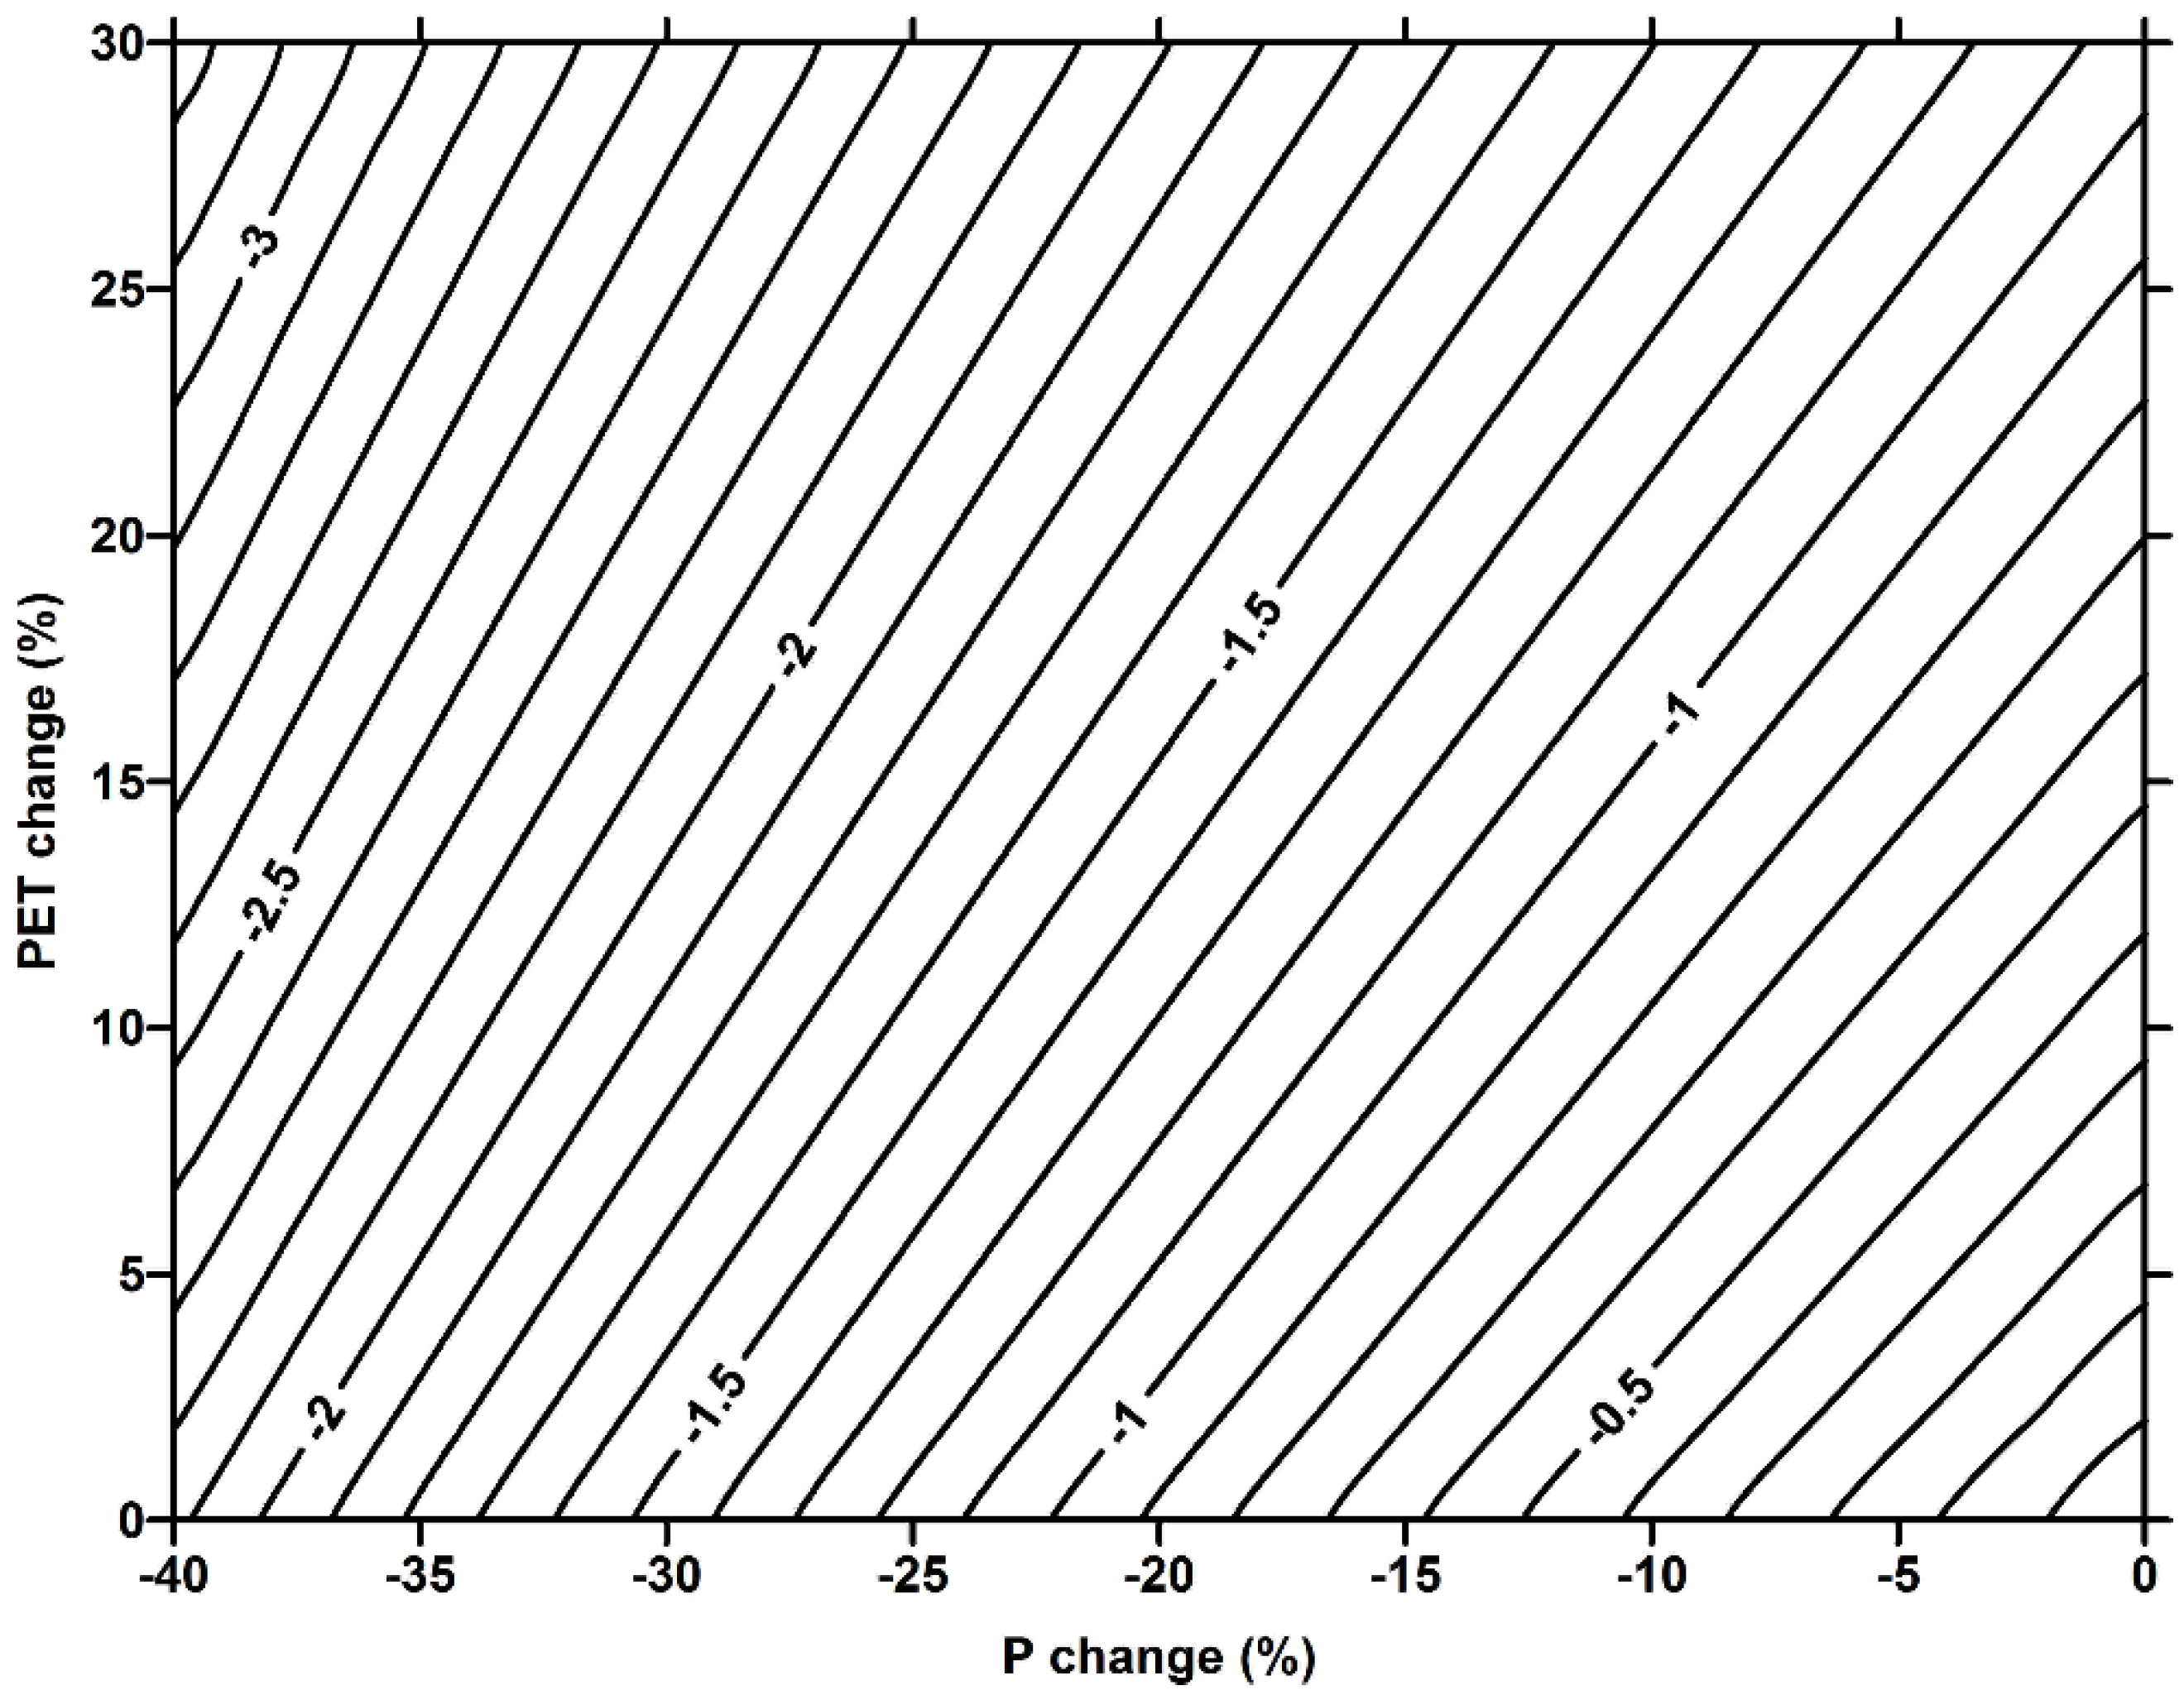
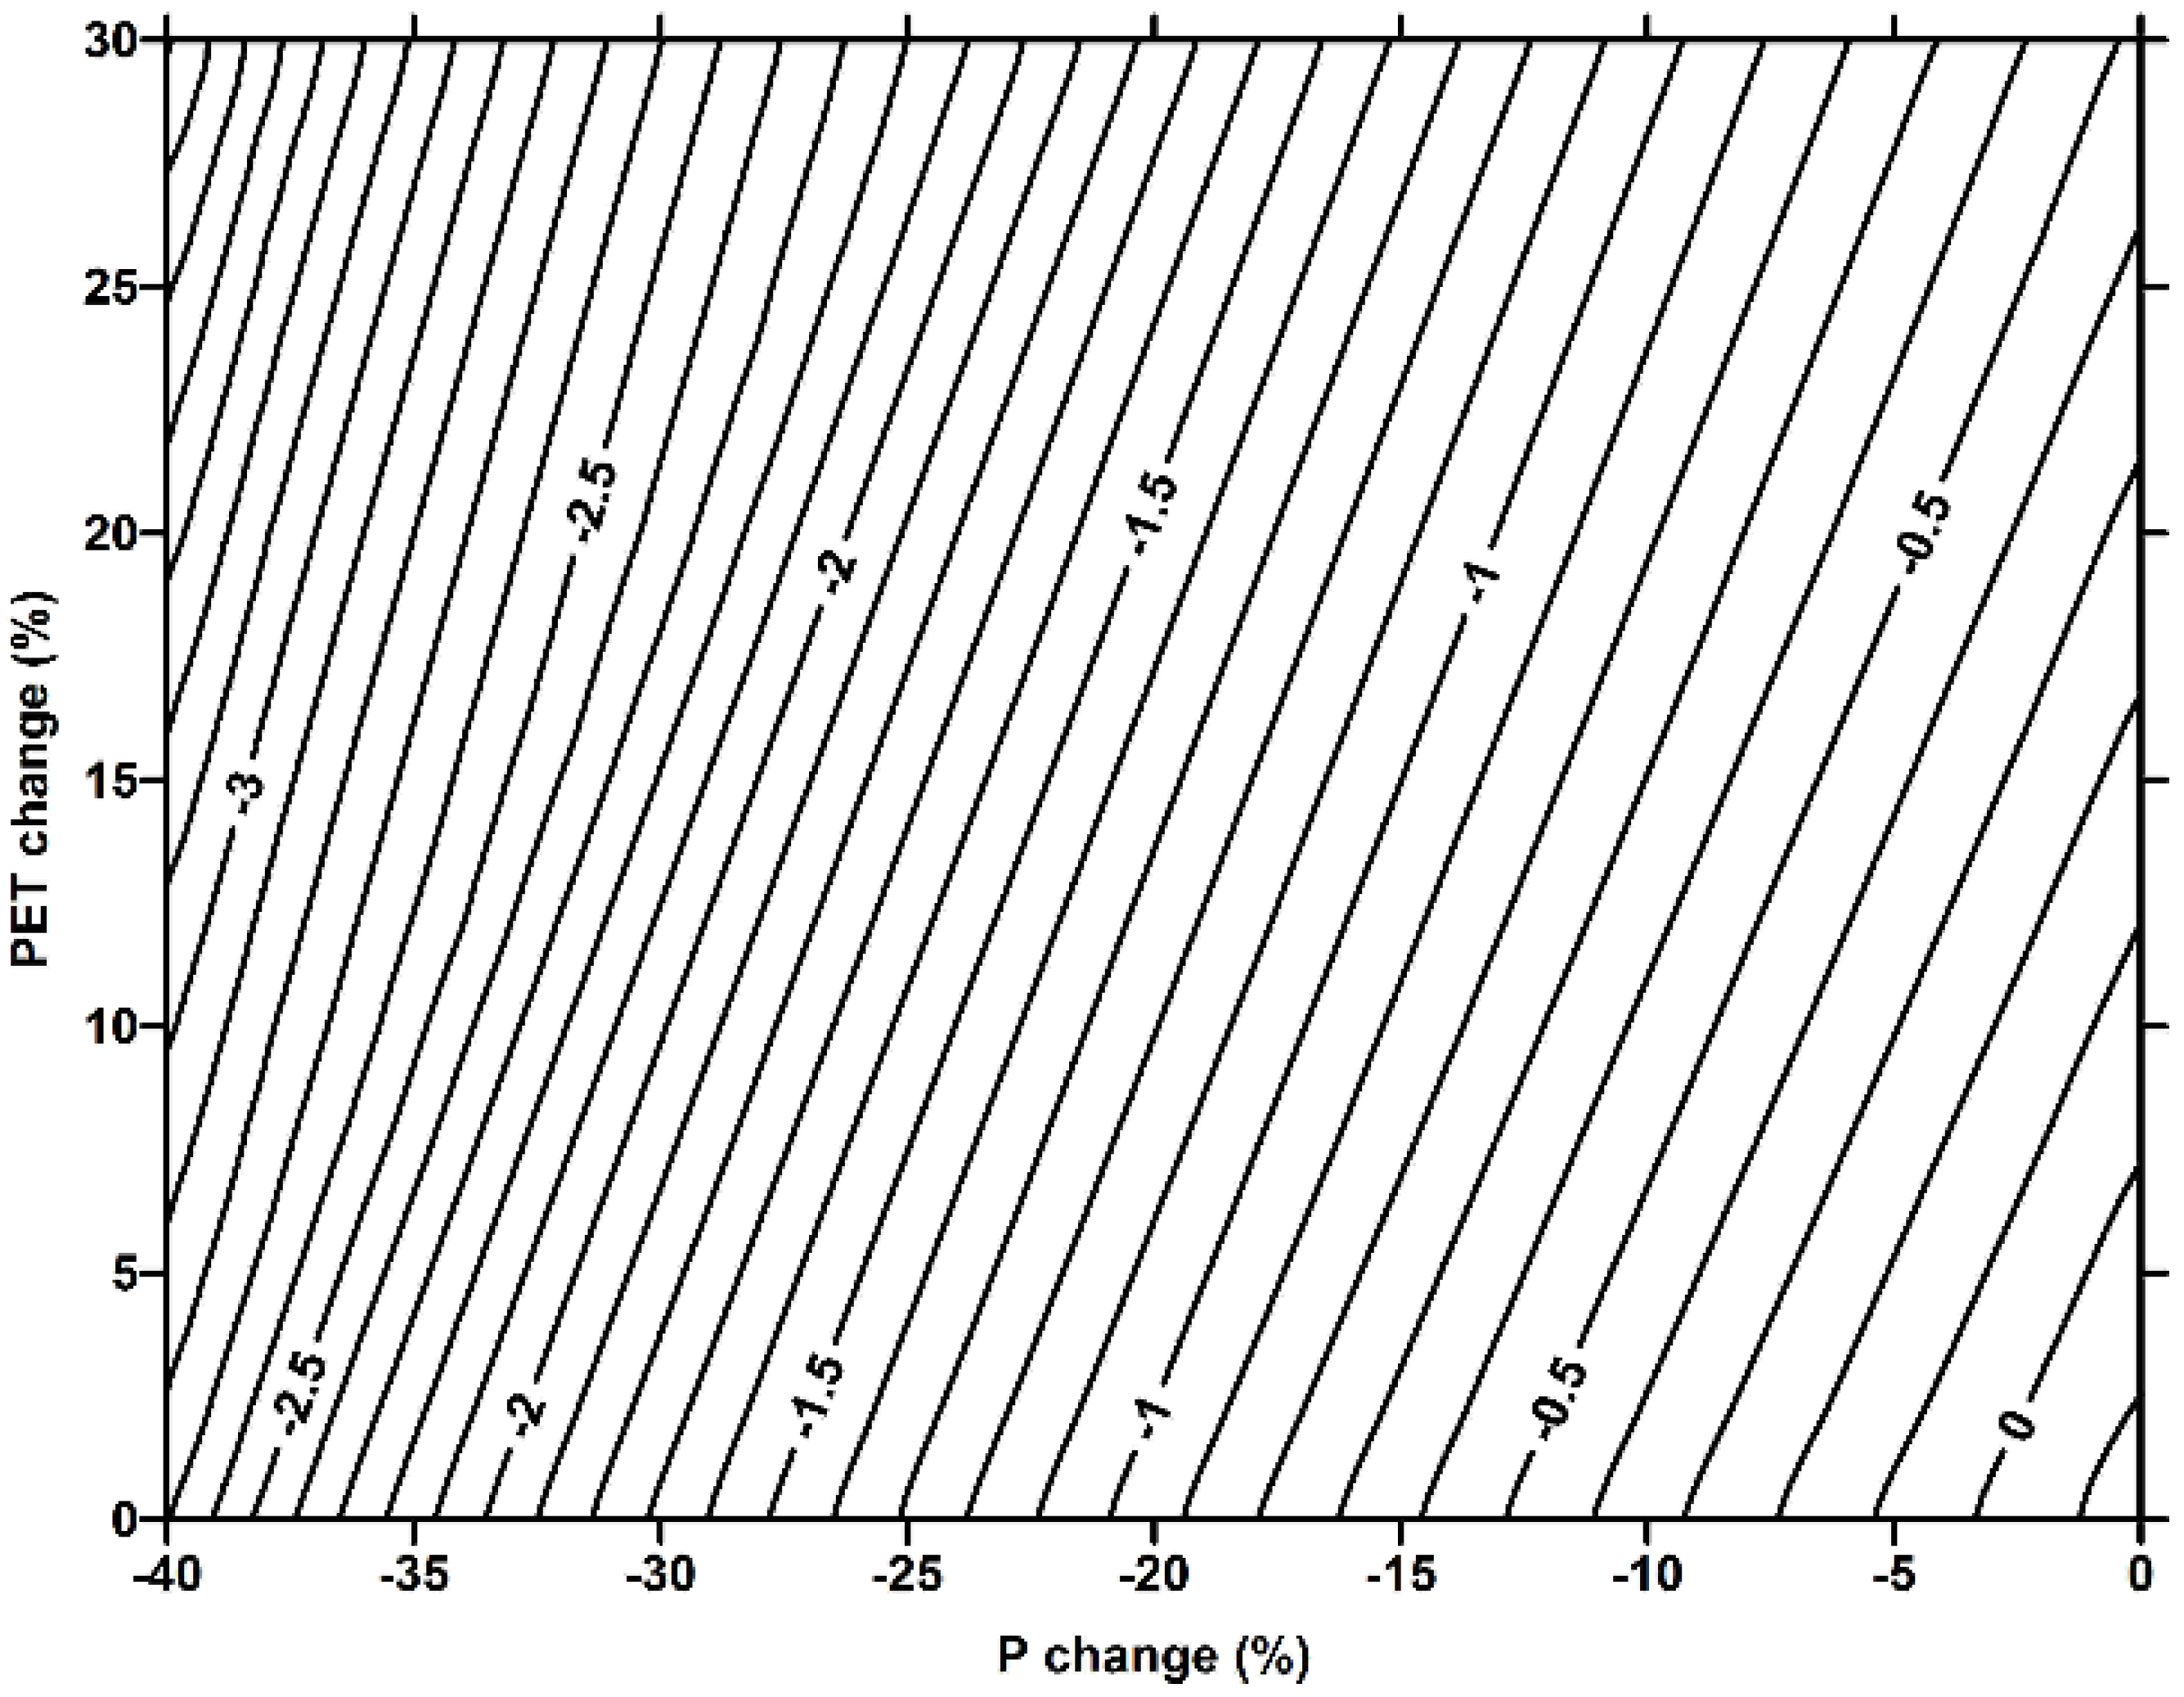
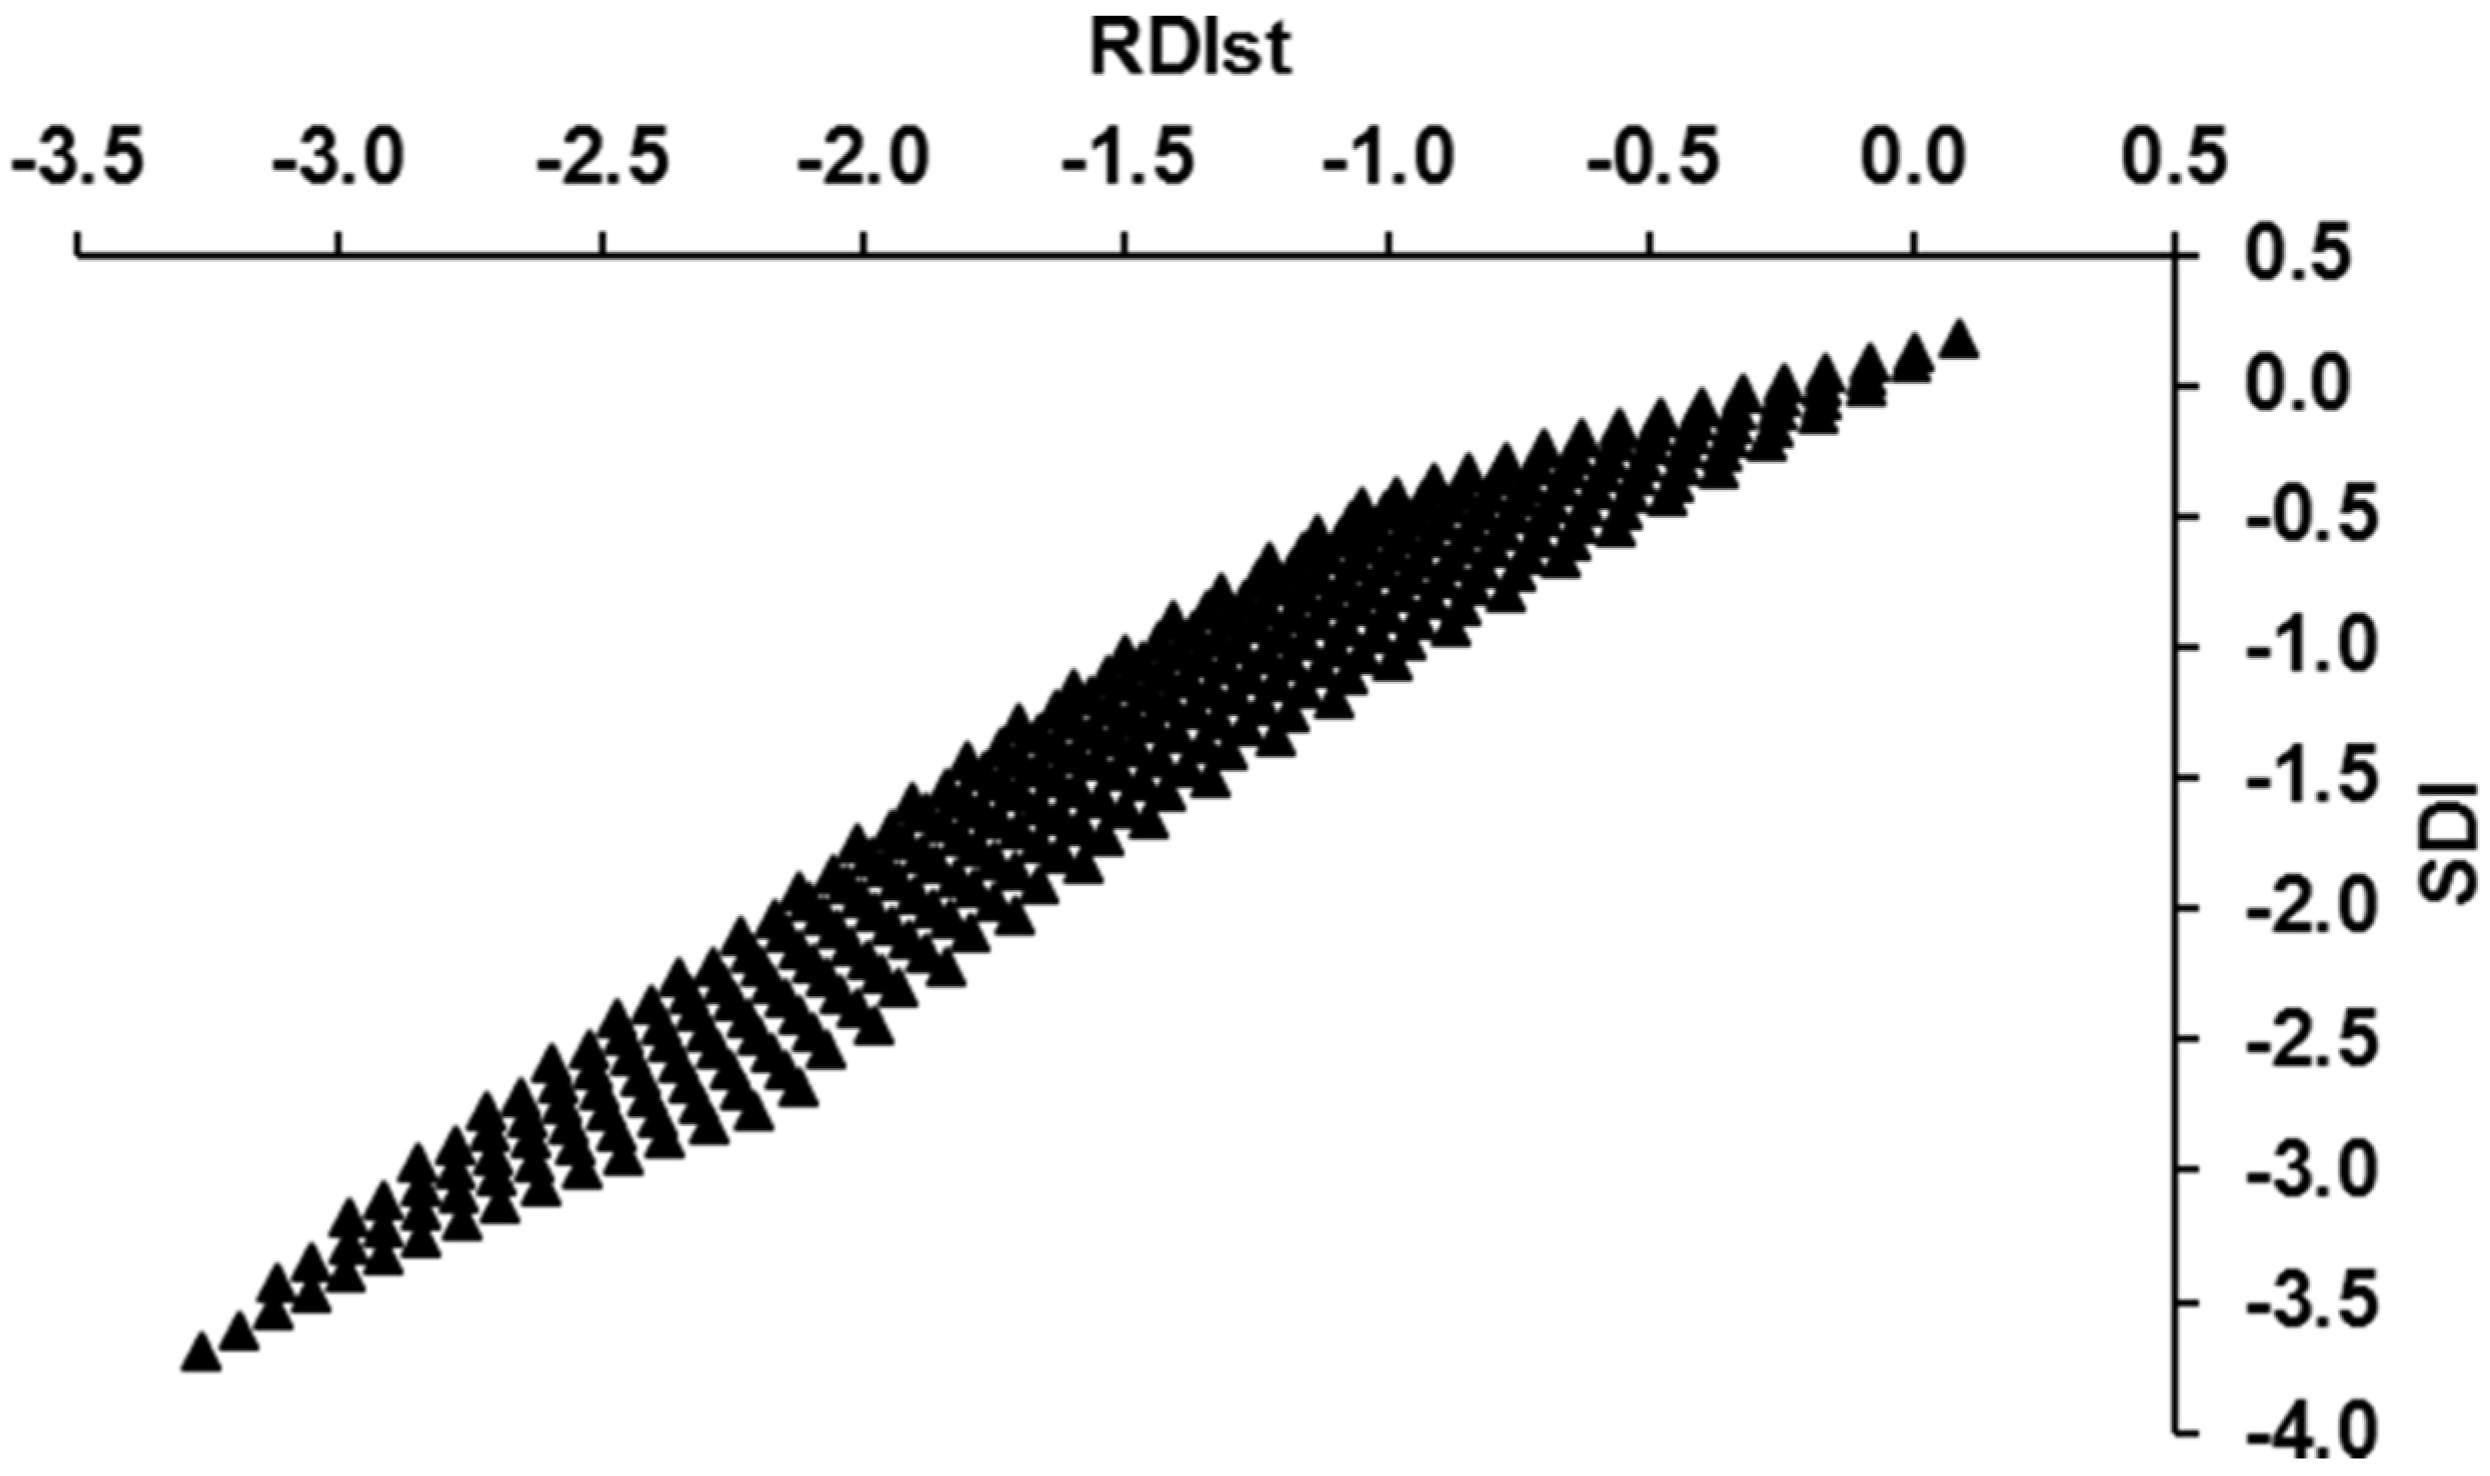
  • The RDIst values were calculated over a time window of 30 years between 1962 and 1991. This was performed to specify which period represents nearly the normal climatic condition (on average) and to assess the constants a and b of the linear Equations (12) and (13):
    R D I s t = a 1 * L n ( α 12 ) + b 1
    S D I   =   a 2 * L n ( r u n o f f ) + b 2
    where R D I s t , α 12 and SDI are the standardized form of the RDI, the initial form of the RDI and the streamflow drought index, respectively. a 1 , a 2 , b 1 and b 2 are constants. The period of nearly normal climatic condition expresses the timeframe in which no extreme RDIst values were witnessed and when, on average, the RDIst value is close to zero. The period of eight water years (1975 to 1982), which characterised the normal condition, was used for running the climatic scenarios. Moreover, the period between 1975 and 1982 was devoid of any considerable human construction activities (e.g., hydraulic control structures and large-scale irrigation schemes) in the upstream country, Iran.
  • The Medbasin-M model was used to compute the reference mean annual runoff for the normal climatic condition.
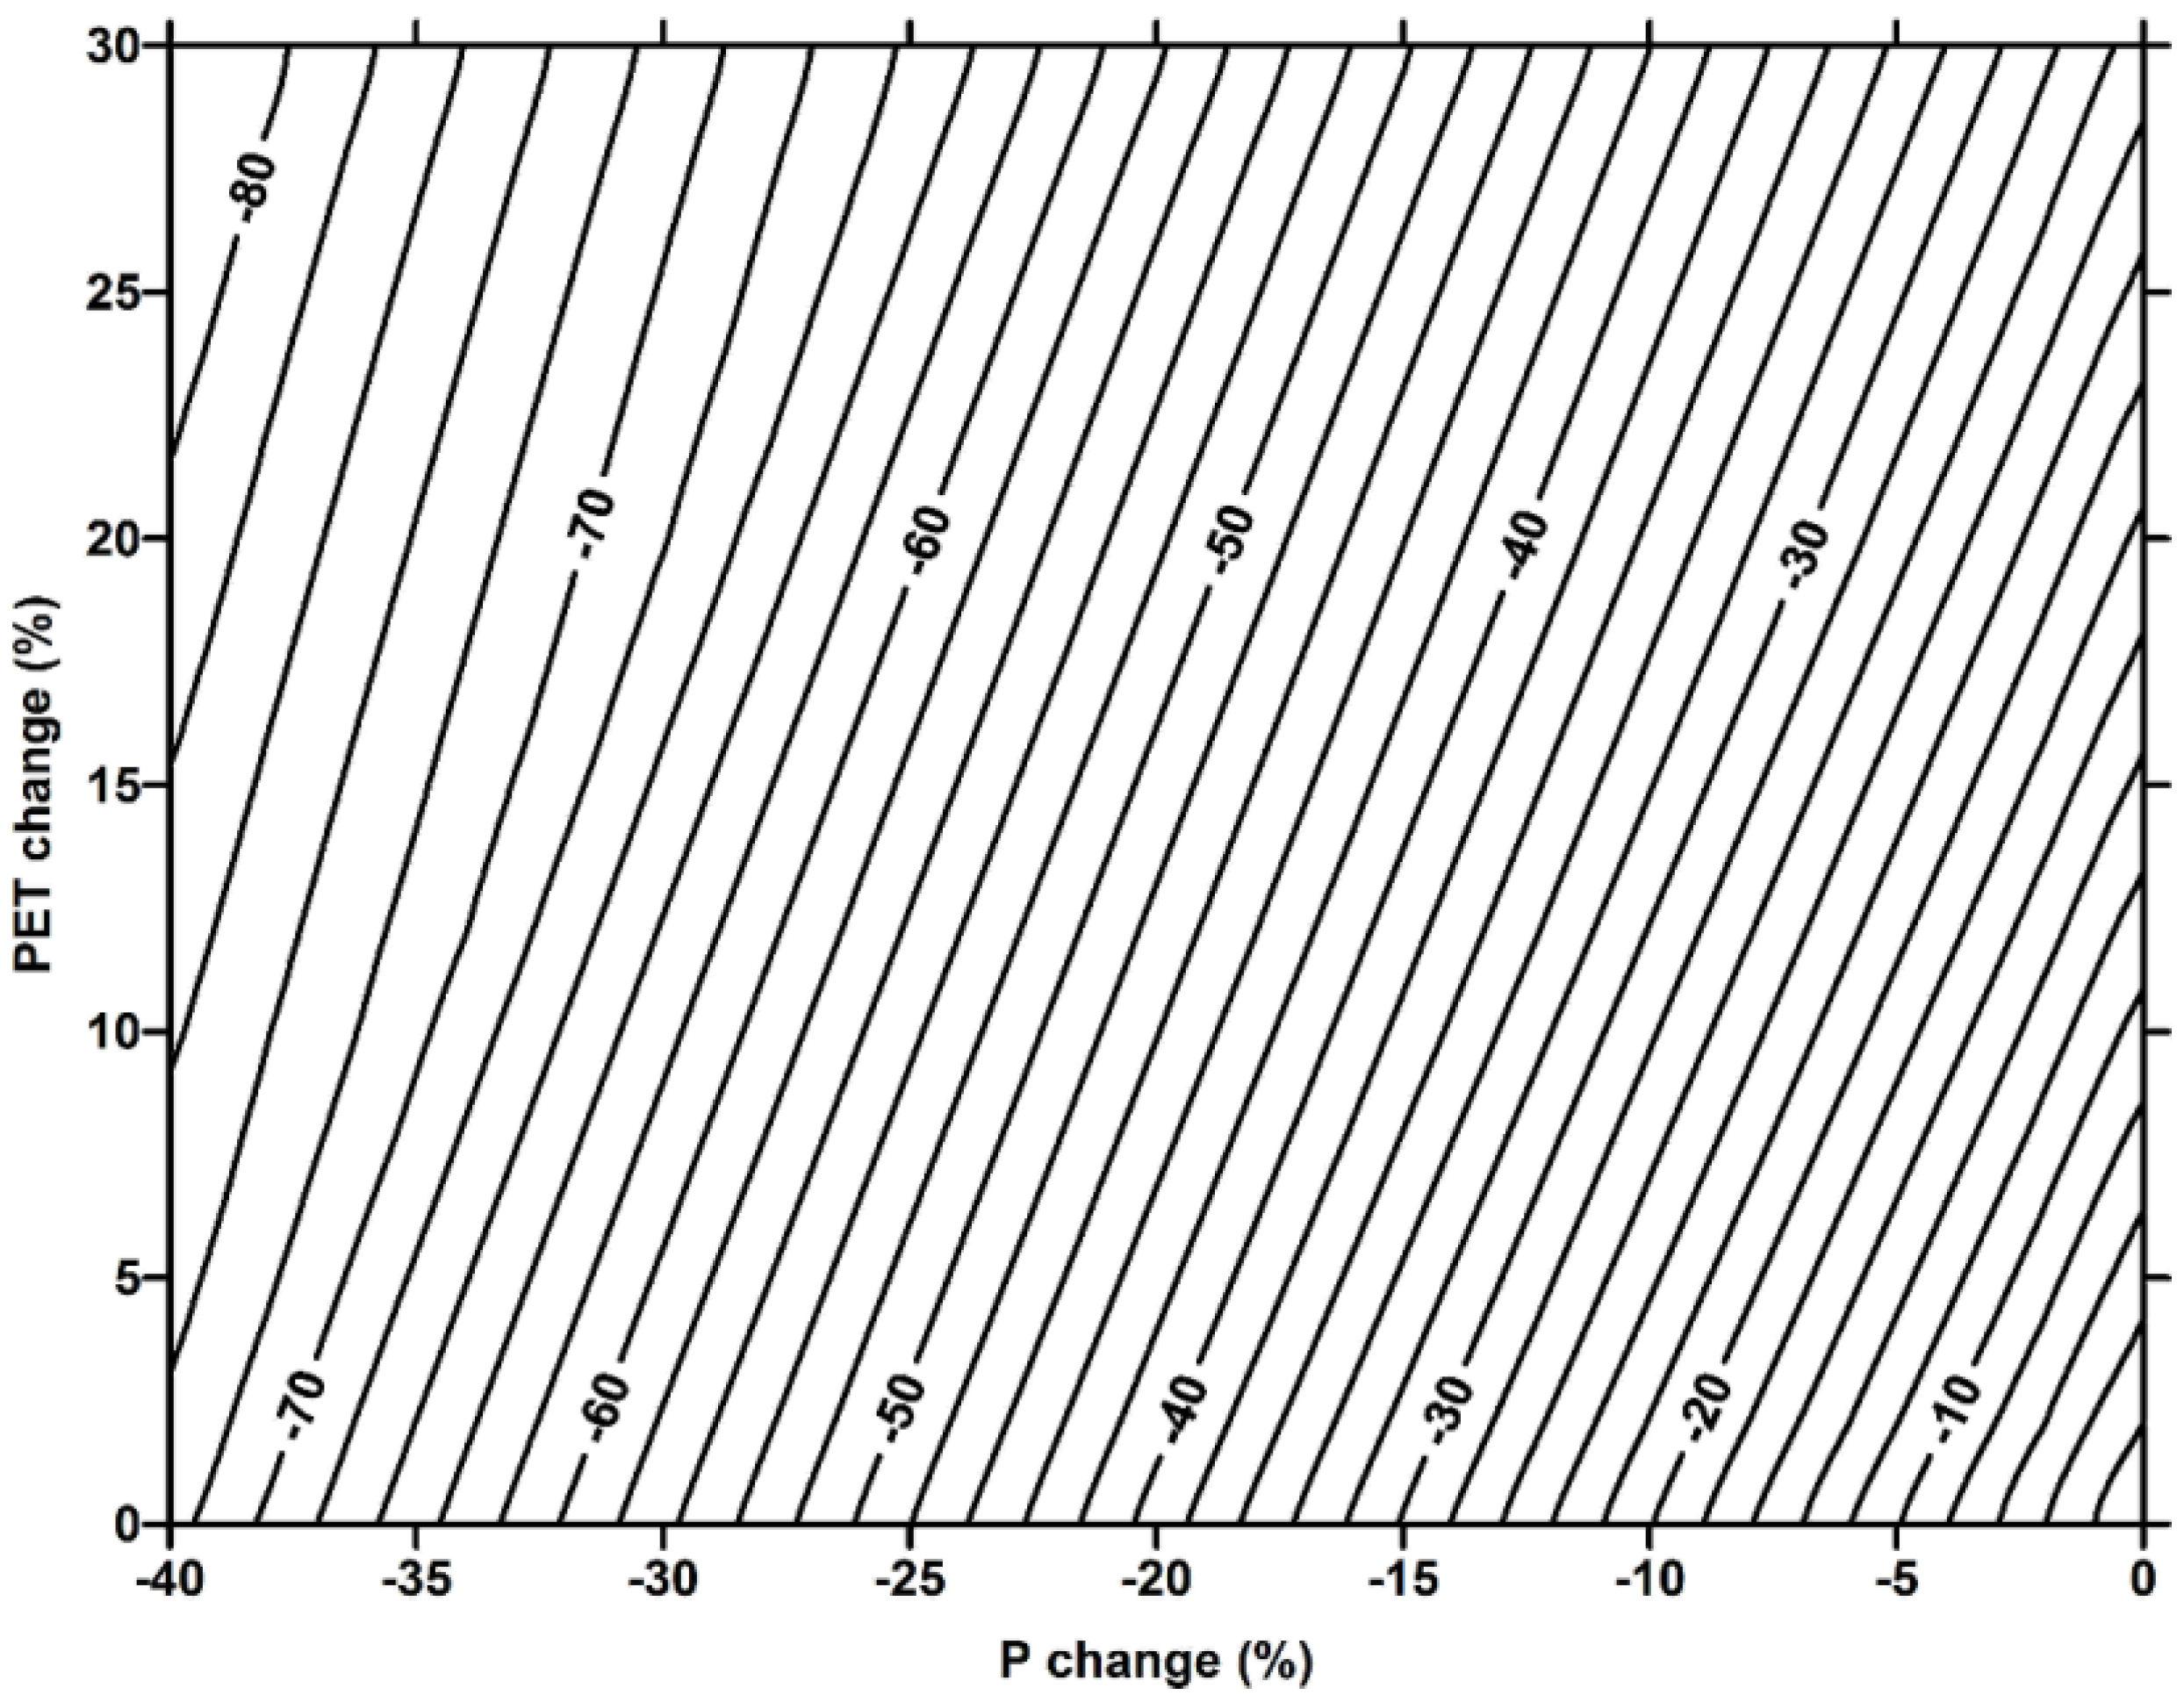
  • The Fifth Assessment Report of the IPCC [1] suggests that the region where the examined basin is located is likely to face a decline in precipitation amount and an increase in mean air temperature as part of climate change. The IPCC [36] highlighted that the annual average river runoff availability is projected to decrease by between 10% and 30% over some dry regions at mid-latitudes by 2050. Some impacted regions presently have water-stressed areas. Furthermore, an increase in drought spells is also projected for mid-latitudes. The IPCC reports also point out with high confidence (defined by IPCC) that climate change has the potential to exacerbate water resource stresses in most regions of Asia. The regional projections of temperature and precipitation in Asia based on a so-identified A2-forced emission scenario using the Atmosphere-Ocean General Circulation Model (AOGCM) simulations show that the rate of decrease in precipitation could reach −40% in winter (between December and February) and −50% in summer (between June and August). The increase in temperature would be in the order of +10% in winter and +6% in summer. It should be noted that these predictions should be considered as valid until the end of the 21st century. The synthetic scenarios for assessing the runoff sensitivity to climate change were formulated through an incremental shift of the historical P and PET values by a 2% step for a P reduction range from 0% to −40% and a PET increase from 0% to +30%. Correspondingly, 336 scenarios were developed, representing the mutual impact of deviations in P and PET values that lie within the aforementioned assortment of scenarios. These scenarios include all possible basin-wide climate change projections, as well as a wide array of drought severity conditions. The Medbasin-M model was repetitively used to simulate the runoff for the 336 scenarios.
  • The anticipated proportional change in the annual runoff (%), corresponding to each scenario, was determined relative to the reference mean annual runoff.
  • A nomograph was used for estimating the projected proportional change (%) in the climate-impacted runoff. The predictable proportional changes in the runoff represent the anticipated runoff reductions (%) relative to the long-term unimpaired mean annual runoff under the normal climatic condition.

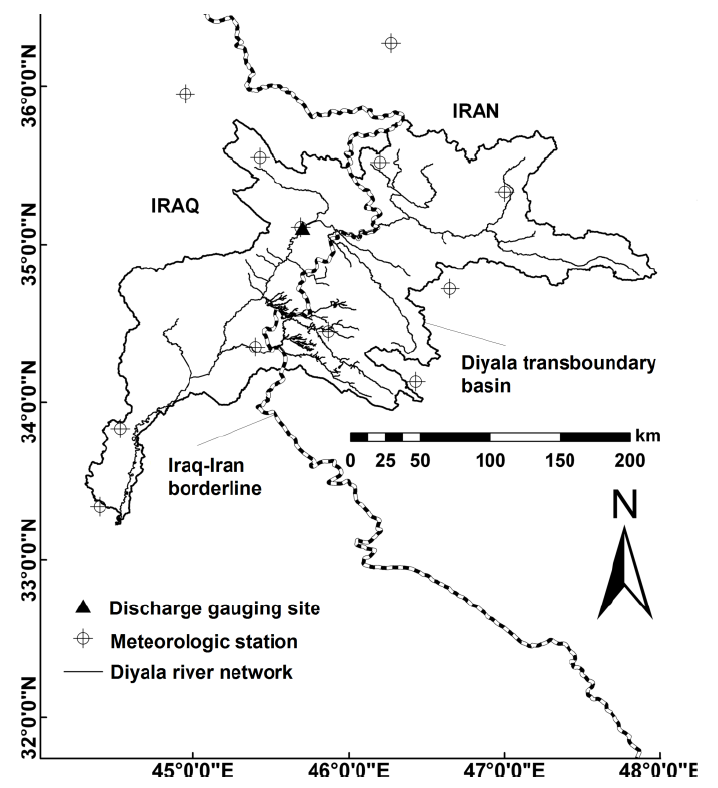
2.5. Study Area and Data Availability

The Diyala river basin shared between Iraq and Iran was chosen as an example application basin for this study. The Diyala transboundary river system stretches from its source in the Zagros Mountains of western Iran to Iraq in the east. The river watershed drains a total area of about 32,600 km2, of which 43% lies in Iraq, and has a total length of 384 km before discharging into the Tigris River south of Baghdad. The watershed is situated between the latitudes 33.216°N and 35.833°N and the longitudes 44.500°E and 46.833°E (Figure 1). The river basin is located in the arid to semi-arid climate zone. Most runoff is generated during the period of November to May. The yearly average precipitation within the basin is nearly 500 mm. However, the precipitation mainly occurs between November and April, accounting for 90% of the whole water year.
The study is limited to the upper part of the basin with a total area of 17,900 km2, which is mainly located in the upper riparian state, Iran. In the downstream country Iraq, the examined area is partly controlled by the Derbandikhan dam. In this study, the Derbandikhan hydrometric station (DHS) in Iraq is the control gauging station of the upper portion of the basin. The observed surface runoff at this station was used to calibrate and validate the constructed rainfall-runoff model. The entire basin has been prone to successive episodes of drought, particularly the severe droughts between 1999 and 2001 and the two successive years 2007 and 2008 [25,26]. Moreover, the upper segment of the basin is exceedingly dammed and witnessed the implementation of large-scale water withdrawal schemes at its source in Iran [25,26]. Agriculture represents the main consumer of water among all other sectors.
Figure 1. Diyala watershed (case study example) and the locations of the hydro-meteorological stations.
Water 06 03033 g001
Monthly precipitation and air temperature data from 13 meteorological stations (seven stations in Iran and six stations in Iraq) were available for the period between 1962 and 1991. A long-time series of 30 hydrologic years of daily flow records (1962 to 1991) observed at the DHS (Figure 1) was analysed. Data were obtained from various sources [37,38,39,40], such as the Ministry of Agriculture and Water Resources in the Kurdistan region of Iraq and the Iranian Meteorological Organization. Some other meteorological data in Iraq were obtained from the Food and Agricultural Organization of the United Nations [41]. The PET time series was computed using the Blaney–Criddle method [27].

3. Results and Discussion

3.1. Model Calibration and Simulation Results after Validation

The statistics, r, RMSE, MAE and IoA, were 0.893, 2.117, 1.733 and 0.852, respectively, during the calibration. After validation, the corresponding statistics were 0.762, 1.250, 1.093 and 0.863, in this order. Results indicate promising model outcomes during the calibration and validation stages. This emphasises that the model can be safely used for further analysis, such as running the synthetic climatic scenarios and determining the proportional change (%) in the mean annual runoff relative to the normal climatic condition. The coefficients associated with Equations (12) and (13) were 4.323, 2.634, 2.204 and −18.554, respectively. The predicted runoff volumes for the calibrated and validated periods against the observed runoff data are illustrated in Figure 2.
Figure 2. Simulated runoff data against the observed runoff records.
Water 06 03033 g002

3.2. Anticipated Runoff for Various Climatic Scenarios

Figure 3 illustrates the RDIst over a period of 30 years between 1962 and 1991. The period of eight years of nearly normal climatic conditions (1975 to 1982) was picked for running the climatic scenarios. This period experienced no extreme events, and the average value of RDIst was close to zero. Moreover, findings reveal that the reference mean annual runoff, the initial value of the RDI ( α 12 ), the RDIst and the SDI were as much as 4.87 billion m3, 0.55, 0.09 and 0.16, respectively. For an extreme climatic condition with a 40% reduction in P and a 30% increase in PET, the anticipated mean annual runoff, the α 12 , the RDIst and the SDI were about 0.84 billion m3, 0.26, −3.26 and −3.71, respectively. The projected mean annual runoff for the worst case scenario represents about 17.3% of that referred to as the “0 scenario” (4.87 billion m3).
Findings suggest a considerable impact that could be caused by climate change on the availability of water resources, particularly for the lower riparian country. Likewise, the study highlights the importance and the urgent need for pro-active plans and actions to cope with the most critical impact of drought and climate change. High-level coordination is required between all relevant parties to reduce the negative impacts and to moderate the economic and environmental losses. Furthermore, successful treatments need to be found to address the consequences that are likely to extend for a longer period after the end of the drought situation.
Figure 3. Selected simulation period for the Reconnaissance Drought Index (RDI) applied for different climatic scenarios concerning the Diyala example basin.
Water 06 03033 g003
Figure 4 shows the foreseen change (%) in the annual runoff relative to the reference mean annual runoff value referred to as the “0 scenario”. It should be stressed that the 0 scenario is based on the climate conditions of 1975–1982; therefore, the percentage of runoff change refers to that period. This figure provides a simple and useful tool that can be used by water managers and decision-makers to obtain the likely reduction (%) of the mean annual runoff according to a wide range of anomalies in P and PET.
Figure 4. Foreseen runoff changes (%) of the upper Diyala example basin for an array of climatic changes for precipitation (P) and potential evapotranspiration (PET).
Water 06 03033 g004
Figure 5 and Figure 6 demonstrate the anticipated RDIst and SDI values, respectively, according to possible changes in climatic condition (P and PET). For water governance decision-making, the problem becomes far more complex, because it deals not only with average anomalies, but also, and more decisively, with extreme events, like severe prolonged drought spells.
Figure 5. Anticipated standardised Reconnaissance Drought Index (RDIst) for the upper Diyala example basin regarding a wide range of climatic scenarios for precipitation (P) and potential evapotranspiration (PET).
Water 06 03033 g005
Figure 6. Anticipated Streamflow Drought Index (SDI) for the upper Diyala example basin regarding a wide range of climatic scenarios for precipitation (P) and potential evapotranspiration (PET).
Water 06 03033 g006
Results reveal a robust relationship between the predicted RDIst and SDI values for all examined scenarios (Figure 7). Moreover, both RDIst and SDI vary according to drought severity in a similar manner. It is noteworthy to highlight that Figure 4 to Figure 6 collectively represent a solid measure for drought and climate change signatures. The associated methodology should be part of a simple and generic tool that can be used by water managers and decision-makers to estimate the likely projected decline (%) in the mean annual streamflow, which is influenced by climate, and to quantify the drought severity corresponding to a possible decrease in P and an increase in PET. A pro-active estimation of possible climate change scenarios and their adverse impact on runoff and drought spells would provide the opportunity to improve current decisions concerned with water allocations in time and space. Moreover, the proposed method allows decision-makers to take appropriate actions in advance to avoid the likelihood of adverse impacts of drought and climate change on multi-water users, particularly those in the agricultural sector. This timely tool is of high importance to the lower riparian example country, Iraq, which has become vulnerable to recent frequent drought events and upstream human-induced activities.
The suggested approach is of a generic nature and has merits at national, regional and universal scales. At the national level, it supports water managers and other related stakeholders to take serious steps and actions to handle the anticipated reductions in runoff volume according to various scenarios of climate change and recurrent droughts. At the regional scale, the approach offers a common platform for riparian states for better coordination to reduce possible harmful environmental and socio-economic effects of shared water use in upstream countries on the downstream states. Correspondingly, at the universal level, the approach can be applied to develop similar figures and estimate the possible reductions in annual runoff due to climate alterations and drought episodes.
Figure 7. Relationship between the anticipated standardised Reconnaissance Drought Index (RDIst) and the Streamflow Drought Index (SDI) for the upper Diyala example basin.
Water 06 03033 g007

4. Conclusions and Recommendations

A simple, generic, powerful and novel approach was presented for predicting the proportional change (%) in the mean annual runoff under various climate change scenarios and anticipated droughts. The proposed methodology offers a simple and solid tool to support water managers and decision-makers in shaping better management plans and strategies for water resources that are anticipated to be available in the short to long term. Three nomographs were introduced for the anticipated alteration (%) in mean annual runoff, the anticipated RDIst and SDI, corresponding to a wide range of potential climate change. A robust relationship was found between the RDIst and SDI, indicating that the meteorological and hydrologic drought indices (RDIst and SDI) are responding in a similar manner to climate change.
The anticipated anomaly (%) in stream flow can directly be linked to the hydrological and meteorological drought levels through the corresponding nomographs for SDI and RDIst. An early assessment of meteorological drought leads to a proactive step that enables decision-makers to predict water availability for the entire water year and plan in advance measures for mitigating drought impacts. Although the nomographs were prepared for annual timescales, the same procedure could be applied for selected shorter periods within the hydrologic year (e.g., three months, six months and nine months). The developed nomographs are supportive tools for formulating strategic alertness plans to combat drought episodes and soften their effects on various water use areas, particularly the agriculture sector.
It is worth mentioning that functional medium- to long-term water management requires dependable data, reliable information and better perception of present and anticipated events in the future. The authors recommend further research work to develop similar nomographs that respond to the relative impact of both basin-wide climate change and upstream human-induced activities (e.g., man-made land use change, river damming and diversion-related hydraulic structures). Moreover, they encourage similar studies for other transboundary basins shared between countries, such as Iraq and Iran, Iraq and Turkey, as well as Mediterranean watersheds.

Acknowledgments

The authors would like to thank the Ministry of Agriculture and Water Resources in the Iraq-Kurdistan Regional Government, particularly the General Directorate for Operation of Dams and Reservoirs and the Directorate for Operation of Derbandikhan Dam for their full support in providing some useful meteorological and hydrological data used in this study.

Author Contributions

Furat Al-Faraj undertook the data analysis and prepared a draft paper. Miklas Scholz wrote the original paper. Dimitris Tigkas provided feedback on the data analysis.

Conflicts of Interest

The authors declare no conflict of interest.

References

  1. Intergovernmental Panel on Climate Change. Climate Change 2014: Impacts, Adaptation, and Vulnerability. Available online: http://www.ipcc.ch/report/ar5/wg2 (accessed on 5 May 2014).
  2. Niemeyer, S. New Drought Indices. In Proceedings of the 1st International Conference on Drought Management: Scientific and Technological Innovations (option Méditerranéennes, series A, No. 80), Zaragoza, Spain, 12–14 June 2008.
  3. Cloppet, E. Agricultural Drought Indices in France and Europe: Strengths, Weaknesses, and Limitations. In Proceedings of the Expert Meeting, Murcia, Spain, 2–4 June 2010.
  4. Zarch, M.A.A.; Malekinezhad, H.; Mobin, M.H.; Dastorani, M.T.; Kousari, M.R. Drought monitoring by reconnaissance drought index (RDI) in Iran. Water Res. Manag. 2011, 25, 3485–3504. [Google Scholar] [CrossRef]
  5. Talaee, P.H.; Tabari, H.; Ardakani, S.S. Hydrological drought in the west of Iran and possible association with large-scale atmospheric circulation patterns. Hydrol. Proc. 2012, 28, 764–773. [Google Scholar] [CrossRef]
  6. Rasheed, A.M.M. Analysis of rainfall drought periods in the North of Iraq using standard precipitation index (SPI). Al Rafidain Eng. J. 2010, 18, 60–72. [Google Scholar]
  7. United Nations Educational, Scientific and Cultural Organization. Integrated Drought Risk Management–DRM National Framework for Iraq-Executive Summary; Technical Report; UNESCO-Iraq office: Baghdad, Iraq, 2013. [Google Scholar]
  8. Tigkas, D. Drought Characterisation and Monitoring in Regions of Greece. Eur. Water 2008, 23–24, 29–39. [Google Scholar]
  9. Pangalou, D.; Tigkas, D.; Vangelis, H.; Tsakiris, G.; Nanou-Giannarou, A. Drought severity thresholds and drought management in Greece. Adv. Nat. Technol. Hazards Res. 2009, 26, 243–256. [Google Scholar]
  10. Dogan, S.; Berltay, A.; Singh, V.P. Comparison of multi-monthly rainfall-based drought severity indices, with application to semi-arid Konya closed basin, Turkey. J. Hydrol. 2012, 470–471, 255–268. [Google Scholar]
  11. Al-Qinna, M.I.; Hammouri, N.A.; Obeidat, M.M.; Ahmad, F.Y. Drought analysis in Jordan under current and future climates. Clim. Change 2011, 106, 421–440. [Google Scholar] [CrossRef]
  12. Tarawneh, Q.Y. Quantification of drought in the Kingdom of Saudi Arabia. Int. J. Water Res. Arid Environ. 2013, 2, 125–133. [Google Scholar]
  13. Tsakiris, G.; Vangelis, H. Establishing a drought index incorporating evapotranspiration. Eur. Water 2005, 9–10, 3–11. [Google Scholar]
  14. Khalili, D.; Farnoud, T.; Jamshidi, H.; Kamgar-Haghighi, A.A.; Zand-Parsa, S. Comparability analyses of the SPI and RDI meteorological drought indices in different climatic zones. Water Res. Manag. 2011, 25, 1737–1757. [Google Scholar] [CrossRef]
  15. Elagib, N.A.; Elhag, M.M. Major Climate indicators of ongoing drought in Sudan. J. Hydrol. 2011, 409, 612–625. [Google Scholar] [CrossRef]
  16. Nalbantis, I. Drought and streamflow. Eur. Water 2008, 23–24, 65–76. [Google Scholar]
  17. Nalbantis, I.; Tsakiris, G. Assessment of hydrological drought revisited. Water Res. Manag. 2009, 23, 881–897. [Google Scholar]
  18. Allen, P.; Harmel, R.D.; Dunbar, J.A.; Arnold, J.G. Upland contribution of sediment and runoff during extreme drought: A study of the 1947–1956 drought in the Blackland Prairie, Texas. J. Hydrol. 2011, 407, 1–11. [Google Scholar] [CrossRef]
  19. Tsakiris, G.; Nalbantis, I.; Pangalou, D.; Tigkas, D.; Vangelis, H. Drought Meteorological Monitoring Network Design for the Reconnaissance Drought Index (RDI). Available online: http://www.iamz.ciheam.org/medroplan/zaragoza2008/Sequia2008/Session1/D.Tigkas.pdf (accessed on 1 May 2014).
  20. Bonsal, B.; Regier, M. Historical comparison of the 2001/2002 drought in the Canadian prairies. Clim. Res. 2007, 33, 229–242. [Google Scholar] [CrossRef]
  21. Tsakiris, G.; Pangalou, D.; Vangelis, H. Regional drought assessment based on the Reconnaissance Drought Index (RDI). Water Res. Manag. 2007, 21, 821–833. [Google Scholar] [CrossRef]
  22. Tigkas, D.; Vangelis, H.; Tsakiris, G. The RDI as a composite climatic index. Eur. Water 2013, 41, 17–22. [Google Scholar]
  23. Tigkas, D.; Vangelis, H.; Tsakiris, G. The Drought Indices Calculator (DrinC). In Proceedings of the 8th International Conference of EWRA: Water Resources Management in an Interdisciplinary and Changing Context, Porto, Portugal, 26–29 June 2013.
  24. Tigkas, D.; Vangelis, H.; Tsakiris, G. DrinC: A software for drought analysis based on drought indices. Earth Sci. Inform. 2014, in press. [Google Scholar]
  25. Al-Faraj, F.A.M.; Scholz, M. Assessment of temporal hydrologic anomalies coupled with drought impact for a transboundary river flow regime. The Diyala watershed case study. J. Hydrol. 2014, 517, 64–73. [Google Scholar]
  26. Al-Faraj, F.A.M.; Scholz, M. Impact of upstream anthropogenic river regulation on downstream water availability in transboundary river watersheds. Int. J. Water Res. Dev. 2014, in press. [Google Scholar]
  27. Doorenbos, J.; Pruitt, W.O. Guidelines for Predicting Crop Water Requirements. In Food and Agriculture Organisation (FAO) of the United Nations–Irrigation and Drainage Paper 24, 2nd ed.; FAO: Rome, Italy, 1977. [Google Scholar]
  28. Tigkas, D.; Tsakiris, G. Medbasin: A Mediterranean rainfall–runoff software package. Eur. Water 2004, 5–6, 3–11. [Google Scholar]
  29. Tigkas, D.; Vangelis, H.; Tsakiris, G. Drought and climate change impact on streamflow in small watersheds. Sci. Total Environ. 2012, 440, 33–41. [Google Scholar] [CrossRef] [PubMed]
  30. Giakoumakis, S.; Dercas, N.; Karantounias, G. Validation of a Simple Water Balance Model in Pinios River Basin (Peloponnese, Greece). In Proceedings of the 6th International Conference of the European Water Resources Association (EWRA) on Sharing a Common Vision for Our Water Resources, Menton, France, 7–10 September 2005.
  31. Soil Conservation Service. National Engineering Handbook. Section 4 on Hydrology; Department of Agriculture: Washington, DC, USA, 1972.
  32. Gregory, M.A.; Cunningham, B.A.; Schmidt, M.F.; Mack, B.W. Estimating Soil Storage Capacity for Stormwater Modeling Applications. In Proceedings of the 6th Biennial Conference on Stormwater Research and Watershed Management, Southwest Florida, FL, USA, 14–17 September 1999.
  33. United States Department of Agriculture. Urban hydrology for small watersheds. In Technical Release 55 (TR-55), 2nd ed.Natural Resources Conservation Service, Conservation Engineering Division: Washington, DC, USA, 1986. [Google Scholar]
  34. Willmott, C.J. On the validation of models. Phys. Geogr. 1981, 2, 184–194. [Google Scholar]
  35. Willmott, C.J.; Robesonb, S.M.; Matsuuraa, K. A refined index of model performance. Int. J. Climatol. 2012, 32, 2088–2094. [Google Scholar] [CrossRef]
  36. Intergovernmental Panel on Climate Change (IPCC). Climate Change 2007: Impacts, Adaptation, and Vulnerability; Contribution of Working Group II to the Fourth Assessment Report of the IPCC; Cambridge University Press: Cambridge, UK, 2007. [Google Scholar]
  37. Harza Engineering Company and Binnie & Partners. Hydrological Survey of Iraq; Discharges for Selected Gauging Stations in Iraq, Report; Harza Engineering Company: Chicago, IL, USA; Binnie & Partners: London, UK, 1958. [Google Scholar]
  38. Harza Engineering Company and Binnie & Partners. Hydrological Survey of Iraq; Discharges for Selected Gauging Stations in Iraq, Report; Harza Engineering Company: Chicago, IL, USA; Binnie & Partners: London, UK, 1959. [Google Scholar]
  39. Harza Engineering Company and Binnie & Partners. Hydrological Survey of Iraq; Main Report; Harza Engineering Company: Chicago, IL, USA; Binnie & Partners: London, UK, 1963. [Google Scholar]
  40. Ministry of Agriculture and Water Resources-Kurdistan Regional Government (MA and WR-KRG). Various Official Data Sets, General Directorate of Dams and Reservoirs and Directorate for Operation of Derbandikhan; MA and WR-KRG: Erbil and Sulaymaniya, Iraq, 2013.
  41. Food and Agriculture Organization of the United Nations (FAO). Hydrogeology of Northern Iraq, Volume 1–Climate, Hydrology, Geomorphology and Geology; FAO: Rome, Italy, 2004. [Google Scholar]

