Article

Development of a GIS-Based Decision Support System for Diagnosis of River System Health and Restoration

1
College of Water Conservancy and Hydropower, Hohai University, 1 Xikang Road, Nanjing 210098, Jiangsu, China
2
China Institute of Water Resources and Hydropower Research, Beijing 100038, China
3
Sciences and Technology, University of Mascara, Mascara 29000, Algeria
*
Author to whom correspondence should be addressed.
These authors contributed equally to this work.
Water 2014, 6(10), 3136-3151; https://doi.org/10.3390/w6103136
Submission received: 22 July 2014 / Revised: 11 October 2014 / Accepted: 14 October 2014 / Published: 17 October 2014

Abstract

:
The development of a decision support system (DSS) to inform policy making has been progressing rapidly. This paper presents a generic framework and the development steps of a decision tool prototype of geographic information systems (GIS)-based decision support system of river health diagnosis (RHD-DSS). This system integrates data, calculation models, and human knowledge of river health status assessment, causal factors diagnosis, and restoration decision making to assist decision makers during river restoration and management in Zhejiang Province, China. Our RHD-DSS is composed of four main elements: the graphical user interface (GUI), the database, the model base, and the knowledge base. It has five functional components: the input module, the database management, the diagnostic indicators management, the assessment and diagnosis, and the visual result module. The system design is illustrated with particular emphasis on the development of the database, model schemas, diagnosis and analytical processing techniques, and map management design. Finally, the application of the prototype RHD-DSS is presented and implemented for Xinjiangtang River of Haining County in Zhejiang Province, China. This case study is used to demonstrate the advantages gained by the application of this system. We conclude that there is great potential for using the RHD-DSS to systematically manage river basins in order to effectively mitigate environmental issues. The proposed approach will provide river managers and designers with improved insight into river degradation conditions, thereby strengthening the assessment process and the administration of human activities in river management.

1. Introduction

In China as well as worldwide, river systems face many challenges, and the issues of river health and restoration are receiving increased attention [1,2,3]. In December 2008, the Ministry of Water Resources of China ratified a statement of planning tasks in the Act of Aquatic Ecosystem Conservation and Restoration of Main Rivers and Lakes in China, in which the restoration and maintenance of “healthy” river ecosystems was designated as an important objective of river management [1]. The concept of river health originated in Europe, America, and Australia [4], and some river health assessment systems, such as ASSEES-HKH (Assessment System to Evaluate the Ecological Status of Rivers in the Hindu Kush-Himalayan Region) [4] and AusRivAS (Australian River Assessment System) [5,6,7] have been developed. These systems feature complexly linked multi-scale data and assessment models, and they aim to evaluate the ecological status of rivers to provide a scientific basis for applied decision making. Specifically, these systems help river managers evaluate a river’s status and identify its problems. However, the reasons for these problems may be difficult to quantitatively assess using these systems. As the issue of river system health is a complex subject, involving multi-dimensional, spatial, and non-spatial data of hydrological, chemical, physical, biological, and climatologic characteristics and processes [8,9], the task of diagnosing river system health is to transform these very large, complex, and unorganized data into information useful for decision making [10,11] to ultimately derive conclusive trends or patterns of river system development. To quantitatively diagnose and map river quality and analyze the main anthropogenic factors, a new robust computer-based methodology and framework should be developed, incorporating river systems features at multiple scales [12,13].
Current trends and progress in river system management include the integration of decision support systems (DSS) and geographic information systems (GIS) to provide the necessary spatial database for transforming a simple spatial query and visualization tool into a powerful analytical and spatially distributed modeling tool [13]. The concept of DSS emerged in the 1970s when it was proposed for computerized systems to assist in addressing semi-structured and unstructured problems [14,15]. Over the past few decades, considerable work on DSS has been conducted in the fields of water resources, water quality, and river management, resulting in a variety of decision support systems (e.g., SWQAT [11], Elbe-DSS [16], MULINO Decision Support System [17], RiverSpill [18], Sonhua River Pollution EDSS [19], WaterWare [20], AQUATOOL [21], FLOODSS [22], DSSIPM [23]), ranging from design to planning, management and operations, and they have been presented at different scales [24]. GIS is an information system for capturing, storing, analyzing, managing, and presenting data that are spatially referenced (linked to location) [24]. It is often used to develop automated methods for quantifying spatial variability, while supporting the reorganization, integration, and analysis of data to enable users to access information quickly and accurately [25]. Recent advances in GIS technology facilitate the seamless integration of GIS and computer-based DSS [24,25]. These tools are characterized from early integrated assessment models [26] and ecological economic models [27] and are applied to spatially explicit and complex systems, such as ISDSS (Integrated Spatial Decision Support Systems) by van Delden [28]. These tools have since been developed to address complexity in management and environmental impact assessment. Previous studies have addressed the design and development of decision support and other software systems; however, there are few practical tools integrating GIS and DSS as they apply to river system health. Because of the inherent ability to accommodate spatially complex data, GIS are invaluable to addressing river system management and day-to-day monitoring tasks. In particular, they are able to accommodate the complex and multi-dimensional nature of problems associated with river system health. Therefore, by combining the capabilities of GIS, database technology, modeling techniques, and optimization procedures, a GIS-based DSS for river health diagnosis will greatly improve the efficiency and quality of making decisions and developing policies in river system management.
This study aims to discuss the architecture and the functional modules of a GIS-based river health diagnosis decision support system (RHD-DSS) as well as a procedure for its design and application. This system is designed not only to systematize data and facilitate the assessment of river system health, but also to analyze the spatial and non-spatial causal factors of degradation and, ultimately, to make restoration decisions at the reach or segment scale.

2. Architecture and Function Module

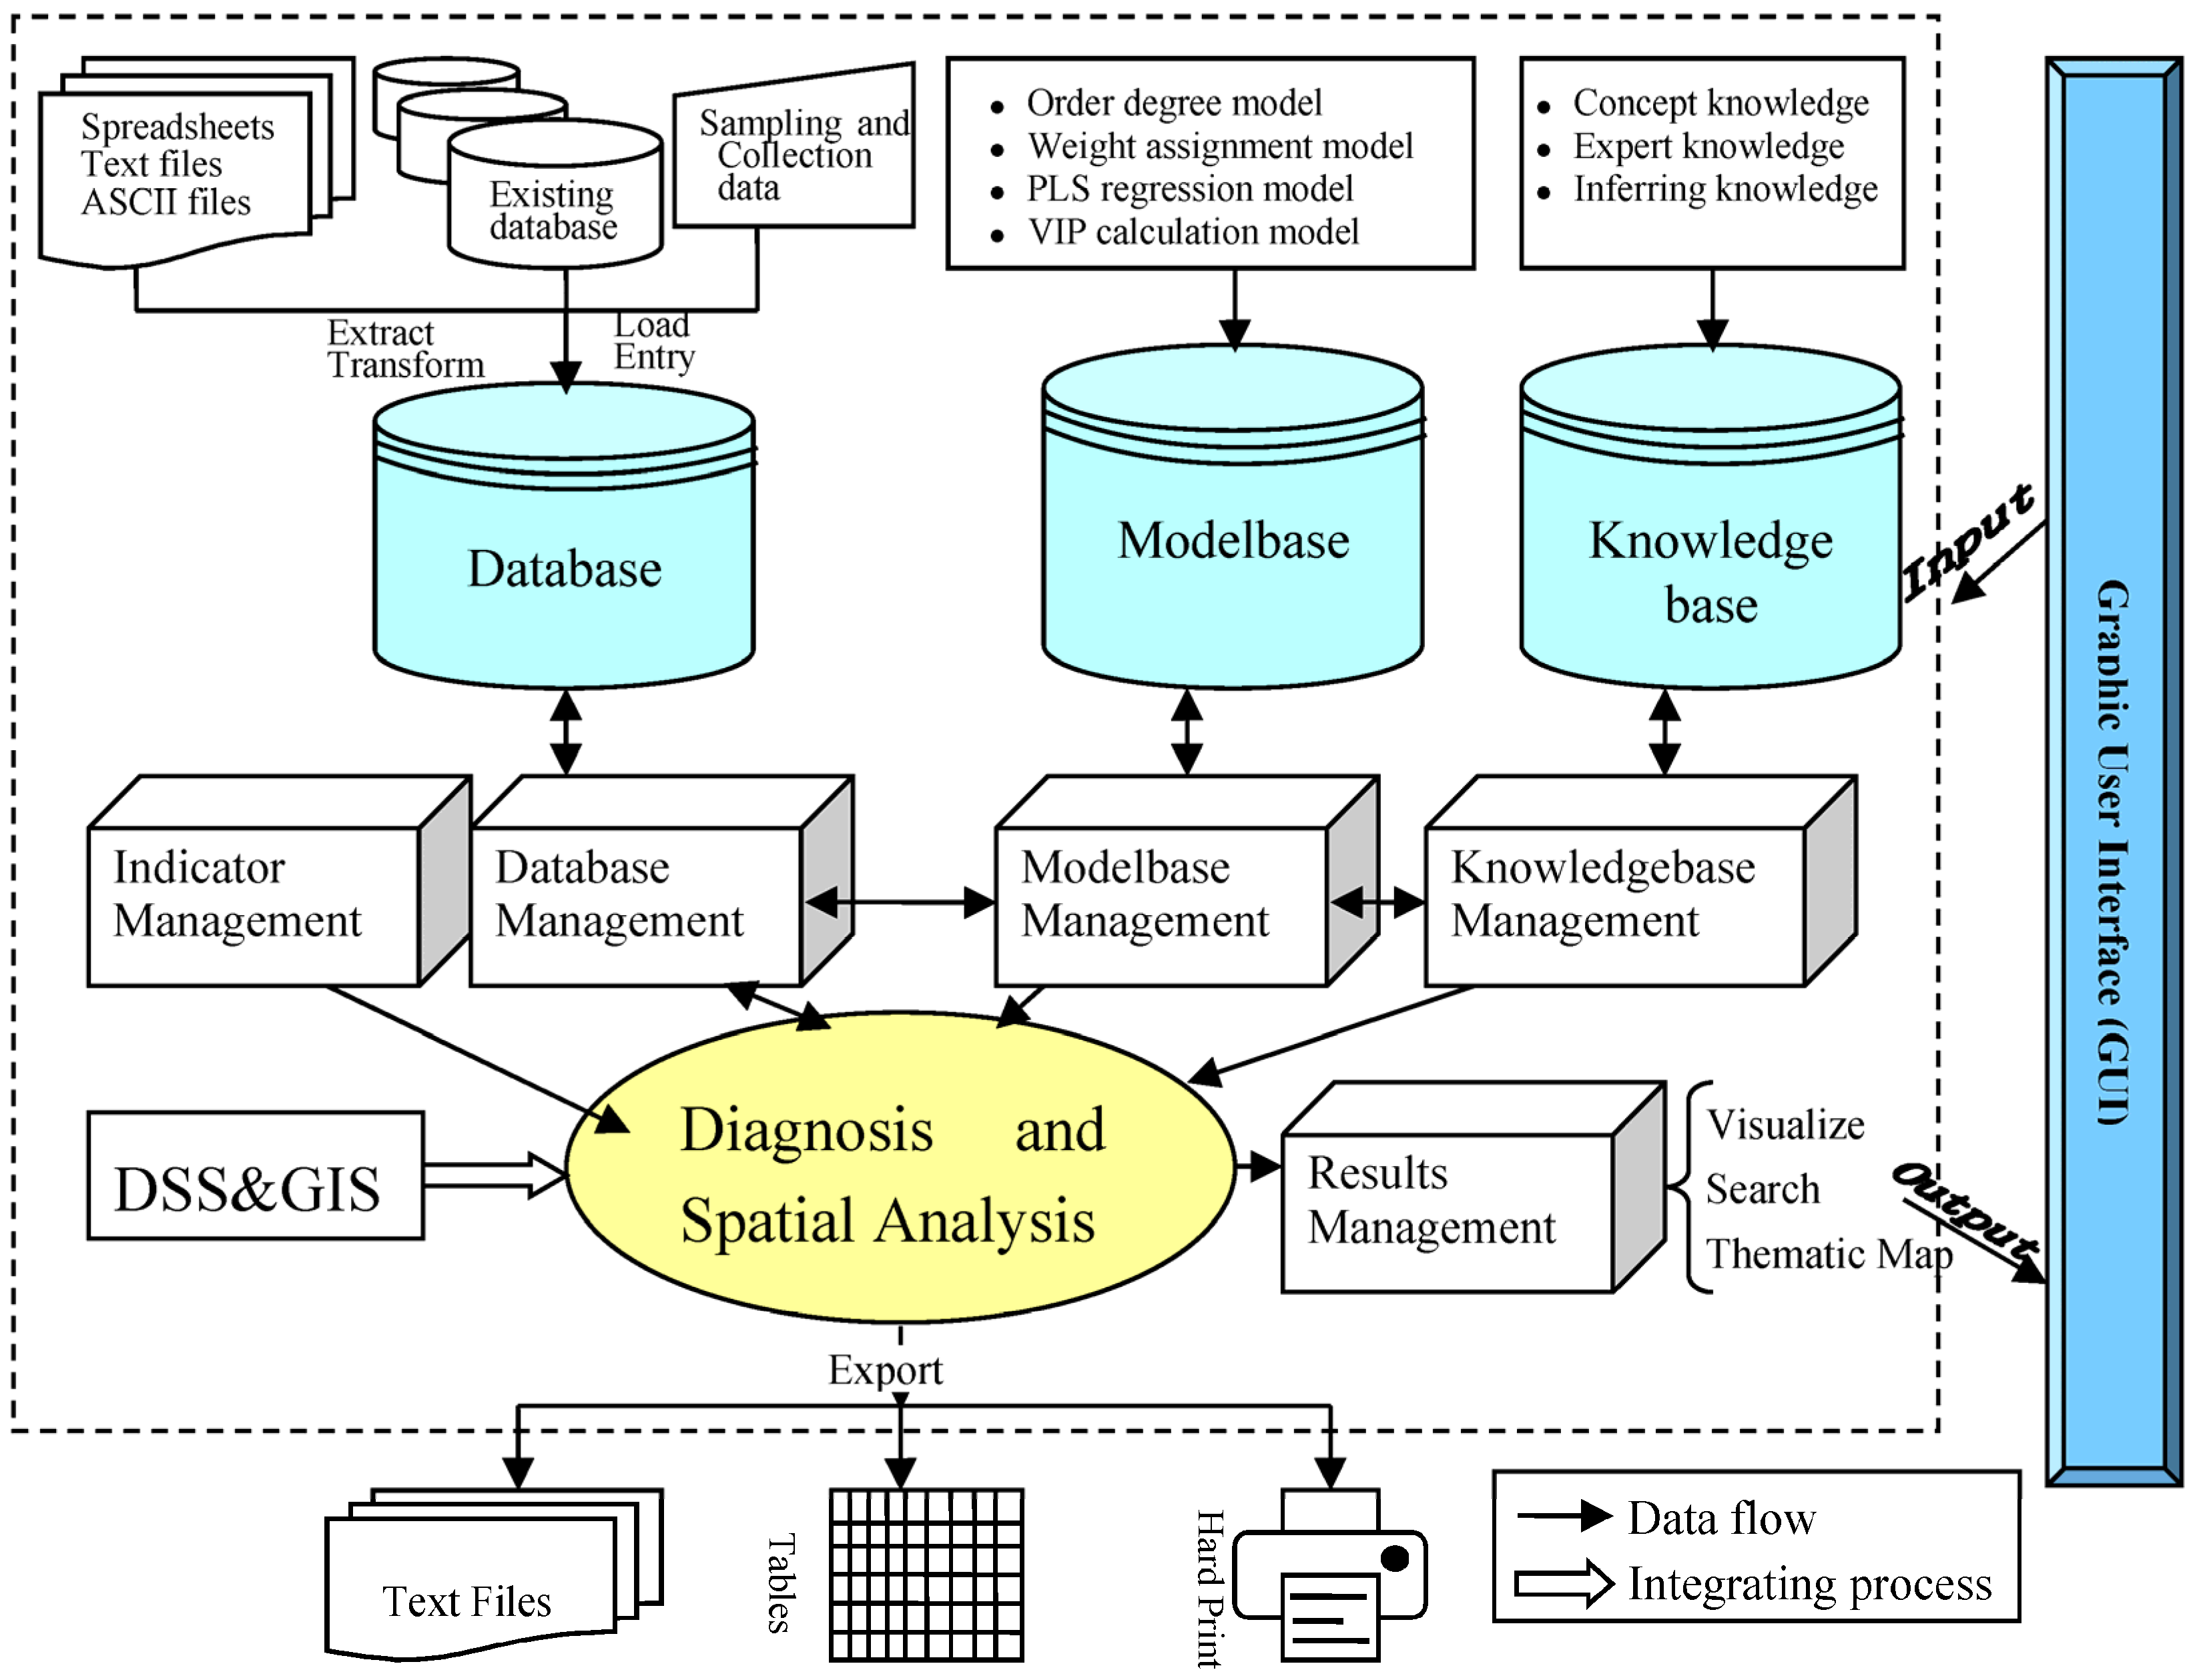
2.1. Generic Architecture

This study is part of a 3-year research project of River Health Diagnosis in Zhejiang Province, China (RHD-Zhejiang), under the framework of the act funded by the Water Resource Department of Zhejiang Province under the contract No. RB008. The primary tasks of the project are to address a set of diagnostic indicators, to evaluate suitable diagnostic models, and to develop a truly integrated GIS-based RHD-DSS. This system, integrating all diagnostic indicators, models, and maps through GIS and DSS, provides an automatic tool for river policy makers to quantitatively assess the health of river systems, diagnose the external factors, and identify the priority management challenges for the maintenance or improvement of river systems [29].
In Figure 1, we present the architecture of RHD-DSS, including the graphical user interface (GUI), database, model base, and knowledge base. Large amounts of relevant data and information are received from three channels: spreadsheets, existing database, and sampling. Generalized diagnosis and decisions are made based on the mathematical models, including order degree (OD), weight assigning (WA), partial least square regression model (PLS), etc., as well as GIS, knowledge and expert opinion, and previous research organized as a DSS. The main strength of this structure is its ability to integrate the database, model base, and knowledge base into the GIS and DSS to provide assistance in decision-making for river managers.
Figure 1. Architecture of a decision support system of river health diagnosis (RHD-DSS).
Water 06 03136 g001
  • GUI: To ensure that the technical tools of a GIS-based DSS are user-friendly, a graphical user interface (GUI) is used [28]. The GUI is the front-end tool for data preprocessing and the visualization tool for analyzing the final results. It can assist with problem formulation, data input, changing driver and parameter values to specify their inputs, and it can provide tools for the analysis and visualization of the model outputs. It is easy to provide access to different policy options and external factors and to visualize model output and indicators. The GUI can directly communicate between the database, knowledge base, model base, and user.
  • Database: The database of an RHD-DSS holds all required data for river health diagnosis. The database is composed of four sub-databases: a basic sub-database, a diagnostic indicator sub-database, a parameter sub-database, and a result sub-database. The basic sub-database involves topographic data (e.g., river setup, riparian characteristics, cross sections, floodplains), hydrologic data (e.g., precipitation, discharge), water quality data (e.g., dissolved oxygen, chemical oxygen demand, biochemical oxygen demand, total nitrogen, total phosphorus), and infrastructure data (e.g., levee, weir, dam). The diagnostic indicator sub-database contains status indicator data and cause indicator data. In the parameter sub-database, there are threshold values of each indicator, built-in weight coefficients, external weight coefficients, and comprehensive weight coefficients. What is more, the results of status assessment and cause diagnosis are stored in the result sub-database.
  • Model base: The model base is used to store all necessary models capable of assessing health status, identify causal factors as well as support the process of decision-making. In terms of the models, analytic hierarchy process (AHP), order degree (OD), partial least square (PLS), value importance project (VIP), and the if-then-else rule are involved. They can be classified into three categories: status assessment, cause diagnosis, and decision-making; accordingly, these three types of models are stored in a status assessment sub-model base and lead to diagnosis sub-model base and decision making sub-model base, respectively. The model base can be communicated with the user, database, and knowledge base through the GUI.
  • Knowledge base: The knowledge base is the base through which the human expertise and heuristic knowledge, including concept knowledge, expert knowledge, and inference knowledge, are efficiently stored and accessed. By coupling knowledge with models and tools, decision making for river management is facilitated. The knowledge base draws inferences from the data presented through the GUI, consults the model base, and assists river managers in selecting a series of suitable restoration options for a given location.

2.2. Functional Components

RHD-DSS has the functional components of user registration and initialization, database management, indicator management, knowledge management, model base management, assessment and diagnosis module, and result visualization, which are characterized as follows:
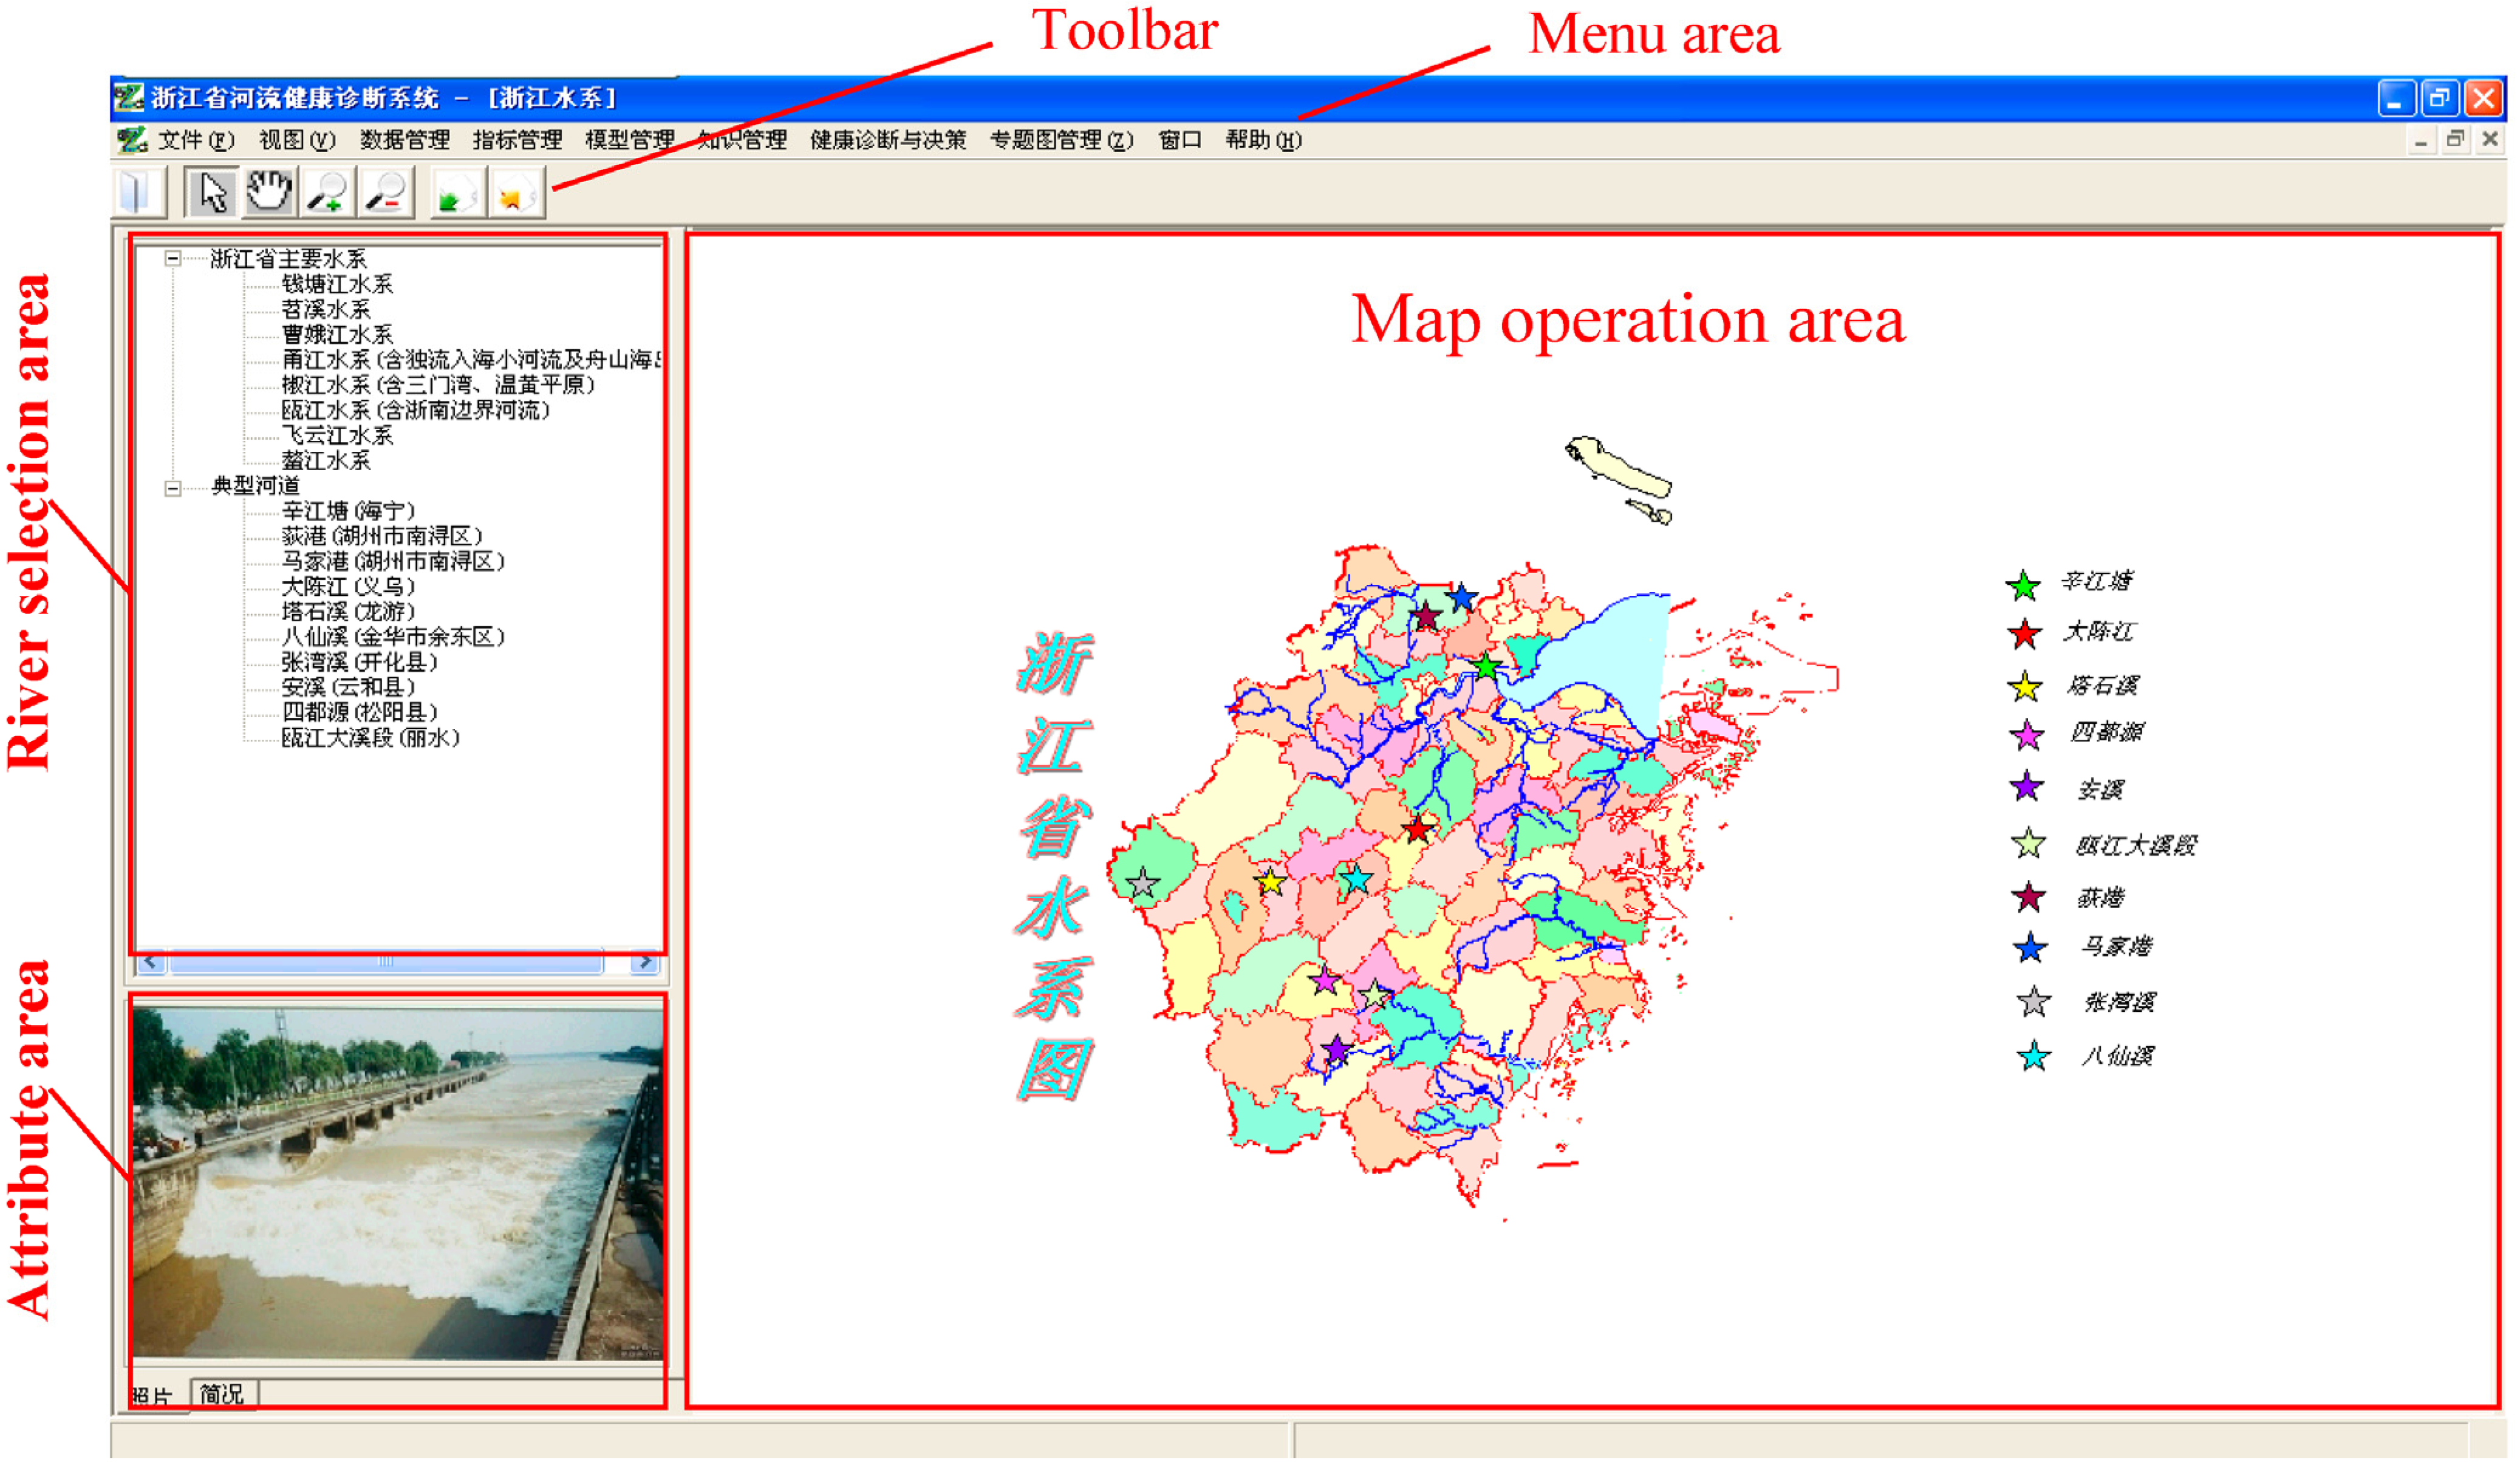
  • User registration and initialization module. The user registration and initialization module can be used to create and allocate authority to different users. By means of the initialization tool, a user is allowed to select a specific river and view its related maps and information shown in the GUI.
  • Database management module. The database management module enables the user to create a new database and append, save, delete, and browse the data using “New”, “Append”, “Save”, “Delete”, and “Browse” buttons, respectively, in the user-friendly dialog interface of Database Management. Additionally, the monitored, sampled or collected data at different spatial scales (e.g., reaches, sections, local regions, and watersheds) and temporal scales (e.g., yearly, seasonally or monthly) are entered and stored through this module.
  • Indicator management module: This module makes it possible to identify and generate diagnostic indicator sets. Meanwhile, it is also equipped to calculate the values of indicators by extracting data from the database. This module has four functions: choosing status assessment indicators, choosing cause diagnosis indicators, calculating values of indicators, and browsing criteria of indicators.
  • Model base management module: The models in the model base execute specialized operations, which include models for operational, strategic or tactic decision support. All models are run and controlled by the model base management module, which allows for browsing stored models, modifying models, and appending models.
  • Knowledge management module: The task of the knowledge management module is to provide knowledge about river health and expert experience with river restoration. Moreover, in this module, there is an extensive port to allow users to append knowledge and expert experience.
  • Assessment and diagnosis module: The aims of the assessment and diagnosis module are to assess the health status of a particular river system, analyze the main causal factors, and make reasonable decisions for river restoration and management. When the map, data, parameters, and models are pre-processed, this module allows a user to select a river, create indicator sets, assess health status, diagnose causal factors, and make restoration decisions. Additionally, this module makes it possible to communicate among database, model base, and knowledge base.
  • Result visualization module. The results of a diagnosis may be viewed in the form of a thematic map, tables, or graphs through result visualization module. In particular, the software has a built-in feature of geospatial display of data and results using thematic maps in different colors. Additionally, map elements such as legend, scale, and compass can be selectively added to thematic maps.

3. Methodology and Approaches for Design and Implementation

The development platform of RHD-DSS is a VB 6.0 programming language, while the GIS is implemented using MapX ActiveX control (a product with powerful map analysis functions offered by MapInfo Corporation (North Greenbush, NY, USA) [30].

3.1. GUI Design

During the system’s development, considerable efforts were made to develop a user-friendly GUI [31]. The GUI of RHD-DSS, developed with Visual Basic and MapX control, facilitates location-specific and river-specific data input and visualization. The main interface of RHD-DSS software is divided into five areas (Figure 2): menu, tool bar, river selection area, attribute area, and map operation area. The menu, on top of the GUI, has ten tabs such as file/user, view, database management, indicator management, model management, knowledge management, assessment and diagnosis, map management, window, and help. In the map operation area, maps of river distribution or a typical river can be shown and manipulated. In particular, on the presented map, the typical rivers are marked with colored stars. Users can view maps in the zoom in/zoom out model. Meanwhile, text information and photos of a selected river are presented in the attribute area.

3.2. Database Design

As datasets are of fundamental importance to all successive analyses and calculations, it is very important to develop a database structure to organize, store, retrieve and analyze data during DSS development [32]. All diagnosis processes of river system health strongly depend on various data that can be categorized as entity-related data (e.g., water quality, hydrology, social-economic, population) and spatial data (e.g., geographical and geotechnical characteristics, proximity to farm fields, and contaminated sites).
As the entity-related data in river health diagnosis are bound by the rule of entity-relationship (E-R), a relational database (RDB) structure can effectively access this category of data. Several software choices are available to build a RDB, such as MS Access, Oracle, or any other database management software [33]. In this study, MS Access (Microsoft Corporation, New York, NY, USA) was used because of its ease of use, availability, and previous application to river management in China. RDB structure is hierarchical, whereby a database contains several tables, which consist of several records, and each record has the information of primary key (ID) and some entity fields. The different tables or databases are connected by the ID of each entity.
Figure 2. Graphical user interface (GUI) interface.
Water 06 03136 g002
The spatial data structure is based on spatial entities and a spatial index [30]. Spatial entity is an abstract geographical model, including points, lines and curves [34]. In a river system, infrastructures are the point entities, river course and bed are the line entities, and elevation is the curve entity. All these entities can be addressed as rectangular coordinates. A spatial data structure is also a hierarchical storage structure [30]. Depending on given needs, various spatial entities in a map can be divided into several layers. Such hierarchical structures can improve the speed of displaying a map and provide flexibility in transferring, updating, and managing various data.

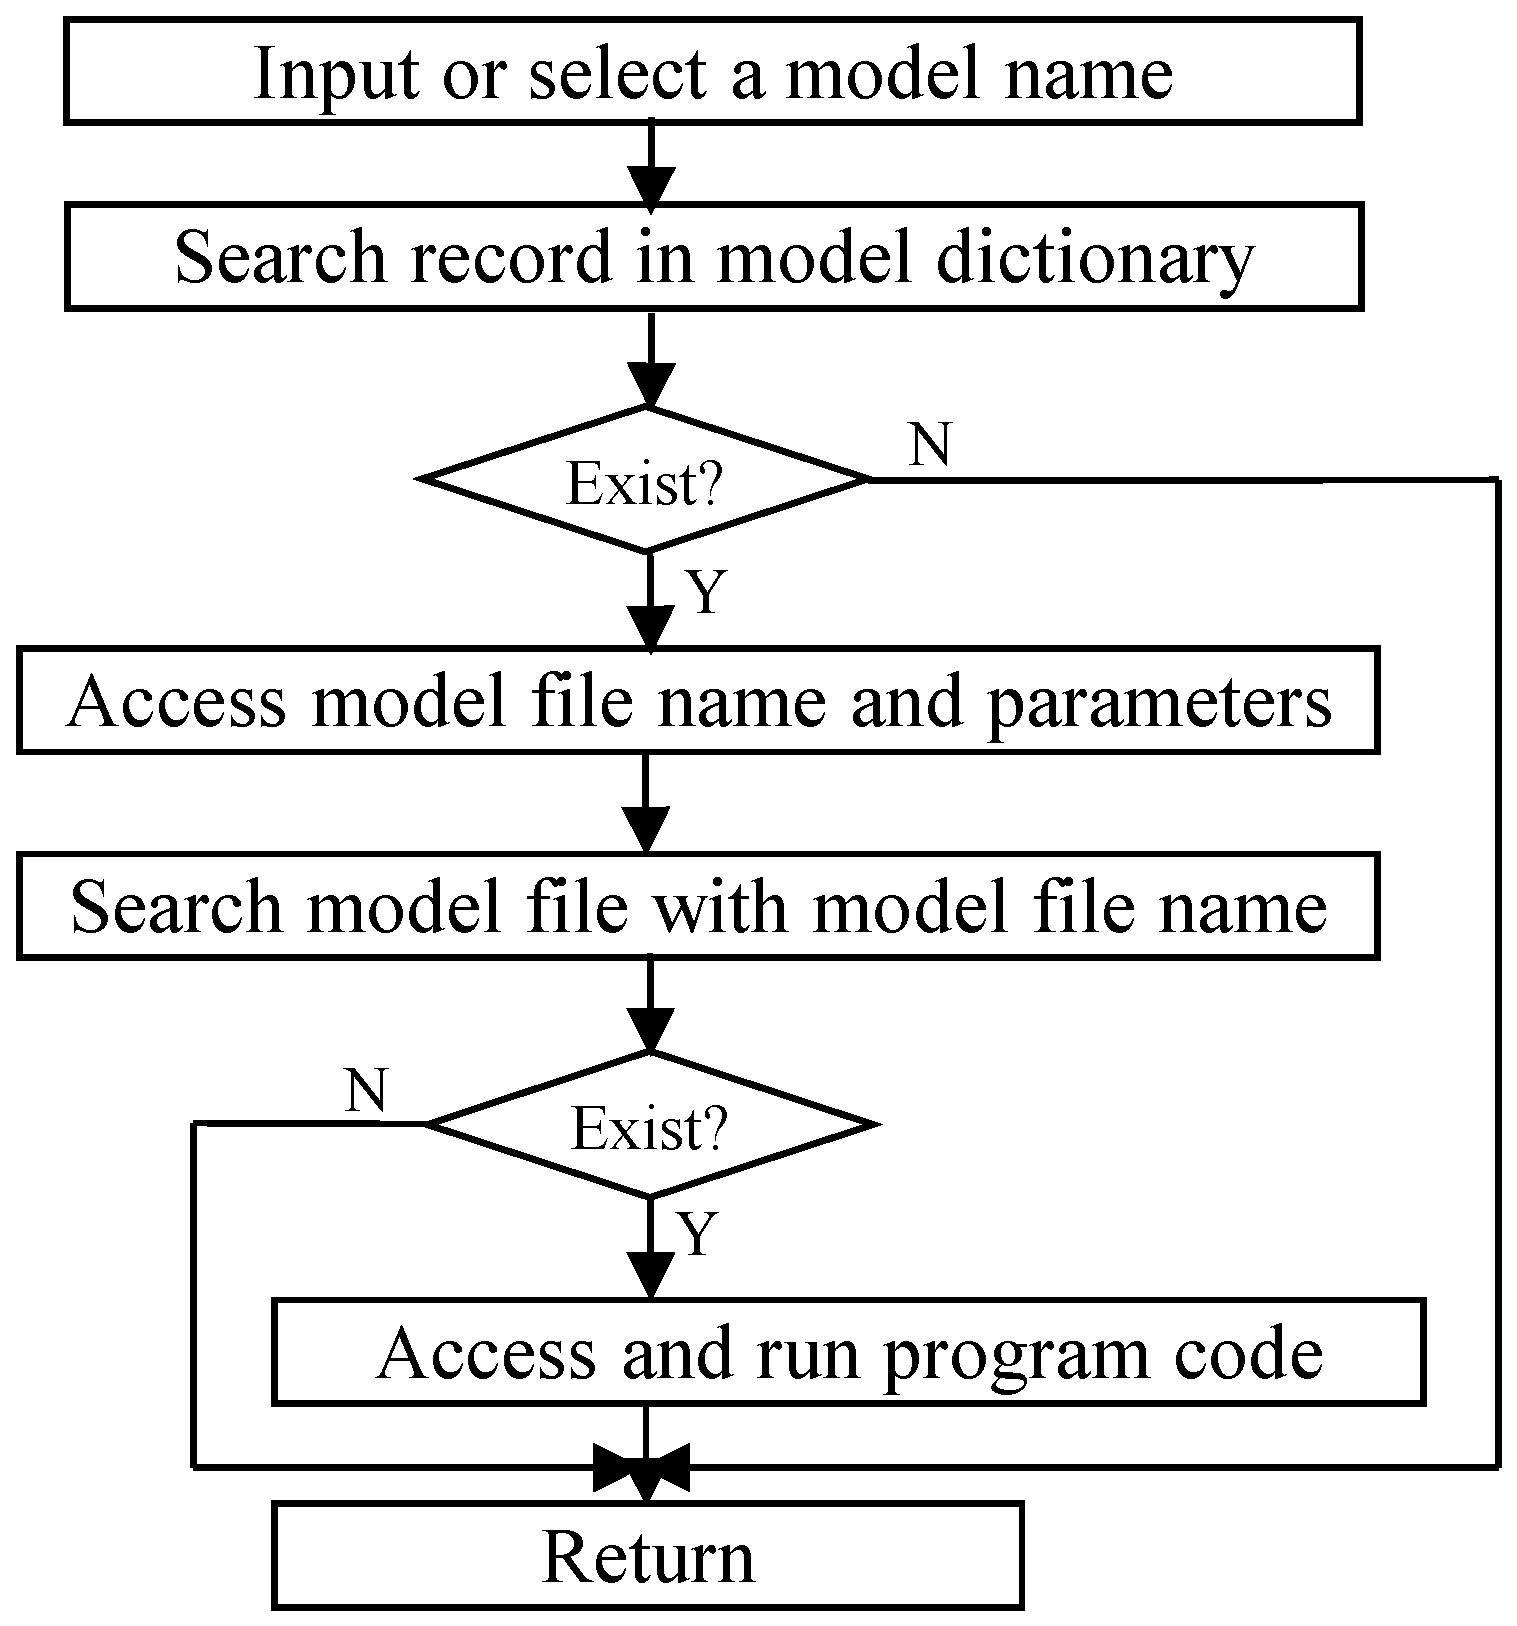
3.3. Model Base Design and Read

Diagnostic models (e.g., AHP, OD, PLS) are characterized as calculative models consisting of equations, or algorithms, and auxiliary information. The calculative models are stored in file format, called a model file. Figure 3 illustrates the structure of a model file, including File head, File body, and File end. File head contains the file name, model ID, and file size. File body is the program code, and File end is the end mark of a model file.
Figure 3. Structure of a model file.
Water 06 03136 g003
To efficiently employ models, the auxiliary information, such as parameters and conditions, should be added to describe relevant equations. As the descriptive auxiliary information can help to relate and designate equations and algorithms, the information can be regarded as model dictionaries of calculative models. The structure of a model dictionary is based on a relational table, which consists of the fields of Model ID, Model Name, Model Type, Condition and Parameter 1, Parameter 2, as shown in Table 1. A model dictionary and a model file are correlated by the Model ID or Model file name.
Table 1. Structure of a model dictionary.
Field NameData TypeField NameData Type
Model IDIntegerModel NameString
Model TypeIntegerModel File NameString
ConditionStringParameter1Real
Parameter2RealParameter3Real
Figure 4. Flow chart of reading model base.
Water 06 03136 g004
Figure 4 illustrates how to read a model base and access a model. When a user inputs or selects a model name or model ID, the record is searched using the model name or model ID as key word in the model dictionary. If the record exists, the model file name and parameters of the model are accessed. Then the model file is searched with the model file name. If the model file exists, the program code of the model can be called and executed. During this process, if the relevant record or model file does not exist, this procedure can be terminated and reversed. For instance, to obtain the health index (HI) of a typical river, AHP and OD will be applied. After a user inputs or selects “AHP” and “OD”, the relevant records are searched in the model dictionary. If the records exist, the model file names (AHP_Model.mf, OD_Model.mf), parameters (relative importance scores between every two assessment indicators, minimum and maximum of assessment indicators) are accessed from the respective records. Then, the model files are searched using the model file name as indexing key word. If the model files exist, model files are opened and program codes are accessed and executed. As the result of running the program codes, the weight and order degree of each assessment indicator can be computed. Combining the weight and order degree, HI can be obtained.

3.4. Assessment and Diagnosis Procedure Design

The procedures of assessment and diagnosis are composed of three parts (Figure 5): Health Status Assessment (Part I), Impacting Cause Diagnosis (Part II), and Decision Making (Part III). In Part I, health indices (HIs) are valued by the OD so that quantitative health grades, some symptoms and problems can be assessed. Then, Part II can be performed using PLS to identify the main factors affecting the river systems. According to the identified health grade and main impacting factors, Part III uses current knowledge to make decisions for river restoration. Finally, the results are shown in thematic maps, which help the user to view the status, problems, main causal factors, and restoration measures. The procedures are carried out in the following steps: (1) Input initial information; (2) Set status assessment indicators; (3) Assign weights; (4) Run status assessment models; (5) Set causal diagnosis indicators; (6) Run causal diagnosis models; (7) Make restoration decision. Table 2 illustrates the features of each step.
Table 2. Steps of assessment and diagnosis and their features.
StepsFeatures
Step1: Input initial informationInitial investigated data, digital map, river type (e.g., mountain river, hilly river, and floodplain) and key service function (e.g., irrigation, drinking, hydropower, recreation, navigation, waterway) may be inputted and selected.
Step2: Set status assessment indicatorsAll or some of 13 built-in status assessment indicators (Table 4) may be set.
Step3: Assign weightsOne of three optional weight assigning methods, namely, Built-in method, User-defined method, and Compound method, is exerted.
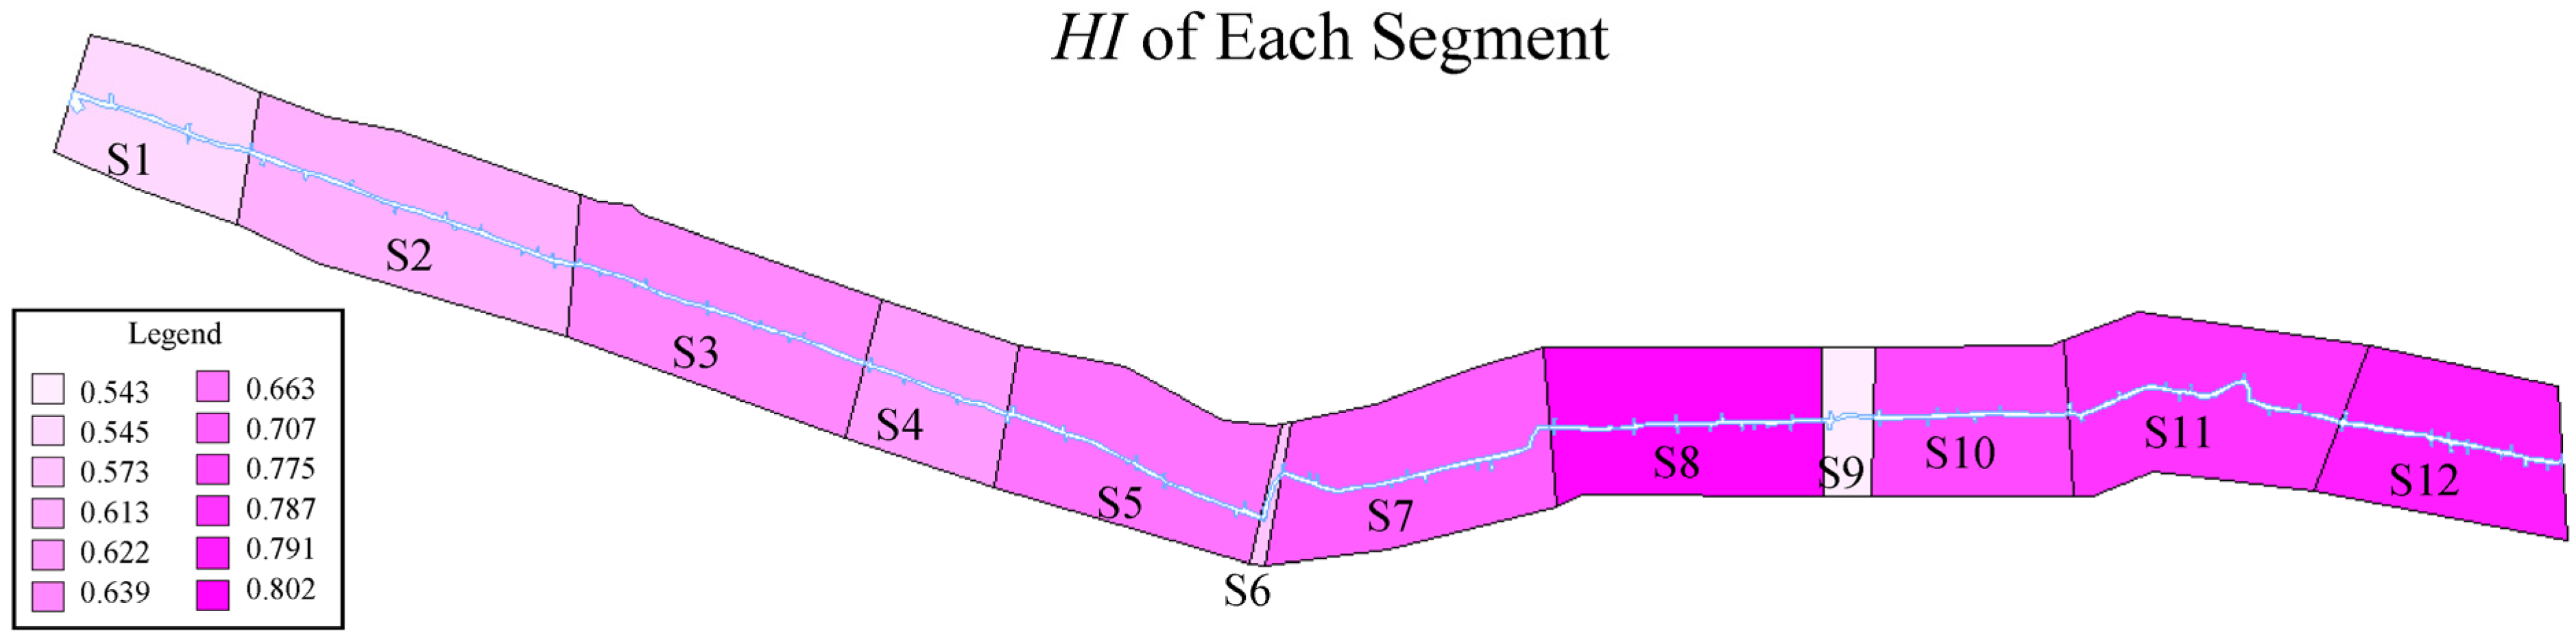
Step4: Run status assessment modelsOrder degree (OD) model is called from the model base and compounded with data and weights. Then health index (HI) may be obtained so that health grade can be determined by comparing HI with interval of health criteria.
Step5: Set causal diagnosis indicatorsAny of 21 built-in impacting indicators may be checked on the tab dialogs of rainfall, pollution, water resource development, human occupation, hydraulic infrastructure, urbanization, and management activity.
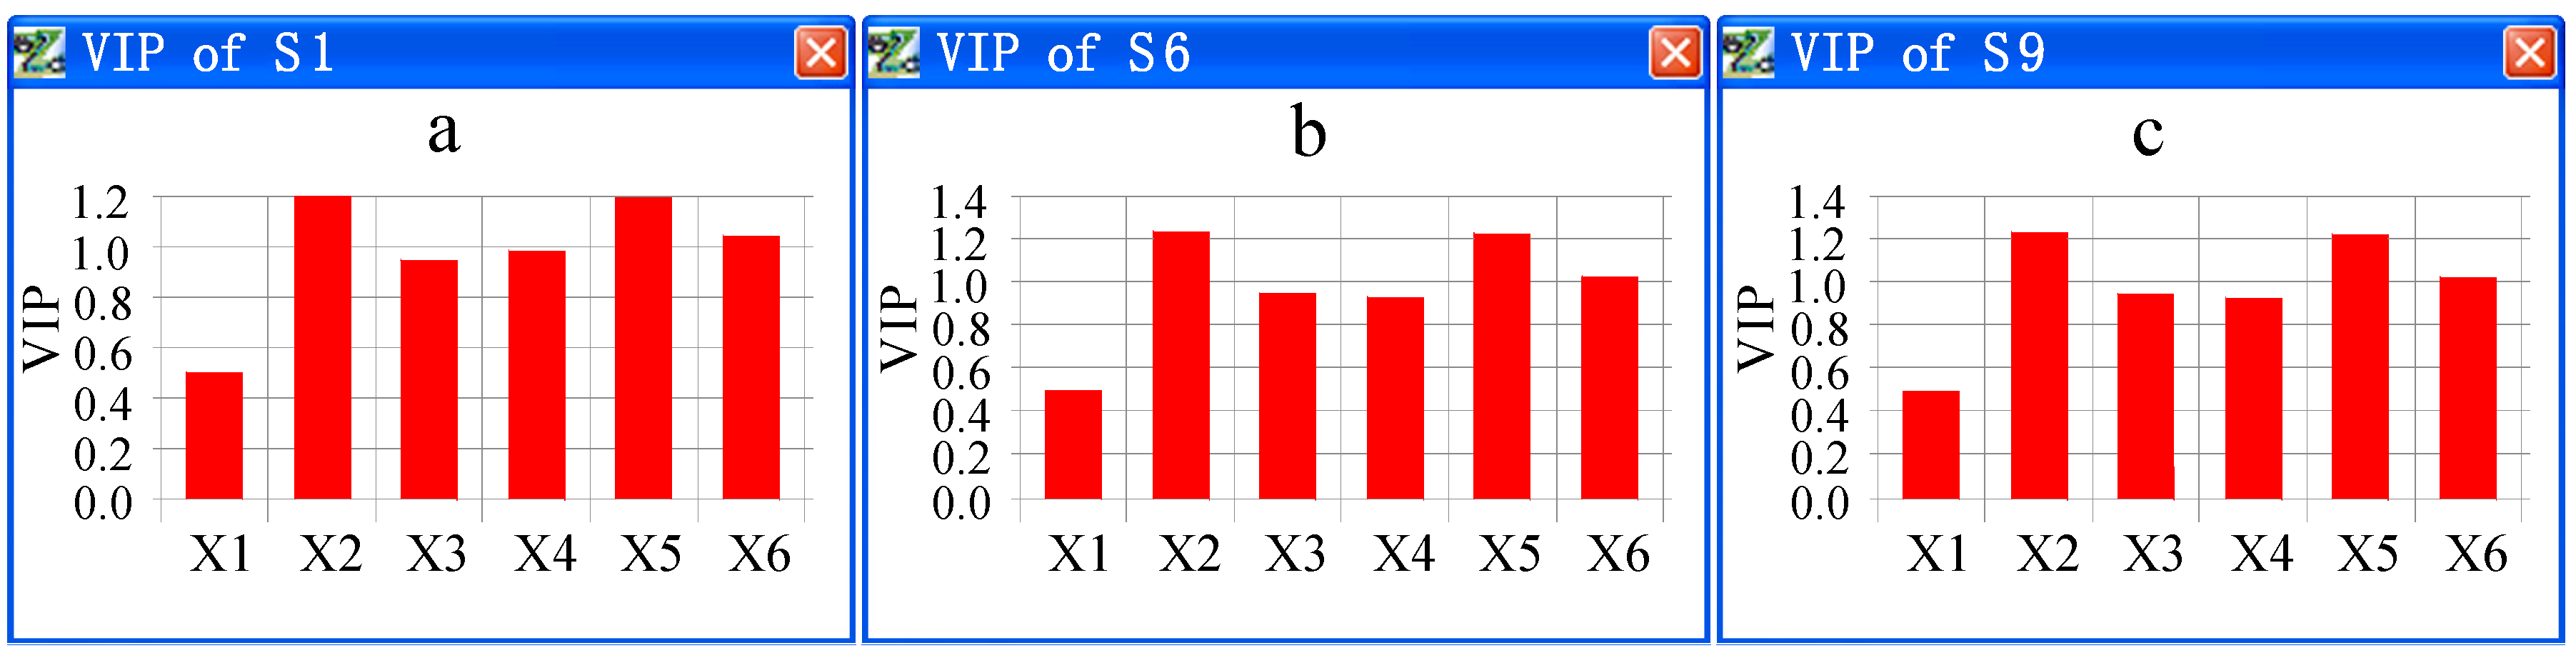
Step6: Run causal diagnosis modelsA partial least square regression (PLS) model is called from the model base, and along with appropriate data, a regression equation between HI and impacting factors can be derived. Then a value importance project (VIP) of each impacting factor can be obtained and the main causal factors identified.
Step7: Make restoration decisionAccording to the main causal factors and relevant expert knowledge, a restoration suggestion may be made.
Figure 5. Procedures of assessment and diagnosis.
Water 06 03136 g005

3.5. Map Management Design

River health maps serve as an easily readable tool to identify hot spots and to show where immediate action is required. These maps are also used as a visual aid for communication with river managers and politicians and are used to support dissemination activities. MapX organized a map according to its layers, such that the entire map, or just desired parts, can be displayed through stacks of different geographical elements. A complete electronic map is generally composed of one or more collections of layers. The attribute information of each layer, such as the order, coordinates, state, and so on, has one corresponding geographical set (Geoset) object, which is responsible for information management and storage. Electronic maps in the system can be pre-processed and saved through Geosets.

4. Application of RHD-DSS

4.1. Study River

The study river is the Xinjiangtang River, which is located in Haining County Zhejiang Province, China. The county lies between 30°15' and 30°35' N latitude and 120°18' and 120°52' E longitude, containing the south edge of the famous Hang-Jiang-Hu Floodplain and the north bank of the Qiantang River. The area has a mean temperature of 15.9 °C and a mean annual rainfall of approximately 1178 mm. It is a typical watershed composed of approximately 1351 rivers with a total length of 1820.38 km. Approximately 47% of the county is agricultural land. Additionally, the leather industry is the main industry. The Xinjiangtang River is one of the main rivers of this county, with a length of approximate 22.5 km and a mean width of 42.5 m. The river flows through four main towns: Yangguan, Dingqiao, Maqiao, and Yuanhua, from west to east, and is connected to the Yanguanxiahe River in the west, the Yuanxiagang River in the east and the Mianchanggang River, the Pingyangyan River, the Tangjiayan River, and the Muchangqiao River in the middle.

4.2. Data

The attribute data including hydrology, hydrodynamics, water resource usage, ecology, rainfall, climate, crop, population, irrigation system, and soil properties information are surveyed and provided in a Microsoft Access database. Specifically, water quality data are sampled and tested by the Environment Monitor Station of Haining County. The spatial data are obtained from the Geographic Survey Department of Haining County and the Haining Hydraulic Design Ltc (Haining, China). The geographic information is provided in a digital map at a resolution of 2 km. However, because the source spatial data are an AutoCAD geographic file (.dwg), as opposed to a Mapinfo geographic set file (.get), they are pre-processed and transferred into a .get file format via Geoset Manager. The spatial datasets including river structure, riparian zone, hydraulic infrastructures, land use, main buildings, topographic features, and elevation are layered and stored in the .get format. The attribute database is linked with the spatial database via location ID. The 13 variables, namely, Variation ratio (C11), Continuity of river (C12), Comprehensive stability (C13), Wetland conservation ratio (C14), Riparian buffering ratio (C15), Biodiversity ratio (C21), Vegetation covering ratio (C22), Ecological discharge insured ratio (C23), Flood safety ratio (C31), Landscape suitability ratio (C32), Ratio of water quality satisfying with standard (C33), Water supply insured ratio (C34), and Navigation insured ratio (C35) are selected as status assessment indicators. Meanwhile, Rainfall (X1), Industrial pollution discharge (X2), Agricultural pollution discharge (X3), Domestic pollution discharge (X4), Gross domestic product (GDP) (X5), and Ratio of management investment to total investment (X6) are used as causal diagnosis indicators. Extracting data from the database, the values of status assessment indicators and causal diagnosis indicators are generated as shown in Table 3 and Table 4, respectively.
Table 3. Values of status assessment indicators.
Reach No.C11C12C13C14C15C21C22C23C31C32C33C34C35
S10.1830.9871.001.000.4530.5790.1831.000.9840.770.1041.000.976
S20.1830.9630.940.950.5750.6230.6901.000.9450.790.1101.000.974
S30.1830.9560.960.960.6480.6470.6821.000.9810.680.1191.000.965
S40.1830.6630.951.000.5750.9110.7421.000.9230.660.1211.000.982
S50.1830.6400.941.000.8430.9730.6031.000.8630.550.0961.000.985
S60.1840.7600.970.970.5000.8400.6301.000.8430.600.0951.000.980
S70.1830.7780.941.000.9210.9600.5911.000.8790.550.1031.000.984
S80.1830.8230.920.970.9950.9370.9791.000.8230.520.1101.000.990
S90.1830.8340.951.000.5270.6930.4991.000.8780.500.1131.000.983
S100.1840.8500.911.000.9610.7760.9891.000.8520.480.1201.000.987
S110.1830.8120.900.961.0000.8281.001.000.8900.470.1191.000.990
S120.1830.8130.910.981.0000.8481.001.000.8500.470.1181.000.989
Table 4. Values of causal diagnosis indicators from 1996 to 2007.
YearX1 (mm)X2 (m3)X3 (m3)X4 (m3)X5 (108 Yuan)X6 (%)
20071,116.19,234.3815,688.892,315.51294.711.96
20061,003.38,029.9113,642.542,308.73256.270.73
2005890.36,667.4113,152.332,300.86217.962.88
2004808.75,688.9212,486.392,297.65188.072.09
2003761.74,704.1710,941.782,291.57157.152.17
20021,503.63,895.7710,229.592,288.00132.062.02
20011,178.63,424.7310,442.322,288.71117.032.09
20001,032.03,072.5810,340.582,288.00104.602.02
19991,478.12,805.209,360.172,283.3589.931.85
19981,473.92,664.129,841.122,285.1485.391.27
19971,587.72,543.51210,738.292,283.7180.600.24
19961,175.12,457.61210,414.572,275.4977.530.29

4.3. Results and Discussion

To better understand the health status of the Xinjiangtang River and to identify the main causal factors of river health decline, a RHD-DSS is applied based on the available digital map, which is imported, and all required data. The calculated HIs of the focal river are shown in Figure 6. We classify health degree into three grades: Healthy grade, Subhealthy grade, and Disease grade [29]. When the HI is less 0.50, the river system belongs to the Disease grade. When the HI is between 0.5 and 0.65, the river system belongs to the Subhealthy grade. When the HI is greater than 0.65, the river system lies in the Healthy grade. The HIs of most segments, except S1, S6, and S9, are greater than 0.65, implying that most are healthy. However, S1, S6, and S9 lie in a Subhealthy grade. In particular, the smallest HI is 0.543 in S9. The HI of each segment is displayed according to color, with darker color corresponding to greater HI. S8 and S12 are the darkest segments, which implies that these two segments are the healthiest. S1, S6, and S9 are the lightest, and these segments are the least healthy.
Figure 6. Thematic map of HI of each segment.
Water 06 03136 g006
The main causal factors are displayed in Figure 6, which shows the VIP of each cause indicator in each segment. The main impacting indicators are identified and shown in a histogram. For example, Figure 7 shows the magnitude of each indicator in the unhealthy grades S1, S2, and S3, respectively. In these three segments, the industrial pollution discharge has the greatest VIP, implying that industrial pollution discharge is the most important impacting factor. The second most important factor is GDP, followed by domestic pollution discharge. In fact, while leather factories make substantial contributions to GDP, most of these leather factories do not have enough sewage disposal systems, resulting in a large amount of polluted water discharged directly, or indirectly, into the river. Therefore, the industrial pollution discharge and GDP are the most important factors contributing to unhealthy grades. In addition, the rapidly increasing population also plays a key role in unhealthy grades. With an increasing population, the amount of domestic pollution has risen rapidly. According to the results of the diagnosis, it is necessary to adopt feasible measures to reduce the pollution, particularly, industrial, domestic, and agricultural pollution. For example, the three low-level factories should be closed and two other factories should be improved with better sewage treatment devices. Additionally, it is necessary to reduce the chemical fertilizer and pesticide usage.
Figure 7. Thematic map of cause diagnosis. (a) The VIP of each cause indicator in S1; (b) the VIP of each cause indicator in S6; (c) the VIP of each cause indicator in S9.
Water 06 03136 g007

5. Conclusions

This study is an important part of the 3-year River Health Diagnosis project of Zhejiang Province. Regarding river system health analysis, a computer automated RHD-DSS tool for status assessment, impacting factor diagnosis, and restoration measure decision-making is developed, integrating analysis models using DSS and GIS technology. The system’s most important feature is its ability to quickly and easily provide river restoration decision-making tools for different river types and scales. In detail, it has the following key features:
  • The integrated system facilitates effective usage of spatially explicit data to evaluate health status, and analyze the most important causal factors, and help make restoration decisions at reach and regional segment scales.
  • This decision support system contributes to river information technology by providing a novel, efficient, and cost-effective approach for comprehensively mapping river health; information that is not readily apparent due to the complex interaction of river characteristics and their relative contribution to its health.
  • RHD-DSS also provides histograms that facilitate the study of the primary causes of river health decline.
  • A simple user-friendly interface provides easy access to the components of the system by maintaining complex data and control transfer operations in the background.
In conclusion, RHD-DSS, with its ability to consider the spatial variability of river systems at the reach and regional segment scales, is a practical tool that is applicable to a wide range of river restoration, management, and development problems for river designers, managers, and policy makers.
From the case study, we can conclude that the pollutants have the greatest effect on the health degree of individual stream segment. In practice, health degree significantly depends on the location of pollution sources. However, we did not consider where the pollutant sources were located and how much the variation distance of pollutant from the segment affected the degree of health. Additionally, the complex issues surrounding many problems relevant to river health demand a broad understanding of the physical processes and the factors to be included in the model. Therefore, use of the RHD-DSS is currently limited to specialists, and further development is required to make it available to a wider range of users.

Acknowledgments

This study was funded by National Natural Science Foundation of China (NSFC) (Grant No.41471069), and by the River Management Development of Zhejiang Province, China (Grant No. RB008), and by the Water Resources Department of Jiangsu Province, China. We thank Yuling Han, Wenhui Yang, Qianchao Pu, Ling Hu, and Wei for their helpful assistance. Suggestions and comments by Zhongmin Yan on a draft of this paper are greatly appreciated.

Author Contributions

The manuscript was written by Jihong Xia, Lihuai Lin, Junqiang Lin, and Laounia Nehal but all authors contributed to its preparation and review. The manuscript and software were mainly developed by Jihong Xia and Junqiang Lin. Data collection and analyses, and figures were conducted by Junqiang Lin and Lihuai Lin. Laounia Nehal revised and edited the language.

Conflicts of Interest

The authors declare no conflict of interest.

References

  1. Zhao, Y.W.; Yang, Z.F. Integrative fuzzy hierarchical model for river health assessment: A case study of Yong River in Ningbo City, China. Commun. Nonlinear Sci. Numer. Simul. 2009, 14, 1729–1736. [Google Scholar] [CrossRef]
  2. Kamp, U.; Binder, W.; Hölzl, K. River habitat monitoring and assessment in Germany. Environ. Monit. Assess. 2007, 127, 209–226. [Google Scholar] [CrossRef]
  3. Pinto, U.; Maheshwari, B.L. River health assessment in peri-urban landscapes: An application of multivariate analysis to identify the key variables. Water Res. 2011, 45, 3915–3924. [Google Scholar] [CrossRef] [PubMed]
  4. Stubauer, I.; Hering, D.; Korte, T.; Hoffmann, A.; Brabec, K.; Sharma, S.; Shrestha, M.; Kahlown, M.A.; Tahir, M.A.; Kumar, A.; et al. The development of an assessment system to evaluate the ecological status of rivers in the Hindu Kush-Himalayan region: Introduction to the special feature. Hydrobiologia 2010, 651, 1–15. [Google Scholar] [CrossRef]
  5. Wright, J.F. An introduction to RIVPACS. In Assessing the Biological Quality of Fresh Waters; Wright, J.F., Sutcliffe, D.W., Furse, M.T., Eds.; Freshwater Biological Association: Ambleside, UK, 2000; pp. 1–24. [Google Scholar]
  6. Australian River Assessment System: AusRivAS Protocols Development and Testing Report (Final Report). Available online: http://www.environment.gov.au/system/files/resources/c0027484-787c-4acd-af9c-e53b82832c64/files/testing.pdf (accessed on 15 April 2012).
  7. Halse, S.A.; Scanlon, M.D.; Cocking, J.S.; Smith, M.J.; Kay, W.R. Factors affecting river health and its assessment over broad geographic ranges: The Western Australian experience. Environ. Monit. Assess. 2007, 134, 161–175. [Google Scholar] [CrossRef] [PubMed]
  8. Norris, R.H.; Thoms, M.C. What is river health? Freshwater Biol. 1999, 41, 197–209. [Google Scholar] [CrossRef]
  9. Zeilhofer, P.; Lima, G.A.; Lima, E.B.R.; Santos, I.M. Development of a GIS-based information system for watershed monitoring in Mato Grosso, Central Brazil. Rev. Pesqui. Geocienc. 2008, 35, 23–37. [Google Scholar]
  10. Bharti, N.; Katyal, D. Water quality indices used for surface water vulnerability assessment. Int. J. Environ. Sci. 2011, 2, 154–173. [Google Scholar]
  11. Sharma, A.; Naidu, M.; Sargaonkar, A. Development of computer automated decision support system for surface water quality assessment. Comput. Geosci. 2013, 51, 129–134. [Google Scholar] [CrossRef]
  12. Hughey, K.F.D. Development and application of the river values assessment system for ranking New Zealand River values. Water Resour. Manag. 2013, 27, 2013–2027. [Google Scholar] [CrossRef]
  13. Satti, S.R.; Jacobs, J.M. A GIS-based model to estimate the regionally distributed drought water demand. Agric. Water Manag. 2004, 66, 1–13. [Google Scholar] [CrossRef]
  14. Gorry, G.A.; Morton, M.S.S. A framework for management information systems. Sloan Manag. Rev. 1971, 13, 55–70. [Google Scholar]
  15. Mysiak, J.; Giupponi, C.; Rosato, P. Towards the development of a decision support system for water resource management. Environ. Model. Softw. 2005, 20, 203–214. [Google Scholar] [CrossRef]
  16. Lautenbach, S.; Berlekamp, J.; Seppelt, R.; Matthies, M. Application of the Elbe-DSS: Scenario analysis and management options. Environ. Model. Softw. 2009, 24, 26–43. [Google Scholar] [CrossRef]
  17. Fassio, A.; Giupponi, C.; Hiederer, R.; Simota, C. A decision support tool for simulating the effects of alternative policies affecting water resources: an application at the European scale. J. Hydrol. 2005, 304, 462–476. [Google Scholar] [CrossRef]
  18. Samuels, W.B.; Amstutz, D.E.; Bahadur, R.; Pickus, J.M. RiverSpill: A national application for drinking water protection. J. Hydraul. Eng. 2006, 132, 393–403. [Google Scholar] [CrossRef]
  19. Guo, L. Study on Decision Support System for Water Pollution of Songhua River Based on GIS. Master’s Thesis, Harbin Institute of Technology, Harbin, China, 2006. [Google Scholar]
  20. Jamieson, D.G.; Fedra, K. The “Water Ware” decision support system for river-basin planning. 1. Conceptual design. J. Hydrol. 1996, 177, 163–175. [Google Scholar] [CrossRef]
  21. Andreu, J.; Capilla, J.; Sanchis, E. AQUATOOL—A generalized DSS for water-resources planning and operational management. J. Hydrol. 1996, 177, 269–291. [Google Scholar] [CrossRef]
  22. Todini, E. FLOODSS: A Flood Operational Decision Support System. In Natural Disasters and Sustainable Development Environmental Science; Casale, R., Margottini, C., Eds.; Springer: Berlin, Germany, 2004; pp. 53–64. [Google Scholar]
  23. Da Silva, L.M.; Park, J.R.; Keatinge, J.D.H.; Pinto, P.A. The use of the DSSIPM in the Alentejo region of the southern Portugal. Agric. Water Manag. 2001, 51, 203–215. [Google Scholar] [CrossRef]
  24. Ahmad, S.; Simonovic, S. An intelligent decision support system for management of floods. Water Resour. Manag. 2006, 20, 391–410. [Google Scholar] [CrossRef]
  25. Park, J.; Ki, D.; Kim, K.; Lee, S.J.; Kim, D.H.; Oh, K.J. Using decision tree to develop a soil ecological quality assessment system for planning sustainable construction. Expert Syst. Appl. 2011, 38, 5463–5470. [Google Scholar] [CrossRef]
  26. Rotmans, J.; DeBoois, H.; Swart, R.J. An integrated model for the assessment of the greenhouse effect: The Dutch approach. Clim. Chang. 1990, 16, 331–356. [Google Scholar] [CrossRef]
  27. Low, B.; Costanza, R.; Ostrom, E.; Wilson, J.; Simon, C.P. Human-ecosystem interactions: A dynamic integrated model. Ecol. Econ. 1999, 31, 227–242. [Google Scholar] [CrossRef]
  28. Van Delden, H.; Seppelt, R.; White, R.; Jakeman, A.J. A methodology for the design and development of integrated models for policy support. Environ. Model. Softw. 2011, 26, 266–279. [Google Scholar] [CrossRef]
  29. Xia, J.; Lin, J.; Ju, L. Status assessment and causal factors diagnosis of river system health. Afr. J. Agric. Res. 2013, 8, 1817–1827. [Google Scholar]
  30. Su, A.; Liu, X.; Wu, X. Research of GIS Platform Based on MapX. J. Northeast Agric. Univ. 2008, 15, 88–91. [Google Scholar]
  31. Ge, Y.; Li, X.; Huang, C.; Nan, Z. A Decision Support System for irrigation water allocation along the middle reaches of the Heihe River Basin, Northwest China. Environ. Model. Softw. 2013, 47, 182–192. [Google Scholar] [CrossRef]
  32. Staudenrauch, H.; Flügel, W.A. Development of an Integrated Water Resources Management System in Southern African Catchments. Phys. Chem. Earth Part B Hydrol. Oceans Atmos. 2001, 26, 561–564. [Google Scholar] [CrossRef]
  33. Ahmad, I.; Azhar, S.; Lukauskis, P. Development of a decision support system using data warehousing to assist builders/developers in site selection. Autom. Constr. 2004, 13, 525–542. [Google Scholar] [CrossRef]
  34. Booth, N.L.; Everman, E.J.; Kuo, I.L.; Sprague, L.; Murphy, L. A WEB-based decision support system for assessing regional water-quality conditions and management actions. J. Am. Water Resour. Assoc. 2011, 47, 1136–1150. [Google Scholar] [CrossRef] [PubMed]

