Constructed Wetlands for Treatment of Combined Sewer Overflow in the US: A Review of Design Challenges and Application Status

Abstract
:1. Introduction

| Parameter | Combined Wastewater | Municipal Wastewater [2,7] | Urban Stormwater Runoff [2,7] | |
|---|---|---|---|---|
| Typical [2] | Monitoring at Harbor Brook, Syracuse, NY [11] | |||
| BOD5 (mg/L) | 60–220 | 30–41 | 110–400 | 7–56 |
| TSS (mg/L) | 270–550 | 73–167 | 100–400 | 20–2890 |
| Ammonia-N (mg/L) | Unavailable | 0.47–0.94 | 12–50 | 0.58 |
| TKN (mg/L) | 4–17 | 4.0–7.8 | 20–85 | 0.4–4.2 |
| Nitrate (mg/L) | 0.48–0.91 | 0.22 | 0 | 0.05–1.0 |
| TP (mg/L) | 1.2–2.8 | 0.8–2.2 | 4–20 | 0.02–4.3 |
| Fecal coliforms (#/100 mL) | 105–106 | 4.0 × 10⁵ | 105–108 | 103–104 |
2. Status of Constructed Wetlands for CSO Treatment in the US
| Name of CSO CW and Data Source | Minoa [15,16] | Arch/Bar [17] | Akron [5,18] | Washington [19,20] | Harbor Brook [21] |
|---|---|---|---|---|---|
| Year of construction | 1995 | 1999 | 2001 | 2010–2012 | 2012–2014 |
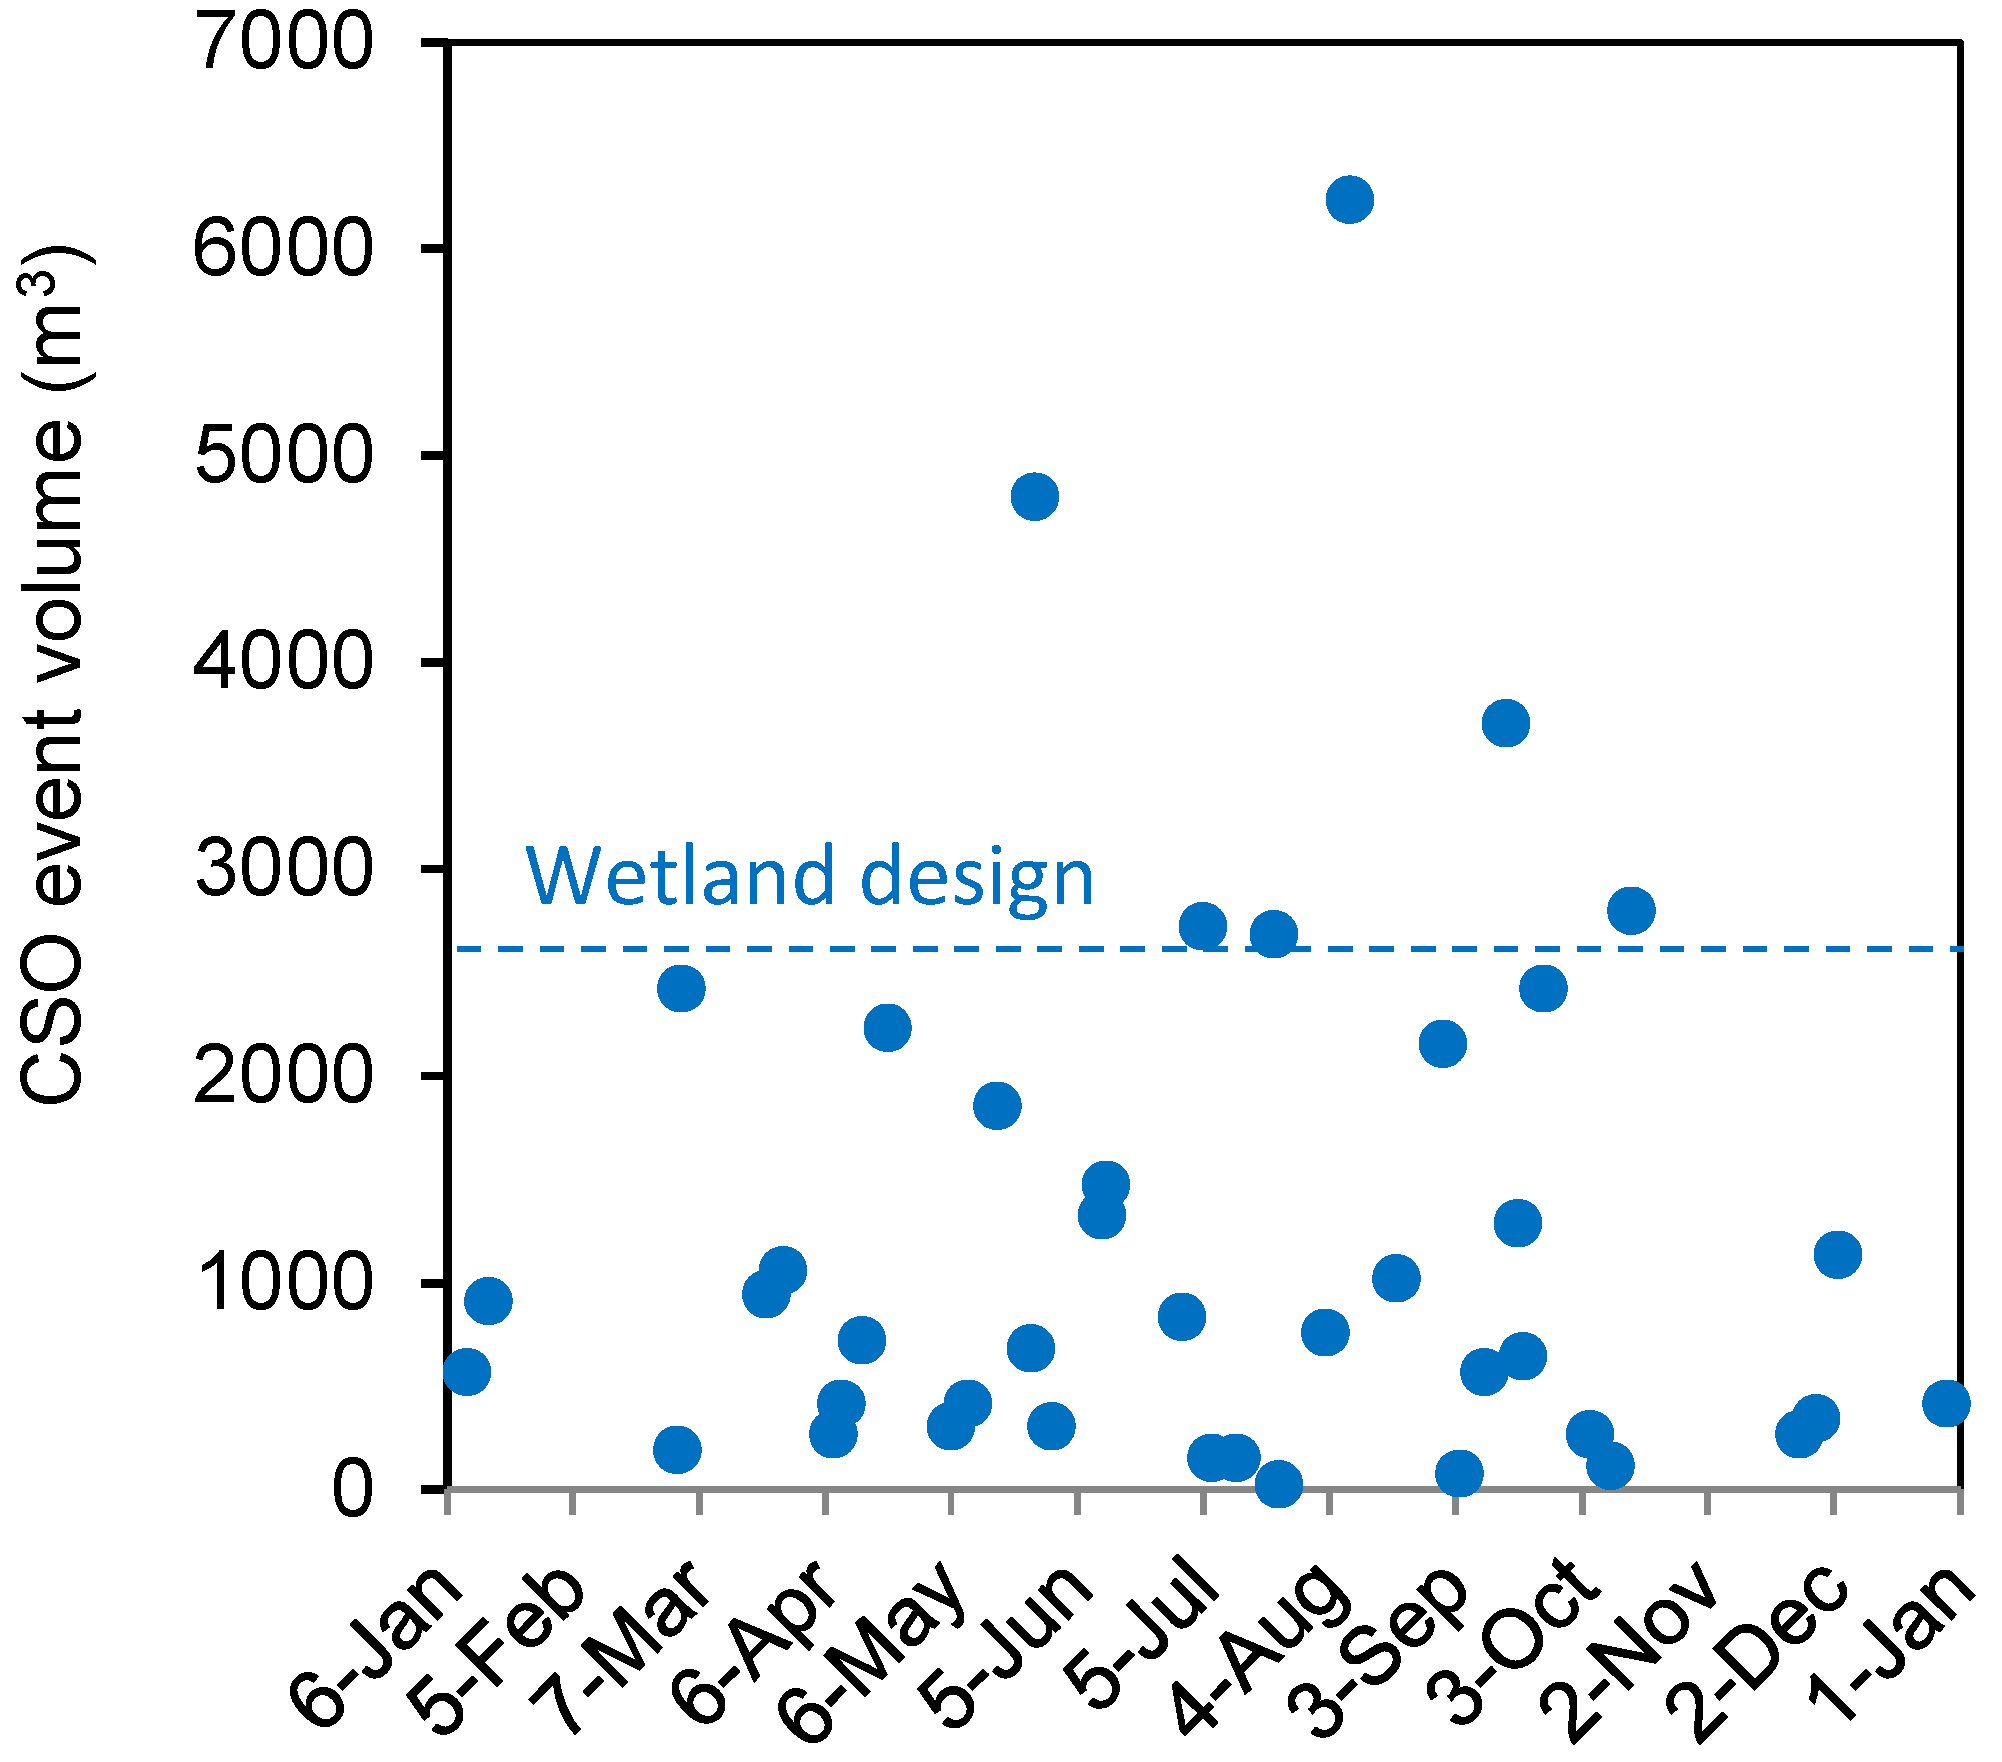
| Design storm event | n/a | First flush (40 min) | n/a | 10-yr 1-h (excluding first flush) | 1-yr 2-h |
| Design CSO volume (m3/event) | 1053 a | 52 (Typical) | 1890 | 79,380 | 2640 |
| Design peak CSO flow rate (m3/h) | 101 | 250 (Typical) | n/a | 2019 | 4485 |
| Pretreatment | Primary clarifier | Bar screen & sedimentation basin | Swirl separation units | Storage tank, nutrient baffle box, and pond | Swirl separation unit |
| Wetland area (m2) | 4500 | 2023 | 24,281 | 109,265 | 3139 |
| Wetland system components | 3 subsurface flow wetlands in series | FWS wetland—vertical flow wetland series | 2 FWS wetlands in parallel | FWS wetland—gravel filter series | Floating island, vertical flow, & FWS wetlands |
| Effluent disinfection | Chlorination/dechlorination | No | No | Ultraviolet | No b |
| Event hydraulic loading depth (mm/event) | 234 | 26 | 78 | 726 | 841 |
| Receiving waters | River | River | Lake | Creek | Creek |
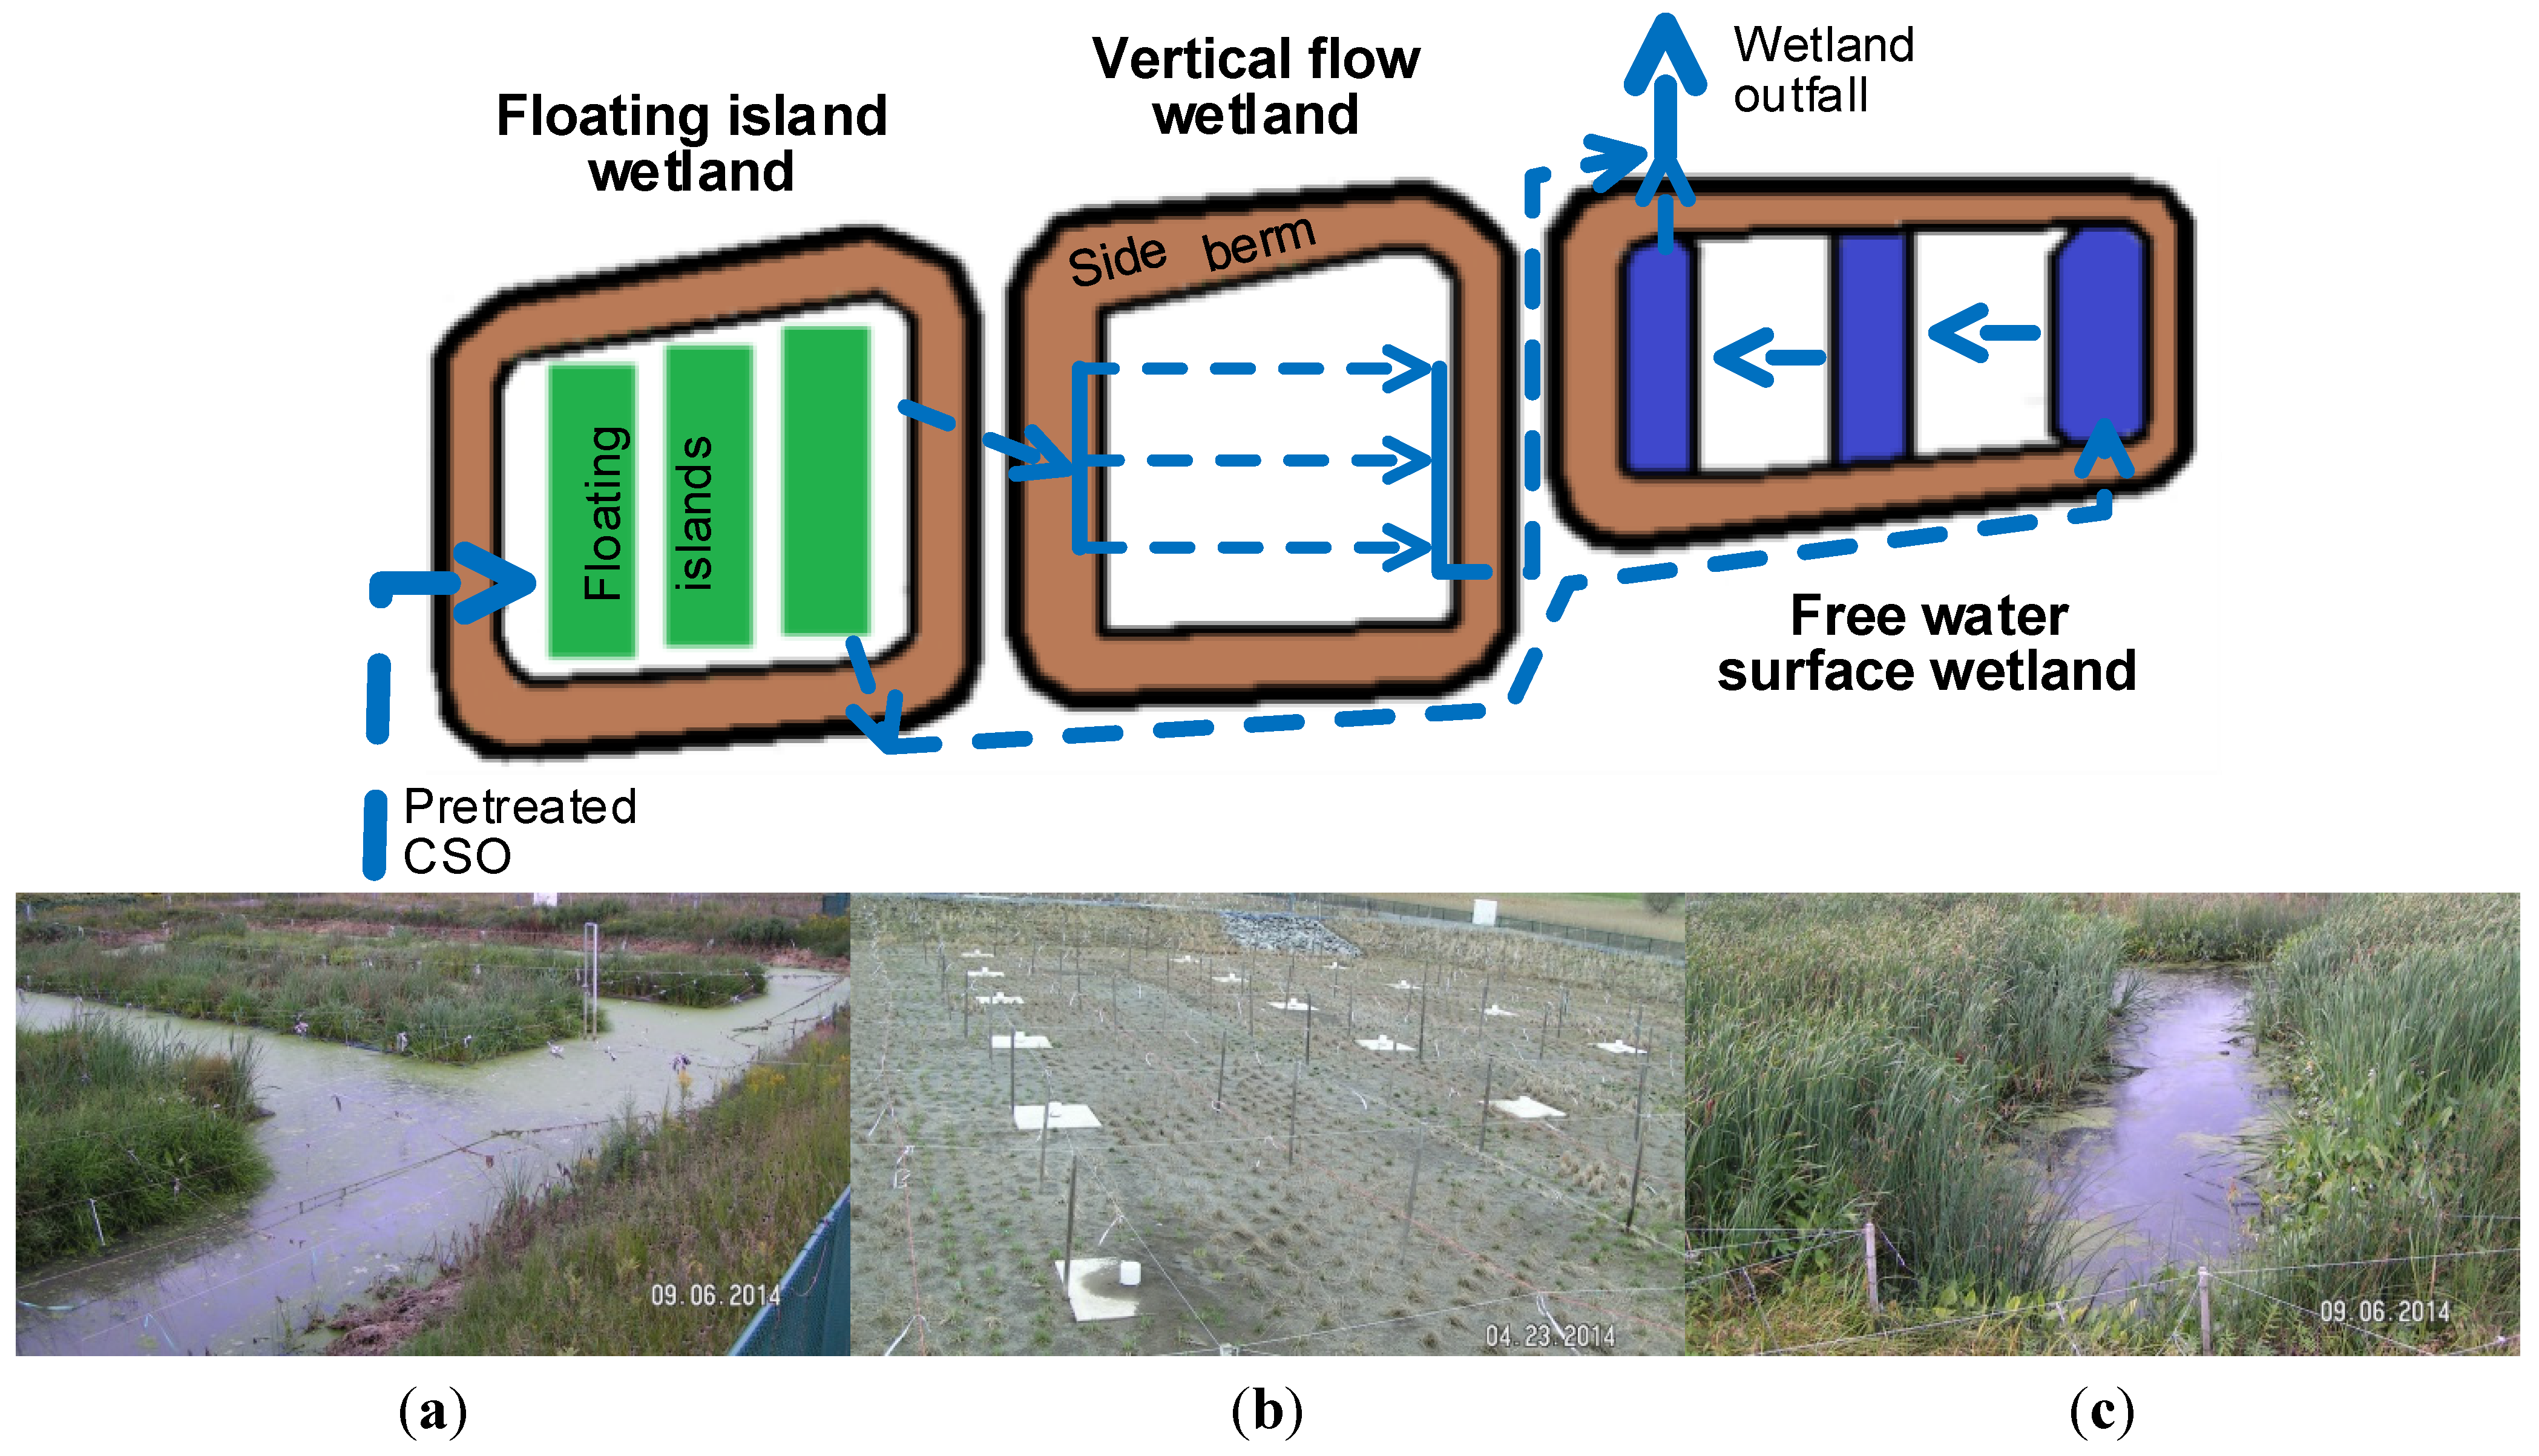
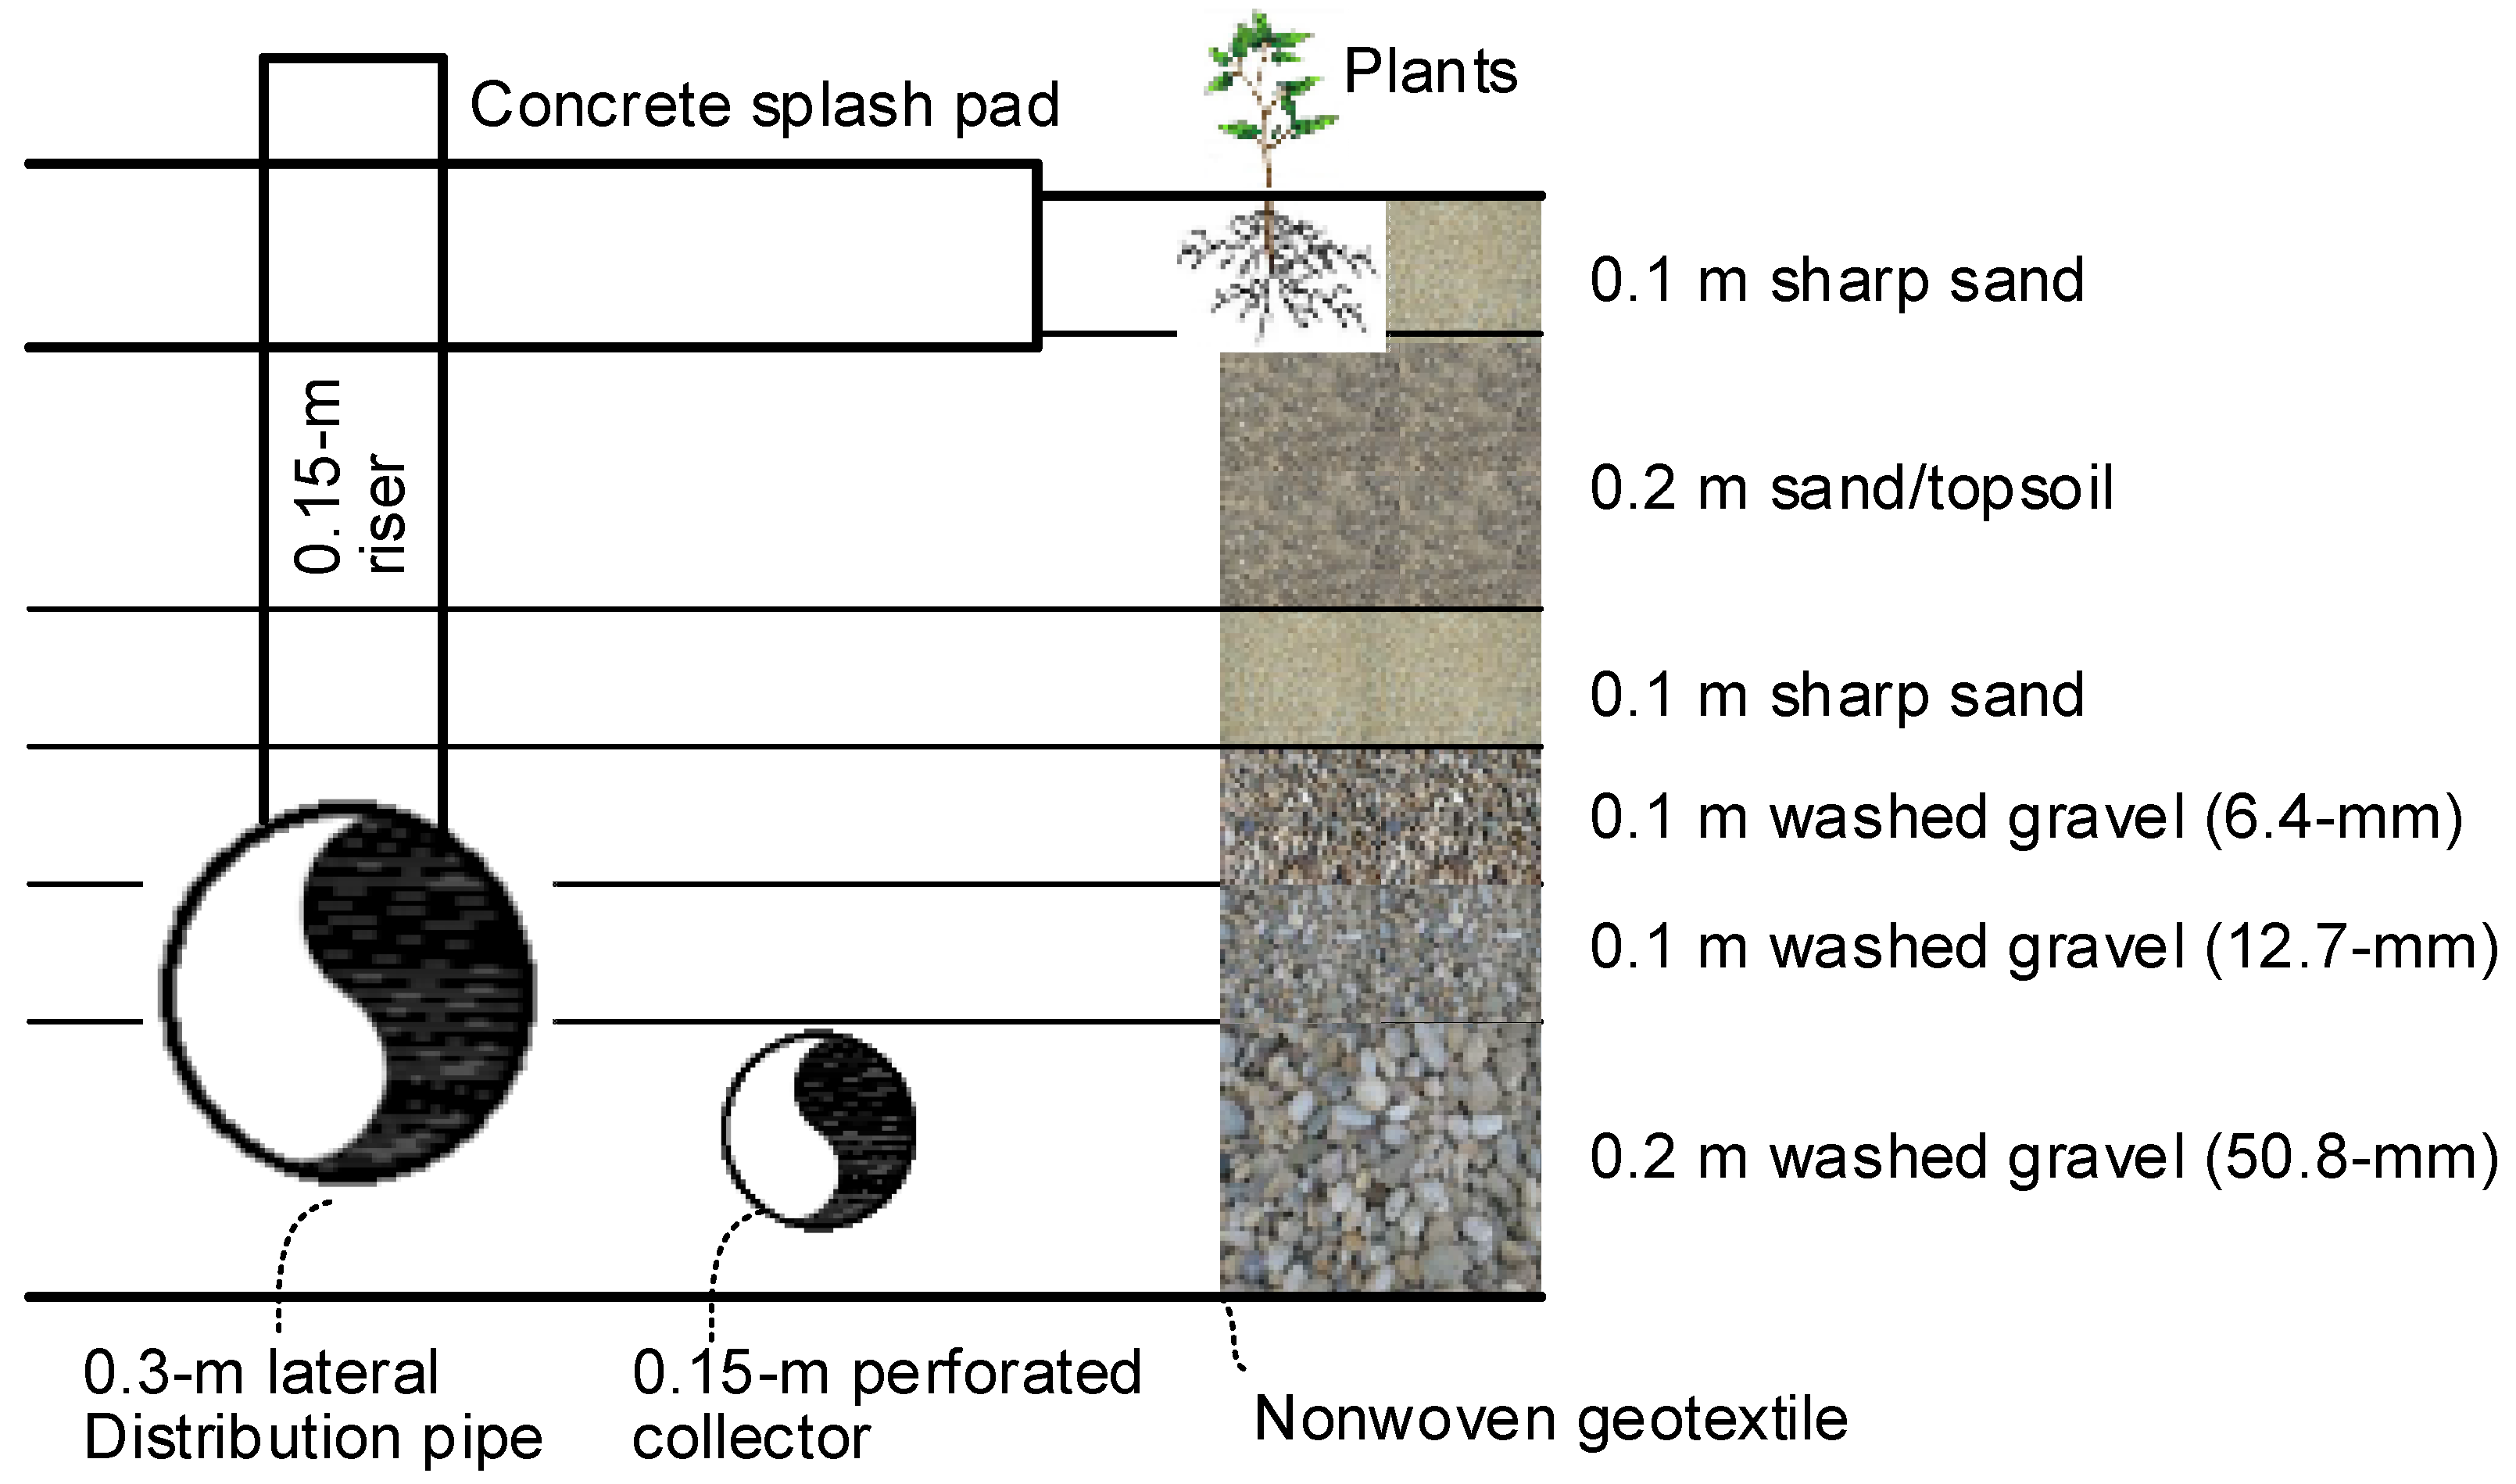
2.1. Harbor Brook CSO Constructed Wetlands in City of Syracuse, New York


2.2. Minoa Constructed Wetlands in Village of Minoa, New York
2.3. Arch/Bar CSO Constructed Wetlands in Town of Elkhart, Indiana

2.4. Akron CSO Constructed Wetlands in Town of Akron, Indiana
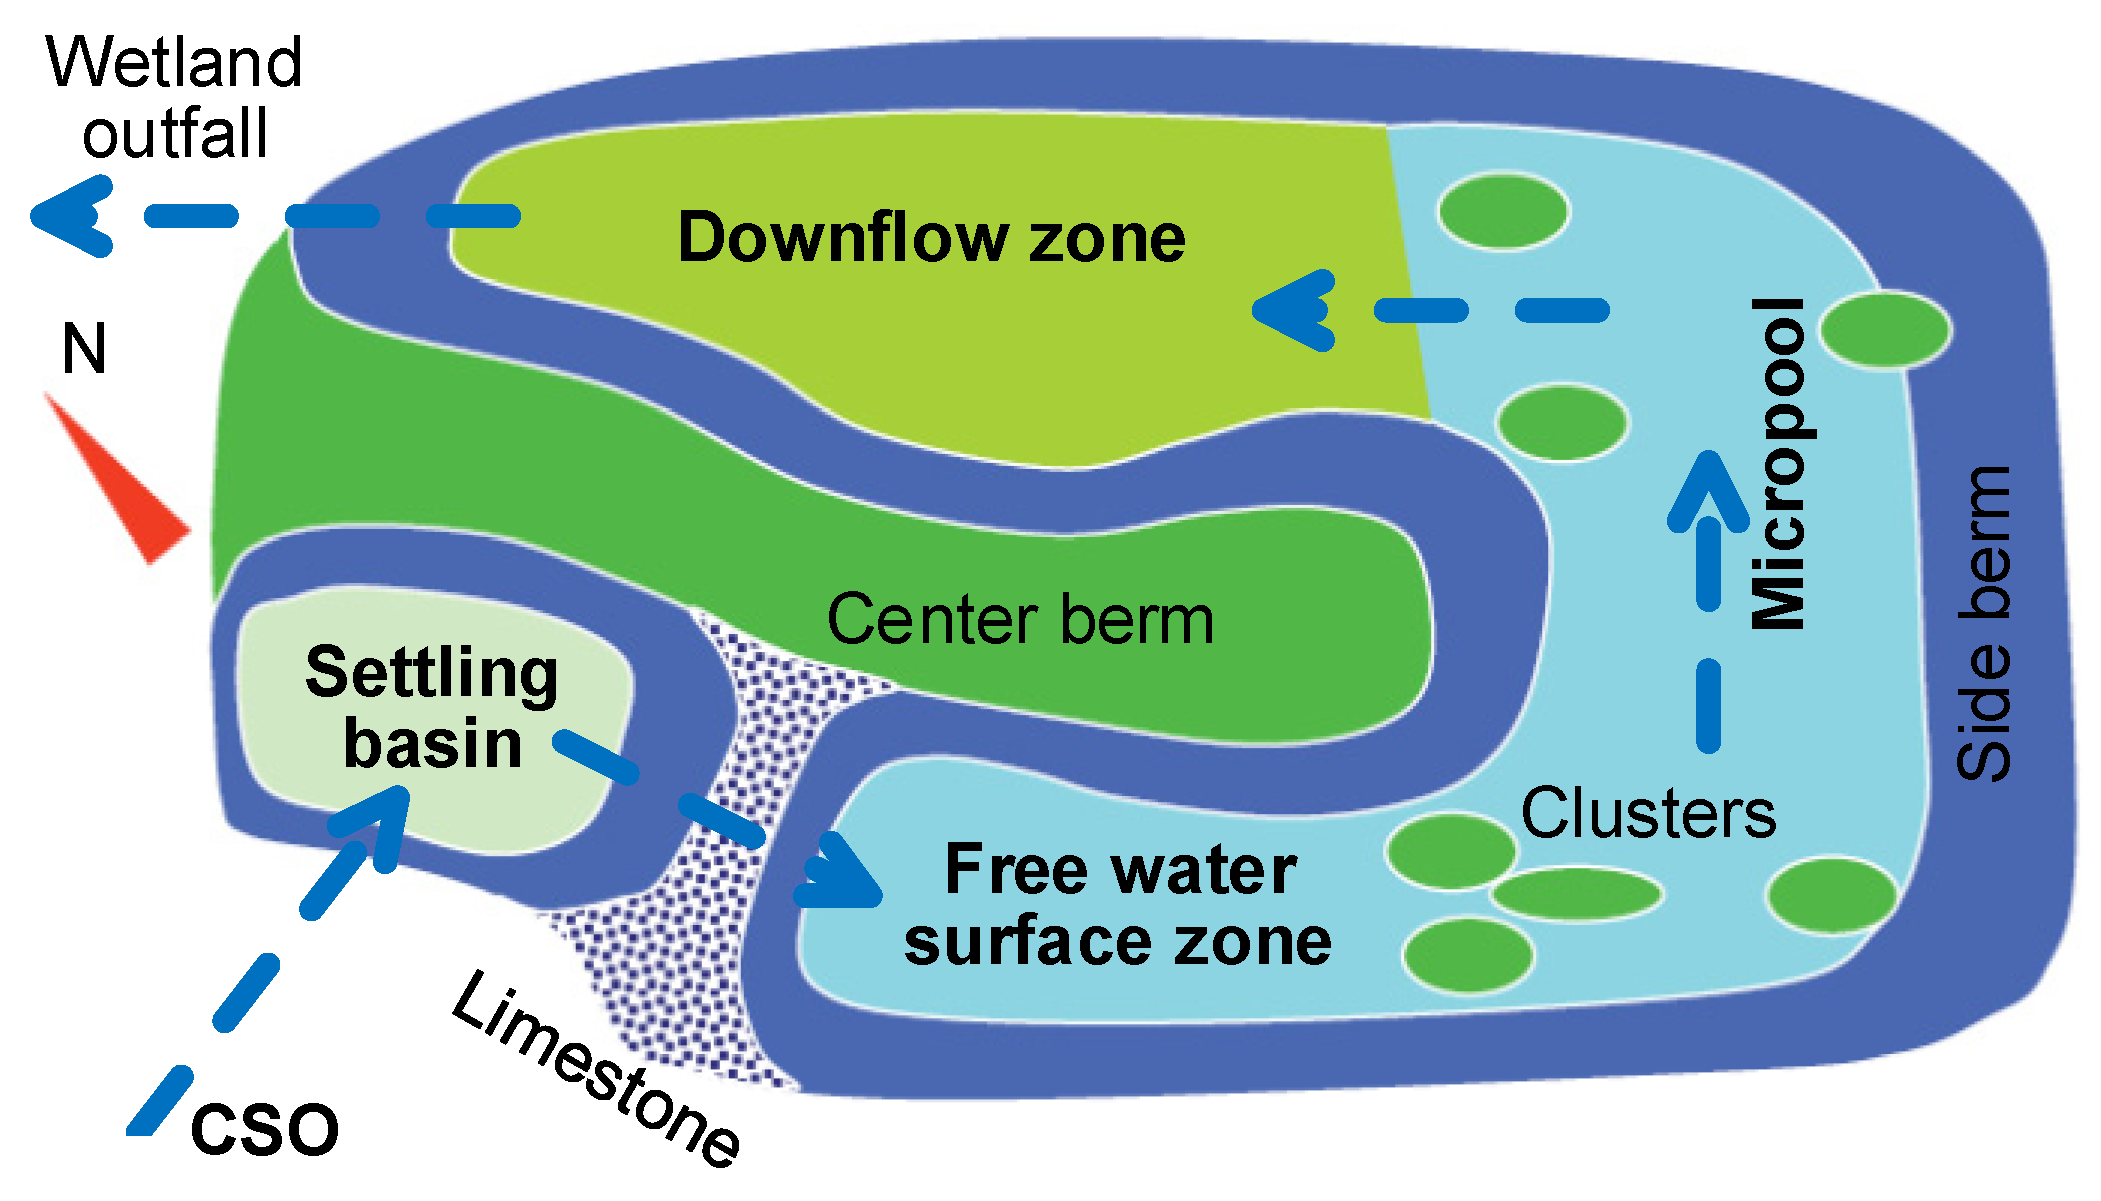
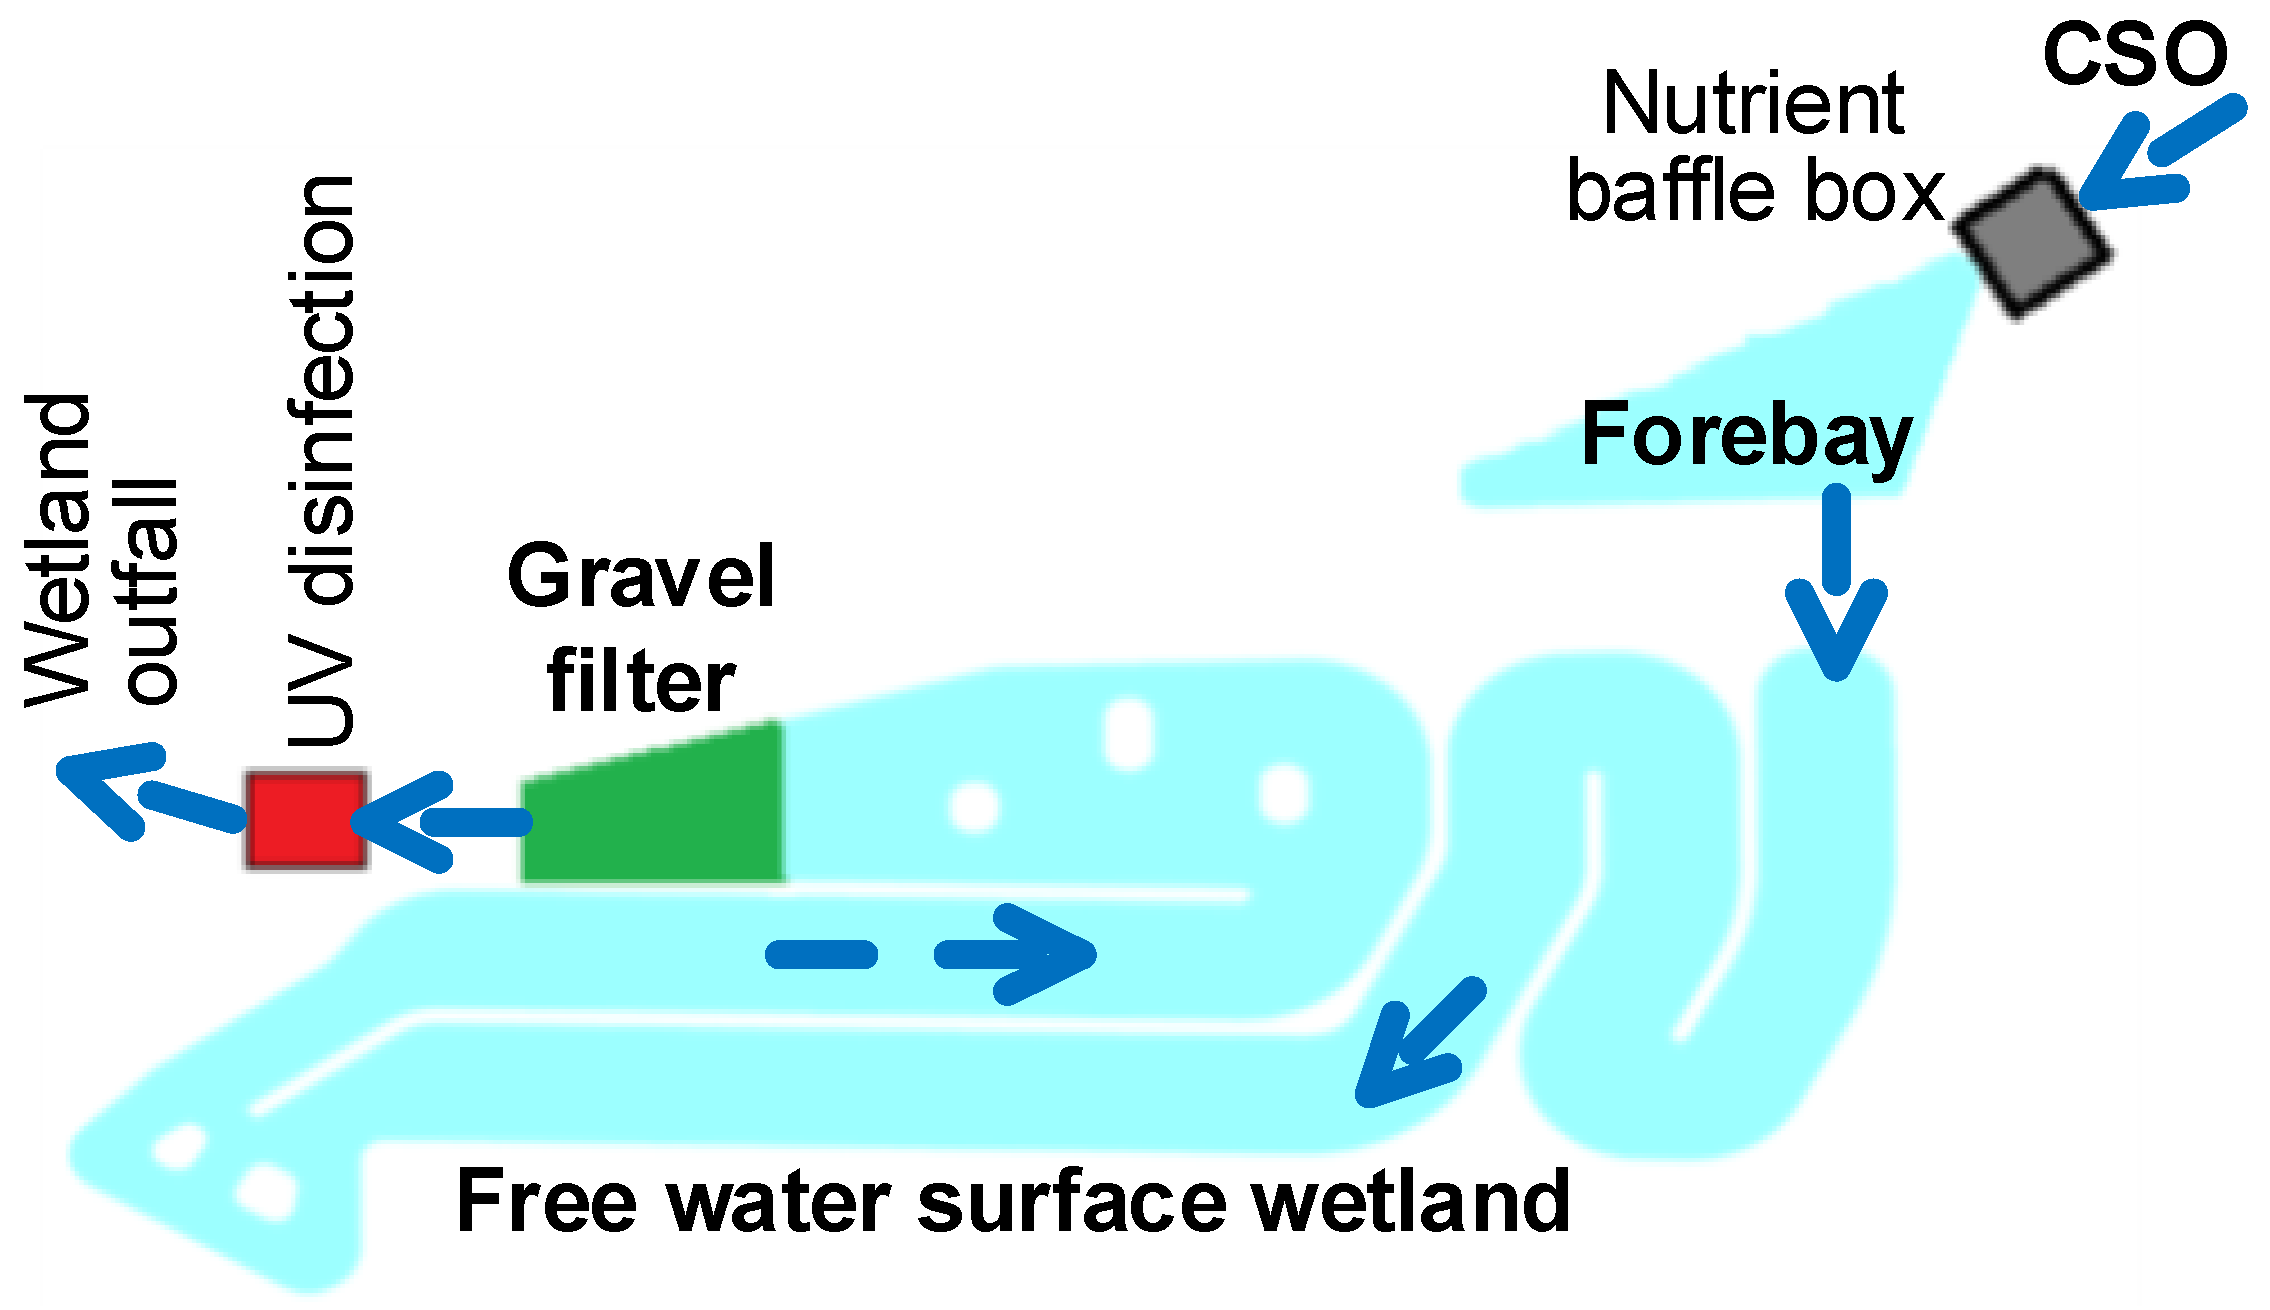
2.5. Washington CSO Constructed Wetlands in City of Washington, Indiana


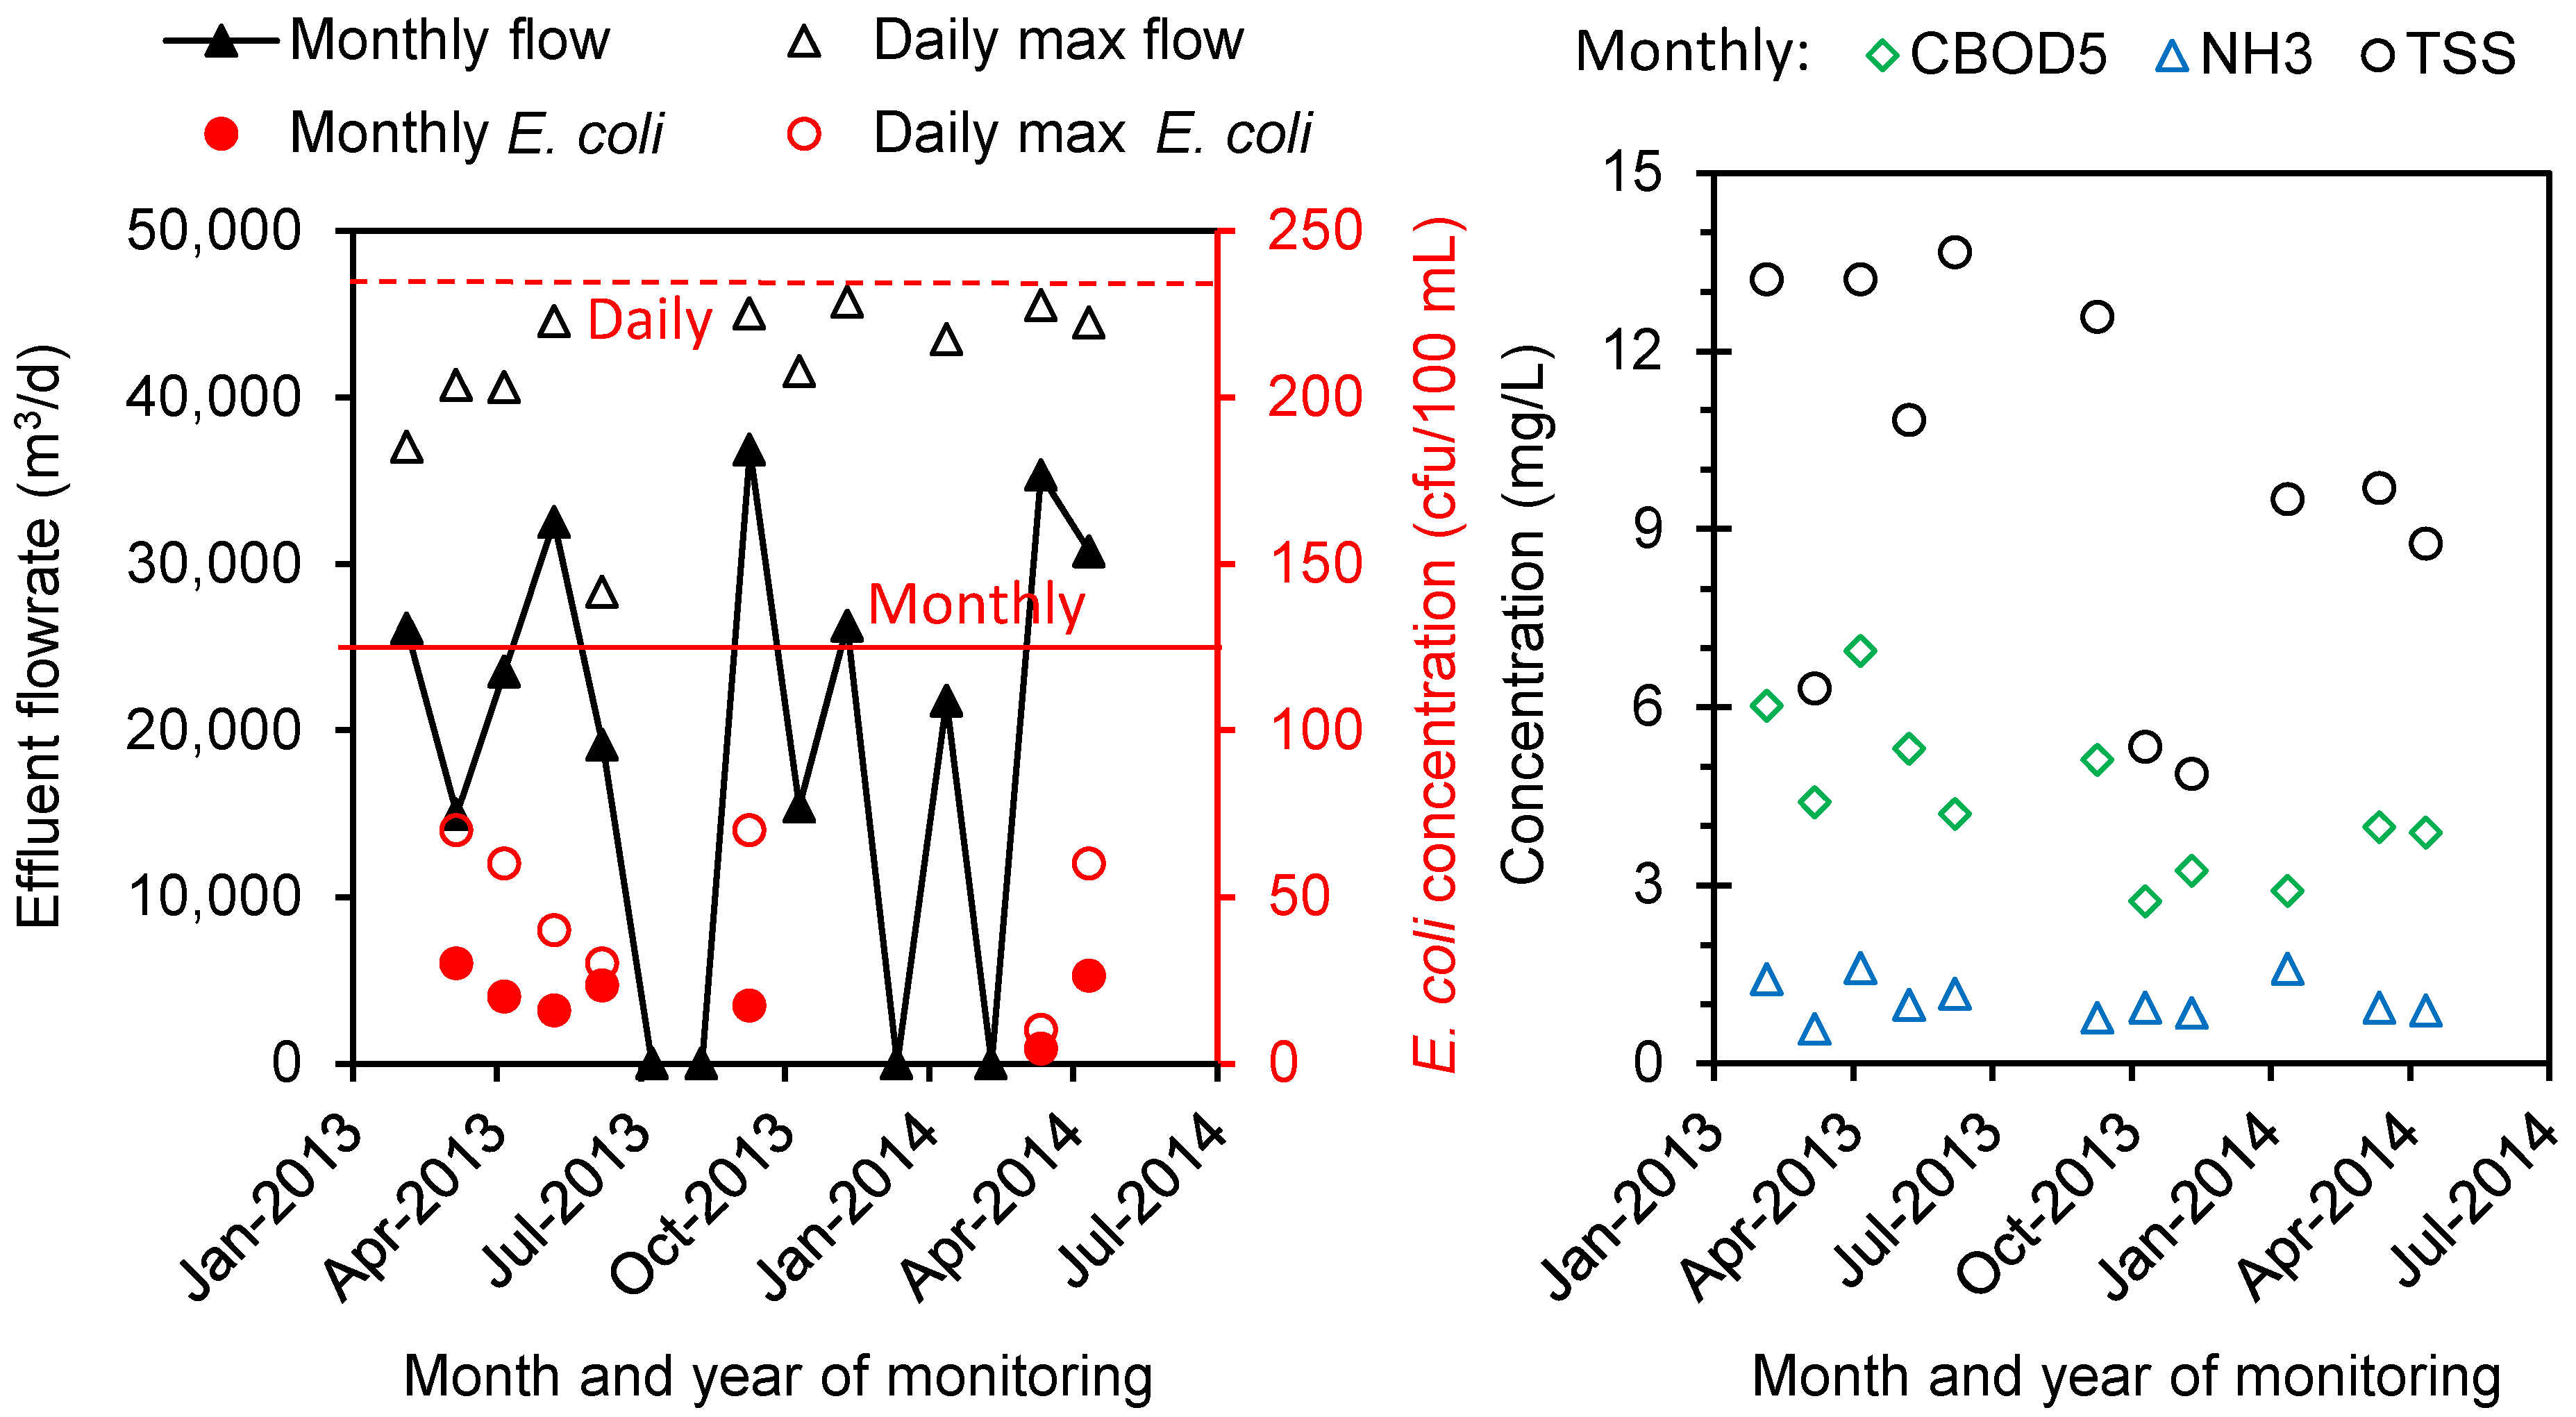
2.6. Benefits Demonstrated by Existing CSO Constructed Wetlands


| Monitoring Parameter | Arch/Bar CWs [8] | Akron CWs [8] | Washington CWs [8] | Harbor Brook CWs [9] |
|---|---|---|---|---|
| Flow | Visual monitoring | Report * | Report | Report |
| pH, dissolved oxygen, CBOD5, TSS, and total phosphorus | Report | Report | ||
| NH3 | Report | Report | ||
| TKN | Report | |||
| Total nitrogen and NO3− | Report | |||
| E. coli (cfu/100 mL) | Monthly 125; daily max 235 | |||
| Fecal coliforms (cfu/100 mL) | 200/Event |
| Monitoring Parameter | Elkhart WWTP (Compared with Arch/Bar Wetlands) | Akron Municipal WWTP (Compared with Akron Wetlands) | Washington WWTP (Compared with Washington Wetlands) a | Metro Syracuse WWTP (Compared with Harbor Brook Wetlands) a |
|---|---|---|---|---|
| Flow (m3/d) | Report | ≤1/10 receiving stream | Report | 4.77 × 10⁵ |
| pH | DA 6–9 | DA 6–9 | DA 6–9 | 6–9 |
| Dissolved oxygen (mg/L) | DA ≥4 | DA ≥6 | DA ≥5–6 | |
| CBOD5 (mg/L) | MO 25; WK 40 | MO 25; WK 40 | MO 20–25; WK 30–40 | MO 21; WK 31.5 |
| TSS (mg/L) | MO 30; WK 45 | MO 105; WK 70 | MO 20–25; WK 30–40 | MO 30; WK 45 |
| NH3 (mg/L) | MO 5.3; WK 12.4 | Report | MO 1.5; WK 2.4 | MO 1.2 (June–October); 2.4 (November–May) |
| TKN (mg/L) | Report | |||
| NO3− (mg/L) | Report | |||
| TP (mg/L) | MO 1.0 | 12-month rolling 0.10 | ||
| E. coli (cfu/100 mL) | MO 125; DA 235 | MO 125; DA 235 | MO 125; DA 235 | |
| Fecal coliforms (cfu/100 mL) | MO 200; WK 400 |
3. Design Challenges and Considerations for CSO Treatment in Constructed Wetlands
3.1. NPDES Permitting
3.2. Design Capacity
3.3. Evaluation of Hydraulic and Contaminant Loading
3.4. Pretreatment
3.5. Wetland Type
3.6. Wetland Layout
3.7. Configuration of Wetland Cells
3.8. Performance Assessment
3.9. Development of Design Supportive Simulation Tools
4. Adaptive Design of Harbor Brook CSO Wetland Treatment System
5. Conclusions
Author Contributions
Conflicts of Interest
References
- US Environmental Protection Agency (USEPA). Greening CSO Plans: Planning and Modeling Green Infrastructure for Combined Sewer Overflow (CSO) Control; Publication # 832-R-14-001; USEPA: Washington, DC, USA, March 2014.
- Metcalf & Eddy/AECOM. Wastewater Engineering—Treatment and Resource Recovery, 5th ed.; McGraw-Hill Education: New York, NY, USA, 2014. [Google Scholar]
- USEPA. Combined Sewer Overflow (CSO) Control Policy. In Fed. Regist.; 1994; 59, pp. 18687–18698. [Google Scholar]
- National Research Council (NRC). Urban Stormwater Management in the United States; National Academies Press: Washington, DC, USA, 2008.
- Levy, Z.F.; Smardon, R.C.; Bays, J.S.; Meyer, D. A point source of a different color: Identifying a gap in United States regulatory policy for “green” CSO treatment using constructed wetlands. Sustainability 2014, 6, 2392–2412. [Google Scholar] [CrossRef]
- USEPA. Green Infrastructure Permitting and Enforcement Series: Factsheet 2 Combined Sewer Overflows; EPA832F12013; USEPA: Washington, DC, USA, 2013.
- Kadlec, R.H.; Wallace, S.D. Treatment Wetlands, 2nd ed.; CRC Press: Boca Raton, FL, USA, 2009. [Google Scholar]
- USEPA. Enforcement and Compliance History Online (ECHO): Facility Search—Enforcement and Compliance Data. 2014. Available online: http://echo.epa.gov/facility_search (accessed on 24 April 2014). [Google Scholar]
- New York State Department of Environmental Conservation (NYSDEC). State Pollution Discharge Elimination System (SPDES) Discharge Permit Number NY 002 7081; NYSDEC: Syracuse, NY, USA, 4 June 2014.
- Perreault, T.; Wraight, S.; Perreault, M. Environmental injustice in the Onondaga Lake waterscape, New York State, USA. Water Altern. 2012, 5, 485–506. [Google Scholar]
- State University of New York College of Environmental Science and Forestry (SUNY ESF). Technical Memorandum: Harbor Brook CSO 018 Pre-Construction Monitoring, SUNY ESF: Syracuse, NY, USA, October 2012.
- Meyer, D.; Molle, P.; Esser, D.; Troesch, S.; Masi, F.; Dittmer, U. Constructed wetlands for combined sewer overflow treatment—Comparison of German, French and Italian approaches. Water 2013, 5, 1–12. [Google Scholar] [CrossRef]
- Volume 1: Final Integrated Overflow Control Plan; Prepared for Evansville Water and Sewer Utility; CH2MHILL: Evansville, IN, USA, 31 May 2013.
- Save the Rain: Harbor Brook Wetland Project. Available online: http://savetherain.us/str_project/wetland/ (accessed on 23 July 2014).
- Crites, R.W.; Middlebrooks, E.J.; Bastian, R.K.; Reed, S.C. Natural Wastewater Treatment Systems, 2nd ed.; CRC Press: Boca Raton, FL, USA, 2014. [Google Scholar]
- USEPA. Manual: Constructed Wetlands Treatment of Municipal Wastewaters; EPA/625/R-99/010; Office of Research and Development: Cincinnati, OH, USA, September 2000.
- Umble, A.K.; Machlan, M.; Horvath, E.C.; Newvine, L.A. Constructed wetlands for treating combined sewer overflows: An alternative solution for implementing the CSO strategy. In Proceedings of the Water Environment Federation Watershed Management 2000 Conference, Vancouver, BC, Canada, 9–12 July 2000; Water Environment Federation: Alexandria, VA, USA, July 2000; pp. 2571–2588. [Google Scholar]
- CDS Technologies, Inc. Small town finds cost-effective CSO solution. Water World 2003, 19, 22. [Google Scholar]
- Harrison, M.L.; Kasthuri, L.P. How One Small Community Saved Big Bucks on Its CSO Long-Term Control Plan—City of Washington, Indiana; Bernardin, Lochmueller & Associates, Inc.: Evansville, IN, USA, 2012. [Google Scholar]
- Zagoudis, J. 2011 Top water & wastewater projects. Water Wastes Digest 2011, 24–42. [Google Scholar]
- Design Report: Harbor Brook CSO 018 Constructed Wetlands Pilot Treatment System; CH2MHILL and CHA: Syracuse, NY, USA, July 2011.
- CH2MHILL; CHA. Harbor Brook CSO 018 Constructed Wetlands Pilot Treatment System, Drawings for Regulatory Agency Review; CH2MHILL and CHA: Syracuse, NY, USA, December 2012. [Google Scholar]
- Giarrusso, S. Budgeting for operation and maintenance at a small plant: Village of Minoa case study. Clear Waters 2004, 44, 44–45. [Google Scholar]
- Indiana Department of Environmental Management (IDEM). Agreed Order between Indiana Department of Environmental Management (Complainant) and Town of Akron (Respondent), signed on 22 October 2003. Available online: http://www.in.gov/idem/oe/cause/AO/11554-W.htm (accessed on 5 August 2014).
- Jaffe, M. Reflections on green infrastructure economics. Environ. Pract. 2011, 12, 357–365. [Google Scholar] [CrossRef]
- IDEM. Small Community Constructed Wetlands, Mound Systems. Available online: http://www.in.gov/idem/4893.htm (accessed on 25 July 2014).
- IDEM. Agency Nonrule Policy Document: CSO Treatment Facilities (Water-016); IDEM Office of Water Quality: Indianapolis, IN, USA, April 2008.
- Bell, S.; Gibson, J.P.; Frye, C. Moving the water quality needle: Effectiveness of the Banklick Creek Regional Wetland for water quality improvement as part of an integrated watershed approach to water resource management. In Proceedings of the Water Environment Federation Technical Exhibition and Conference (WEFTEC) 2013, Chicago, IL, USA, 5–9 October 2013; Water Environment Federation: Alexandria, VA, USA, October 2013; pp. 3133–3145. [Google Scholar]
- Meyer, D.; Dittmer, U. RSF_Sim—A simulation tool to support the design of constructed wetlands for combined sewer overflow treatment in Germany. Ecol. Eng. 2014. [Google Scholar] [CrossRef]
- Guo, W.; Li, Z.; Cheng, S.; Liang, W.; He, F.; Wu, Z. Performance of a pilot-scale constructed wetland for stormwater runoff and domestic sewage treatment on the banks of a polluted urban river. Water Sci. Technol. 2014, 69, 1410–1418. [Google Scholar] [CrossRef] [PubMed]
- Van de Moortel, A.M.K.; Rousseau, D.P.L.; Tack, F.M.G.; Pauw, N.D. A comparative study of surface and subsurface flow constructed wetlands for treatment of combined sewer overflows: A greenhouse experiment. Ecol. Eng. 2009, 35, 175–183. [Google Scholar] [CrossRef]
- Borne, K.E.; Fassman-Beck, E.A.; Tanner, C.C. Floating treatment wetland influences on the fate of metals in road runoff retention ponds. Water Res. 2014, 48, 430–442. [Google Scholar] [CrossRef]
- Lightbody, A.; Nepf, H.; Bays, J. Modeling the hydraulic effect of transverse deep zones on the performance of short-circuiting constructed treatment wetlands. Ecol. Eng. 2009, 35, 754–768. [Google Scholar] [CrossRef]
- Woźniak, R. Interaction of oxygen concentration and retention of pollutants in vertical flow constructed wetlands for CSO treatment. Water Sci. Technol. 2007, 56, 31–38. [Google Scholar] [CrossRef] [PubMed]
- Henrichs, M.; Welker, A.; Uhl, M. Modelling of biofilters for ammonium reduction in combined sewer overflow. Water Sci. Technol. 2009, 60, 825–831. [Google Scholar] [CrossRef] [PubMed]
- Amaral, R.; Ferreira, A.; Galvao, A.; Matos, S. Constructed wetlands for combined sewer overflow treatment in a Mediteranean country, Portugal. Water Sci. Technol. 2013, 67, 2739–2745. [Google Scholar] [CrossRef] [PubMed]
- Meyer, D.; Chazarenc, F.; Claveau-Mallet, D.; Dittmer, U.; Forquet, N.; Molle, P.; Morvannou, A.; Pálfy, T.G.; Petitjean, A.; Rizzo, A.; et al. Modelling constructed wetlands: Scopes and aims—A comparative review. Ecol. Eng. 2014, in press. [Google Scholar]
© 2014 by the authors; licensee MDPI, Basel, Switzerland. This article is an open access article distributed under the terms and conditions of the Creative Commons Attribution license (http://creativecommons.org/licenses/by/4.0/).
Share and Cite
Tao, W.; Bays, J.S.; Meyer, D.; Smardon, R.C.; Levy, Z.F. Constructed Wetlands for Treatment of Combined Sewer Overflow in the US: A Review of Design Challenges and Application Status. Water 2014, 6, 3362-3385. https://doi.org/10.3390/w6113362
Tao W, Bays JS, Meyer D, Smardon RC, Levy ZF. Constructed Wetlands for Treatment of Combined Sewer Overflow in the US: A Review of Design Challenges and Application Status. Water. 2014; 6(11):3362-3385. https://doi.org/10.3390/w6113362
Chicago/Turabian StyleTao, Wendong, James S. Bays, Daniel Meyer, Richard C. Smardon, and Zeno F. Levy. 2014. "Constructed Wetlands for Treatment of Combined Sewer Overflow in the US: A Review of Design Challenges and Application Status" Water 6, no. 11: 3362-3385. https://doi.org/10.3390/w6113362