Understanding Irrigator Bidding Behavior in Australian Water Markets in Response to Uncertainty


Abstract
:1. Introduction
2. Study Area
3. Price Clustering Literature and Applications to Water Markets
3.1. Price Clustering Theories

| Seller Offer Price ($/ML) | Volume for Sale | Total Volume in Exchange | Buyer Bid Price ($/ML) | Volume for Purchase | Total Volume in Exchange |
|---|---|---|---|---|---|
| 14.00 | 200 | 200 | 26.38 | 200 | 200 |
| 15.00 | 103 | 303 | 25.50 | 200 | 400 |
| 15.00 | 18.2 | 321.2 | 25.00 | 400 | 800 |
| 15.00 | 60 | 381.2 | 25.00 | 11 | 811 |
| 17.00 | 80 | 461.2 | 25.00 | 200 | 1011 |
| 18.00 | 55 | 516.2 | 25.00 | 150 | 1161 |
| 19.00 | 320 | 836.2 | 23.38 | 200 | 1361 |
| 19.90 | 100 | 936.2 | 22.30 | 200 | 1561 |
| 20.00 | 100 | 1036.2 | 22.00 | 20 | 1581 |
| 20.00 | 150 | 1186.2 | 20.38 | 200 | 1781 |
| 20.00 | 120 | 1306.2 | 20.00 | 100 | 1881 |
| 20.00 | 59 | 1365.2 | 20.00 | 100 | 1981 |
| 20.00 | 24.3 | 1389.5 | 19.85 | 1500 | 3481 |
| 20.00 | 52 | 1441.5 | 18.00 | 500 | 3981 |
| 28.00 | 50 | 1491.5 | 18.00 | 200 | 4181 |
| 28.00 | 210 | 1701.5 | 15.88 | 200 | 4381 |
| 29.00 | 92 | 1793.5 | 15.00 | 200 | 4581 |
| 30.00 | 379 | 2172.5 | 15.00 | 10 | 4591 |
| 30.00 | 150 | 2322.5 | 14.22 | 500 | 5091 |
| 30.00 | 150 | 2472.5 | 12.88 | 500 | 5591 |
| 30.00 | 60 | 2532.5 | 10.00 | 250 | 5841 |
| 30.99 | 300 | 2832.5 | Date: 8 September 2011 Pool price: $21.15/ML Total volume traded: 1441.5 ML (The shaded bids and offer orders were executed, with the buy order indicated by asterisk only fulfilled by 80.5 ML) | ||
| 30.99 | 140 | 2972.5 | |||
| 35.00 | 500 | 3472.5 | |||
| 42.38 | 490.7 | 3963.2 | |||
| 42.38 | 192.6 | 4155.8 | |||
| 45.00 | 68 | 4223.8 | |||
| 45.00 | 20 | 4243.8 | |||
| 45.00 | 100 | 4343.8 | |||
| 50.00 | 20 | 4363.8 | |||
| 50.00 | 70 | 4433.8 | |||
| 58.00 | 100 | 4533.8 | |||
| 60.00 | 50 | 4583.8 | |||
| 60.25 | 46 | 4629.8 | |||
| 100.00 | 95 | 4724.8 | |||
3.2. Overall Water Market Clustering Hypothesis
4. Price Clustering Evidence in the Greater Goulburn Water Allocation Market
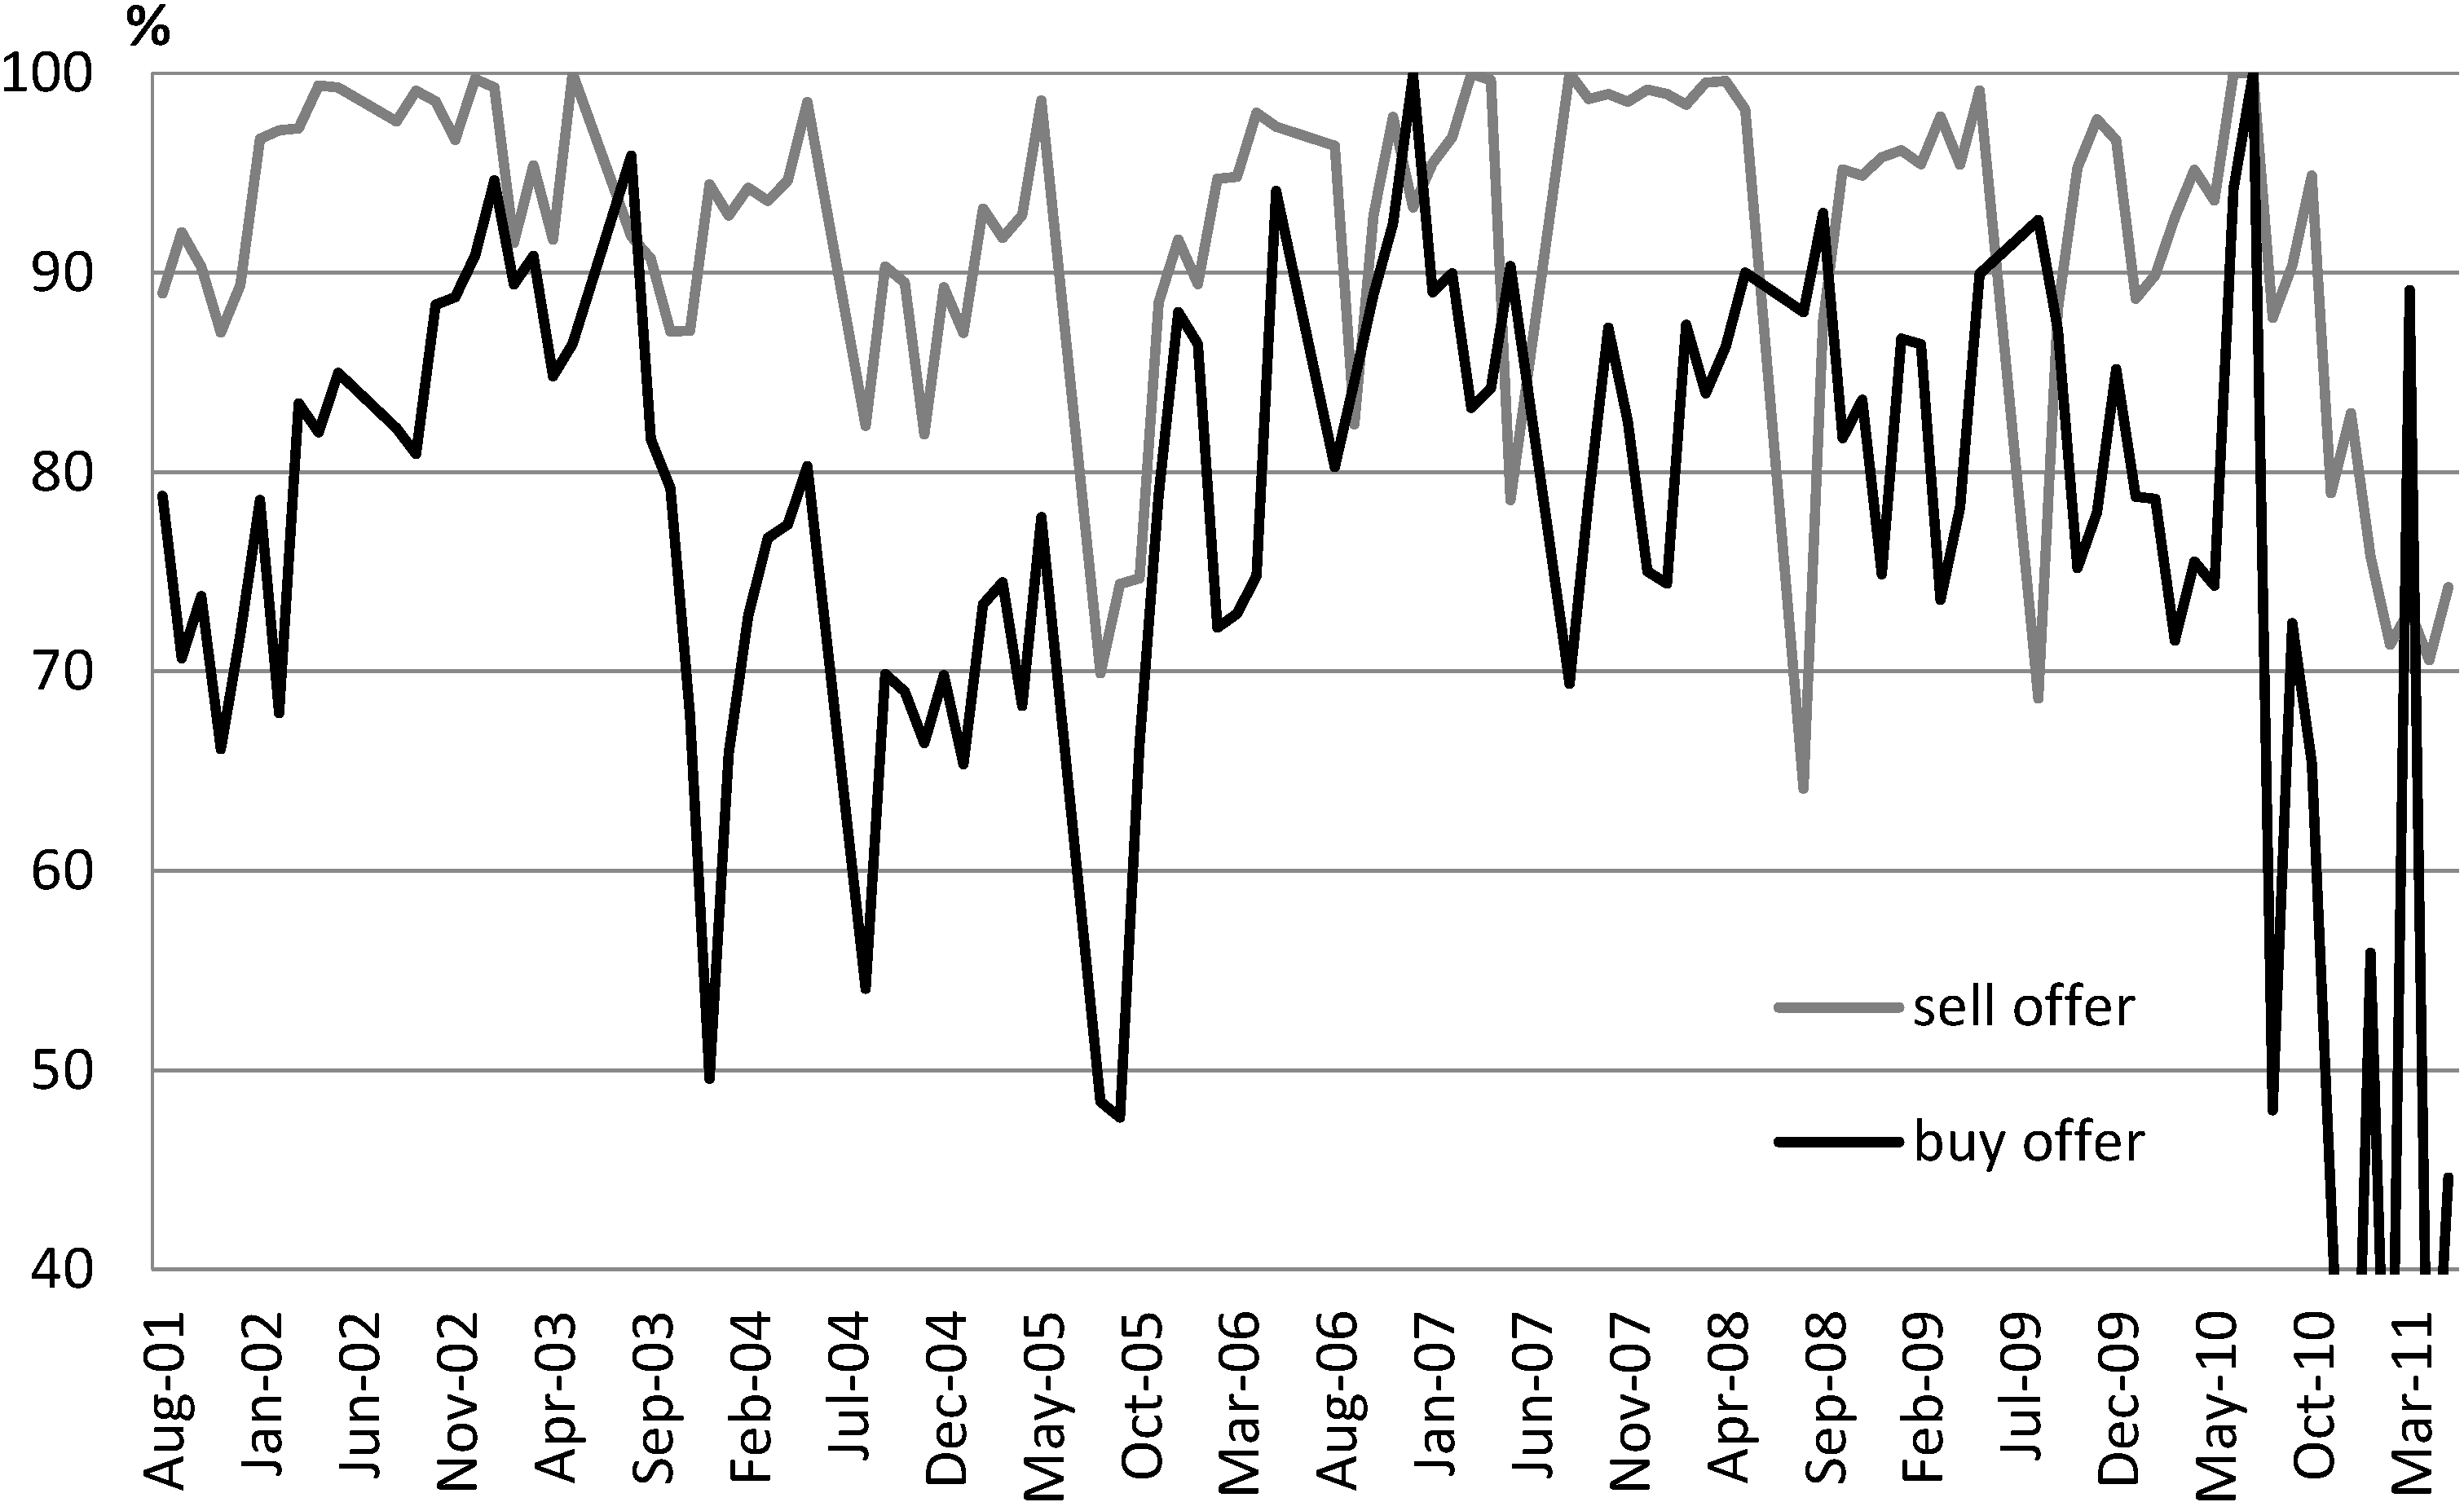
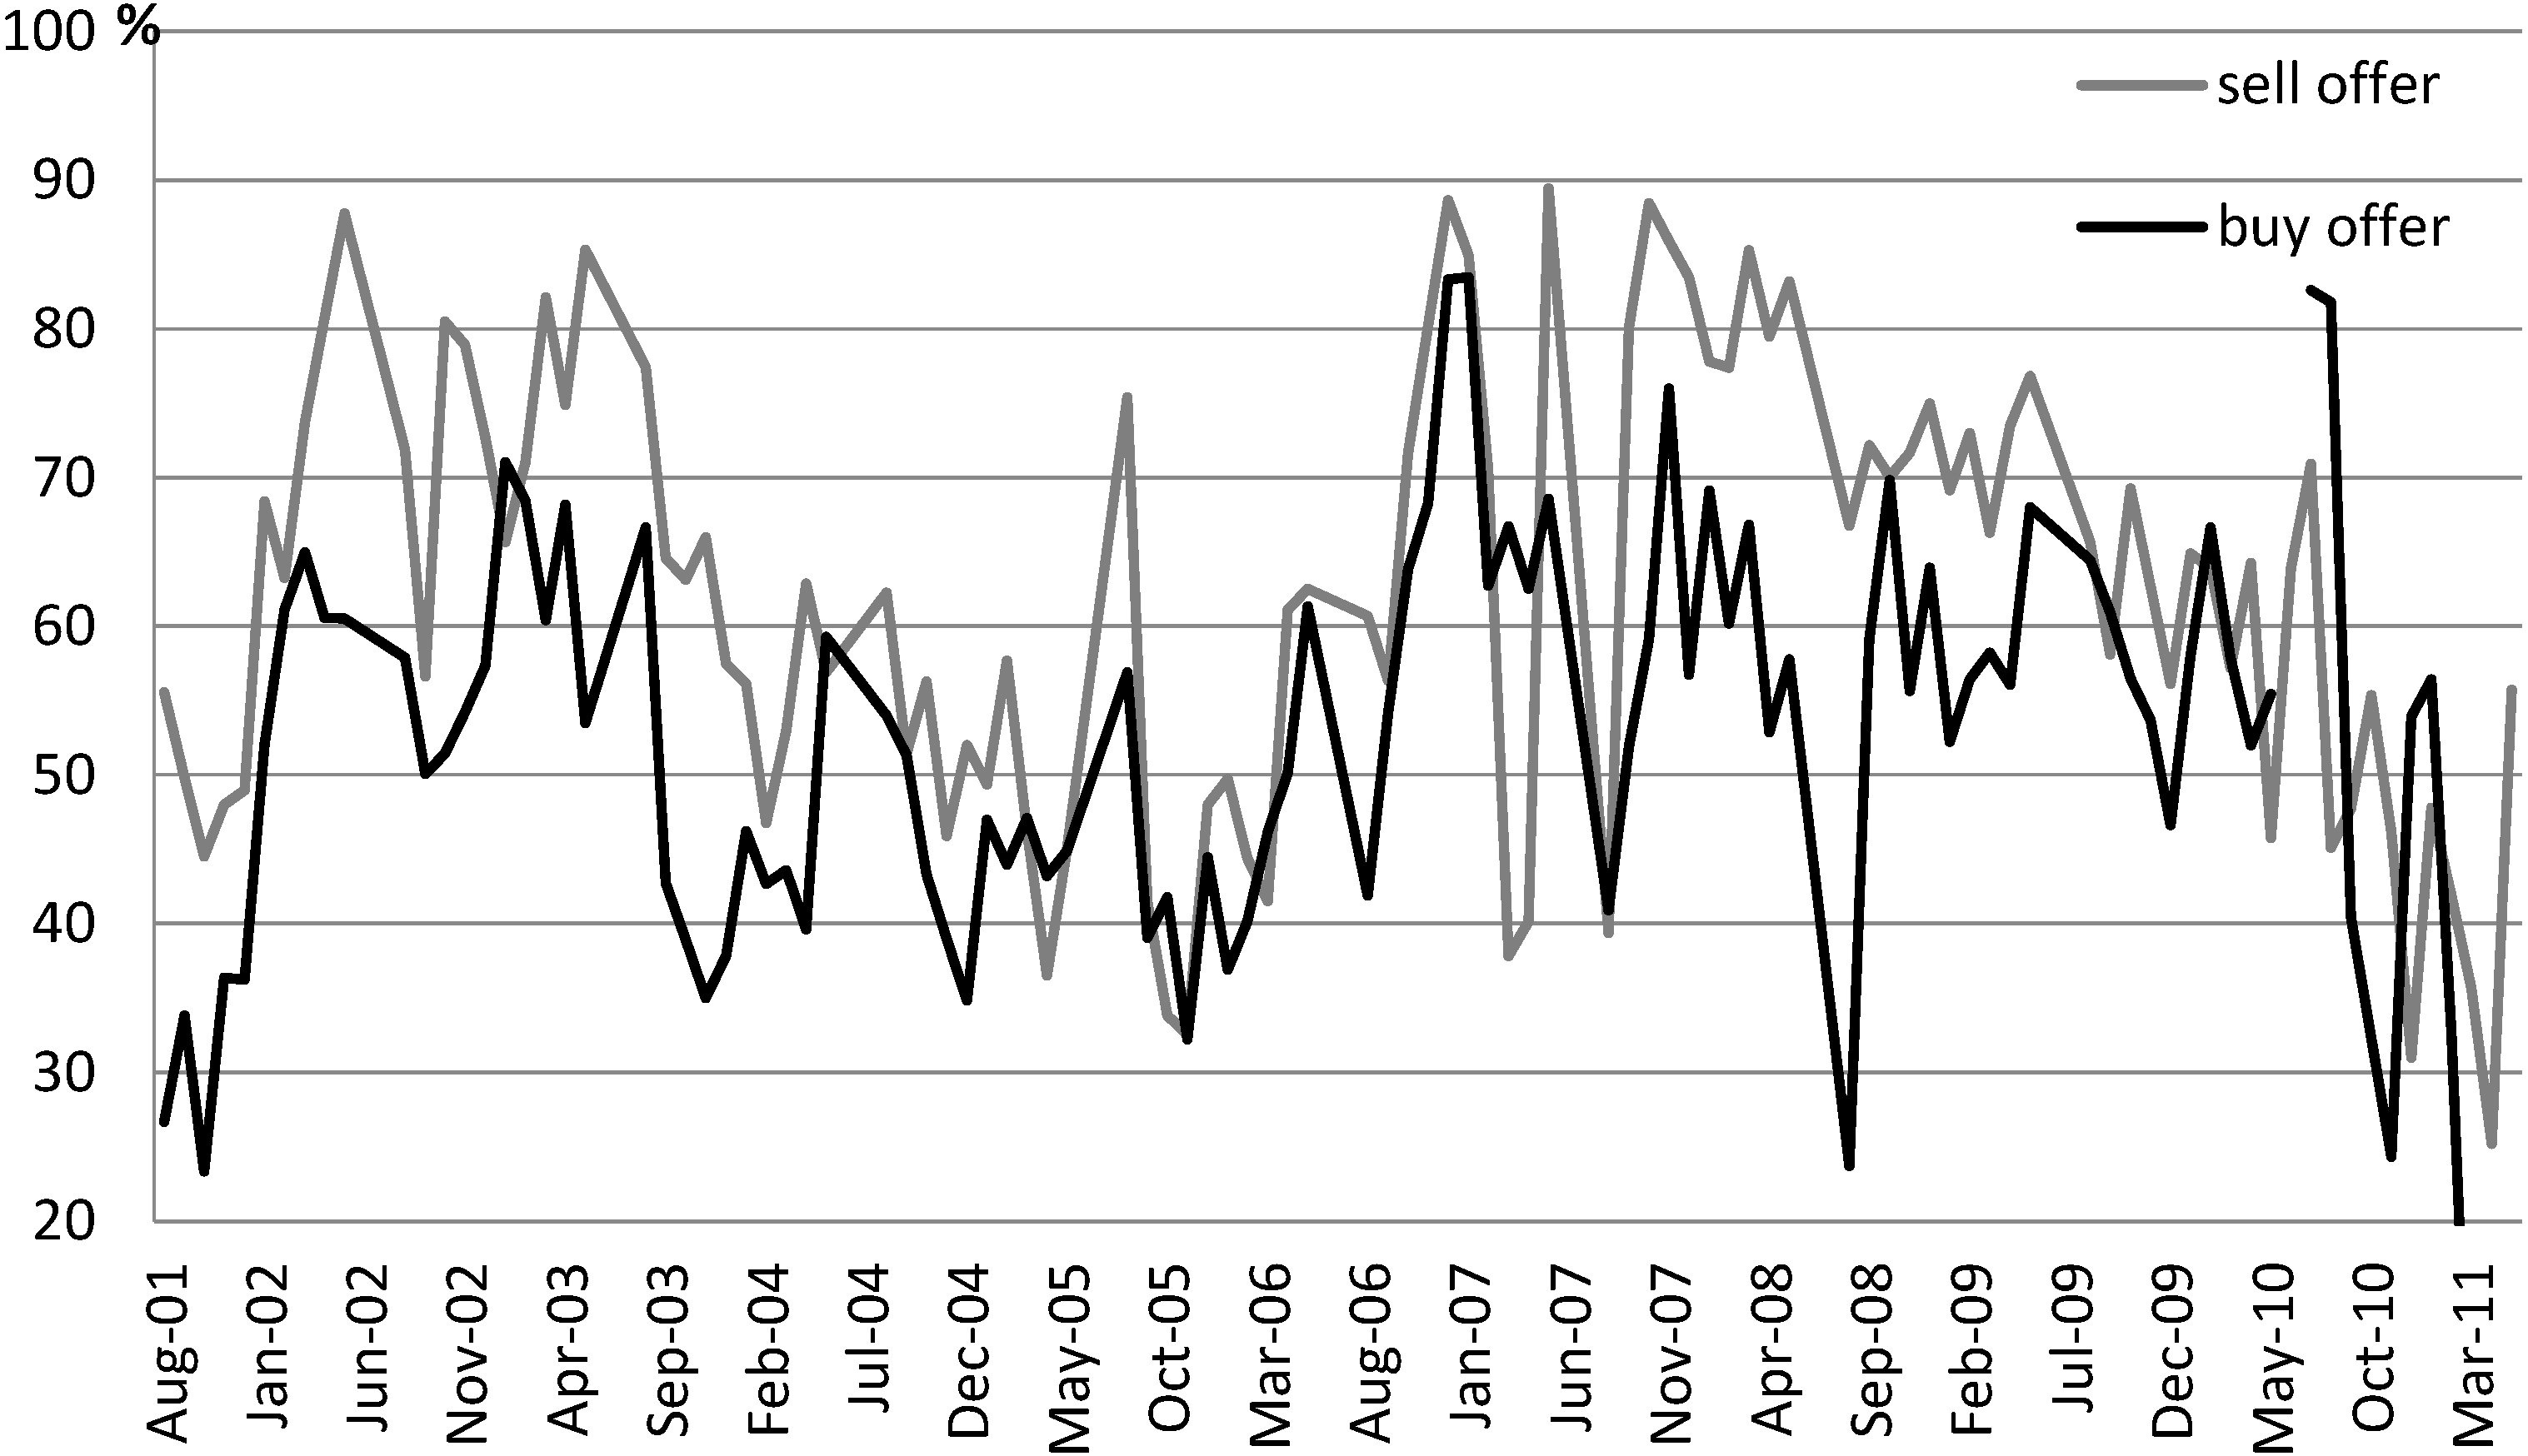
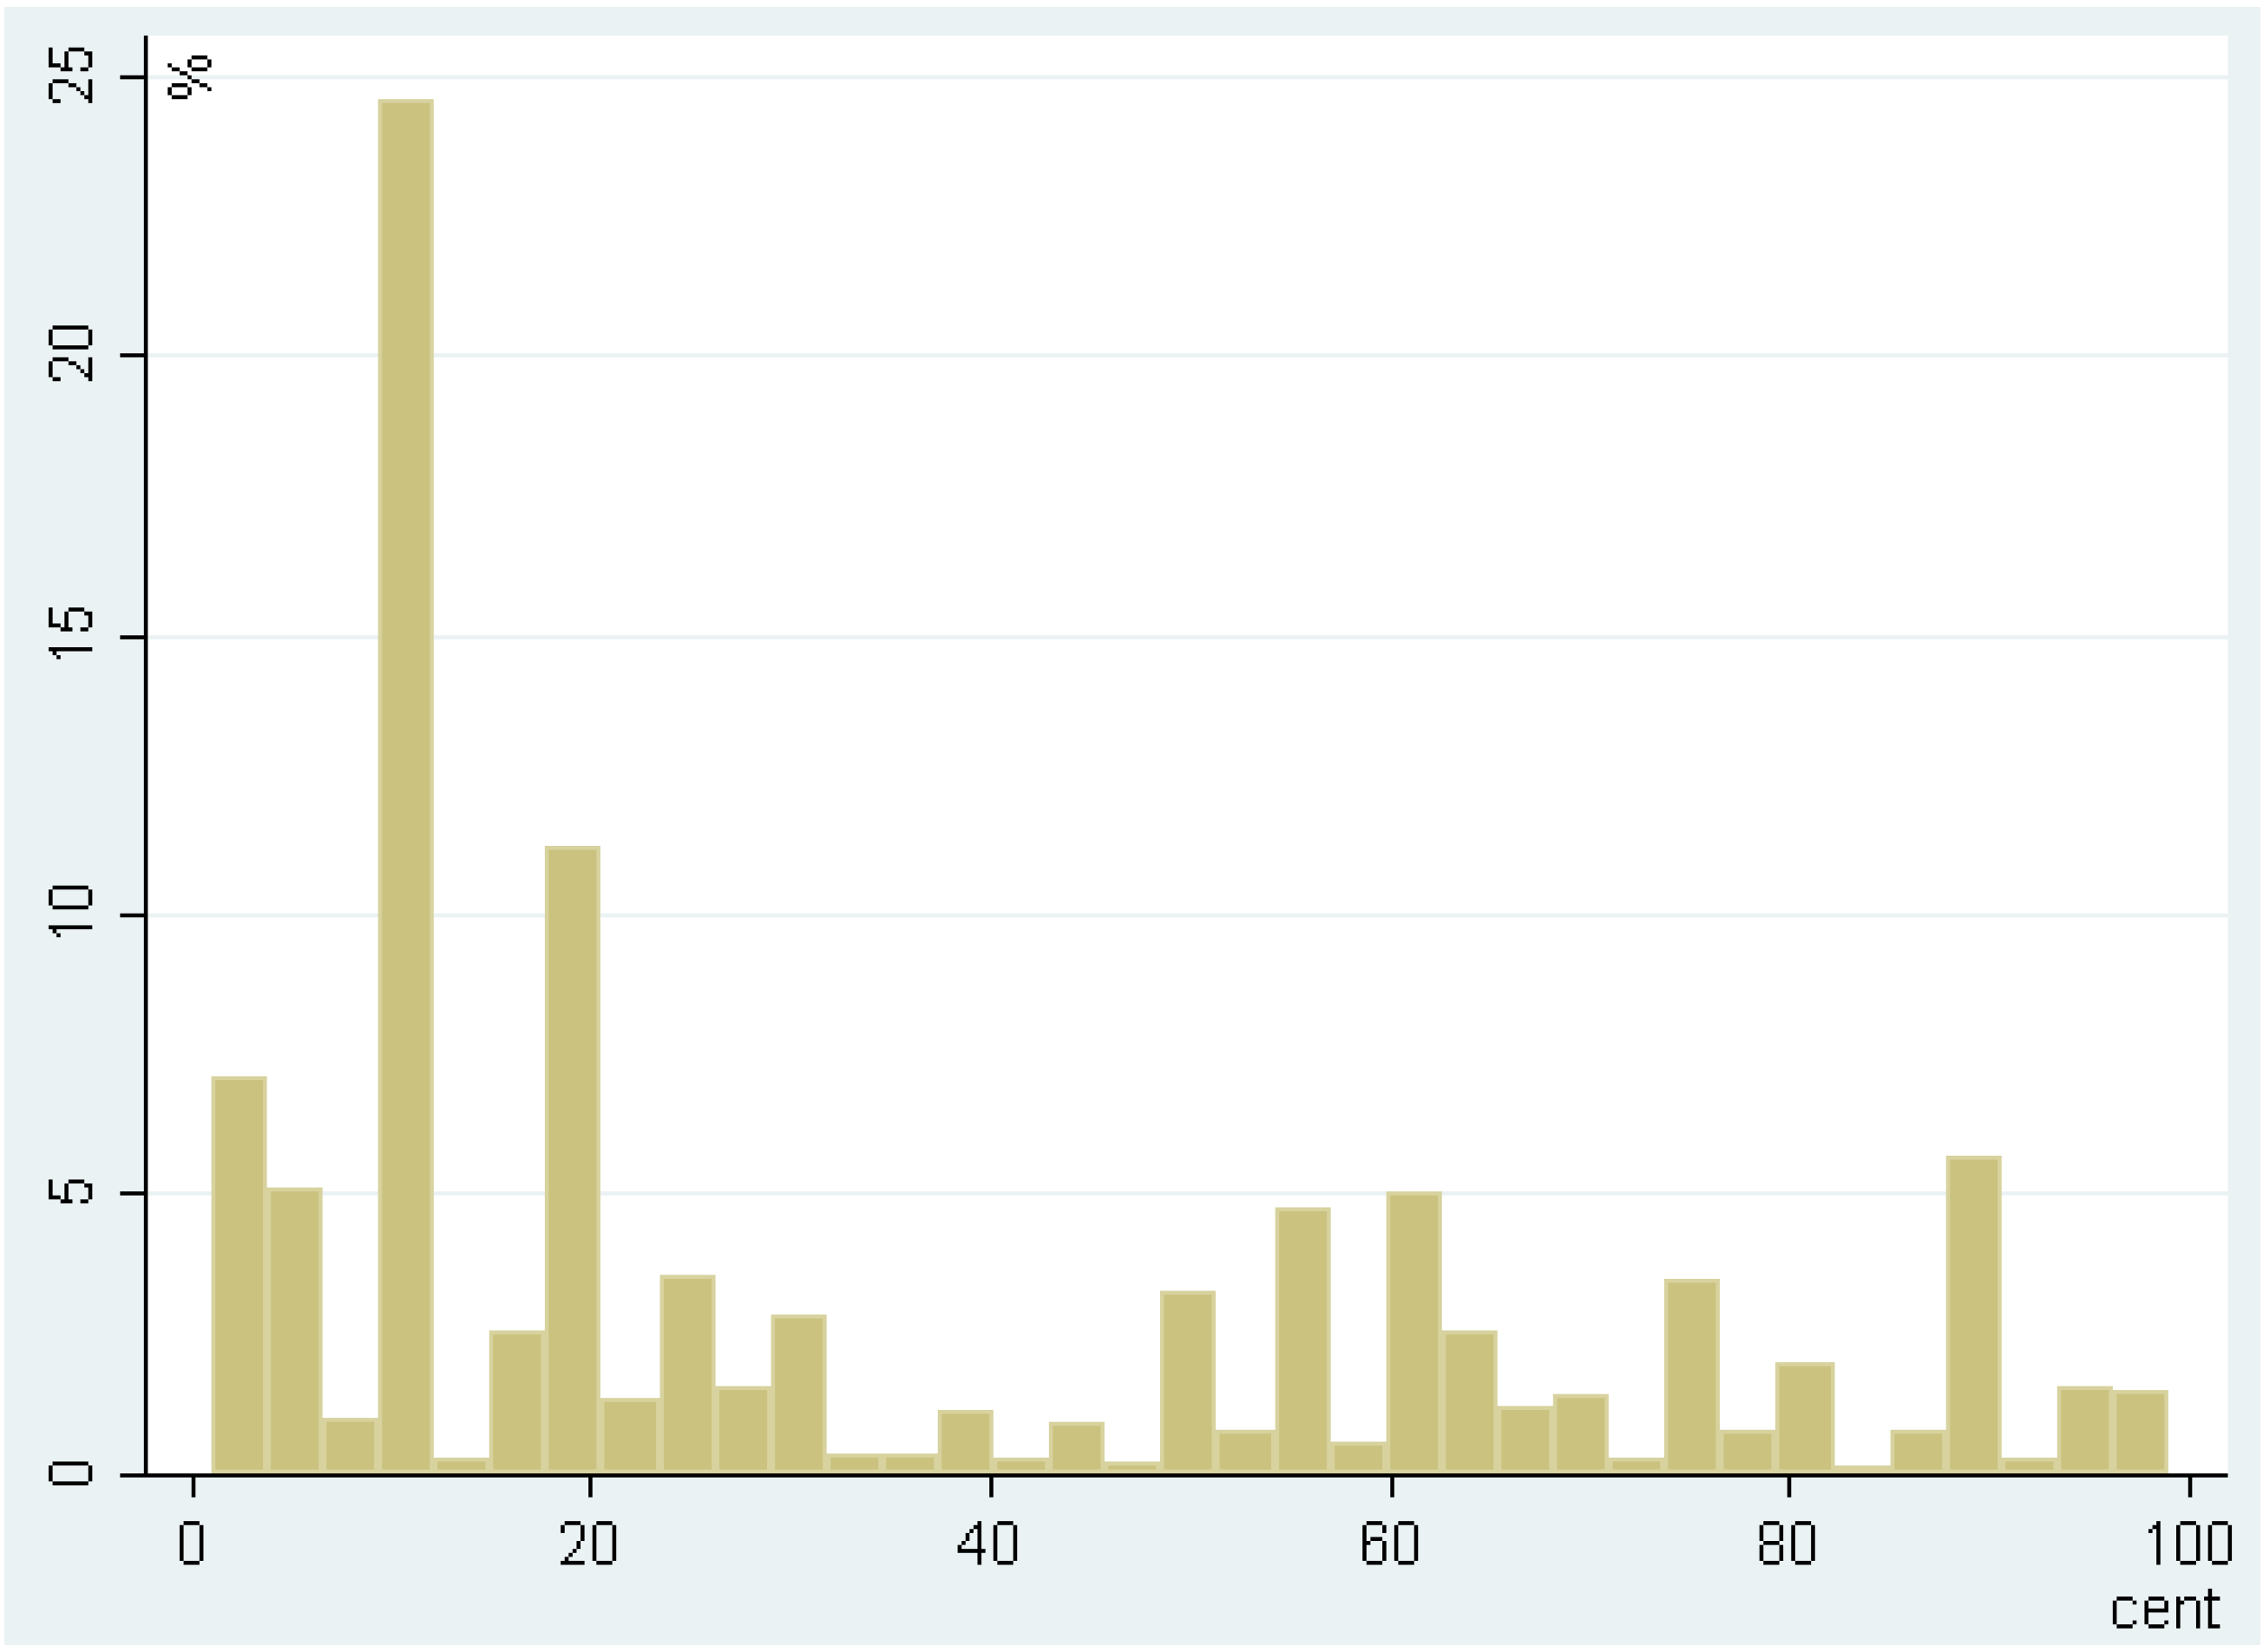
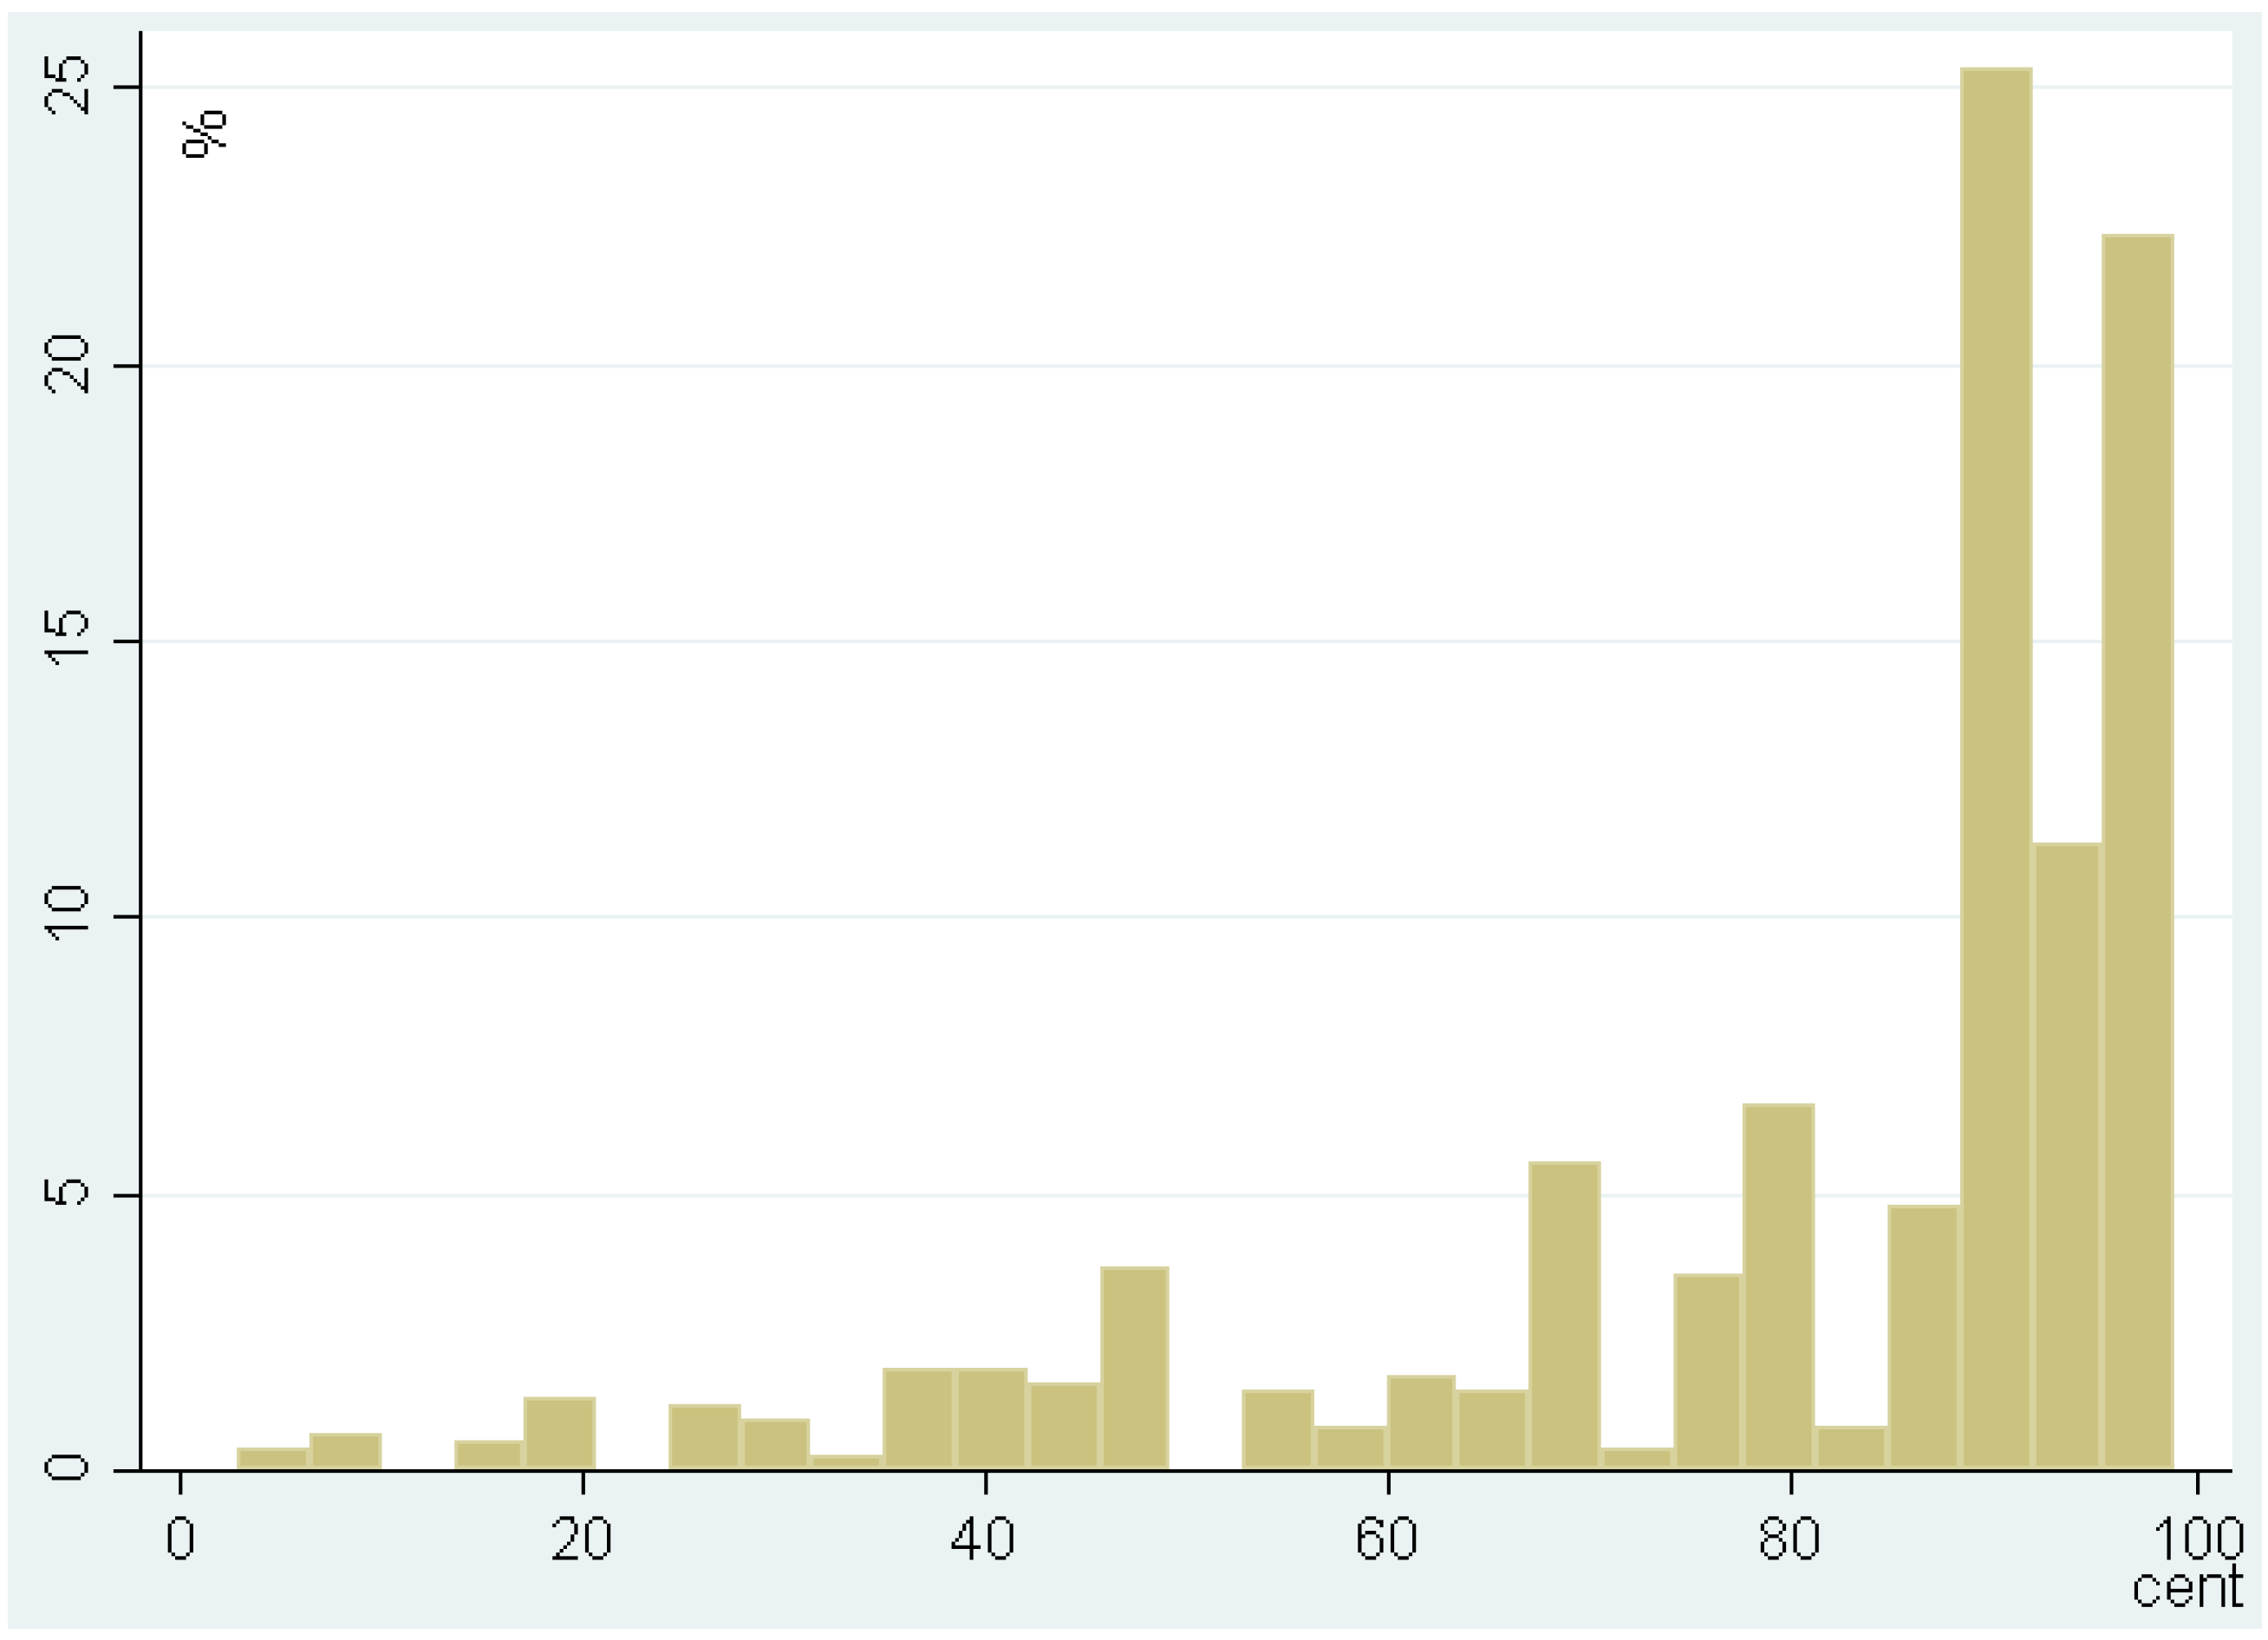
4.1. Evidence of Price Clustering
| Water Trade Type | All | Within 10% of Pool Price | Within 5% of Pool Price | |||
|---|---|---|---|---|---|---|
| Number | ML | Number | ML | Number | ML | |
| Buy bids | 79.59 | 72.74 | 78.39 | 70.77 | 78.43 | 71.11 |
| Sell offers | 96.47 | 91.69 | 95.92 | 91.08 | 95.84 | 91.20 |
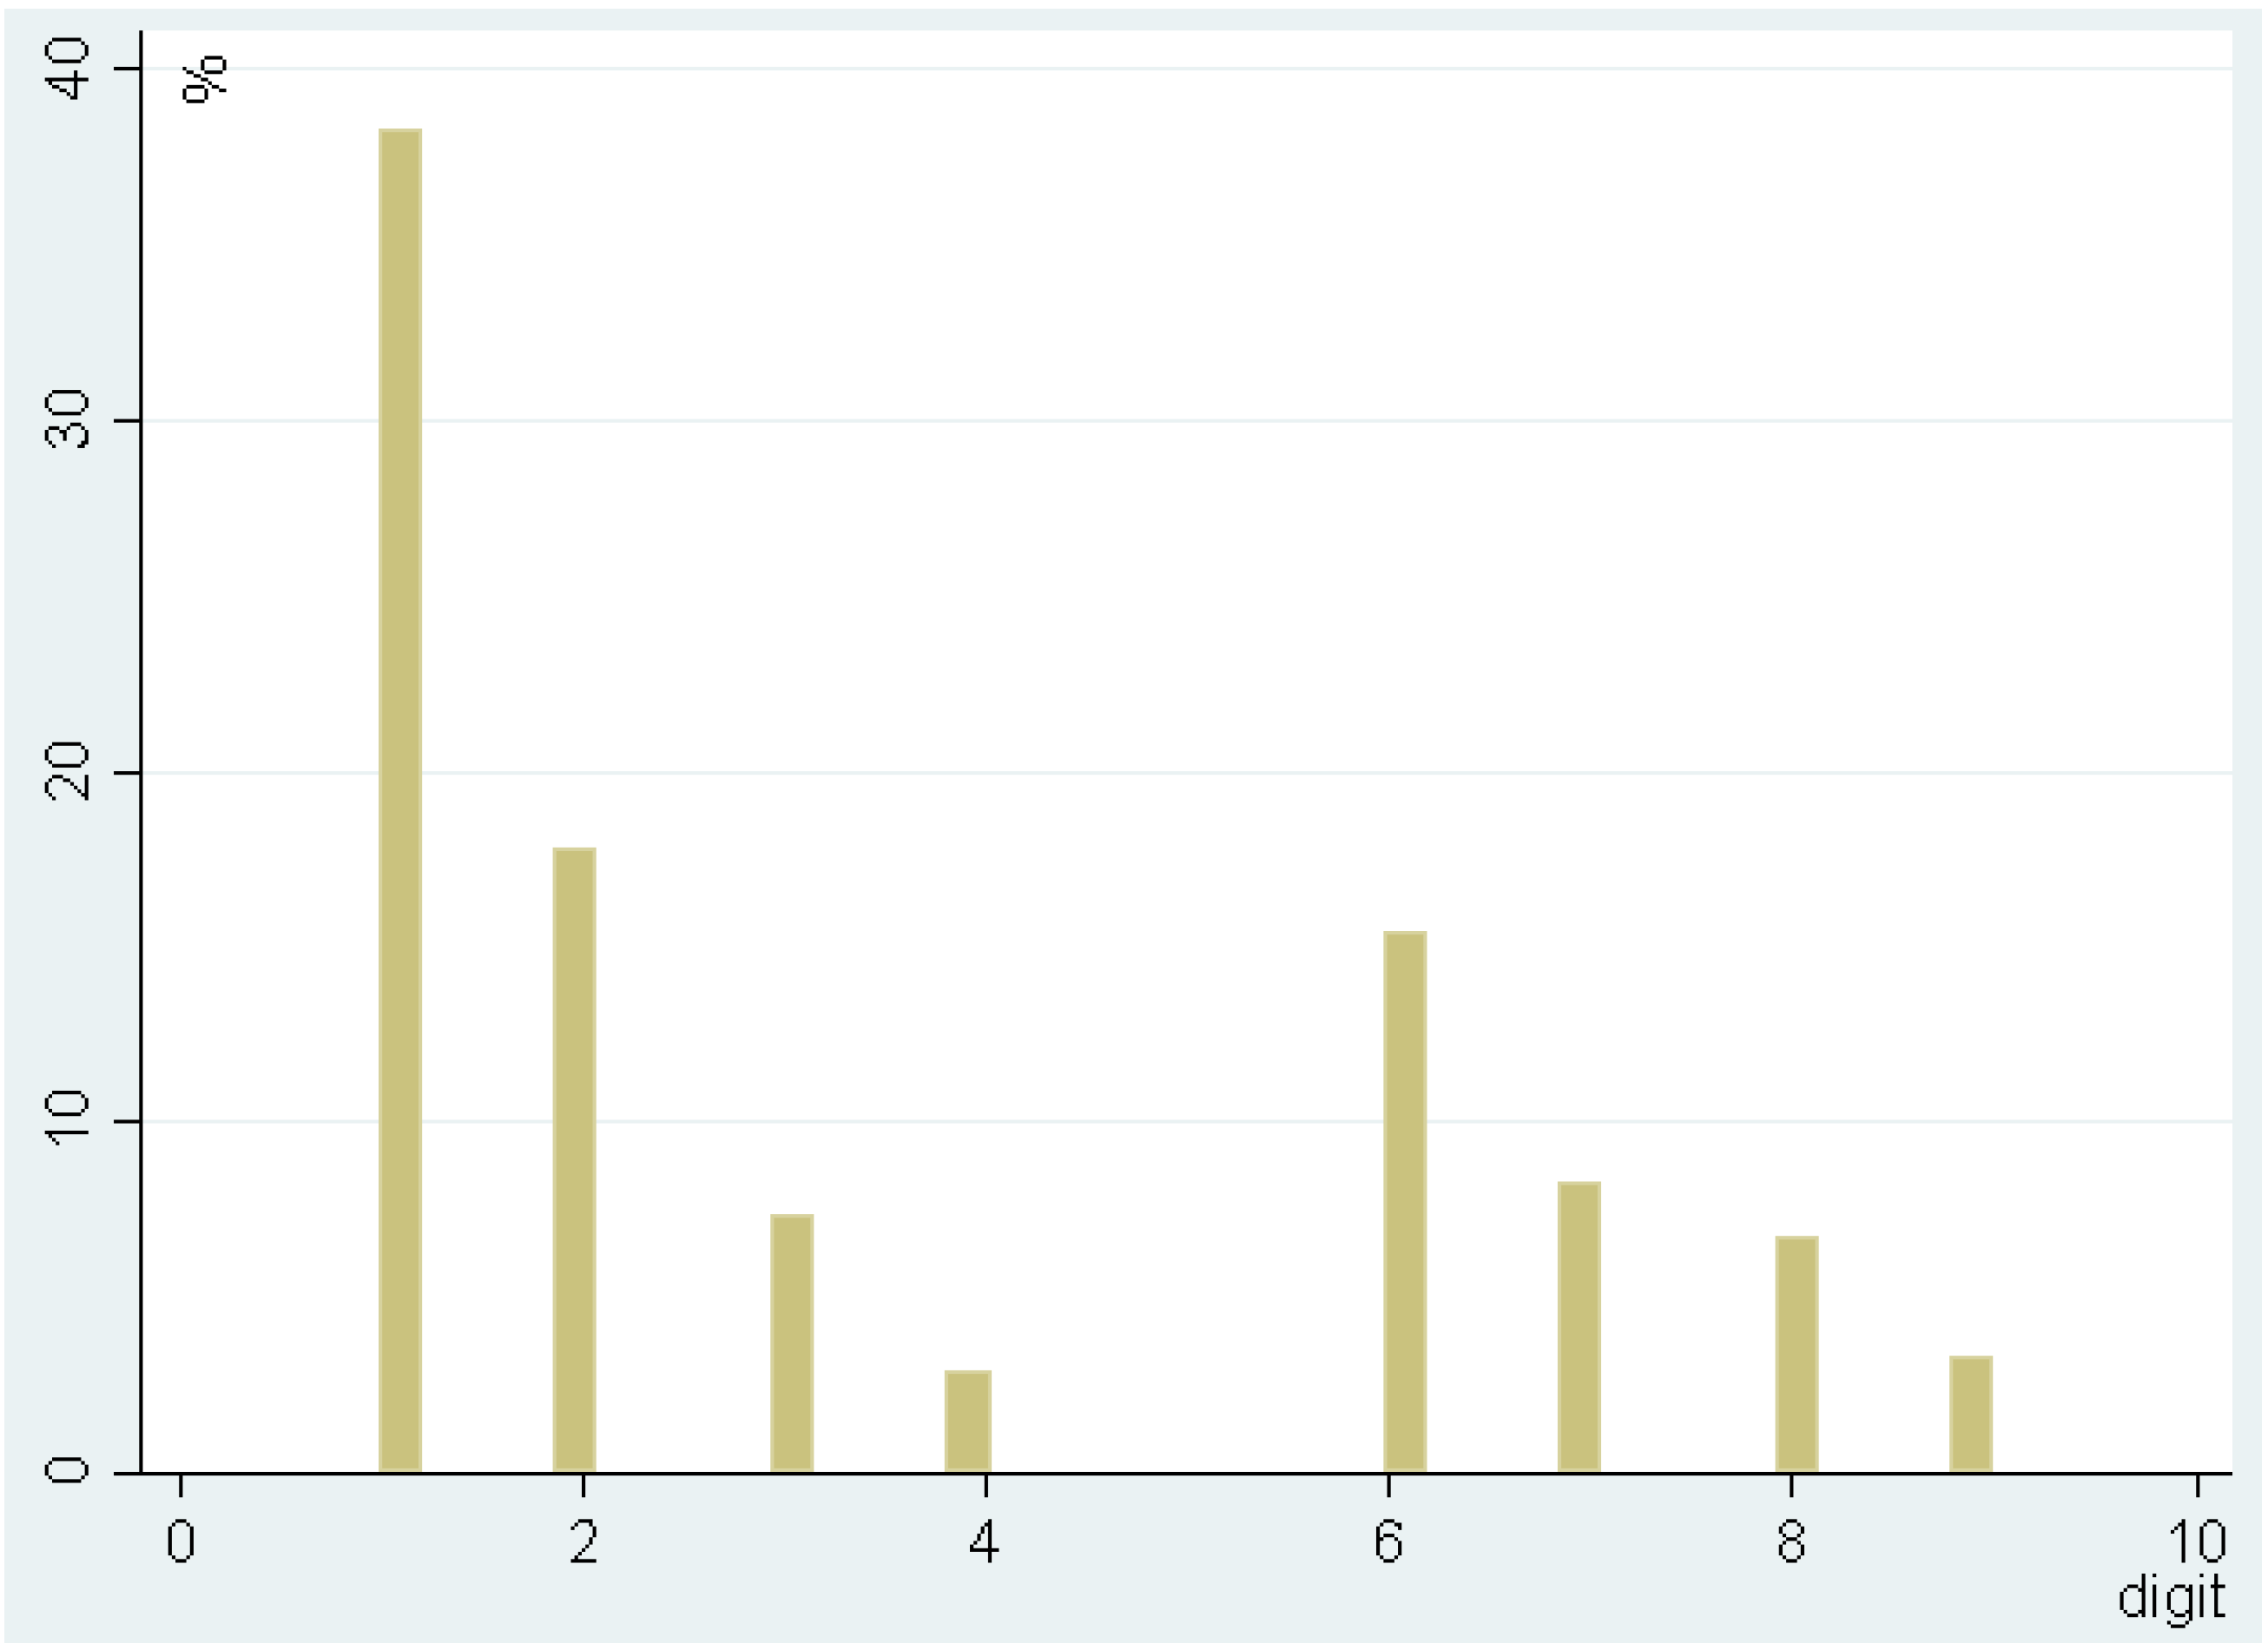
| Whole Dollar Digits | All | Within 10% of Pool Price | Within 5% of Pool Price | |||
|---|---|---|---|---|---|---|
| Number | ML | Number | ML | Number | ML | |
| Buy offers | ||||||
| 0 | 54.17 | 44.82 | 52.14 | 44.53 | 51.61 | 42.99 |
| 1 | 9.87 | 11.21 | 10.63 | 11.86 | 11.24 | 11.66 |
| 2 | 4.58 | 8.64 | 5.32 | 5.39 | 5.83 | 6.60 |
| 3 | 1.89 | 2.42 | 2.16 | 2.57 | 2.09 | 2.59 |
| 4 | 0.76 | 0.88 | 0.94 | 1.20 | 0.83 | 1.19 |
| 5 | 20.01 | 20.64 | 18.94 | 20.65 | 17.97 | 20.61 |
| 6 | 3.99 | 5.08 | 4.27 | 5.61 | 4.22 | 4.88 |
| 7 | 2.13 | 2.78 | 2.06 | 2.88 | 2.11 | 3.24 |
| 8 | 1.74 | 2.62 | 2.39 | 3.97 | 2.92 | 4.94 |
| 9 | 0.87 | 0.91 | 1.14 | 1.34 | 1.18 | 1.29 |
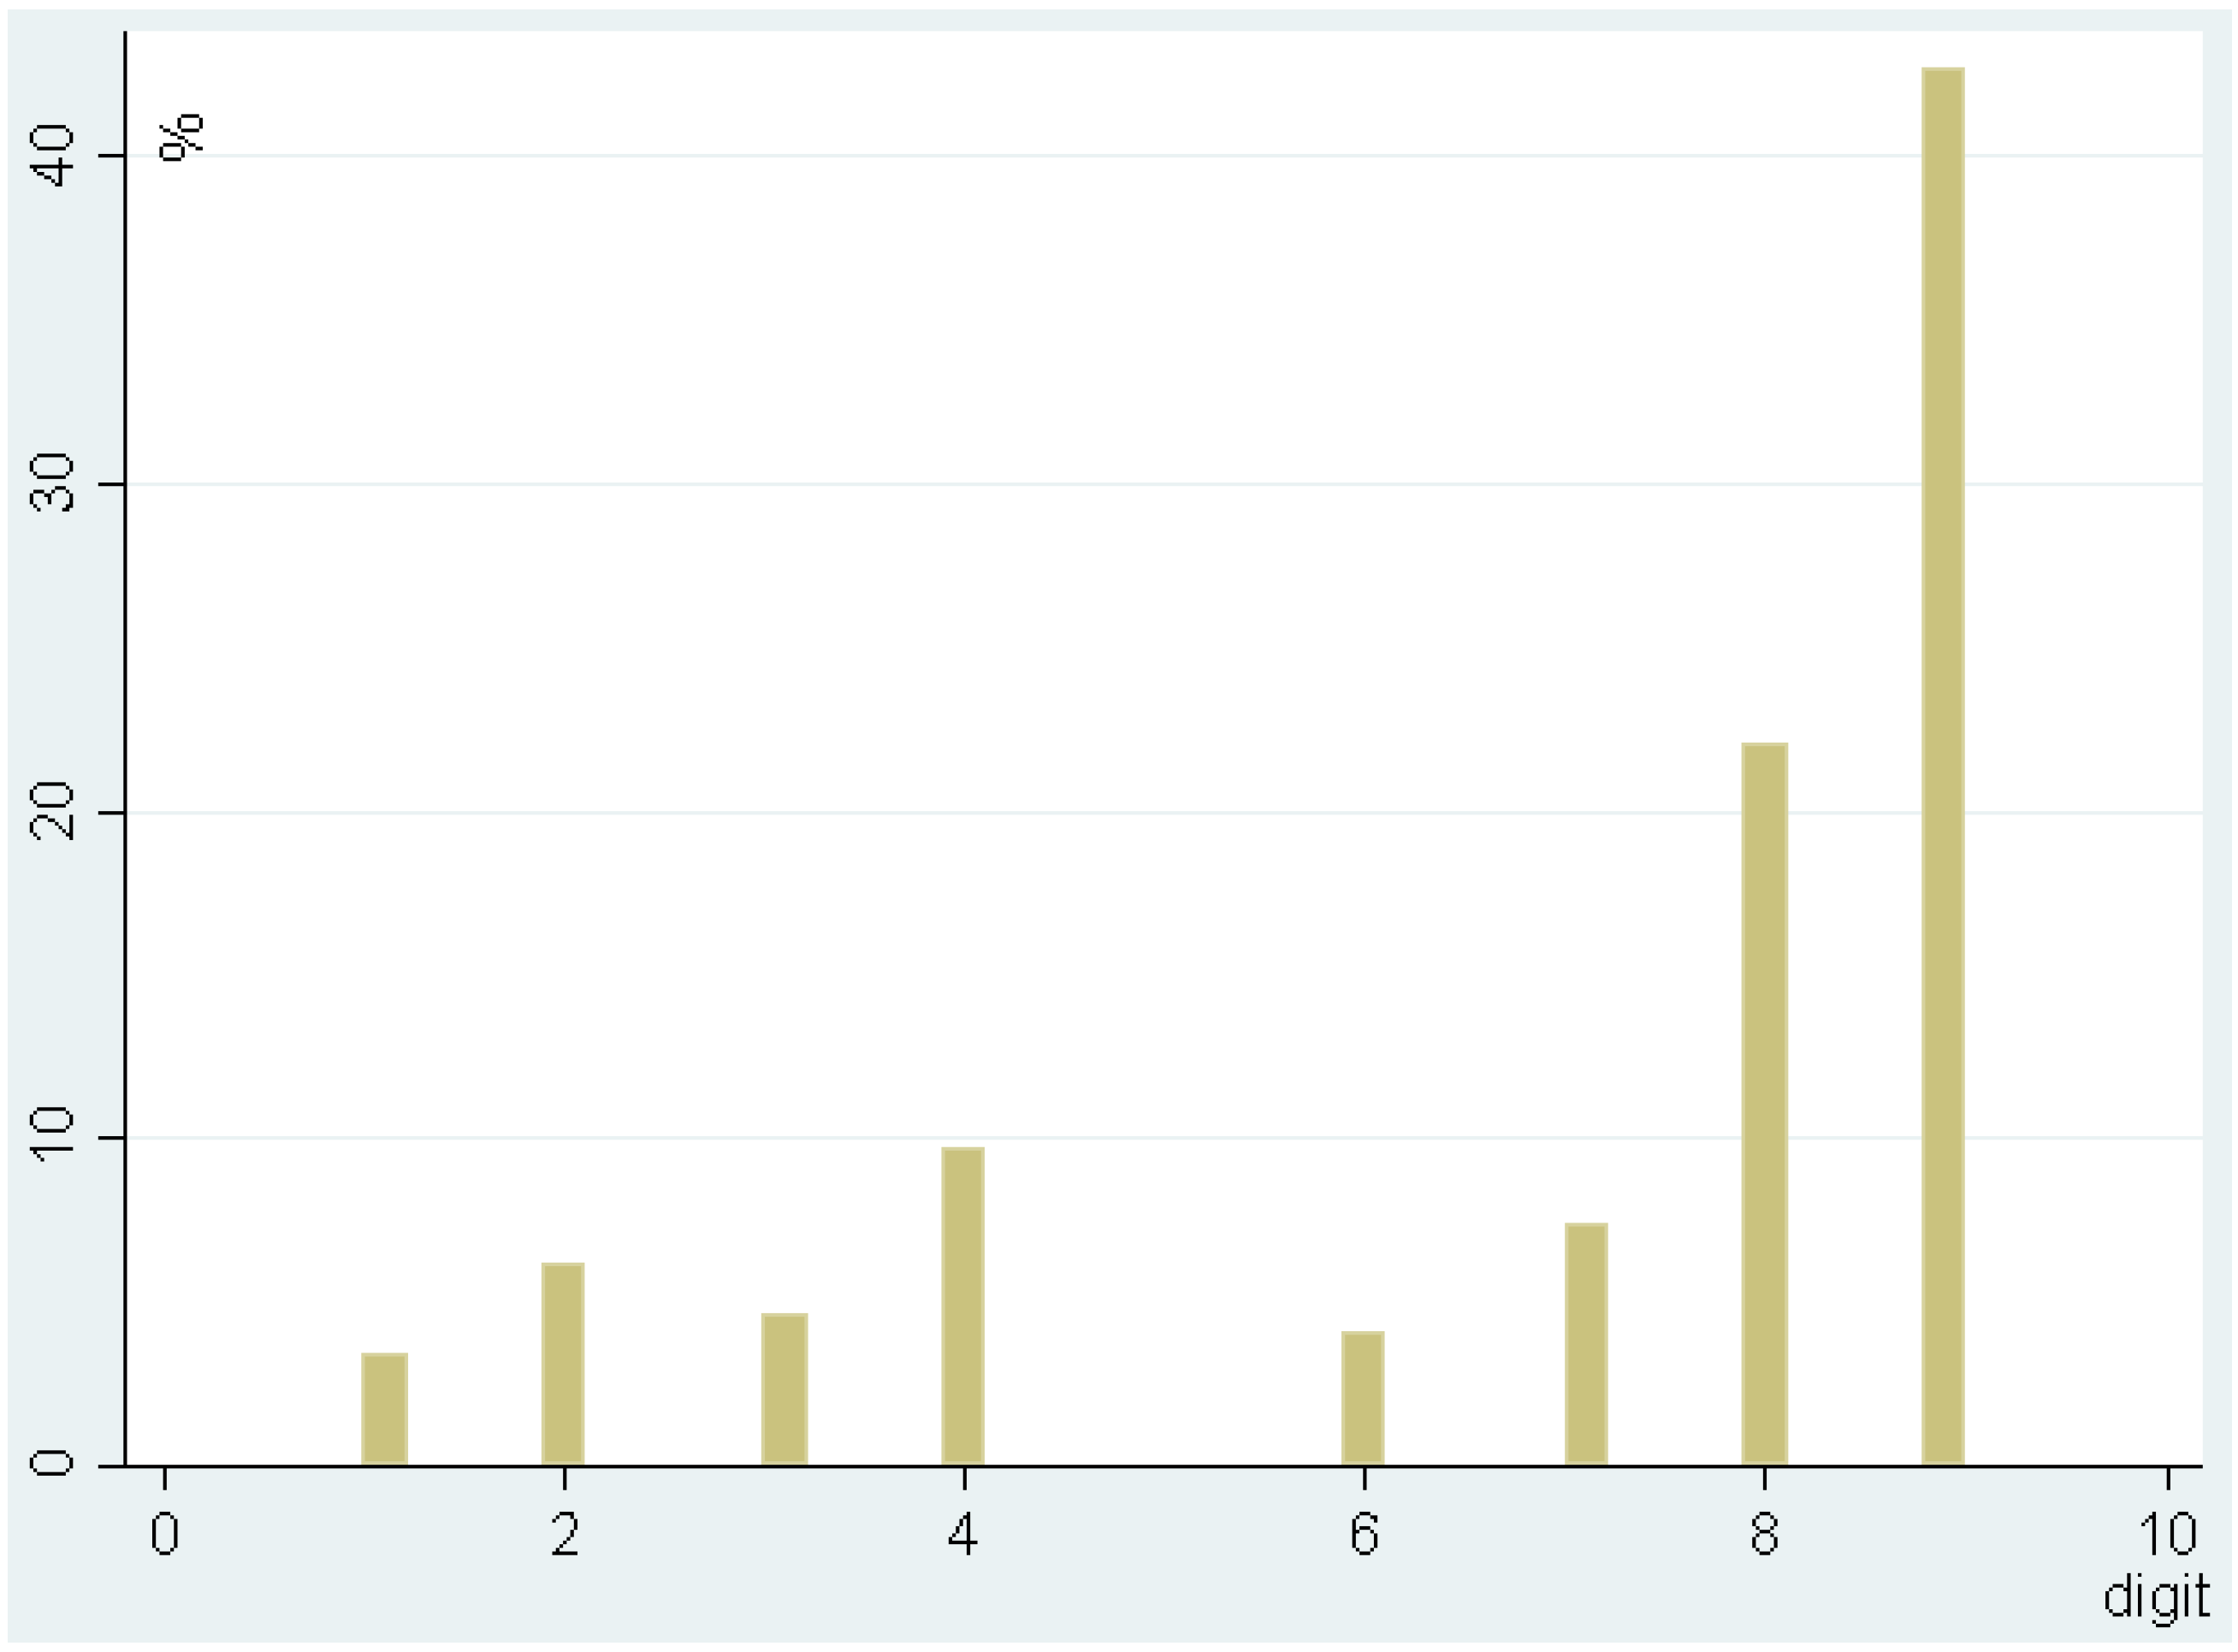
| Sell offers | ||||||
| 0 | 71.38 | 59.16 | 67.28 | 56.02 | 67.02 | 55.00 |
| 1 | 0.48 | 0.84 | 0.53 | 0.86 | 0.49 | 0.74 |
| 2 | 0.87 | 1.81 | 0.96 | 1.78 | 1.01 | 1.80 |
| 3 | 0.66 | 1.32 | 0.87 | 1.36 | 1.05 | 1.78 |
| 4 | 1.36 | 2.63 | 1.75 | 2.66 | 1.60 | 2.48 |
| 5 | 14.52 | 19.76 | 16.54 | 21.00 | 15.86 | 20.31 |
| 6 | 0.57 | 1.07 | 0.76 | 1.29 | 0.84 | 1.30 |
| 7 | 1.04 | 1.67 | 1.16 | 1.68 | 1.27 | 1.77 |
| 8 | 3.12 | 4.77 | 3.54 | 4.91 | 4.36 | 6.36 |
| 9 | 6.01 | 6.96 | 6.62 | 8.44 | 6.50 | 8.46 |


4.2. Evidence of Strategic Price Clustering Behavior


5. Methodology
Independent Variables
| Variable Name | Variable Definition |
|---|---|
| WholeBuy | Percentages of buy offers that are whole dollars in each month |
| WholeBuy_10 | Percentage of buy offers that are whole dollars out of those within the plus and minus 10% range of pool price in each month |
| WholeSell | Percentages of sell offers that are whole dollars in each month |
| WholeSell_10 | Percentage of sell offers that are whole dollars out of those within the plus and minus 10% range of pool price in each month |
| ZeroBuy | Percentage of buy offers that end in zero out of buy offers in whole dollars in each month |
| ZeroSell | Percentage of sell offers that end in zero out of sell offers in whole dollars in each month |
| Watervolume | Natural logarithm of volume traded for water allocations in Greater Goulburn in each month |
| Waterallocprice | Natural logarithm of average monthly price ($/ML) for water allocations in Greater Goulburn |
| Waterentprice | Natural logarithm of average monthly price ($/ML) for water entitlements in Greater Goulburn |
| Ln_spread | Natural logarithm of the spread between the last outstanding buyer and seller offering water allocation prices |
| Allocationlevel | Allocation level for Goulburn at the beginning of each month (%) |
| Evapminusrainfall | Monthly evaporation minus rainfall at Kerang station (mm) |
| Feedbarley | Natural logarithm of export price for feed barley ($/ton) |
| Wholemilkprice | Natural logarithm of export price for whole milk powder ($/kg) |
| Cattleprice | Natural logarithm of export price for cattle ($cent/kg) |
| Carryover % | Percentage of water entitlement allowed for carryover (note for 2010/11 season all the allocation in linked Allocation Bank Account on 30 June 2011 is eligible for carryover—there is no maximum) |
| Govpolicy | 1 for the months when major water market policies were introduced/ongoing in the GMID (namely the lifting of the Cap, introduction of unbundling and the times when the Government is conducting a tender in buying back water). For Cap and unbundling introduction, the dummy is coded for the first three months after policy introduction |
| Govpolicy10/11 | Interaction variable between Govpolicy variable and season 2010/11 |
| Monthindex | Monthly index from 1 to 10 for August to May, respectively |
| Monthindexsqrd | Monthly index squared |
6. Results and Discussion
| Variable | WholeBuy | WholeBuy_10 | ZeroBuy | WholeSell | WholeSell_10 | ZeroSell |
|---|---|---|---|---|---|---|
| Watervolume | −0.003 | −0.034 | −0.035 *** | 0.016 *** | 0.026 | −0.032 * |
| Waterallocprice | 0.016 | 0.033 | - | −0.005 | - | 0.045 |
| Waterentprice | 0.067 | 0.079 | - | −0.165 *** | - | - |
| Ln_spread | −0.015 | −0.096 *** | 0.050 *** | 0.046 *** | - | 0.063 *** |
| Allocationlevel | 0.001 | 0.002 | - | −0.0002 | - | - |
| Evapminusrainfall | 0.001 *** | 0.001 *** | 0.0003 | 0.00004 | −0.0001 | 0.00002 |
| Feedbarley | 0.240 *** | 0.377 *** | 0.090 | −0.010 | 0.052 | −0.020 |
| Wholemilkprice | −0.122 | −0.225 * | −0.130 ** | 0.094 *** | 0.026 | 0.179 ** |
| Cattleprice | −0.059 | 0.011 | −0.039 | −0.363 *** | −0.478 *** | −0.389 * |
| Monthindex | −0.055 ** | −0.128 *** | 0.016 *** | 0.009 *** | - | 0.015 *** |
| Monthindexsqrd | 0.005 ** | 0.011 *** | - | - | - | - |
| Carryover | −0.001 | 0.000 | 0.0002 | −0.0003 | −0.001 | −0.001 ** |
| Govpolicy | 0.076 * | 0.135 ** | 0.008 | −0.028 | −0.070 ** | −0.090 |
| Govpolicy10/11 | −0.255 *** | −0.248 *** | −0.277 *** | −0.029 | - | 0.075 |
| Observations | 100 | 94 | 100 | 100 | 90 | 100 |
| Log likelihood | −35.80 | −32.66 | −44.52 | −19.34 | −18.89 | −42.65 |
| BIC | −386.85 | −356.94 | −405.79 | −393.45 | −360.68 | −401.31 |
6.1. Buy Offer Price Clustering
6.2. Sell Offers Price Clustering
7. Conclusions
Acknowledgments
Author Contributions
Conflicts of Interest
References
- Bjornlund, H.; McKay, J. Aspects of water markets for developing countries—Experiences from Australia, Chile and the US. Environ. Dev. Econ. 2002, 7, 767–793. [Google Scholar] [CrossRef]
- Grafton, R.Q.; Libecap, G.; McGlennon, S.; Landry, C.; O’Brien, B. An integrated assessment of water markets: A cross-country comparison. Rev. Environ. Econ. Policy 2011, 5, 219–239. [Google Scholar] [CrossRef]
- Wheeler, S.; Garrick, D.; Loch, A.; Bjornlund, H. Evaluating water market products to acquire water for the environment in Australia. Land Use Policy 2013, 30, 427–436. [Google Scholar] [CrossRef]
- Nicol, L.; Klein, K.; Bjornlund, H. Permanent transfers of water rights: A study of the southern Alberta market. Prairie Forum 2008, 33, 341–356. [Google Scholar]
- Giannoccaro, G.; Pedraza, V.; Berbel, J. Analysis of stakeholders’ attitudes towards water markets in Southern Spain. Water 2013, 5, 1517–1532. [Google Scholar] [CrossRef]
- Adamson, D.; Mallawaarachchi, T.; Quiggin, J. Declining inflows and more frequent droughts in the Murray-Darling Basin: Climate change, impacts and adaptation. Aust. J. Agric. Resour. Econ. 2009, 53, 345–366. [Google Scholar] [CrossRef]
- Wheeler, S.; Loch, A.; Zuo, A.; Bjornlund, H. Reviewing the adoption and impact of water markets in the Murray-Darling Basin, Australia. J. Hydrol. 2014, 518, 28–41. [Google Scholar] [CrossRef]
- Crase, L.; Pagan, P.; Dollery, B. Water markets as a vehicle for reforming water resource allocation in the Murray-Darling Basin. Water Resour. Res. 2004, 40, 1–10. [Google Scholar] [CrossRef]
- National Water Commission. Impacts of Water Trading in the Southern Murray—Darling Basin Between 2006–07 and 2010–11; Commonwealth of Australia: Canberra, Australia, 2012. [Google Scholar]
- Murray-Darling Basin Authority (MDBA). Proposed Basin Plan; MDBA: Canberra, Australia, 2011. [Google Scholar]
- Market Mechanisms for Recovering Water in the Murray-Darling Basin; Final Report for Productivity Commission: Canberra, Australia, 2010.
- Loch, A.; Bjornlund, H.; Wheeler, S.; Connor, J. Trading in allocation water in Australia: A qualitative understanding of irrigator motives and behavior. Aust. J. Agric. Resour. Econ. 2012, 56, 42–60. [Google Scholar] [CrossRef]
- Heaney, A.; Dwyer, G.; Beare, S.; Peterson, D.; Pechey, L. Third-party effects of water trading and potential policy responses. Aust. J. Agric. Resour. Econ. 2006, 50, 277–293. [Google Scholar] [CrossRef]
- Chung, H.; Chiang, S. Price clustering in E-mini and floor-traded index futures. J. Futur. Mark. 2006, 26, 269–295. [Google Scholar] [CrossRef]
- Ball, R. The global financial crisis and the efficient markets hypothesis: What have we learned? J. Appl. Corp. Financ. 2009, 21, 8–16. [Google Scholar] [CrossRef]
- Brown, S. The efficient markets hypothesis: The demise of the demon of chance? Account. Financ. 2011, 51, 79–95. [Google Scholar]
- Brooks, R.; Harris, E.; Joymungul, Y. Price clustering in Australian water markets. Appl. Econ. 2013, 45, 677–685. [Google Scholar] [CrossRef]
- Bjornlund, H.; Wheeler, S.; Rossini, P. Water Markets and Their Environmental, Social and Economic Impact in Australia. In Water Trading and Global Water Scarcity: International Perspectives; Maestu, J., Ed.; Francis Taylor: Gloucester, UK, 2013; pp. 68–93. [Google Scholar]
- Wheeler, S.; Bjornlund, H.; Shanahan, M.; Zuo, A. Price elasticity of allocations water demand in the Goulburn-Murray irrigation district of Victoria, Australia. Aust. J. Agric. Resour. Econ. 2008, 52, 37–55. [Google Scholar] [CrossRef]
- Harris, L. Stock price clustering and discreteness. Rev. Financ. Stud. 1991, 4, 389–415. [Google Scholar] [CrossRef]
- Grossman, S.; Miller, M.; Cone, K.; Fischel, D.; Ross, D. Clustering and competition in asset markets. J. Law Econ. 1997, 40, 23–60. [Google Scholar] [CrossRef]
- Ball, C.; Torous, W.; Tschoegl, A. The degree of price resolution: The case of the gold market. J. Futur. Mark. 1985, 5, 29–43. [Google Scholar] [CrossRef]
- Loomes, G. Different experimental procedures for obtaining valuations of risky actions: Implications for utility theory. Theory Decis. 1988, 25, 1–23. [Google Scholar] [CrossRef]
- Butler, D.; Loomes, G. Decision difficulty and imprecise preferences. Acta Psycholog. 1988, 68, 183–196. [Google Scholar] [CrossRef]
- Capelle-Blanchard, G.; Chaudhury, M. Price clustering in the CAC 40 index options market. Appl. Financ. Econ. 2007, 17, 1201–1210. [Google Scholar] [CrossRef]
- Mallawaarachchi, T.; McClintock, A.; Adamson, D.; Quiggin, J. Investment as an Adaptation Response to Water Scarcity. In Water Policy Reform: Lessons in Sustainability from the Murray-Darling Basin; Quiggin, J., Mallawaarachchi, T., Chambers, S., Eds.; Edward Elgar: Cheltenham, UK, 2012; pp. 101–126. [Google Scholar]
- Brennan, D. Water policy reform in Australia: Lessons from the Victorian seasonal water market. Aust. J. Agric. Resour. Econ. 2006, 50, 403–423. [Google Scholar] [CrossRef]
- Ikenberry, D.L.; Weston, J.P. Clustering in US stock prices after decimalisation. Eur. Financ. Manag. 2008, 14, 30–54. [Google Scholar]
- Tversky, A.; Kahneman, D. Judgement under uncertainty: Heuristics and biases. Science 1974, 185, 1124–1131. [Google Scholar] [CrossRef] [PubMed]
- Mitchell, J. Clustering and psychological barriers: The importance of numbers. J. Futur. Mark. 2001, 21, 395–428. [Google Scholar] [CrossRef]
- Jennings, R. Getting “pennied”: The effect of decimalization on traders’ willingness to lean on the limit order book at the New York Stock Exchange. NNYSE Doc. 2001, 1, 1–24. [Google Scholar]
- Edwards, A.; Harris, J. Stepping Ahead of the Book; Securities and Exchange Commission: Washington, DC, USA, 2002. [Google Scholar]
- Niederhoffer, V. Clustering of stock prices. Oper. Res. 1965, 13, 258–265. [Google Scholar] [CrossRef]
- Aşçıoğlu, A.; Comerton-Forde, C.; McInish, T.H. Price clustering on the Tokyo Stock Exchange. Financ. Rev. 2007, 42, 289–301. [Google Scholar] [CrossRef]
- Papke, L.E.; Wooldridge, J.M. Econometric methods for fractional response variables with an application to 401(K) plan participation rates. J. Appl. Econ. 1996, 11, 619–632. [Google Scholar] [CrossRef]
- Palacios-Huerta, I. The aversion to sequential resolution of uncertainty. J. Risk Uncertain. 1999, 18, 249–269. [Google Scholar] [CrossRef]
© 2014 by the authors; licensee MDPI, Basel, Switzerland. This article is an open access article distributed under the terms and conditions of the Creative Commons Attribution license (http://creativecommons.org/licenses/by/4.0/).
Share and Cite
Zuo, A.; Brooks, R.; Wheeler, S.A.; Harris, E.; Bjornlund, H. Understanding Irrigator Bidding Behavior in Australian Water Markets in Response to Uncertainty. Water 2014, 6, 3457-3477. https://doi.org/10.3390/w6113457
Zuo A, Brooks R, Wheeler SA, Harris E, Bjornlund H. Understanding Irrigator Bidding Behavior in Australian Water Markets in Response to Uncertainty. Water. 2014; 6(11):3457-3477. https://doi.org/10.3390/w6113457
Chicago/Turabian StyleZuo, Alec, Robert Brooks, Sarah Ann Wheeler, Edwyna Harris, and Henning Bjornlund. 2014. "Understanding Irrigator Bidding Behavior in Australian Water Markets in Response to Uncertainty" Water 6, no. 11: 3457-3477. https://doi.org/10.3390/w6113457