Review

Removal of Pathogens by Membrane Bioreactors: A Review of the Mechanisms, Influencing Factors and Reduction in Chemical Disinfectant Dosing

1
Strategic Water Infrastructure Laboratory, School of Civil, Mining and Environmental Engineering, University of Wollongong, Wollongong, NSW 2522, Australia
2
Illawarra Health and Medical Research Institute, University of Wollongong, Wollongong, NSW 2522, Australia
3
Department of Civil Engineering, King Abdul Aziz University, Jeddah 21589, Saudi Arabia
4
Environmental Science Center, The University of Tokyo, Tokyo 113-0033, Japan
*
Author to whom correspondence should be addressed.
Water 2014, 6(12), 3603-3630; https://doi.org/10.3390/w6123603
Submission received: 16 October 2014 / Revised: 16 November 2014 / Accepted: 17 November 2014 / Published: 26 November 2014
(This article belongs to the Special Issue Wastewater Treatment and Reuse)

Abstract

:
The continued depletion of fresh drinking water resources throughout the world has increased the need for a variety of water treatment and recycling strategies. Conventional wastewater treatment processes rely on extensive chemical post-disinfection to comply with the stringent microbiological safety for water reuse. When well designed and operated, membrane bioreactors (MBRs) can consistently achieve efficient removals of suspended solids, protozoa and coliform bacteria. Under optimal conditions, MBR systems can also significantly remove various viruses and phages. This paper provides an in-depth overview of the mechanisms and influencing factors of pathogen removal by MBR and highlights practical issues, such as reduced chemical disinfectant dosing requirements and associated economic and environmental benefits. Special attention has been paid to the aspects, such as membrane cleaning, membrane imperfections/breach and microbial regrowth, in the distribution system on the overall pathogen removal performance of MBR.

1. Introduction

The importance of preventing fecal contamination of drinking water was first recognised by the work of English epidemiologist, John Snow. Snow systematically demonstrated that consuming fecal contaminated water caused the cholera outbreak in London [1] and linked these outbreaks to the inefficient sewage disposal system. His book “On the Mode of Communication of Cholera”, originally published in 1855, was republished in 1930s as a classic work in epidemiology, resulting in lasting recognition of his work. Since that discovery, the process by which wastewater is treated has been advancing, and has come a long way from the 19th century principle of “dilution is the solution to pollution” [2]. Patented in 1913, the suspended growth conventional activated sludge (CAS) process is a long-standing wastewater treatment process that relies on microorganisms in aerated mixed-liquor to break down organic pollutants [2]. CAS processes rely on tertiary disinfection processes to reduce pathogens in treated effluent in order to prevent the spread of waterborne diseases.
The supply of safe drinking water is vital to survival, and as the world’s population continues to grow, fresh water is likely to become a scarce resource within the 21st century [3]. Therefore, establishing suitable methods of treating wastewater and preventing pathogens from entering the drinking water system will be a key component of maximizing water usage in the future. Coupled with this need to ensure the safety of the effluent emitted by wastewater treatment plants will be the growing pressure to directly use treated grey and black water in non-potable applications or conduct indirect potable reuse, such as deposition of reclaimed water into dams and subsequent treatment for producing drinking water. In fact it has been argued that direct potable reuse of water, i.e., recycling water directly to the existing drinking water distribution system, and not just indirect potable reuse, should be considered as a viable water resources management strategy beside other water supply options [4]. In this context, a multi-barrier approach is proposed so that if there is a problem with one step in the process, one can still produce safe water. Membrane bioreactors (MBRs) are one technology that is highly suitable for wastewater reclamation [5,6,7,8].
The MBR process consists of a biological reactor integrated with microfiltration (MF) or loose ultrafiltration (UF) membranes that combine clarification and filtration of an activated sludge process into a simplified, single step process [9,10,11]. Initially used for small-scale treatment of recalcitrant wastewater, MBRs have seen an unprecedented growth in the last decade [2,12]. The membrane is an absolute barrier to solids and microorganisms in suspension and it offers the possibility of operating the system at higher mixed liquor suspended solids (MLSS) concentration than the CAS processes. The implications of maintenance of higher MLSS are—Requirement of a smaller footprint and operation at higher solids retention time (SRT) under lower F/M ratio, hence, yielding reduced excess sludge while achieving better effluent quality than CAS processes. MF or UF membranes typically used in MBRs are not capable of significantly retaining viruses by size exclusion [13]. However, in addition to consistent removal of coliform bacteria, significant removal of human enteric viruses by MBRs has been reported for full-scale MBR wastewater treatment plants [14]. Virus removal in MBRs was attributed to their aggregation and adsorption to activated sludge followed by retention by the gel and cake layer formed over the membrane. The formation of a foulant layer on the membrane surface has been reported to be a dominating factor controlling virus removal [15], however, to date studies on interactions between viruses and the membrane surface or different foulant layers are rare. Furthermore, currently there is incomplete understanding of the impact of membrane cleaning, membrane imperfections and/or breach as well as regrowth of the pathogens in the distribution system on the virus removal performance of MBRs [14,16].
Low turbidity as well as low organics and pathogen-content of MBR permeate means that the requirement of post-disinfection and the corresponding hazards related to disinfection by-products can be minimized. However, given the uncertainties noted above, the potentially high quality of MBR effluent is often not recognized under many current disinfection requirement scenarios [17]. The aim of this paper is to critically review the current state of the art of pathogen removal by MBRs and identify the key knowledge gaps creating hindrance to harnessing the full potential of MBRs as “disinfecting units”. An in-depth discussion on the factors affecting the removal performance has been furnished and ways to achieve precise prediction of the pathogen removal at different biological and membrane conditions have been highlighted. It is believed that the information summarized in this paper will aid in making informed decisions for efficient water and wastewater management and reduction of risk of human exposure to waterborne pathogens.

2. Pathogens and Indicators in Wastewater Matrices

2.1. Waterborne Pathogens of Concern

The majority of pathogens in wastewater are enteric, that is they affect the digestive system, and present a serious health risk if ingested [18,19]. The adverse health effects of ingestion of pathogens are serious, and especially in the case of children under five, may be fatal if appropriate medical treatment is not administered in a timely manner.
Protozoa are single-cell organisms that are important to public health because they cause life threatening diseases including giardiasis, cryptosporidiosis, dysentery and amoebic meningoencephalitis [20]. Protozoan parasites are numerous in wastewater, including Cryptosporidium, Giardia, Entamoeba and Microsporidia. Cryptosporidium is highly resistant to chlorine-based disinfectants, and has been implicated in a number of gastroenteritis outbreaks around the world. Protozoa are able to survive outside their host under adverse conditions as cysts or oocysts that range in size from 3 to 14 μm in diameter [21]. Helminths are larger multicellular organisms, which when mature can generally be seen with the naked eye. Helminth parasites commonly detected in wastewaters include the round worm (Ascaris lumbricoides), the hook worm (Ancylostoma duodenale) and the whip worm (Trichuris trichura).
The most common microbial pathogens found in wastewater are bacteria [19]. These bacteria can be considered in two broad categories: enteropathogenic bacteria and opportunistic bacteria. Gastrointestinal diseases are one of the most common bacterial diseases contracted through wastewater [19]. These include diarrhea (e.g., cholera caused by Vibrio cholera and salmonelliosis caused by a number of Salmonella species) and dysentery (caused by various Shigella and Salmonella species). Other common diseases include typhoid and paratyphoid fever (caused by Salmonella species) [18]. In addition to the established pathogens, a number of opportunistic pathogens (microorganisms causing infections and disease under optimal conditions, commonly in the very young, elderly and immune-compromised), including Pseudomonus and Streptococcus, can be found in wastewaters. Bacteria range from 0.6 to 1.2 μm in diameter and 2–3 μm in length [22].
Viruses are considered as one of the most infectious pathogens common to wastewater due to their greater resistance to treatment and a smaller dose required to cause infection [19]. More than 100 different viruses can be found in human feces [23]. Enteroviruses, the most commonly detected viruses in wastewater, can cause paralysis, meningitis, respiratory disease, encephalitis and congenital heart anomalies, along with a range of other conditions with varying severity [19,23]. Other human viruses in wastewater include coxsackie A and B, reovirus, norovirus, rotavirus, hepatitis A and E, adenovirus, echovirus and poliovirus, which can potentially cause upper respiratory and gastrointestinal illness [3,20]. Gastroenteritis is the most common wastewater related illness and can be caused by bacteria, virus or protozoa [20,24]. The leading viruses responsible for gastroenteritis are rotavirus, calicivirus, enteric adenovirus and astrovirus [24]. The size of different viruses ranges within a few tens of nm. For example, nominal size of hepatitis A, hepatitis E, calicivirus and astrovirus has been reported to be around 30 nm, while the nominal size of rotavirus and enteric adenovirus can be around 70 nm [20,24].

2.2. Indicator Organisms

The wide variety of pathogens, including bacteria, viruses and protozoa present in most wastewater makes it impractical to test for each pathogen individually. Therefore suitable markers indicating microbial contamination are used. The indicator organisms themselves may not be pathogens. One widely used marker is the detection of coliform bacteria, either as total coliforms or fecal coliforms. Coliforms are common inhabitants of ambient water and may be injured by environmental stresses (e.g., lack of nutrients) and water treatment (e.g., chlorine disinfection) in a manner similar to many pathogens. Fecal coliform has been shown to correlate strongly with the presence of fresh fecal matter [25]. Possible indicators for protozoa suggested in the literature include aerobic spores, anaerobic spores and particle profiling (particle size distribution). Similarly, particle profiling has been reported as a useful indicator for the removal of helminths from wastewater, with a high correlation observed between numbers of helminth ova and the volume of particles of 20–80 µm [26].
Challenge testing of wastewater treatment processes for virus removal has been generally performed with model viruses having inactivation and adsorption behaviors similar to the native viruses under given conditions. Bacteriophages are viruses that infect specific bacteria and are widely considered to be process indicators for enteric virus removal or inactivation [27]. A coliphage is a type of bacteriophage that infects Escherichia coli (a fecal coliform). Coliphages those attack E. coli through the “pilli” are referred to as “F-specific phage” or “Male-specific phage”, while those attacking through the cell wall are referred to as “Somatic phage”. MS2 coliphage (an F-specific phage) appears to be the most common virus used in bench scale MBR studies. It is a single-stranded RNA virus, with icosahedral shape, small size (20–25 nm), and low isoelectric point (pH = 3.9) and relative hydrophobicity [14]. These characteristics are similar to some pathogenic human viruses found in water and wastewater, such as hepatitis A virus and poliovirus [28], and thus make MS2 a good indicator and surrogate for virus studies with membrane systems [29,30]. T4 coliphage (a somatic coliphage) has also been used in bench-scale MBR studies since it is similar to adenoviruses, reoviruses, rotaviruses [31], and coronaviruses [32]. Even though the size and isoelectric point of phages are similar to those of some enteric viruses, their removal and transport do not necessarily relate to those of enteric viruses in wastewater systems, and therefore, the use of these indicators are under continuous scrutiny [14].

2.3. Log Removal

Pathogen removal is expressed in terms of log removal value (LRV), which is defined as follows [33]:
Log Removal = log ( conc out conc in )
If the log removal is equal to one then there is a 90% reduction in microorganisms. If the log reduction is two, then there is a 99% reduction, if three, then there is a 99.9% reduction and so on. Regulations and guidelines for drinking water and water recycling specify a target LRV that reduces the risk associated with exposure to the pathogen to a tolerable level. For example, the specified inactivation or removal efficiencies for various pathogens defined in the United States Environmental Protection Agency Enhanced Surface Water Treatment Rule (USEPA-ESWTR) is two LRV (i.e., 99% removal) for Cryptosporidium parvum, three LRV (i.e., 99.9% removal) for Giardia lamblia, and four LRV (i.e., 99.99% removal) for viruses [16,34].

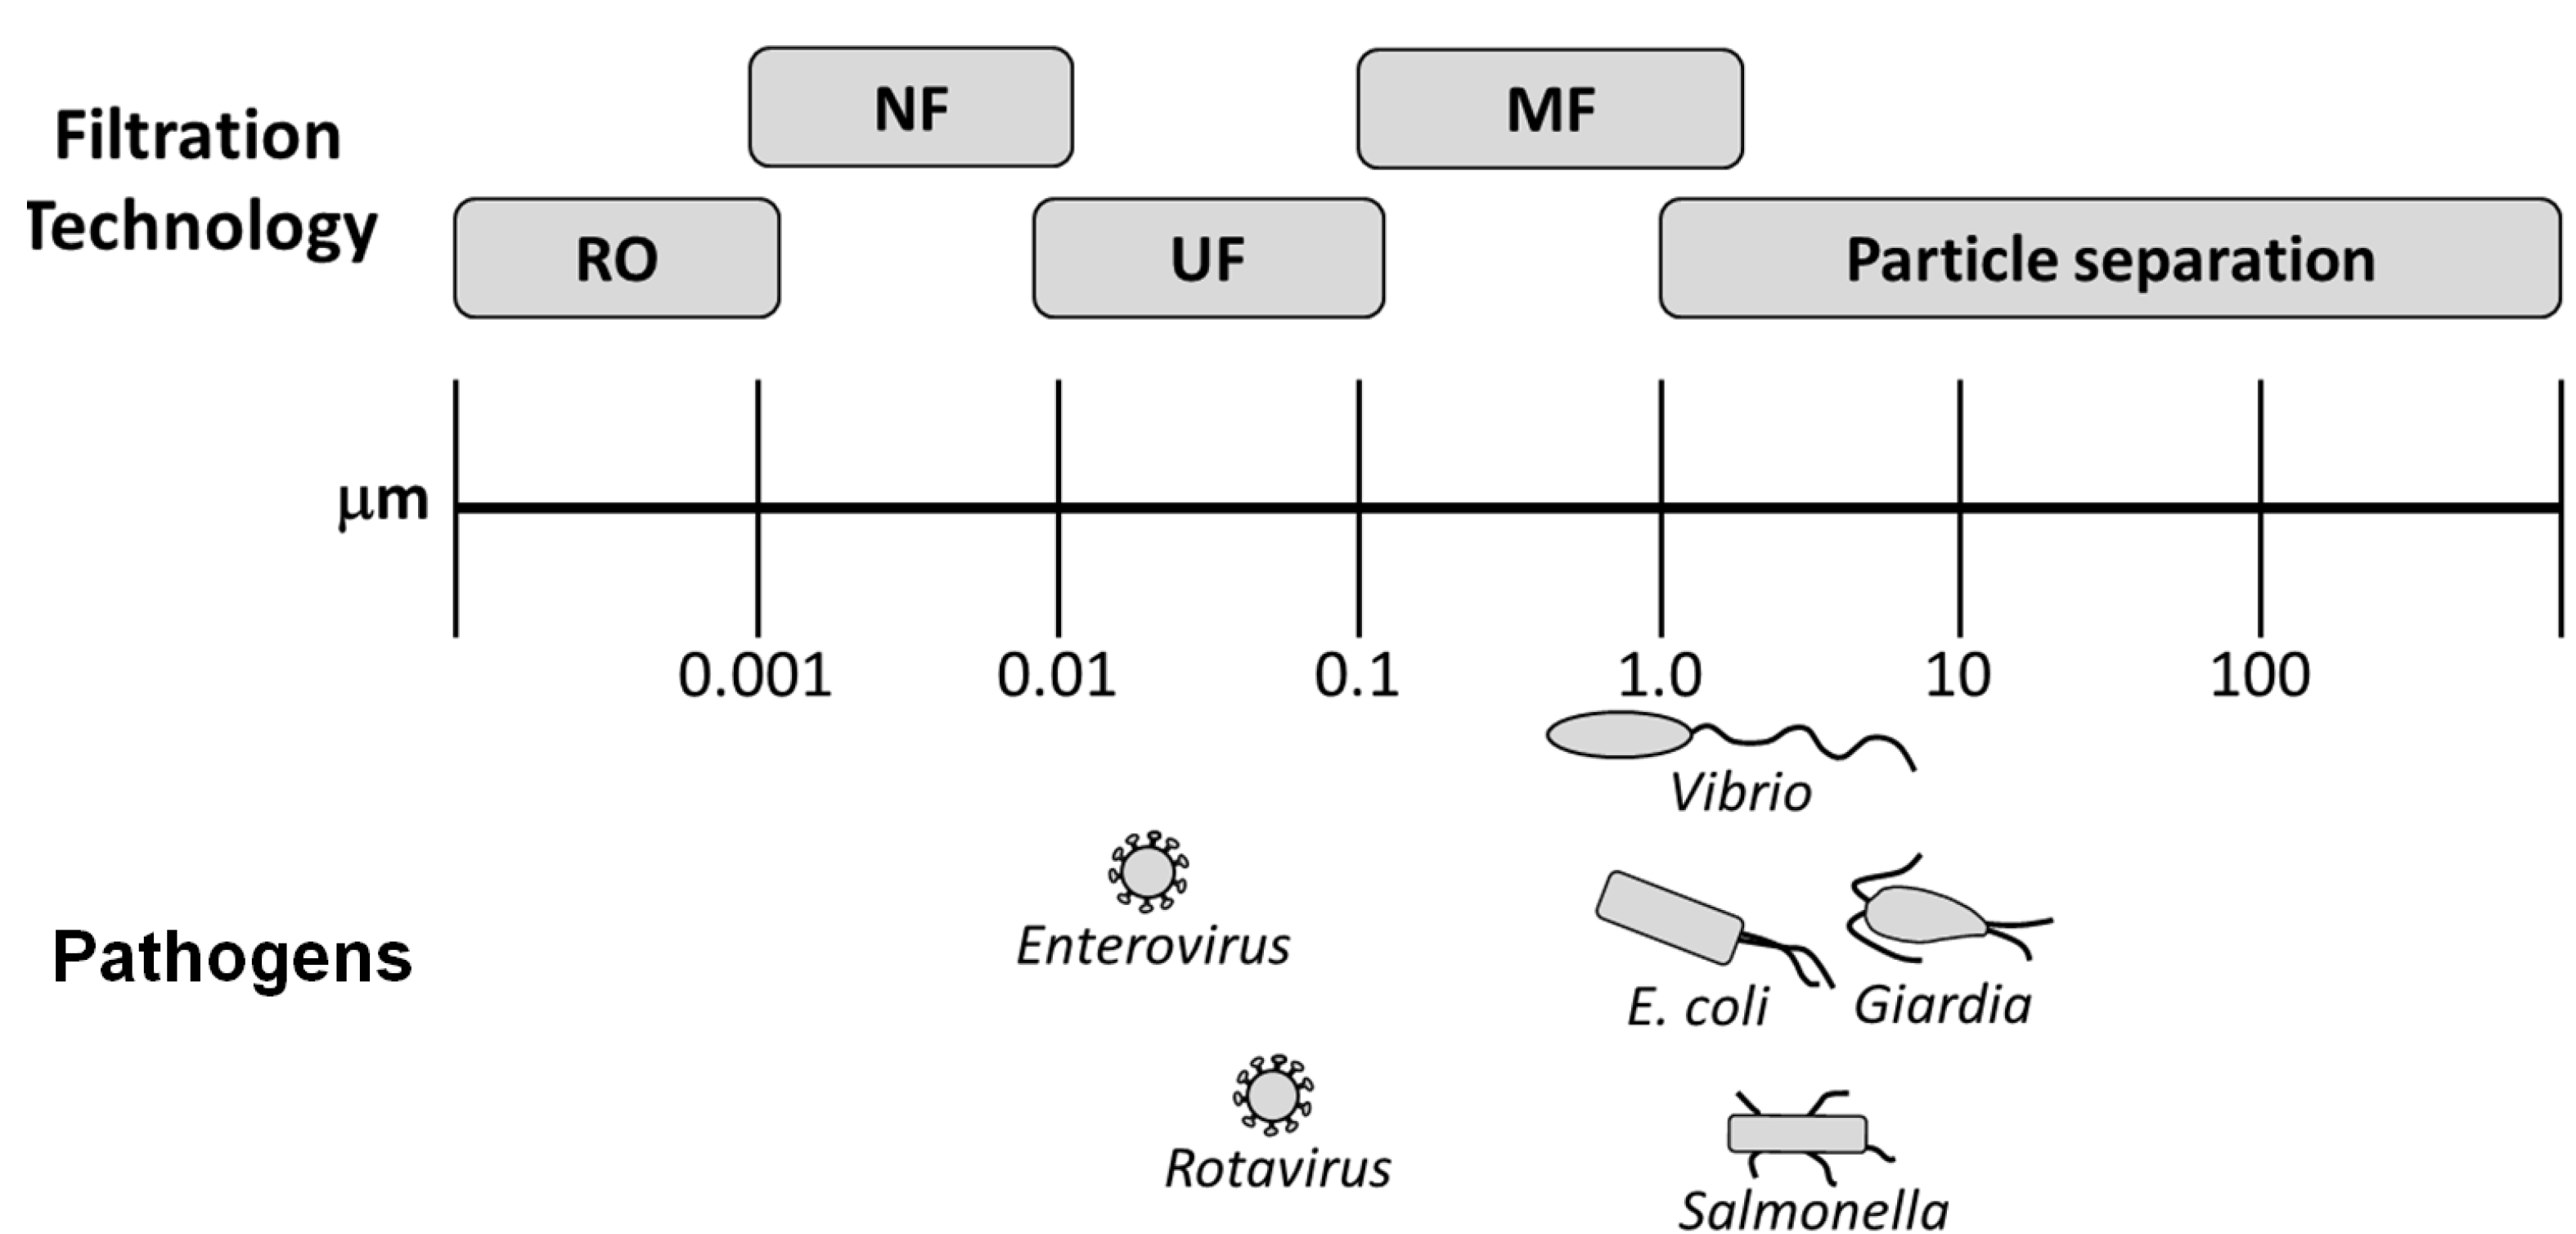
3. Removal of Microbes by Membranes

There are two facets of treatment by MBR–activated sludge and membrane separation. The role of membranes alone in removal of pathogens is briefly discussed here. The membrane filtration spectrum for rejection of pathogenic microorganisms is illustrated in Figure 1. Two types of membranes are primarily used in MBRs—MF or UF. MF membranes have pore size 0.1–10 μm, while UF membrane pore sizes may range from 5 to 100 nm, although common UF membranes used with MBRs are of ≈0.01 μm [35]. Membranes are primarily made of polymers including proprietary non-ionic polymers, polytetrafluoroethylene (PTFE), polypropylene (PP), polysulphone (PS), polyvinylidinefluoride (PVDF) and polyethylene (PE) [35,36].
Protozoan cysts or oocysts range in size from 3 to 14 μm, which is significantly larger than the pore size of an MF or UF membrane, so total removal of protozoa is expected [20,37]. Due to the nominal pore size of the MF or UF membranes used and the size of the coliform bacteria, size exclusion by membrane is considered the dominant mechanism for also the removal of coliforms by intact membranes. The pore size of common MF and UF membranes promises the removal of all bacteria from wastewater and no tertiary disinfection is required to adhere to the regulatory limit of 2 colony forming unit, CFU/100 mL in the USEPA guidelines [25,38]. Conversely, due to the much smaller size of viruses, there is much greater concern surrounding their removal by direct membrane filtration. For example, Table 1 shows MS2 phage removal by different membranes from spiked deionized water. Direct MF filtration may only achieve around one log removal of virus, while with the common UF membranes used in MBR (i.e., ≈0.01 μm, which can be generally considered to be equivalent to 200 kDa) variable log removal of virus depending on factors, such as membrane pore size and material may be achieved.
Figure 1. Membrane filtration spectrum for rejection of pathogenic microorganisms (adapted from [11]).
Water 06 03603 g001
Table 1. MS2 phage removal by different membranes from spiked deionized water.
Membrane SpecificationVirus Concentration in Feed (PFU/mL)LRVReference
RO (PA-TFC)105–106>6.5[39]
RO (PA-TFC)105–1065.6[39]
RO (PA-TFC)105–1062.7[39]
RO (CA)105–106>4.9[39]
RO (CA)105–1064.6[39]
UF 300kDa (PS)na>4[40]
UF 100 kDa (PS)na>4[40]
UF 10 kDa (PS)na3–4[40]
UF 100kDa (PES)103–1063.54 ± 0.56[41]
UF 150 kDa (PES)103–106>4.89[41]
UF 100 kDa (CA)103–106>6[41]
MF 0.2 μm (PS)na<1[40]
MF 0.1 μm (PVDF)na<1[40]
MF 0.1 μm (PVDF)103–1061.79 ± 0.09[41]
Notes: PFU = plaque forming unit; LRV = log removal value; na = not available; MF = microfiltration; UF = ultrafiltration; RO = reverse osmosis; PA = polyamide; CA = cellulose acetate; PS = polysulphone; PES = polyether sulphone; PVDF = polyvinylidene fluoride.

4. Overview of Pathogen Removal by Membrane Bioreactor

When well designed and operated, MBRs can consistently achieve efficient removals of suspended solids, protozoa and coliform bacteria [14]. Under optimal conditions, MBR systems can also significantly remove various viruses and phages. Several biomass processes (i.e., spontaneous decay, aggregation/biosorption and predation/biodegradation) along with membrane rejection govern pathogen removal by MBR. This section will provide an overview of the extent of pathogen removal, while Section 6 will detail the factors affecting pathogen removal by MBR.
Shang et al. [30] reported outstanding removal of E. coli and fecal coliforms by MBR. Ueda and Horan [42] observed the removal of fecal coliforms and fecal streptococci by MBR to be at levels acceptable for drinking water. Krauth and Staab [43], in their study of the hydraulics of pressurized MBRs, reported removal of E. Coli, Salmonella and other pathogenic indicators to non-detectable levels from wastewater generated from the canning of sour vegetables. Their research also confirmed that the effluent from the MBR met the drinking water standards in terms of bacterial indicator removal. Whilst this was a significant demonstration of the suitability of MBR for disinfection of wastewater, because only a branch of microorganisms that need to be removed was considered in this study, further study was deemed required to gain a more complete understanding of disinfection by MBR. Francy et al. [38] examined the effectiveness of MBR in removal of microorganisms from wastewater by two full scale MBR plants, each with a capacity of 12,900 m3/d, both using 0.4 µm chlorinated-polyethylene membranes. The study found that for all MBR samples, there was almost complete removal of bacteria. The recorded concentrations of the indicator organism E. Coli and fecal coliforms in the treated wastewater were within the USEPA guidelines for reuse for urban and agricultural (food and non-food crops) purposes, with many of the samples returning values of less than 1 CFU/100 mL. It is, however, important to note that microbial colonies may form in the internal space of permeate pipe line and may cause detection of microorganisms in permeate despite the complete retention of all bacteria within the bioreactor [44]. Table 2 summarizes data from selected representative papers related to coliform removal by MBRs from wastewater.
Due to the relative size of viruses to the MF and UF membranes commonly used with MBRs, there is much greater concern surrounding the removal of viruses and the implication this has on disinfection than the removal of bacteria or protozoa. Table 3 summarizes the findings of some key case studies regarding the removal of phages and other viruses by MBR. Under optimal conditions, as detailed in Section 6, MBR systems can also reliably remove various viruses and phages. For example, Kuo et al. [36] reported 4.1–5.6 log removals for human adenoviruses, whereas Simmons et al. [45] reported that removal efficiencies could reach 6.3, 6.8, and 4.8 logs for human adenoviruses, enteroviruses, and noroviruses, respectively. Cicek et al. [46], in their investigation into the use of an MBR to reclaim wastewater, studied the efficiency of an inorganic Al2O3-TiO2 ceramic membrane for the treatment of a synthetic wastewater [46]. They observed complete retention of heterotrophic bacteria and MS2 phages by the membrane [46]. Testing of the undiluted MBR effluent confirmed the absence of any heterotrophic microorganisms. Further testing of both the retentate and the effluent showed that there was 8200 PFU/mL in the retentate and no detectable amount in the effluent. The removal of human adenovirus (HAdV) by MBR was investigated by Kuo et al. [36]. The wastewater from a full scale MBR wastewater treatment plant was sampled at four stages, namely, incoming raw sewage, primary sedimentation effluent and MBR influent and effluent [36]. There was no removal of HAdV by the primary sedimentation, but the MBR achieved log removals at an average of 5.0 ± 0.6 between MBR influent and effluent. Conversely, although da Silva et al. [47] obtained high removal efficiencies for noroviruses in a full-scale MBR system, their data also suggested that virus removals were inconsistent. Different factors affecting virus removal by MBR has been detailed in Section 6.
Table 2. Indicator bacteria removal by membrane bioreactor (MBR). CFU: colony forming unit.
Pathogen/IndicatorMembrane PropertiesFinal Concentration (CFU/100 mL)Removal (%)Average Log RemovalReference
Nominal Pore Size (µm)ConfigurationMaterial
Fecal coliforms0.4Flat SheetPolyethylene1.090%6.86[42]
Fecal strepptococci0.4Flat SheetPolyethyleneND100%>5.83[42]
Fecal coliforms100 kDaFlat Sheet-ND100%-[48]
Fecal strepptococci100 kDaFlat Sheet-ND100%-[48]
Enterococci0.4-Chlorinated Polyethylene0.63--[38]
Fecal coliforms0.4-Chlorinated Polyethylene0.67--[38]
Fecal coliforms0.4Flat SheetChlorinated polyethylene0.31--[49]
Thermo-tolerant coliforms0.4Flat SheetChlorinated polyethylene0–1.48--[49]
Total coliforms0.4Flat SheetChlorinated polyethylene0–2.3--[49]
Enterococci0.4Flat SheetChlorinated polyethylene0.11-6[49]
Fecal coliforms100 kDaFlat SheetNot SpecifiedND100%-[50]
Fecal strepptococci100 kDaFlat SheetNot SpecifiedND100%-[50]
Fecal coliforms0.05Hollow fibrePolyethersulfone--5.5[51]
Fecal coliforms0.04Flat SheetPolyethersulfone--5.4[51]
Fecal coliforms0.08Flat SheetPVDF/PET--5.9[51]
Fecal coliforms0.03TubularPVDF--6[51]
Fecal coliforms0.1Hollow fibrePVDF--5.7[51]
Fecal coliforms0.1Hollow fibrePVDF--5.4[51]
Fecal coliforms100 kDaTubularPolysulfone27 (max)-[52]
Enterococci0.03----6.1[53]
Fecal coliforms0.04Hollow fibreProprietary polymer-100[22]
Total coliforms0.04Hollow fibreProprietary polymer--5.8[22]
Total coliforms--PVDF--6.7 ± 0.1[54]
Total coliforms--PES--6.1 ± 0.5[54]
Total coliforms--PTFE--6.1[54]
Total coliforms-Hollow fibre---6.3 ± 0.6[54]
Total coliforms-Flat Sheet---6.5 ± 0.2[54]
Total coliforms-Tubular---6.6[54]
Fecal coliforms--PVDF--5.9 ± 0.4[54]
Fecal coliforms--PES--5.7 ± 0.6[54]
Fecal coliforms--PTFE--5.6[54]
Fecal coliforms-Hollow fibre---5.6 ± 0.2[54]
Fecal coliforms-Flat Sheet---6.0 ± 0.5[54]
Fecal coliforms-Tubular---6[54]
Table 3. Indicator virus removal by MBR.
Pathogen/IndicatorMembrane Nominal Pore Size (µm)Final Concentration (CFU/100 mL)Removal (%)Average Log RemovalReference
Somatic coliphage0.40.32--[38]
F-specific coliphage0.40.51--[38]
Indigenous phage0.48.8-5.9[42]
Somatic coliphage0.4--2.6–5.6[55]
Coliphage0.032.47-3.7[53]
Indigenous MS2 coliphage---3.2–4.7 ± 1[54]
Somatic coliphage0.41.11–2.18-4[49]
Bacteriophages infecting Bacteroides fragilis0.40100-[49]
F-specific coliphage0.40–1.26-6[49]
Calicivirus0.4---[56]
Enterovirus0.4-98.41.79 ± 0.55[21]
Norovirus (Winter)0.4-931.14 ± 0.88[21]
Norovirus0.4--1.3–5.2[56]
Sapovirus0.4-->1.8–>3.3[56]
Overall HAdV---5.0 ± 0.6[36]
F-specific phage0.1->95%-[36]
Somatic coliphage0.1->95%-[36]
T4 coliphage0.1 & 0.22--1.7–6.4[32]
Poliovirus0.22-91%–99.5%-[57]
Poliovirus0.004-100%-[57]
Coliphages0.4-100%-[58]
MS2 coliphage0.4--0.4–2.1[30]
F-specific phage0.1--3.3–5.7[22]
Somatic coliphage0.1--3.1–5.8[22]

5. Membrane Bioreactor vs. other Treatment Options

The removal efficiency of pathogens from wastewater by MBR is generally higher than that of CAS and has even been shown to be equivalent to a CAS system with a tertiary treatment line [21]. The addition of a membrane to a CAS system to form an MBR treatment system reduces the required footprint of the plant, as the “physical” removal of pathogens by the membrane complements the contribution to the removal by the “biological process”, which is the only removal mechanism in a CAS operation [5,6]. For example, Ueda et al. [42] found that MBR removed phages at rates one-log unit higher than CAS systems treating the same wastewater.
Valderrama et al. [59] compared CAS and MBR systems treating wastewater from a vineyard and found that by MBR alone water reuse standards were met for permeate suitable for urban, agricultural and recreational reuse according to the quality criteria defined by the Spanish Royal Decree for water reuse. A microbial evaluation revealed that the CAS effluent was unsuitable for reuse in any capacity. Similarly, Francy et al. [38] found an acceptable removal of virus by MBR, but the CAS system showed little to no removal. In another study, complete removal of faecal coliforms and up to 5.8 log removal of coliphages was observed by an MBR system [22]. It was shown that the MBR system was capable of high removal of coliphages despite the variation in feed coliphage concentrations. The results of this study indicated that the MBR system can achieve better microbial removal in far fewer steps than the CAS process with advanced tertiary treatment. The final effluent from either treatment processes can be potentially reused. Ottoson et al. [21] considered the removal of protozoa, bacteria and viruses by three parallel treatment systems including a CAS system with tertiary filtration, a 0.4 μm MBR system and an upflow anaerobic sludge blanket (UASB) system. The MBR proved superior in removal of E. coli, as high as five-log removal was attained. CAS with sand filtration and UASB treatment lines demonstrated removal of the microbial indicator organisms comparable to that of the MBR [21]. Table 4 provides a comprehensive comparison of removal of different viruses by full-scale wastewater treatment plants (WWTP): overall, full-scale MBR plants achieved higher virus removals.
Table 4. Reported virus removal in full-scale wastewater treatment plants (WWTP).
VirusLog Removal
Conventional WWTPMBR
Adenovirus1.3–2.4 a3.4–5.6 b
Enterovirus0.44–3.6 c3.2–6.8 d
Norovirus I−0.2–2.7 e0–5.5 f
Norovirus II−1.6–3.0 g2.3–4.9 h
Note: a [60,61,62]; b [36,45,63]; c [60,61,64,65,66,67]; d [45,63]; e [60,61,68]; f [47]; g [60,61,68]; h [45,47].

6. Factors Affecting Pathogen Removal by Membrane Bioreactor

6.1. Effect of Membrane Material, Pore Size and Flux

The membrane material properties may play an important role in the pathogen removal by MBR, particularly in absence of a significant amount of biofilm on membrane surface (Table 1). Gander et al. [69] tested submerged MBRs equipped with polypropylene or polysulphone membranes and observed total coliform removal of five-log and nine-log, respectively. Although the pore-size and flux varied between the compared membranes, this observation indicated the impact of membrane material properties (e.g., hydrophobicity). Studies show that the membrane material, and, more specifically, its surface charge, influences also virus removal efficiency. Removals of MS2 bacteriophage virus using RO membranes of different materials under different operating pressures were investigated by Hu et al. [70]. The results obtained by Hu et al. [70] revealed that a better log removal in terms of MS2 bacteriophage could be achieved using polyamide RO membrane under the optimum operating pressure of 100 psi. Antony et al. [16] also reported higher virus rejection by polyamide RO membranes (slightly negative charge) compared with that of cellulose acetate and polysulfone membranes (neutral charge). MS2 bacteriophages have an isoelectric point at pH 3.9 [71], suggesting that the charge will be negative above this pH. Therefore, when the membrane and the virus particles hold a negative charge, these repulsive forces could assist with the rejection of viruses. Zheng and Liu [31] investigated virus rejection by PVDF and PP membrane modules, with the pore sizes of 0.22 and 0.1 μm, respectively. In tap water system, 2.1 log removal of coliphage T4 could be achieved by the PVDF membrane compared with complete rejection by the PP membrane, while for coliphage f2 with smaller diameter, 0.3–0.5 log rejection of the influent virus was achieved by the two membranes.
Similar to membrane material, membrane pore size has been reported to impose case-specific influence on pathogen removal by MBR (Figure 2). DeCarolis et al. [44] explored 4 different MBRs with membranes possessing pore sizes varying from 0.04 to 0.4 μm. Fecal coliforms are much larger than viruses and can be filtered by 0.45 μm membranes. Therefore the data did not show any trend between fecal coliform removal efficiency and pore size. Given the smaller size of viruses, membrane pore size may be a more important determinant of virus removal efficiency than bacteria. For example, Madaeni et al. [57] reported that hydrophobic PVDF membrane (pore size = 0.22 μm) could remove about 99% of poliovirus, whereas ultrafiltration membranes with pore sizes smaller than the virus achieved complete rejection. Mechanical sieving of virus by membrane may be significantly related to the size of phages [72]. For example, Wu et al. [73] found LRV to be in good correlation with the ratio of phage size/pore size. On the other hand, indigenous MS2 was undetectable in the effluent of all tested MBR systems with a range of membrane pore sizes (0.03–0.1 μm), suggesting that removal mechanisms other than straining may exist in MBRs [51]. However, when MS2 coliphage (0.03 μm) was spiked to an MBR treating municipal wastewater, pore size effect became more apparent [51]. The MF membrane with 0.1 μm pore size showed a log removal of 1.7, but the membranes with 0.03 μm pore size showed a log removal of 4.4. The authors explained that unlike the indigenous viruses, the spiked foreign viruses may not have had enough time to be embedded in microbial floc and get removed by a dynamic membrane formed by the cake layer over the membrane (See Section 6.2). Lv et al. [32] indicated that for an MBR with 0.1 μm membrane, the membrane alone played a major role in phage removal. By contrast, for the 0.22 μm membrane, the importance of the cake/gel layer formed on the membrane surface was evident. Pan et al. [74] investigated removal of white spot syndrome virus by three parallel submerged MBRs equipped with membrane of different pore sizes. When fed with phosphate buffer spiked with the virus, the MBRs equipped with membranes of 0.45, 0.22 and 0.1 µm achieved log removals of 0.6, 1.18 and 5.5, respectively. However, when fed with aquaculture wastewater containing the virus, the removal efficiency of the larger pore membranes (0.22 and 0.45 µm) continued to increase with the filtration resistance. It was revealed that the biofilm accumulating on the surface of the membrane made a major contribution to the removal.
Figure 2. Virus Removal as a function of membrane pore size in bench and pilot-scale MBRs. Data source: [28,30,31,32,51,53,70,73,75,76,77].
Water 06 03603 g002
In a study conducted by Ueda and Horan [42], the membrane flux showed negative correlation to phage removal by MBR. This has implications for scaling up as lower flux implies requirement of higher membrane surface area [42]. On the other hand, based on their 18-month study, Hirani et al. [51] found no correlation between peak flux and LRVs. Over a tested range of 7.5–12.5 L/m2·h, Wu et al. [73] observed little effect of flux of a 0.4 µm clean membrane on LRV. However, during MBR operation, higher permeate flux led to higher LRV followed by a drop in LRVs with further increases in permeate flux. The initial improvement in LRV with flux-rise was attributed to development of a biofilm over the membrane. The impact of biofilm formed on membrane on pathogen removal is discussed in Section 6.2.
It is noted that the aspect of disinfection has been scarcely studied in conjunction with the recently developed high retention MBRs equipped with nanofiltrtaion, membrane distillation or forward osmosis membranes [78], and future studies must assess this aspect. Furthermore, incorporation of antimicrobial or photoactive nanomaterials can make membranes “reactive” instead of a simple physical barrier, achieving multiple treatment goals, such as pathogen inactivation and resistant pollutants degradation, while minimizing fouling [79,80,81,82,83]. Several nanomaterials, such as Ag, chitosan, TiO2, ZnO, carbon nanotube and various polymers, can induce good antimicrobial properties to membranes. While varieties of anti-microbial membranes with encouraging results have been reported (Table 5), these are yet to be well-integrated to MBR format, and further research in this line is deemed imperative.
Table 5. Different types of functionalized anti-microbial filters/membranes.
Type of FunctionalizationFunctionalized Anti-Microbial Filter/MembraneReference
NanoparticlesAg nanoparticles-coated polyurethane foam[84]
TiO2—entrapped PVDF MF membrane[85]
Ag-TiO2/hydroxyapatite/Al2O3 MF membrane[86]
Ag nanoparticles-coated polysulfone UF membrane[87,88]
Biogenic Ag immobilization in PVDF MF membrane[89]
Ag nanoparticles-coated PA NF membrane[90]
Ag nanoparticles-coated PAN UF hollow fiber membrane[91]
Ag nanoparticles-coated cellulose acetate UF hollow fiber membrane[92]
NanofiberThin-film nanofibrous composite UF membrane containing cellulose–chitin blend[93]
Thin-film nanofibrous composite UF membrane containing polycarbonate–quaternary ammonium salt[94]
Nylon 6 nanofiber membranes with N-halamine[95]
Polysulfone-Ag nanocomposite UF membrane[96]
Carbon nanotubeSingle and multi-walled carbon nanotube hybrid filter[97]
Anodic multi-walled carbon nanotube microfilter[98]

6.2. Relative Contributions of Biomass Processes and Membrane Rejection

In the MBR system, the biomass processes (i.e., spontaneous decay, aggregation/biosorption and predation/biodegradation) dominate pathogen removal; however, as already noted in Section 6.1, biofilm/membrane rejection is an essential supplement of biomass processes for removal. For example, MF and some UF membranes will not retain many viruses due to the virus size (as small as few tens of nm) relative to the pore size. However, even if the target virus is smaller than the membrane pore size, virus removal by MBR may occur via biodegradation following biosorption and membrane retention, in addition to spontaneous decay [73]. During the start-up period, adsorption and bacterial acclimation leads to a significant increase in biological removal of virus until it stabilizes. The removal by membrane increases with time as fouling develops. The fouling layer gradually forms on the membrane surface, physically blocking the membrane pore, allowing chemical adsorption, and biological predation of phages [30,42,99,100]. Thus the removal of virus may be initially governed by adsorption on membrane surface or in membrane pores, but as the membrane gets fouled, the virus removal will be primarily governed by direct interception on the cake and gel layer formed on the surface of the membrane.
Ueda and Horan [42] found significant (5.9 log) phage removal although the phage size was smaller than the membrane pore size. They concluded that this removal was due to a biofilm layer forming on the membrane, which allowed for chemical, physical and biological removal of the phage [42]. Wu et al. [73] went further and measured the removal of virus indicators at each step of the MBR process. They observed a log removal of 1.85 by the biomass processes (e.g., biodegradation and biosorption), while membrane rejection was responsible for a log removal of 0.96, which increased with the development of a biofilm over the 0.4 µm membrane. Gander et al. [101] considered the use of MBR for treating domestic wastewater and found that bacterial and phage removal was increased by both the build-up of the biofilm and a high turbidity influent, which is also clarified by MBR systems to levels acceptable for various reuse applications [101]. Lv et al. [32] considered two membranes-one with a nominal pore size smaller than the T4 phage, the other with a larger pore size - and found that the role of the membrane relied on the pore size, with no T4 detected in the effluent of the 0.1 μm membrane system. The 0.22 μm membrane system removed inadequate amounts of T4, which, however, gradually increased as the cake layer formed on the membrane surface, further reducing the effective pore size. Kuo et al. [36] also reported that HAdVs were associated with the biomass and were subsequently retained by the membrane. Mass balance analysis carried out by Lu et al. [15] showed a high percentage of MS-2 in the concentrate for the fouled membrane as compared with the pristine membrane. Quartz crystal microbalance (QCM) results showed faster kinetics of MS2 adhesion to the pristine membrane than to the SMP-fouled membrane. Furthermore, an attractive force between MS2 and the pristine membrane was detected using an atomic force microscope (AFM), whereas a repulsive force was detected for the interaction between MS2 and the fouled membrane. The presence of soluble microbial product (SMP) on the membrane surface led to higher rejection of MS2 due to both pore blocking and repulsion between MS2 and the SMP layer [15].
A few studies have systematically investigated the contribution to virus removal of the membrane as well as the sludge cake layer and the gel layer that forms on the membrane. Wu et al. [73] found that the gel layer contributed more to somatic coliphage removal than the cake layer, especially at high flux conditions. The gel layer is mainly formed by deposition and accumulation of the dissolved organic matter on the membrane surface, which is more compact than the cake layer. Therefore, its ability to entrap and accumulate virus-sized particles would be significantly higher, even though the gel layer contribution to filtration resistant is much lower than the cake layer [73,102,103].
Through the studies discussed in this section, it is clear how vital the membrane biofilm is to the removal of pathogens, especially for microbes smaller than the membrane pore size, and that without it the removal efficiency would be considerably less and likely insufficient for water reuse. On the other hand, because viruses tend to attach to solid surfaces, most viruses that survive wastewater treatment are likely associated with waste-activated sludge and may be present in biosolids [14,56,104]. This warrants safe disposal of potentially pathogen-containing biosolids.

6.3. Impact of Membrane Cleaning

As discussed in Section 6.2, several studies have shown the role of membrane biofilms as a secondary barrier to microbial contaminants. Although pore blocking, pore constriction, and biofilm formation on the membrane surface by organic foulants enhance the removal of microbes, they also reduce the permeability of the membranes. The slimy gel layer formed during the filtration process on the membrane surface often cannot be removed by physical means of cleaning, such as backwashing and air scour [35,73,101,105,106]. Chemical cleaning is conducted to recover the permeability of the membranes and it removes a portion of these foulants from the membrane pores and surfaces and may reduce the effectiveness of the MBR process in rejecting microorganisms [17]. For example, Farahbakhsh et al. [107] reported that increases in feed coliphage concentrations resulted in the passage of larger numbers of coliphages when an MF membrane was clean, but had little impact on the passage of coliphages when the membrane became fouled. Liu et al. [108] reported a 0.5 log reduction in removal by a membrane immediately after backwash, which increased until the next backwash. Jacangelo et al. [109] noted that the virus removal by MF/UF membranes was low at the beginning of filtration and increased with time with accumulation of foulants. However, in that study, the removal rate did not decrease after hydraulic backwash, indicating that the irreversible membrane fouling maintained the virus removal. Shang et al. [30] observed that a biofilm formed over 21 d achieved a much higher log removal than that formed over 9 h, which has strong implications when designing cleaning cycles in an MBR treatment plant. If the water is to be reused, microbial removal rates need to remain stable and within reuse limits, so an appropriate membrane cleaning protocol must be established [73]. Additionally, the effect of membrane cleaning on subsequent disinfectant requirements needs to be evaluated. This aspect has been discussed in Section 7.

6.4. Impact of Membrane Imperfections/Breaches

Membranes are a mechanical form of disinfection that works by physical separation of the target pathogen. However, the complete removal of microorganisms will be achieved only when the membrane system is intact. Any anomaly with the membrane surface (e.g., abnormally large pores, compromised glue line, holes) and the filtration system (e.g., compromised O-rings, broken mechanical seals) will result in microbial contamination risk of the product water [16,110]. In routine operation, a breach in the membrane system can take many forms, namely, pore expansion through incompatible chemical cleaning [111]; damage by mechanical forces, such as shear forces and vibrations [112]; oxidation due to disinfection and higher operating pressures than specified by the manufacturer [113].
Several studies analyzing virus penetration incidents in terms of integrity of UF membranes (not coupled with a bioreactor) [70,114,115] showed that the abnormally large pores and membrane imperfections at the membrane surface and glue lines and seal breaches could be the reason for varying degrees of virus penetration. For example, Urase et al. [114] reported that although the ratio of abnormal to normal pores was less than 1/109, virus rejection was strongly affected by large pores. However, the significant penetration of viral particles during the challenge tests could also be due to their concentration in the feed water, which is much higher than under typical treatment train conditions, and thus the presently accepted practice is to use the lowest seeding dose possible to demonstrate the required log removal values. The presence of MS2 bacteriophage in the effluent of a polyamide RO membrane was attributed to leakage of bacteriophages through the membranes structure—investigations using scanning electron microscope (SEM) and AFM showed that there were gaps or pores present in the membrane structure, which were sufficiently large for the MS2 viruses to pass through.
Only a few studies have investigated the implications of membrane breach on passage of pathogen through a membrane within MBR. A loss of membrane integrity can result in a spike in both turbidity and microorganisms in the MBR filtrate. Under breached conditions, the filtrate turbidity typically increases immediately after relaxation/backwash and gradually reduces to a previously observed value once the membrane plugs with activated sludge after a few minutes of filtration [116]. Since filtrate turbidity for MBR systems is not always monitored continuously at all MBR facilities, such a breach can result in passage of microorganisms, thereby posing a challenge for the downstream disinfection process. Hirani et al. [17] characterized effluents produced from an MBR system operating under routine and challenged conditions, and reported that the membrane (0.1 µm) under breached conditions (turbidity > 0.5 Nephelometric Turbidity Units, NTU) resulted in an increase in a total coliform bacterial concentration up to 8500 CFU/100 mL. Passage of MS2 bacteriophage through the breached membrane was lower compared to total coliform bacteria, indicating that indigenous MS2 bacteriophage are more likely to be particle-associated compared to coliform bacteria and thereby consistently rejected by the membrane even in the event of a loss of membrane integrity. On the other hand, although Cryptosporidium oocysts were not detected in the filtrate, Giardia cysts were detected at a low concentration (1/10 L).
Notably, depending on the membrane type and the nature of the feed water foulants, membrane fouling may in fact prevent penetration of pathogens due to membrane imperfections/breaches. For example, in the aforementioned study of Hirani et al. [17], the highest concentration of coliform bacteria was observed at the beginning of the filtration cycle suggesting plugging of the breach by mixed liquor solids as the filtration cycle progressed. If the fouling, however, is reversible, the membrane healing will revert with chemical cleaning. Furthermore, while the development of increased irreversible fouling may enhance virus removal, progressive reduction of flux due to fouling is not a sustainable mode of operation and currently it is unknown if general decay or decomposition of the membrane may result in decreased rejection over the long-term operation [16].
Additional concern has been raised regarding the limitations of existing membrane integrity monitoring techniques. Existing techniques are either only reliable for detecting contaminants of 1 μm or larger, or provide low resolution (one to two log) even if capable of detecting a membrane breach less than 1 μm [16]. This is a significant limitation given that, for example, enteric virus particles are in the size range 0.01–0.04 μm. Similarly, the process control monitoring parameters lack sensitivity and therefore virus breakthrough may occur even before a loss of integrity is detected.

7. Requirement of Post-Disinfection

Although MBRs produce high quality effluent, and it can be potentially used as a pre-disinfection or disinfection unit [30], a post-disinfection process is still used to ensure the effluent quality for reuse. As the reuse application changes, the disinfection requirement will change, so that the MBR effluent, which may regularly meet the requirement for one application will no longer be adequate. The only quantitative virus content value in the USEPA water reuse guidelines is the North Carolina agricultural reuse for non-processed food guide that allows a maximum of 25 plaque forming unit, PFU/100 mL and a monthly average of 5 PFU/100 mL [25], and most of the MBR studies reviewed here appear to meet this requirement. No extra disinfection may be required for the aforementioned MBR case studies to remove total and fecal coliforms for restricted urban, environmental of industrial reuse. Despite the success of the process in pathogen removal, and therefore the potential reuse of MBR effluent in irrigation, it may not be sufficiently effective for reuse as drinking water, or other purposes requiring higher disinfection standards [38].
Although post-disinfection is still recommended, the higher removal of pathogens by MBR as compared to CAS or other treatment processes means chemical disinfection is required at a lower dosage to reach the reuse standard [117]. For example, Francy et al. [38] reported that because of significant removal by MBR, ultraviolet disinfection after MBR treatment provided little additional log removal of any organism except for somatic coliphage (>2.18), whereas ultraviolet or chlorine disinfection after CAS treatment provided significant log removals (above the analytical variability) of all bacterial indicators (1.18–3.89) and somatic and F-specific coliphage (0.71 and >2.98). In another study, the chlorine required to remove 100% of fecal coliform from MBR effluent was 2.9 mg/L, less than for the sand filtration process that required 8 mg/L, and less than the typical dose of 5–20 mg/L, although some viruses have been known to survive disinfection in low doses [52,117,118]. The study by Natvik et al. [119] suggested a minimal requirement for post-MBR disinfection, which can be achieved using a reduced ultraviolet irradiation. In another study, complete removal of a viral indicator from the effluent of an MBR treating grey water via UV irradiation was reported [120]. Mansell et al. [121] reported achievement of five-log virus inactivation with free chlorine dosing to MBR effluent at concentrations one-tenth of 450 mg Cl2-min/L, which is the minimum value required by California Water Recycling Criteria (Title 22) for all chlorine disinfection processes. Li et al. [122] found that after treatment by MBR with a short HRT of less than an hour, the required dose of chlorine for the effluent to reach the drinking water standard was reduced from 22.3 ± 5.1 to 0.5 ± 0.1 mg/L. Hirani et al. [17] reported that despite the passage of microbes in higher concentrations through a breached membrane (filtrate turbidity of 1.0 NTU) of an MBR, a free chlorine dose of 30 mg-min/L was sufficient to achieve greater than five-log removal of seeded MS2 bacteriophage and removal of total coliform bacteria at or below the detection limit. It was suggested that if such a lower dose were to be employed, a significant decrease in plant footprint and operational costs could be realized.
MBRs can efficiently remove pathogens with no or reduced chemical oxidative disinfection, thus, with minimized associated problems and costs of storing and using corrosive agents. However, the regrowth of pathogens, such as Aeromonas, Mycobacterium, and Legionella, has been reported in the distribution system irrespective of the treatment technology used, including CAS processes and MBRs [123,124]. Thus, the post-treatment of MBR effluents as well as effective effluent monitoring to confirm the integrity of the process is necessary in order to ensure environmental and public health protection.

8. Emerging Concerns in Accurate Assessment of Disinfection by Membrane Bioreactor

8.1. Seeded vs. Indigenous Microbes

Noting that as much as 95.5% of the seeded phage was lost before reaching the MBR, Cicek et al. [46] underscored the importance of considering processes other than membrane filtration (e.g., predation, biosorption or spontaneous decay), particularly when the removal is assessed based on seeded phage and not the ones occurring naturally in wastewater. In order to avoid overestimation of membrane contribution to total virus removal, Ueda et al. [42] also expressed similar concerns.

8.2. Quantification Methods and Indicator—Pathogen Correlation

Different indicator organisms have been considered in the literature reviewed, but there has been some concern recently regarding the correlation between indicators and the presence of actual viruses [125]. Ottoson et al. [21] note that the presence of indicator organisms does not always indicate the presence of pathogens. Conversely, it has been suggested that much of the controversy with regards to indicator and pathogen correlations is the result of studies with insufficient data for assessing correlations [56,126] and these problems can be rectified by taking the appropriate quality control measures. On the other hand, Sima et al. [56] pointed out potential pitfalls of the RT-PCR method of quantifying virus genomes due to compounds present in wastewater samples, which may interfere with extraction efficiencies, and raised the importance of careful quality control measures also in this respect.

8.3. Case-Specific Suitability of Indicators

Some indicators may be more suitable than others for a particular treatment train. Wu et al. [126] noted that no single indicator could be identified as the most correlated with pathogens, however, coliphages, F-specific coliphages, Clostridium perfringens, fecal streptococci and total coliforms were more likely than other indicators to be correlated with pathogens. De Luca et al. [127], observed the traditional bacterial indicators to be almost totally removed by biofiltration, and thus recommended somatic coliphages as best indicators to evaluate the microbiological risk when MBR effluent is discharged into natural waters or reused. Based on reductions of organisms throughout treatment processes, Francy et al. [38] reported that somatic coliphage may best represent the removal of viruses across secondary treatment in both MBR and conventional secondary plants, while F-specific coliphage and E. Coli may best represent the removal of viruses across the disinfection process in MBR facilities.
Ottoson et al. [21] observed a marked variation in the removal of the tested indicator organisms. bacterial indicators were more efficiently removed than coliphages, which were more efficiently removed than enterovirus and norovirus genomes. Similarly, while looking at the removal of human enteric viruses from a full scale MBR plant, Simmons et al. [45] found that compared to human adenovirus (5.5 log removal), human enterovirus (5.1 log removal) and norovirus (3.9 log removal) were removed with lower efficiencies. In a study by Hirani et al. [51] the log removal of total and faecal coliform varied from 5.8 to 6.9 and 5.5 to 6.0, respectively, showing some impact of the indicator organism chosen on the perceived bacteria removal efficiency. Notably, the lower LRVs of faecal coliform, despite the generally expected similar removal of total and faecal coliforms due to the similarity of their particle sizes, was attributed to lower influent concentrations of the former. Passage of MS2 bacteriophage through a breached membrane was not substantial, indicating that indigenous MS2 bacteriophage are more likely to be particle-associated compared to coliform bacteria and thereby consistently rejected by the membrane even in the event of a loss of membrane integrity [17].

9. Concluding Remarks

MBRs have been proven to consistently deliver complete removal of protozoa and around six-log reduction of bacteria, and are therefore accepted, as a single step, capable of meeting the high regulatory standards. Although MF or UF membranes commonly used with MBRs cannot be expected to be an effective barrier for virus-sized particles based on the nominal pore size, under optimal conditions, MBR systems can also reliably remove various viruses and phages. This is a marked improvement over the CAS processes that can achieve very low virus removal if not complemented with a tertiary filtration. However, reported MBR virus removal has been observed to vary significantly depending on the type of the virus (e.g., human adenovirus vs. norovirus) or the indicator (e.g., F-specific coliphage vs. somatic coliphage) monitored and also on the issue whether indigenous or spiked viruses are being probed. Furthermore, MBR systems require periodic backwash and chemical cleaning of the membrane to prevent blockages and excessive build-up of biofilm. But this disruption of the biofilm layer may adversely affect virus removal. It is also important to note that passage of pathogens through the membrane can occur as a result of a membrane breach. Additionally, the regrowth of pathogens in the distribution system may lead to microbial contamination of the permeate. Thus post-disinfection of MBR effluent is recommended for water reuse purposes. Nevertheless, the higher removal of pathogens by MBR as compared to CAS or other treatment processes means chemical post-disinfection is required at a lower dosage to reach the reuse standard, reducing the problems and costs associated with storing and using corrosive disinfection agents. Indeed recent studies, following rigorous monitoring campaigns, suggest that a significant decrease in plant footprint and operational costs could be realized by applying such lower post-disinfection dosages. Apart from the concept of post disinfection via classical disinfectants or advanced oxidation processes, an elegant approach could be to develop MBR-compatible functionalized membranes with anti-microbial coating. In addition to the safety of recycled water, it is highly important to ensure proper disposal or reuse of biosolids originating from MBR plants. Most wastewater virus studies report virus concentrations in influent and effluent, but because viruses tend to attach to solid surfaces, monitoring for enteroviruses in biosolids warrant careful consideration.

Acknowledgments

Faisal I. Hai acknowledges research grants from the University Research Committee and GeoQuEST Research Centre of University of Wollongong, Australia to carry out this work. Authors thank Luong N. Nguyen (University of Wollongong) for his assistance in editing schematics.

Author Contributions

Faisal I. Hai conceived and led the project and prepared the final manuscript in consultation with the co-authors. All co-authors contributed to particular sections.

Conflicts of Interest

The authors declare no conflict of interest.

References

  1. Hempel, S. John Snow. Lancet 2013, 381, 1269–1270. [Google Scholar] [CrossRef] [PubMed]
  2. Lofrano, G.; Brown, J. Wastewater management through the ages: A history of mankind. Sci. Total Environ. 2010, 408, 5254–5264. [Google Scholar] [CrossRef] [PubMed]
  3. Okoh, A.F.; Sibanda, T.; Gusha, S.S. Inadequately treated wastewater as a source of human enteric viruses in the environment. Int. J. Environ. Res. Public Health 2010, 7, 2620–2637. [Google Scholar] [CrossRef] [PubMed]
  4. Leverenz, H.L.; Leverenz, H.L.; Tchobanoglous, G.; Asano, T. Direct potable reuse: A future imperative. J. Water Reuse Desalin. 2011, 1, 2–10. [Google Scholar] [CrossRef]
  5. Hai, F.I.; Yamamoto, K.; Lee, C.-H. Membrane Biological Reactors: Theory, Modeling, Design, Management and Applications to Wastewater Reuse; The International Water Association (IWA) publishing: London, UK, 2014. [Google Scholar]
  6. Judd, S. The MBR Book: Principles and Applications of Membrane Bioreactors for Water and Wastewater Treatment, 2nd ed.; Butterworth-Heinemann: Oxford, UK, 2011. [Google Scholar]
  7. Gallucci, F.; Basile, A.; Hai, F.I. Introdcution—A Review of Membrane Reactors. In Membranes for Membrane Reactors: Preparation, Optimization and Selection; Basile, A., Gallucci, F., Eds.; John Wiley & Sons, Ltd: Oxford, UK, 2011; pp. 1–61. [Google Scholar]
  8. Hai, F.I.; Yamamoto, K.; Nakajima, F.; Fukushi, K. Recalcitrant Industrial Wastewater Treatment by Membrane Bioreactor (MBR). In Handbook of Membrane Research: Properties, Performance and Applications; Gorley, S.V., Ed.; Nova Science Publishers, Inc.: New York, NY, USA, 2010; pp. 67–97. [Google Scholar]
  9. Kraume, M.; Drews, A. Membrane bioreactors in waste water treatment—Status and trends. Chem. Eng. Technol. 2010, 33, 1251–1259. [Google Scholar] [CrossRef]
  10. Wisniewski, C. Membrane bioreactor for water reuse. Desalination 2007, 203, 15–19. [Google Scholar] [CrossRef]
  11. Chae, S.R.; Ahn, Y.; Hwang, Y.; Jang, D.; Meng, F.; Shi, J.; Lee, S.H.; Shin, H.S. Advanced Wastewater Treatment Using MBRs: Nutrient Removal and Disinfection. In Membrane Biological Reactors: Theory, Modeling, Design, Management and Applications to Wastewater Reuse; Hai, F.I., Yamamoto, K., Lee, C.-H., Eds.; IWA publishers: London, UK, 2014; pp. 137–163. [Google Scholar]
  12. Hai, F.I.; Yamamoto, K.; Fukushi, K. Hybrid treatment systems for dye wastewater. Crit. Rev. Environ. Sci. Technol. 2007, 37, 315–377. [Google Scholar] [CrossRef]
  13. Herath, G.; Yamamoto, K.; Urase, T. Removal of viruses by microfiltration membranes at different solution environments. Water Sci. Technol. 1999, 40, 331–338. [Google Scholar] [CrossRef]
  14. Xagoraraki, I.; Yin, Z.; Svambayev, Z. Fate of viruses in water systems. J. Environ. Eng. 2014, 140. [Google Scholar] [CrossRef]
  15. Lu, R.; Mosiman, D.; Nguyen, T.H. Mechanisms of MS2 bacteriophage removal by fouled ultrafiltration membrane subjected to different cleaning methods. Environ. Sci. Technol. 2013, 47, 13422–13429. [Google Scholar] [CrossRef] [PubMed]
  16. Antony, A.; Blackbeard, J.; Leslie, G. Removal efficiency and integrity monitoring techniques for virus removal by membrane processes. Crit. Rev. Environ. Sci. Technol. 2011, 42, 891–933. [Google Scholar] [CrossRef]
  17. Hirani, Z.M.; Bukhari, Z.; Oppenheimer, J.; Jjemba, P.; LeChevallier, M.W.; Jacangelo, J.G. Impact of MBR cleaning and breaching on passage of selected microorganisms and subsequent inactivation by free chlorine. Water Res. 2014, 57, 313–324. [Google Scholar] [CrossRef] [PubMed]
  18. Cabral, J.P.S. Water microbiology. Bacterial pathogens and water. Int. J. Environ. Res. Public Health 2010, 7, 3657–3703. [Google Scholar] [CrossRef] [PubMed]
  19. Toze, S. Microbial Pathogens in Wastewater; Literature Review for Urban Water Systems; Commonwealth Scientific and Industrial Research Organisation (CSIRO) Land and Water: Black Mountain, Australia, 1997. [Google Scholar]
  20. Bitton, G. Wastewater Microbiology, 4th ed.; Wiley-Blackwell: Hoboken, NJ, USA, 2010. [Google Scholar]
  21. Ottoson, J.; Hansen, A.; Bjorlenius, B.; Norder, H.; Stenstrom, T.A. Removal of viruses, parasitic protozoa and microbial indicators in conventional and membrane processes in a wastewater pilot plant. Water Res. 2006, 40, 1449–1457. [Google Scholar] [CrossRef] [PubMed]
  22. Zhang, K.; Farahbakhsh, K. Removal of native coliphages and coliform bacteria from municipal wastewater by various wastewater treatment processes: Implications to water reuse. Water Res. 2007, 41, 2816–2824. [Google Scholar] [CrossRef] [PubMed]
  23. Melnick, J.l.; Gerba, C.P.; Wallis, C. Viruses in water. Bull World Health Organ. 1978, 56, 499–508. [Google Scholar] [PubMed]
  24. Desselberger, U.; Gray, J. Viral gastroenteritis. Medicine 2009, 37, 594–598. [Google Scholar] [CrossRef]
  25. Guidelines for Water Reuse; U.S. Environmental Protection Agency: Washington, DC, USA, 2012.
  26. Chavez, A.; Jimenez, B.; Maya, C. Particle size distribution as a useful tool for microbial detection. Water Sci. Technol. 2004, 50, 179–186. [Google Scholar] [PubMed]
  27. Schijven, J.F.; Hassanizadeh, S.M. Removal of viruses by soil passage: Overview of modeling, processes, and parameters. Crit. Rev. Environ. Sci. Technol. 2000, 30, 49–127. [Google Scholar] [CrossRef]
  28. Fiksdal, L.; Leiknes, T. The effect of coagulation with MF/UF membrane filtration for the removal of virus in drinking water. J. Membr. Sci. 2006, 279, 364–371. [Google Scholar] [CrossRef]
  29. Comerton, A.M.; Andrews, R.C.; Bagley, D.M. Evaluation of an MBR-RO system to produce high quality reuse water: Microbial control, DBP formation and nitrate. Water Res. 2005, 39, 3982–3990. [Google Scholar] [CrossRef] [PubMed]
  30. Shang, C.; Wong, H.M.; Chen, G. Bacteriophage MS-2 removal by submerged membrane bioreactor. Water Res. 2005, 39, 4211–4219. [Google Scholar] [CrossRef] [PubMed]
  31. Zheng, X.; Liu, J. Virus rejection with two model human enteric viruses in membrane bioreactor system. Sci. China Ser. B 2007, 50, 397–404. [Google Scholar] [CrossRef]
  32. Lv, W.; Zheng, X.; Yang, M.; Zhang, Y.; Liu, Y.; Liu, J. Virus removal performance and mechanism of a submerged membrane bioreactor. Process Biochem. 2006, 41, 299–304. [Google Scholar] [CrossRef]
  33. Takashi, A.; Franklin, B.; Harold, L. Characteristics of Municipal Wastewater and Related Health and Environmental Issues. In Water Reuse: Issues, Technologies, and Applications; McGraw Hill Professional, Access Engineering: New York, NY, USA, 2007. [Google Scholar]
  34. Bennett, A. Drinking water: Pathogen removal from water—Technologies and techniques. Filtr. Sep. 2008, 45, 14–16. [Google Scholar] [CrossRef]
  35. Ramesh, A.; Lee, D.J.; Wang, M.L.; Hsu, J.P.; Juang, R.S.; Hwang, K.J.; Liu, J.C.; Tseng, S.J. Biofouling in membrane bioreactor. Sep. Sci. Technol. 2006, 41, 1345–1370. [Google Scholar] [CrossRef]
  36. Kuo, D.H.W.; Simmons, F.J.; Blair, S.; Hart, E.; Rose, J.B.; Xagoraraki, I. Assessment of human adenovirus removal in a full-scale membrane bioreactor treating municipal wastewater. Water Res. 2010, 44, 1520–1530. [Google Scholar] [CrossRef] [PubMed]
  37. Ottoson, J.; Hansen, A.; Westrell, T.; Johansen, K.; Norder, H.; Stenström, T.A. Removal of noro- and enteroviruses, Giardia cysts, Cryptosporidium oocysts, and fecal indicators at four secondary wastewater treatment plants in Sweden. Water Environ. Res. 2006, 78, 828–834. [Google Scholar] [CrossRef] [PubMed]
  38. Francy, D.S.; Stelzer, E.A.; Bushon, R.N.; Brady, A.M.G.; Williston, A.G.; Riddell, K.R.; Borchardt, M.A.; Spencer, S.K.; Gellner, T.M. Comparative effectiveness of membrane bioreactors, conventional secondary treatment, and chlorine and UV disinfection to remove microorganisms from municipal wastewaters. Water Res. 2012, 46, 4164–4178. [Google Scholar] [CrossRef] [PubMed]
  39. Adham, S.; Gagliardo, P.; Smith, D.; Ross, D.; Gramith, K.; Trussell, R. Monitoring the integrity of reverse osmosis membranes. Desalination 1998, 119, 143–150. [Google Scholar] [CrossRef]
  40. Jacangelo, J.G.; Madec, A.; Schwab, K.J.; Huffman, D.E.; Mysore, C.S. Advances in the use of low-pressure, hollow fiber membranes for the disinfection of water. Water Sci. Technol. Water Supply 2005, 5, 109–115. [Google Scholar]
  41. Langlet, J.; Ogorzaly, L.; Schrotter, J.C.; Machinal, C.; Gaboriaud, F.; Duval, J.F.L.; Gantzer, C. Efficiency of MS2 phage and Q(beta) phage removal by membrane filtration in water treatment: Applicability of real-time RT-PCR method. J. Membr. Sci. 2009, 326, 111–116. [Google Scholar] [CrossRef]
  42. Ueda, T.; Horan, N.J. Fate of indigenous bacteriophage in a membrane bioreactor. Water Res. 2000, 34, 2151–2159. [Google Scholar] [CrossRef]
  43. Krauth, K.; Staab, K.F. Pressurized bioreactor with membrane filtration for wastewater treatment. Water Res. 1993, 27, 405–411. [Google Scholar] [CrossRef]
  44. DeCarolis, J.F.; Adham, S. Performance investigation of membrane bioreactor systems during municipal wastewater reclamation. Water Environ. Res. 2007, 79, 2536–2550. [Google Scholar] [CrossRef] [PubMed]
  45. Simmons, F.J.; Kuo, D.H.W.; Xagoraraki, I. Removal of human enteric viruses by a full-scale membrane bioreactor during municipal wastewater processing. Water Res. 2011, 45, 2739–2750. [Google Scholar] [CrossRef] [PubMed]
  46. Cicek, N.; Franco, J.P.; Suidan, M.T.; Urbain, V. Using a membrane bioreactor to reclaim wastewater. Am. Water Works Assoc. J. 1998, 90, 105–105. [Google Scholar]
  47. Da Silva, A.; Le Saux, J.-C.; Parnaudeau, S.; Pommepuy, M.; Elimelech, M.; Le Guyader, F. Evaluation of removal of noroviruses during wastewater treatment, using real-time reverse transcription-PCR: Different behaviors of genogroups I and II. Water Res. 2007, 73, 7891–7897. [Google Scholar]
  48. Ellouze, M.; Saddoud, A.; Dhouib, A.; Sayadi, S. Assessment of the impact of excessive chemical additions to municipal wastewaters and comparison of three technologies in the removal performance of pathogens and toxicity. Microbiol. Res. 2009, 164, 138–148. [Google Scholar] [CrossRef] [PubMed]
  49. Zanetti, F.; de Luca, G.; Sacchetti, R. Performance of a full-scale membrane bioreactor system in treating municipal wastewater for reuse purposes. Bioresour. Technol. 2010, 101, 3768–3771. [Google Scholar] [CrossRef] [PubMed]
  50. Saddoud, A.; Ellouze, M.; Dhouib, A.; Sayadi, S. A Comparative study on the anaerobic membrane bioreactor performance during the treatment of domestic wastewaters of various origins. Environ. Technol. 2006, 27, 991–999. [Google Scholar] [CrossRef] [PubMed]
  51. Hirani, Z.M.; DeCarolis, J.F.; Adham, S.S.; Jacangelo, J.G. Peak flux performance and microbial removal by selected membrane bioreactor systems. Water Res. 2010, 44, 2431–2440. [Google Scholar] [CrossRef] [PubMed]
  52. Friedler, E.; Kovalio, R.; Ben-Zvi, A. Comparative study of the microbial quality of greywater treated by three on-site treatment systems. Environ. Technol. 2006, 27, 653–663. [Google Scholar] [CrossRef] [PubMed]
  53. Wong, K.; Xagoraraki, I.; Wallace, J.; Bickert, W.; Srinivasan, S.; Rose, J.B. Removal of viruses and indicators by anaerobic membrane bioreactor treating animal waste. J. Environ. Q. 2009, 38, 1694–1699. [Google Scholar] [CrossRef]
  54. Hirani, Z.M.; DeCarolis, J.F.; Lehman, G.; Adham, S.S.; Jacangelo, J.G. Occurrence and removal of microbial indicators from municipal wastewaters by nine different MBR systems. Water Sci. Technol. 2012, 66, 865–871. [Google Scholar] [CrossRef] [PubMed]
  55. Marti, E.; Monclus, H.; Jofre, J.; Rodriguez-Roda, I.; Comas, J.; Balcazar, J.L. Removal of microbial indicators from municipal wastewater by a membrane bioreactor (MBR). Bioresour. Technol. 2011, 102, 5004–5009. [Google Scholar] [CrossRef] [PubMed]
  56. Sima, L.C.; Schaeffer, J.; Le Saux, J.C.; Parnaudeau, S.; Elimelech, M.; Le Guyader, F.S. Calicivirus removal in a membrane bioreactor wastewater treatment plant. Appl. Environ. Microbiol. 2011, 77, 5170–5177. [Google Scholar] [CrossRef] [PubMed]
  57. Madaeni, S.S.; Fane, A.G.; Grohmann, G.S. Virus removal from water and wastewater using membranes. J. Membr. Sci. 1995, 102, 65–75. [Google Scholar] [CrossRef]
  58. Poyatos, J.M.; Molina-Munoz, M.; Moreno, B.; Gonzalez-Lopez, J.; Hontoria, E. Effect of the mixed liquor suspended solid on permeate in a membrane bioreactor system applied for the treatment of sewage mixed with wastewater of the milk from the dairy industry. J. Environ. Sci. Health Part A 2007, 42, 1005–1012. [Google Scholar] [CrossRef]
  59. Valderrama, C.; Ribera, G.; Bahi, N.; Rovira, M.; Gimenez, T.; Nomen, R.; Lluch, S.; Yuste, M.; Martinez-Llado, X. Winery wastewater treatment for water reuse purpose: Conventional activated sludge versus membrane bioreactor (MBR): A comparative case study. Desalination 2012, 306, 1–7. [Google Scholar] [CrossRef]
  60. Hewitt, J.; Leonard, M.; Greening, G.E.; Lewis, G.D. Influence of wastewater treatment process and the population size on human virus profiles in wastewater. Water Res. 2011, 45, 6267–6276. [Google Scholar] [CrossRef] [PubMed]
  61. Katayama, H.; Haramoto, E.; Oguma, K.; Yamashita, H.; Tajima, A.; Nakajima, H.; Ohgaki, S. One-year monthly quantitative survey of noroviruses, enteroviruses, and adenoviruses in wastewater collected from six plants in Japan. Water Res. 2008, 42, 1441–1448. [Google Scholar] [CrossRef] [PubMed]
  62. Haramoto, E.; Katayama, H.; Oguma, K.; Ohgaki, S. Quantitative analysis of human enteric adenoviruses in aquatic environments. J. Appl. Microbiol. 2007, 103, 2153–2159. [Google Scholar] [CrossRef] [PubMed]
  63. Simmons, F.J.; Xagoraraki, I. Release of infectious human enteric viruses by full-scale wastewater utilities. Water Res. 2011, 45, 3590–3598. [Google Scholar] [CrossRef] [PubMed]
  64. Aulicino, F.A.; Mastrantonio, A.; Orsini, P.; Bellucci, C.; Muscillo, M.; Larosa, G. Enteric viruses in a wastewater treatment plant in Rome. Water Air Soil Pollut. 1996, 91, 327–334. [Google Scholar] [CrossRef]
  65. Costán-Longares, A.; Mocé-Llivina, L.; Avellón, A.; Jofre, J.; Lucena, F. Occurrence and distribution of culturable enteroviruses in wastewater and surface waters of north-eastern Spain. J. Appl. Microbiol. 2008, 105, 1945–1955. [Google Scholar] [CrossRef] [PubMed]
  66. Lodder, W.J.; de Roda Husman, A.M. Presence of noroviruses and other enteric viruses in sewage and surface waters in The Netherlands. Appl. Environ. Microbiol. 2005, 71, 1453–1461. [Google Scholar] [CrossRef] [PubMed]
  67. Petrinca, A.R.; Donia, D.; Pierangeli, A.; Gabrieli, R.; Degener, A.M.; Bonanni, E.; Diaco, L.; Cecchini, G.; Anastasi, P.; Divizia, M. Presence and environmental circulation of enteric viruses in three different wastewater treatment plants. J. Appl. Microbiol. 2009, 106, 1608–1617. [Google Scholar] [CrossRef] [PubMed]
  68. Nordgren, J.; Matussek, A.; Mattsson, A.; Svensson, L.; Lindgren, P.E. Prevalence of norovirus and factors influencing virus concentrations during one year in a full-scale wastewater treatment plant. Water Res. 2009, 43, 1117–1125. [Google Scholar] [CrossRef] [PubMed]
  69. Gander, M.; Jefferson, B.; Judd, S. Membrane bioreactors for use in small wastewater treatment plants: Membrane materials and effluent quality. Water Sci. Technol. 2000, 205–211. [Google Scholar]
  70. Hu, J.Y.; Ong, S.L.; Song, L.F.; Feng, Y.Y.; Liu, W.T.; Tan, T.W.; Lee, L.Y.; Ng, W.J. Removal of MS2 bacteriophage using membrane technologies. Water Sci. Technol. 2003, 47, 163–168. [Google Scholar] [PubMed]
  71. Sakoda, A.; Sakai, Y.; Hayakawa, K.; Suzuki, M. Adsorption of viruses in water environment onto solid surfaces. Water Sci. Technol. 1997, 35, 107–114. [Google Scholar] [CrossRef]
  72. Madaeni, S.S. The application of membrane technology for water disinfection. Water Res. 1999, 33, 301–308. [Google Scholar] [CrossRef]
  73. Wu, J.; Li, H.; Huang, X. Indigenous somatic coliphage removal from a real municipal wastewater by a submerged membrane bioreactor. Water Res. 2010, 44, 1853–1862. [Google Scholar] [CrossRef] [PubMed]
  74. Pan, Z.; Zhao, F.; He, J.; Weng, S.; Wen, Q. Removal efficiency of the white spot syndrome virus in the membrane bioreactors. Environ. Sci. 2008, 29, 650–654. (In Chinese) [Google Scholar]
  75. Oh, B.S.; Jang, H.Y.; Jung, Y.J.; Kang, J.-W. Microfiltration of MS2 bacteriophage: Effect of ozone on membrane fouling. J. Membr. Sci. 2007, 306, 244–252. [Google Scholar] [CrossRef]
  76. Ravindran, V.; Tsai, H.-H.; Williams, M.D.; Pirbazari, M. Hybrid membrane bioreactor technology for small water treatment utilities: Process evaluation and primordial considerations. J. Membr. Sci. 2009, 344, 39–54. [Google Scholar] [CrossRef]
  77. Tam, L.S.; Tang, T.W.; Lau, G.N.; Sharma, K.R.; Chen, G.H. A pilot study for wastewater reclamation and reuse with MBR/RO and MF/RO systems. Desalination 2007, 202, 106–113. [Google Scholar] [CrossRef]
  78. Luo, W.; Hai, F.I.; Price, W.E.; Guo, W.; Ngo, H.H.; Yamamoto, K.; Nghiem, L.D. High retention membrane bioreactors: Challenges and opportunities. Bioresour. Technol. 2014, 167, 539–546. [Google Scholar] [CrossRef] [PubMed]
  79. Amin, M.T.; Alazba, A.A.; Manzoor, U. A Review of Removal of pollutants from water/wastewater using different types of nanomaterials. Adv. Mater. Sci. Eng. 2014, 2014, 825910: 1–825910: 24. [Google Scholar]
  80. Botes, M.; Eugene Cloete, T. The potential of nanofibers and nanobiocides in water purification. Crit. Rev. Microbiol. 2010, 36, 68–81. [Google Scholar] [CrossRef] [PubMed]
  81. Homaeigohar, S.; Elbahri, M. Nanocomposite electrospun nanofiber membranes for environmental remediation. Materials 2014, 7, 1017–1045. [Google Scholar] [CrossRef]
  82. Li, Q.; Mahendra, S.; Lyon, D.Y.; Brunet, L.; Liga, M.V.; Li, D.; Alvarez, P.J.J. Antimicrobial nanomaterials for water disinfection and microbial control: Potential applications and implications. Water Res. 2008, 42, 4591–4602. [Google Scholar] [CrossRef] [PubMed]
  83. Bhattacharyya, D. Functionalized membranes and environmental applications. Clean Technol. Environ. Policy 2007, 9, 81–83. [Google Scholar] [CrossRef]
  84. Jain, P.; Pradeep, T. Potential of silver nanoparticle-coated polyurethane foam as an antibacterial water filter. Biotechnol. Bioeng. 2005, 90, 59–63. [Google Scholar] [CrossRef] [PubMed]
  85. Damodar, R.A.; You, S.-J.; Chou, H.-H. Study the self cleaning, antibacterial and photocatalytic properties of TiO2 entrapped PVDF membranes. J. Hazard. Mater. 2009, 172, 1321–1328. [Google Scholar] [CrossRef] [PubMed]
  86. Ma, N.; Fan, X.; Quan, X.; Zhang, Y. Ag-TiO2/HAP/Al2O3 bioceramic composite membrane: Fabrication, characterization and bactericidal activity. J. Membr. Sci. 2009, 336, 109–117. [Google Scholar] [CrossRef]
  87. Zodrow, K.; Brunet, L.; Mahendra, S.; Li, D.; Zhang, A.; Li, Q.; Alvarez, P.J.J. Polysulfone ultrafiltration membranes impregnated with silver nanoparticles show improved biofouling resistance and virus removal. Water Res. 2009, 43, 715–723. [Google Scholar] [CrossRef] [PubMed]
  88. Mauter, M.S.; Wang, Y.; Okemgbo, K.C.; Osuji, C.O.; Giannelis, E.P.; Elimelech, M. Antifouling ultrafiltration membranes via post-fabrication grafting of biocidal nanomaterials. ACS Appl. Mater. Interf. 2011, 3, 2861–2868. [Google Scholar] [CrossRef]
  89. De Gusseme, B.; Hennebel, T.; Christiaens, E.; Saveyn, H.; Verbeken, K.; Fitts, J.P.; Boon, N.; Verstraete, W. Virus disinfection in water by biogenic silver immobilized in polyvinylidene fluoride membranes. Water Res. 2011, 45, 1856–1864. [Google Scholar] [CrossRef] [PubMed]
  90. Lee, S.Y.; Kim, H.J.; Patel, R.; Im, S.J.; Kim, J.H.; Min, B.R. Silver nanoparticles immobilized on thin film composite polyamide membrane: Characterization, nanofiltration, antifouling properties. Polym. Adv. Technol. 2007, 18, 562–568. [Google Scholar] [CrossRef]
  91. Yu, D.G.; Teng, M.Y.; Chou, W.L.; Yang, M.C. Characterization and inhibitory effect of antibacterial PAN-based hollow fiber loaded with silver nitrate. J. Membr. Sci. 2003, 225, 115–123. [Google Scholar] [CrossRef]
  92. Chou, W.-L.; Yu, D.-G.; Yang, M.-C. The preparation and characterization of silver-loading cellulose acetate hollow fiber membrane for water treatment. Polym. Adv. Technol. 2005, 16, 600–607. [Google Scholar] [CrossRef]
  93. Ma, H.; Hsiao, B.S.; Chu, B. Thin-film nanofibrous composite membranes containing cellulose or chitin barrier layers fabricated by ionic liquids. Polymer 2011, 52, 2594–2599. [Google Scholar] [CrossRef]
  94. Kim, S.J.; Nam, Y.S.; Rhee, D.M.; Park, H.-S.; Park, W.H. Preparation and characterization of antimicrobial polycarbonate nanofibrous membrane. Eur. Polym. J. 2007, 43, 3146–3152. [Google Scholar] [CrossRef]
  95. Tan, K.; Obendorf, S.K. Fabrication and evaluation of electrospun nanofibrous antimicrobial nylon 6 membranes. J. Membr. Sci. 2007, 305, 287–298. [Google Scholar] [CrossRef]
  96. Taurozzi, J.S.; Arul, H.; Bosak, V.Z.; Burban, A.F.; Voice, T.C.; Bruening, M.L.; Tarabara, V.V. Effect of filler incorporation route on the properties of polysulfone-silver nanocomposite membranes of different porosities. J. Membr. Sci. 2008, 325, 58–68. [Google Scholar] [CrossRef]
  97. Brady-Estévez, A.S.; Schnoor, M.H.; Kang, S.; Elimelech, M. SWNT-MWNT hybrid filter attains high viral removal and bacterial inactivation. Langmuir 2010, 26, 19153–19158. [Google Scholar] [CrossRef] [PubMed]
  98. Vecitis, C.D.; Schnoor, M.H.; Rahaman, M.S.; Schiffman, J.D.; Elimelech, M. Electrochemical multiwalled carbon nanotube filter for viral and bacterial removal and inactivation. Environ. Sci. Technol. 2011, 45, 3672–3679. [Google Scholar] [CrossRef] [PubMed]
  99. Hai, F.I.; Yamamoto, K.; Nakajima, F.; Fukushi, K. Application of a GAC-coated hollow fiber module to couple enzymatic degradation of dye on membrane to whole cell biodegradation within a membrane bioreactor. J. Membr. Sci. 2012, 389, 67–75. [Google Scholar] [CrossRef]
  100. Hai, F.I.; Yamamoto, K.; Nakajima, F.; Fukushi, K.; Nghiem, L.D.; Price, W.E.; Jin, B. Degradation of azo dye acid orange 7 in a membrane bioreactor by pellets and attached growth of Coriolus versicolour. Bioresour. Technol. 2013, 141, 29–34. [Google Scholar] [CrossRef] [PubMed]
  101. Gander, M.; Jefferson, B.; Judd, S. Aerobic MBRs for domestic wastewater treatment: A review with cost considerations. Sep. Purif. Technol. 2000, 18, 119–130. [Google Scholar] [CrossRef]
  102. Jiang, T.; Kennedy, M.D.; van der Meer, W.G.J.; Vanrolleghem, P.A.; Schippers, J.C. The role of blocking and cake filtration in MBR fouling. Desalination 2003, 157, 335–343. [Google Scholar] [CrossRef]
  103. Hai, F.I.; Li, X.; Price, W.E.; Nghiem, L.D. Removal of carbamazepine and sulfamethoxazole by MBR under anoxic and aerobic conditions. Bioresour. Technol. 2011, 102, 10386–10390. [Google Scholar] [CrossRef] [PubMed]
  104. Semblante, G.U.; Hai, F.I.; Ngo, H.H.; Guo, W.; You, S.-J.; Price, W.E.; Nghiem, L.D. Sludge cycling between aerobic, anoxic and anaerobic regimes to reduce sludge production during wastewater treatment: Performance, mechanisms, and implications. Bioresour. Technol. 2014, 155, 395–409. [Google Scholar] [CrossRef] [PubMed]
  105. Nguyen, T.; Roddick, F.; Fan, L. Biofouling of Water Treatment Membranes: A review of the underlying causes, monitoring techniques and control measures. Membranes 2012, 2, 804–840. [Google Scholar] [CrossRef] [PubMed]
  106. Hai, F.I.; Yamamoto, K.; Fukushi, K.; Nakajima, F. Fouling resistant compact hollow-fiber module with spacer for submerged membrane bioreactor treating high strength industrial wastewater. J. Membr. Sci. 2008, 317, 34–42. [Google Scholar] [CrossRef]
  107. Farahbakhsh, K.; Smith, D.W. Removal of coliphages in secondary effluent by microfiltration—Mechanisms of removal and impact of operating parameters. Water Res. 2004, 38, 585–592. [Google Scholar] [CrossRef] [PubMed]
  108. Liu, Q.; Zhou, Y.; Chen, L.; Zheng, X. Application of MBR for hospital wastewater treatment in China. Desalination 2010, 250, 605–608. [Google Scholar] [CrossRef]
  109. Jacangelo, J.G.; Adham, S.S.; Laine, J.M. Mechanism of Cryptosporidium, Giardia, and MS2 virus removal by MF and UF. J. Am. Water Works Assoc. 1995, 87, 107–121. [Google Scholar]
  110. Childress, A.E.; Le-Clech, P.; Daugherty, J.L.; Chen, C.; Leslie, G.L. Mechanical analysis of hollow fiber membrane integrity in water reuse applications. Desalination 2005, 180, 5–14. [Google Scholar] [CrossRef]
  111. Simon, A.; McDonald, J.A.; Khan, S.J.; Price, W.E.; Nghiem, L.D. Effects of caustic cleaning on pore size of nanofiltration membranes and their rejection of trace organic chemicals. J. Membr. Sci. 2013, 447, 153–162. [Google Scholar] [CrossRef]
  112. Huisman, I.H.; Williams, K. Autopsy and failure analysis of ultrafiltration membranes from a waste-water treatment system. Desalination 2004, 165, 161–164. [Google Scholar] [CrossRef]
  113. Jacangelo, J.G.; Laine, J.M.; Cummings, E.L.; Adham, S.S. Low-pressure membrane filtration for removing giardia and microbial indicators. J. Am. Water Works Assoc. 1991, 83, 97–106. [Google Scholar]
  114. Urase, T.; Yamamoto, K.; Ohkagi, S. Effect of pore size distribution of ultrafiltration membranes on virus rejection in crossflow conditions. Water Sci. Technol. 1994, 30, 199–208. [Google Scholar]
  115. Urase, T.; Yamamoto, K.; Ohkagi, S. Effect of pore structure of membranes and module configuration on virus retention. J. Membr. Sci. 1996, 115, 21–29. [Google Scholar] [CrossRef]
  116. Zha, F.; Kippax, V.; Phelps, R.; Nguyen, T. Integrity Monitoring for Membrane Bioreactor Systems through Turbidity and SDI Measurement. In Proceedings of the International Congress on Membranes and Membrane Processes, Honolulu, HI, USA, 12–18 July 2008.
  117. Lazarova, V.; Savoye, P.; Janex, M.; Blatchley, E., III; Pommepuy, M. Advanced wastewater disinfection technologies: State of the art and perspectives. Water Sci. Technol. 1999, 40, 203–213. [Google Scholar] [CrossRef]
  118. Mezzanotte, V.; Antonelli, M.; Citterio, S.; Nurizzo, C. Wastewater disinfection alternatives: Chlorine, ozone, peracetic acid, and UV light. Water Environ. Res. 2007, 79, 2373–2379. [Google Scholar] [CrossRef] [PubMed]
  119. Natvik, O.; Zaghi, E.; Todd, R. Disinfection after MBR ultra-filtration membranes—Is it needed? Proc. Water Environ. Fed. 2009, 2009, 1212–1216. [Google Scholar] [CrossRef]
  120. Friedler, E.; Gilboa, Y. Performance of UV disinfection and the microbial quality of greywater effluent along a reuse system for toilet flushing. Sci. Total Environ. 2010, 408, 2109–2117. [Google Scholar] [CrossRef] [PubMed]
  121. Mansell, B.; Huitric, S.-J.; Munakata, N.; Kuo, J.; Tang, C.-C.; Ackman, P.; Friess, P.L.; Maguin, S. Free chlorine disinfection of membrane bioreactor permeate: Disinfection efficacies, disinfection byproducts, and selected microcontaminants. Proc. Water Environ. Fed. 2009, 2009, 699–719. [Google Scholar] [CrossRef]
  122. Li, X.-Y.; Chu, H.P. Membrane bioreactor for the drinking water treatment of polluted surface water supplies. Water Res. 2003, 37, 4781–4791. [Google Scholar] [CrossRef] [PubMed]
  123. Jemba, P.K.; Weinrich, L.A.; Cheng, W.; Giraldo, E.; LeChevallier, M.W. Regrowth of potential opportunistic pathogens and algae in reclaimed-water distribution systems. Appl. Environ. Microbiol. 2010, 76, 4169–4178. [Google Scholar] [CrossRef] [PubMed]
  124. Thayanukul, P.; Kurisu, F.; Kasuga, I.; Furumai, H. Evaluation of microbial regrowth potential by assimilable organic carbon in various reclaimed water and distribution systems. Water Res. 2013, 47, 225–232. [Google Scholar] [CrossRef] [PubMed]
  125. Jebri, S.; Jofre, J.; Barkallah, I.; Saidi, M.; Hmaied, F. Presence and fate of coliphages and enteric viruses in three wastewater treatment plants effluents and activated sludge from Tunisia. Environ. Sci. Pollut Res. 2012, 19, 2195–2201. [Google Scholar] [CrossRef]
  126. Wu, J.; Long, S.C.; Das, D.; Dorner, S.M. Are microbial indicators and pathogens correlated? A statistical analysis of 40 years of research. Anglais 2011, 9, 265–278. [Google Scholar]
  127. De Luca, G.; Sacchetti, R.; Leoni, E.; Zanetti, F. Removal of indicator bacteriophages from municipal wastewater by a full-scale membrane bioreactor and a conventional activated sludge process: Implications to water reuse. Bioresour. Technol. 2013, 129, 526–531. [Google Scholar] [CrossRef] [PubMed]

