Hydrologic Simulations Driven by Satellite Rainfall to Study the Hydroelectric Development Impacts on River Flow

Abstract
:1. Introduction
2. Simulation Methodology
2.1. Study Area

2.2. The SWAT Model
2.3. Input Data
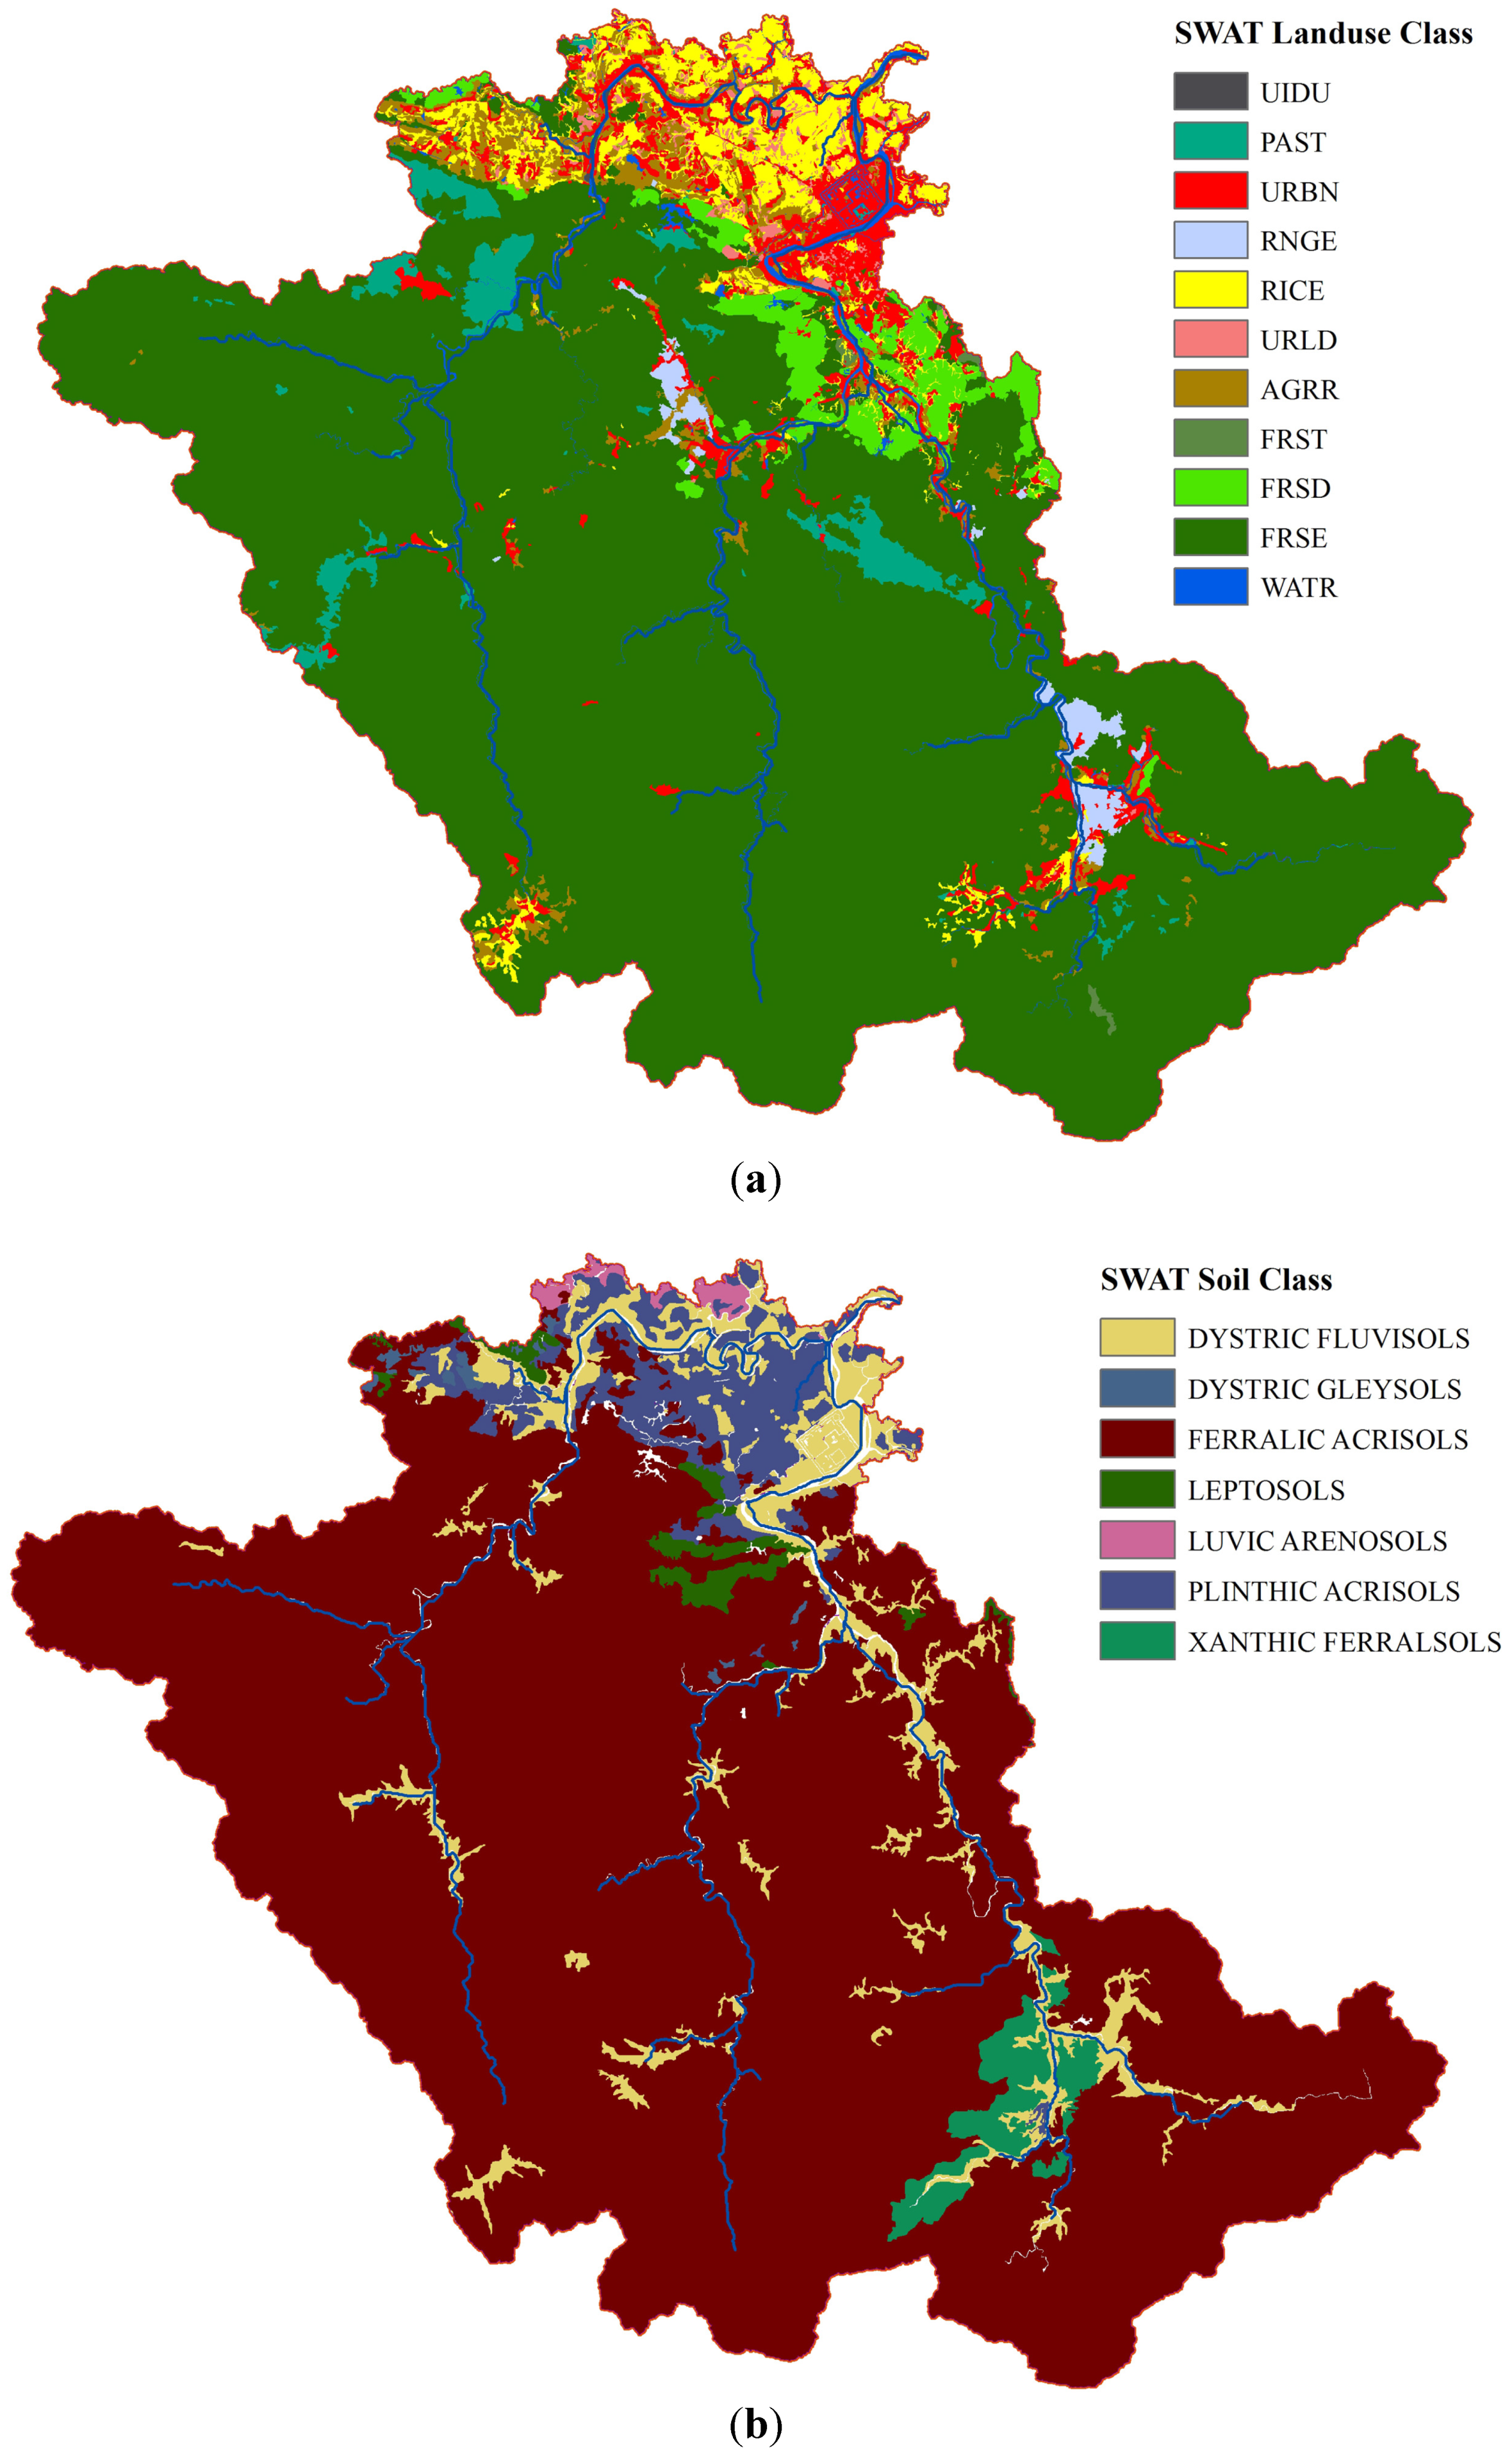
2.3.1. Geographic Data


| Components and Parameters | Soil Name | |||||||
|---|---|---|---|---|---|---|---|---|
| Dystric Fluvisols | Dystric Gleysols | Ferralic Acrisols | Leptosols | Luvic Arenosols | Plinthic Acrisols | Xanthic Ferralsols | ||
| Hydrologic Group | C | C | B | B | A | C | D | |
| Water Capacity (mm H2O/mm Soil) | 0.16 | 0.18 | 0.14 | 0.12 | 0.07 | 0.14 | 0.14 | |
| Hydraulic Conductivity (mm/h) | 16.0 | 0.9 | 13.0 | 27.0 | 400.0 | 28.0 | 14.0 | |
| Top Soil Layer | % Clay | 25.0 | 58.5 | 22.5 | 24.0 | 5.0 | 27.0 | 38.2 |
| % Silt | 36.48 | 25.65 | 14.81 | 15.02 | 1.48 | 16.16 | 7.8 | |
| % Sand | 37.04 | 15.85 | 58.69 | 56.98 | 93.52 | 55.46 | 51.2 | |
| % Rock | 1.48 | 0.0 | 4.0 | 4.0 | 0.0 | 1.38 | 2.8 | |
| Sub Soil Layer | % Clay | 28.4 | 48.2 | 33.6 | 26.0 | 5.5 | 36.34 | 45.0 |
| % Silt | 36.7 | 18.0 | 11.9 | 16.0 | 2.9 | 16.64 | 5.9 | |
| % Sand | 33.4 | 33.8 | 51.5 | 55.0 | 91.6 | 45.64 | 46.4 | |
| % Rock | 1.5 | 0.0 | 3.0 | 3.0 | 0.0 | 1.38 | 2.7 | |
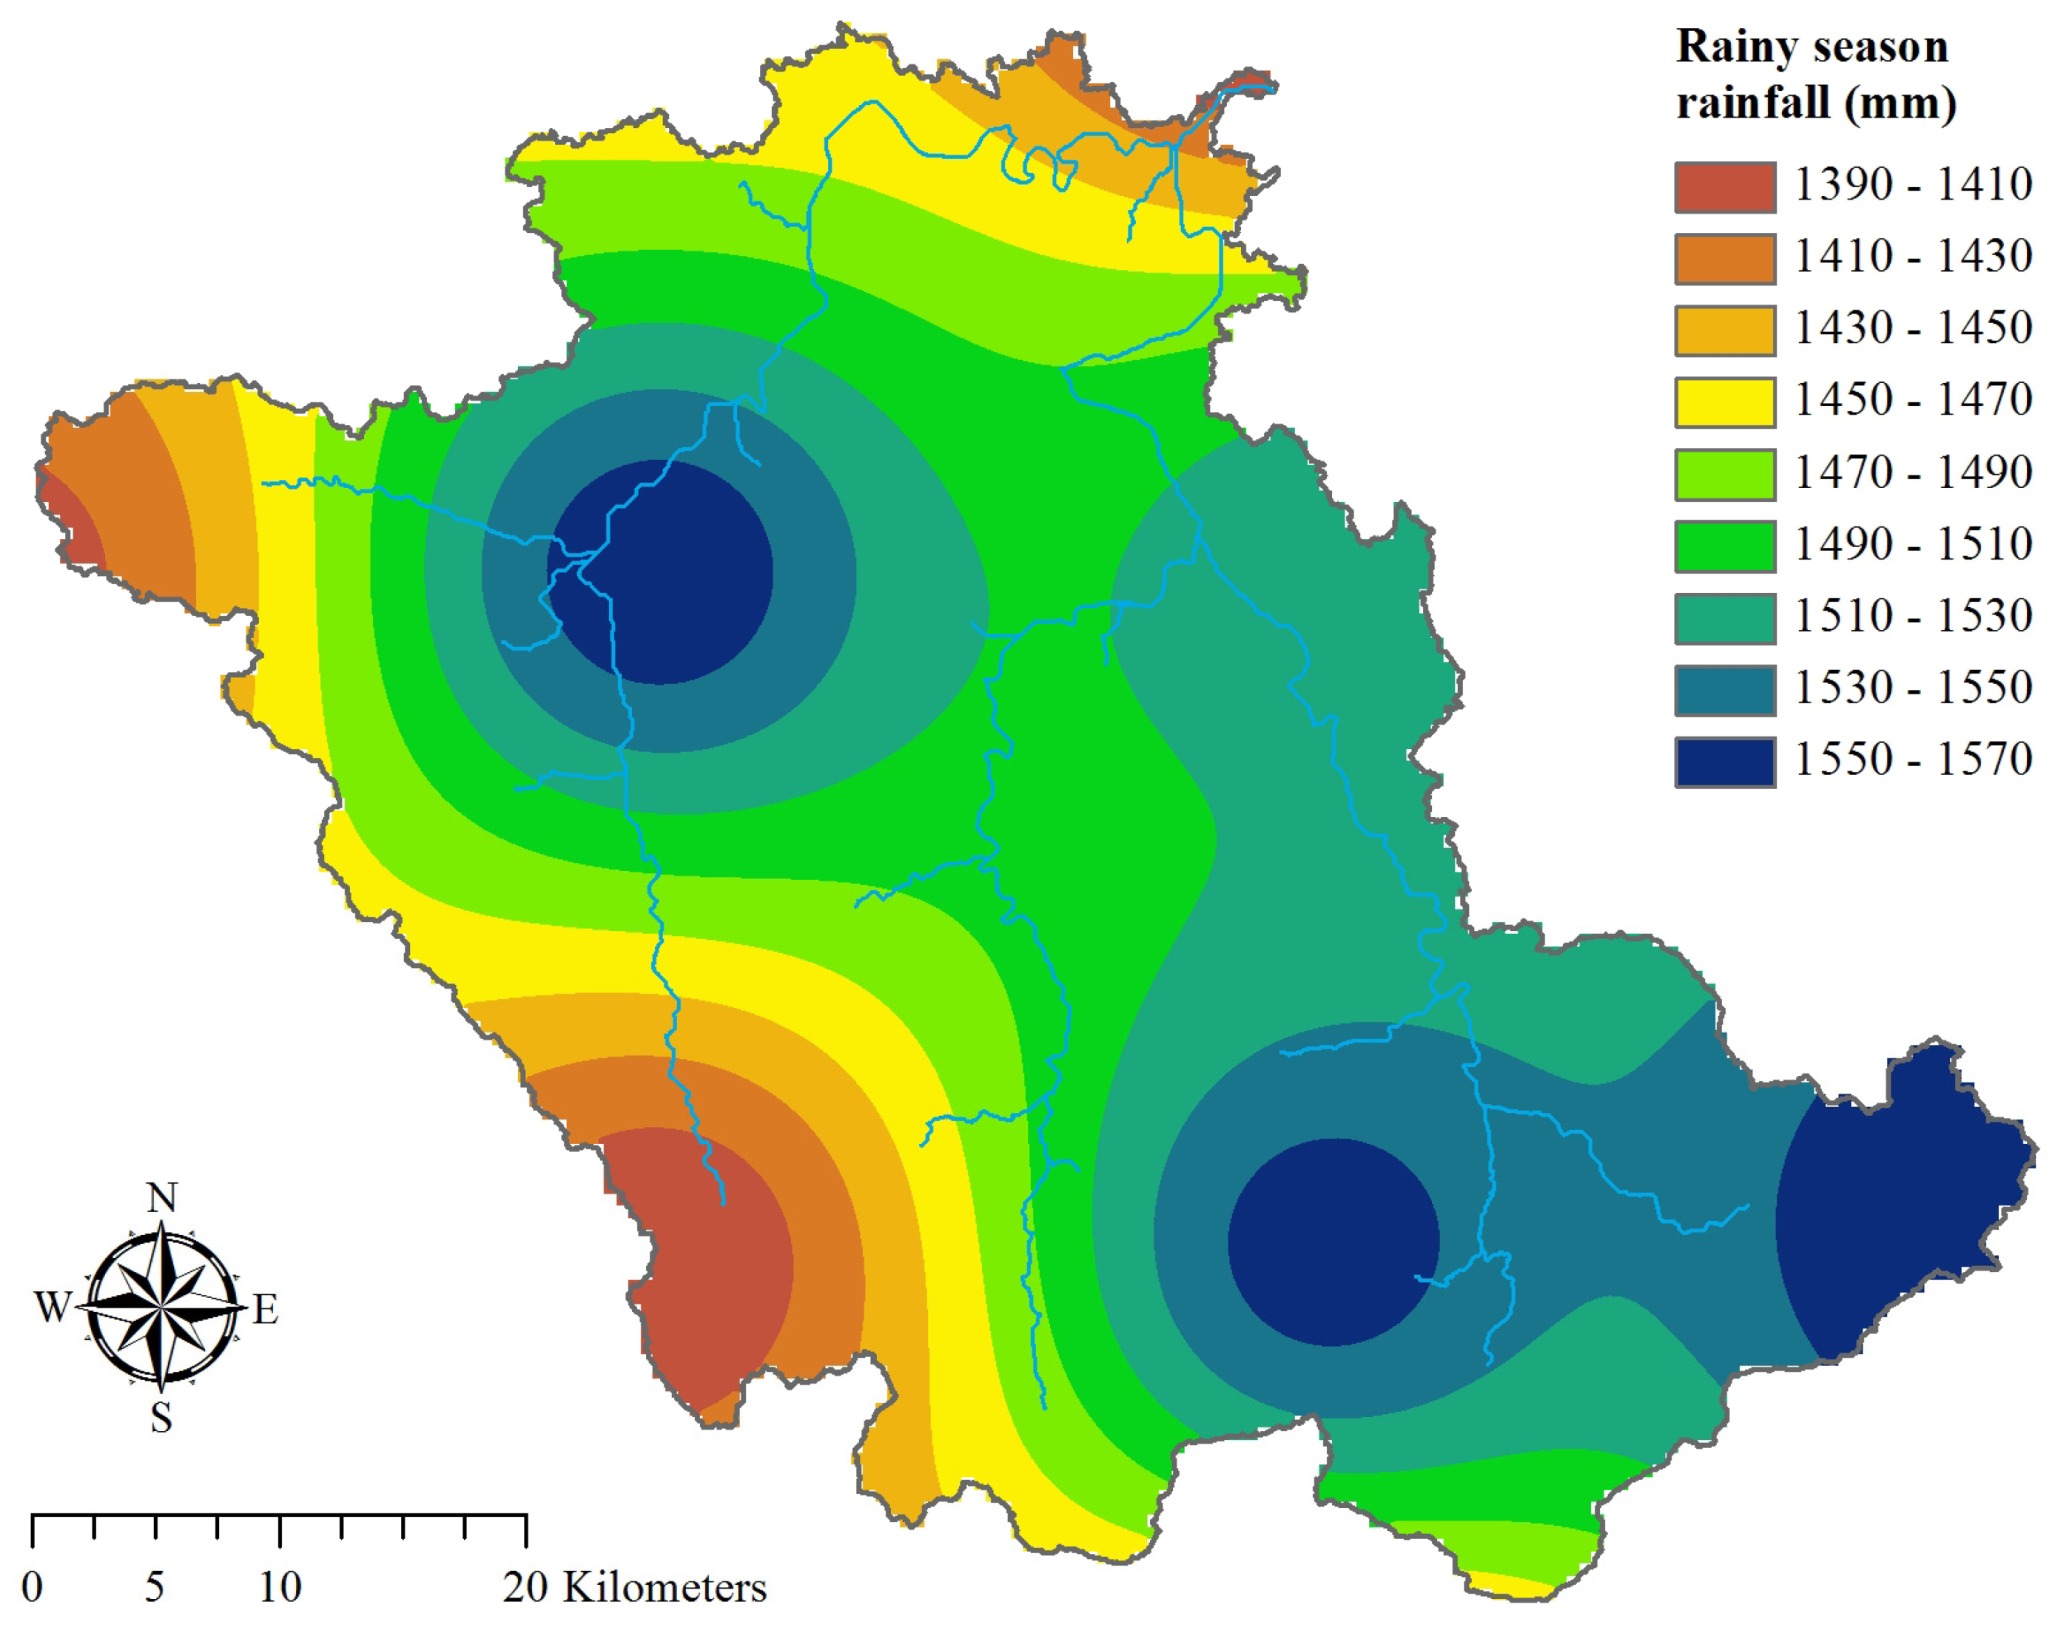
2.3.2. Meteorological Data


2.4. Discharge and TSS Data
2.5. SWAT Model Simulations
2.6. Model Calibration

| Station | Discharge Simulation | |
|---|---|---|
| NSE (≤1) | r (0–1) | |
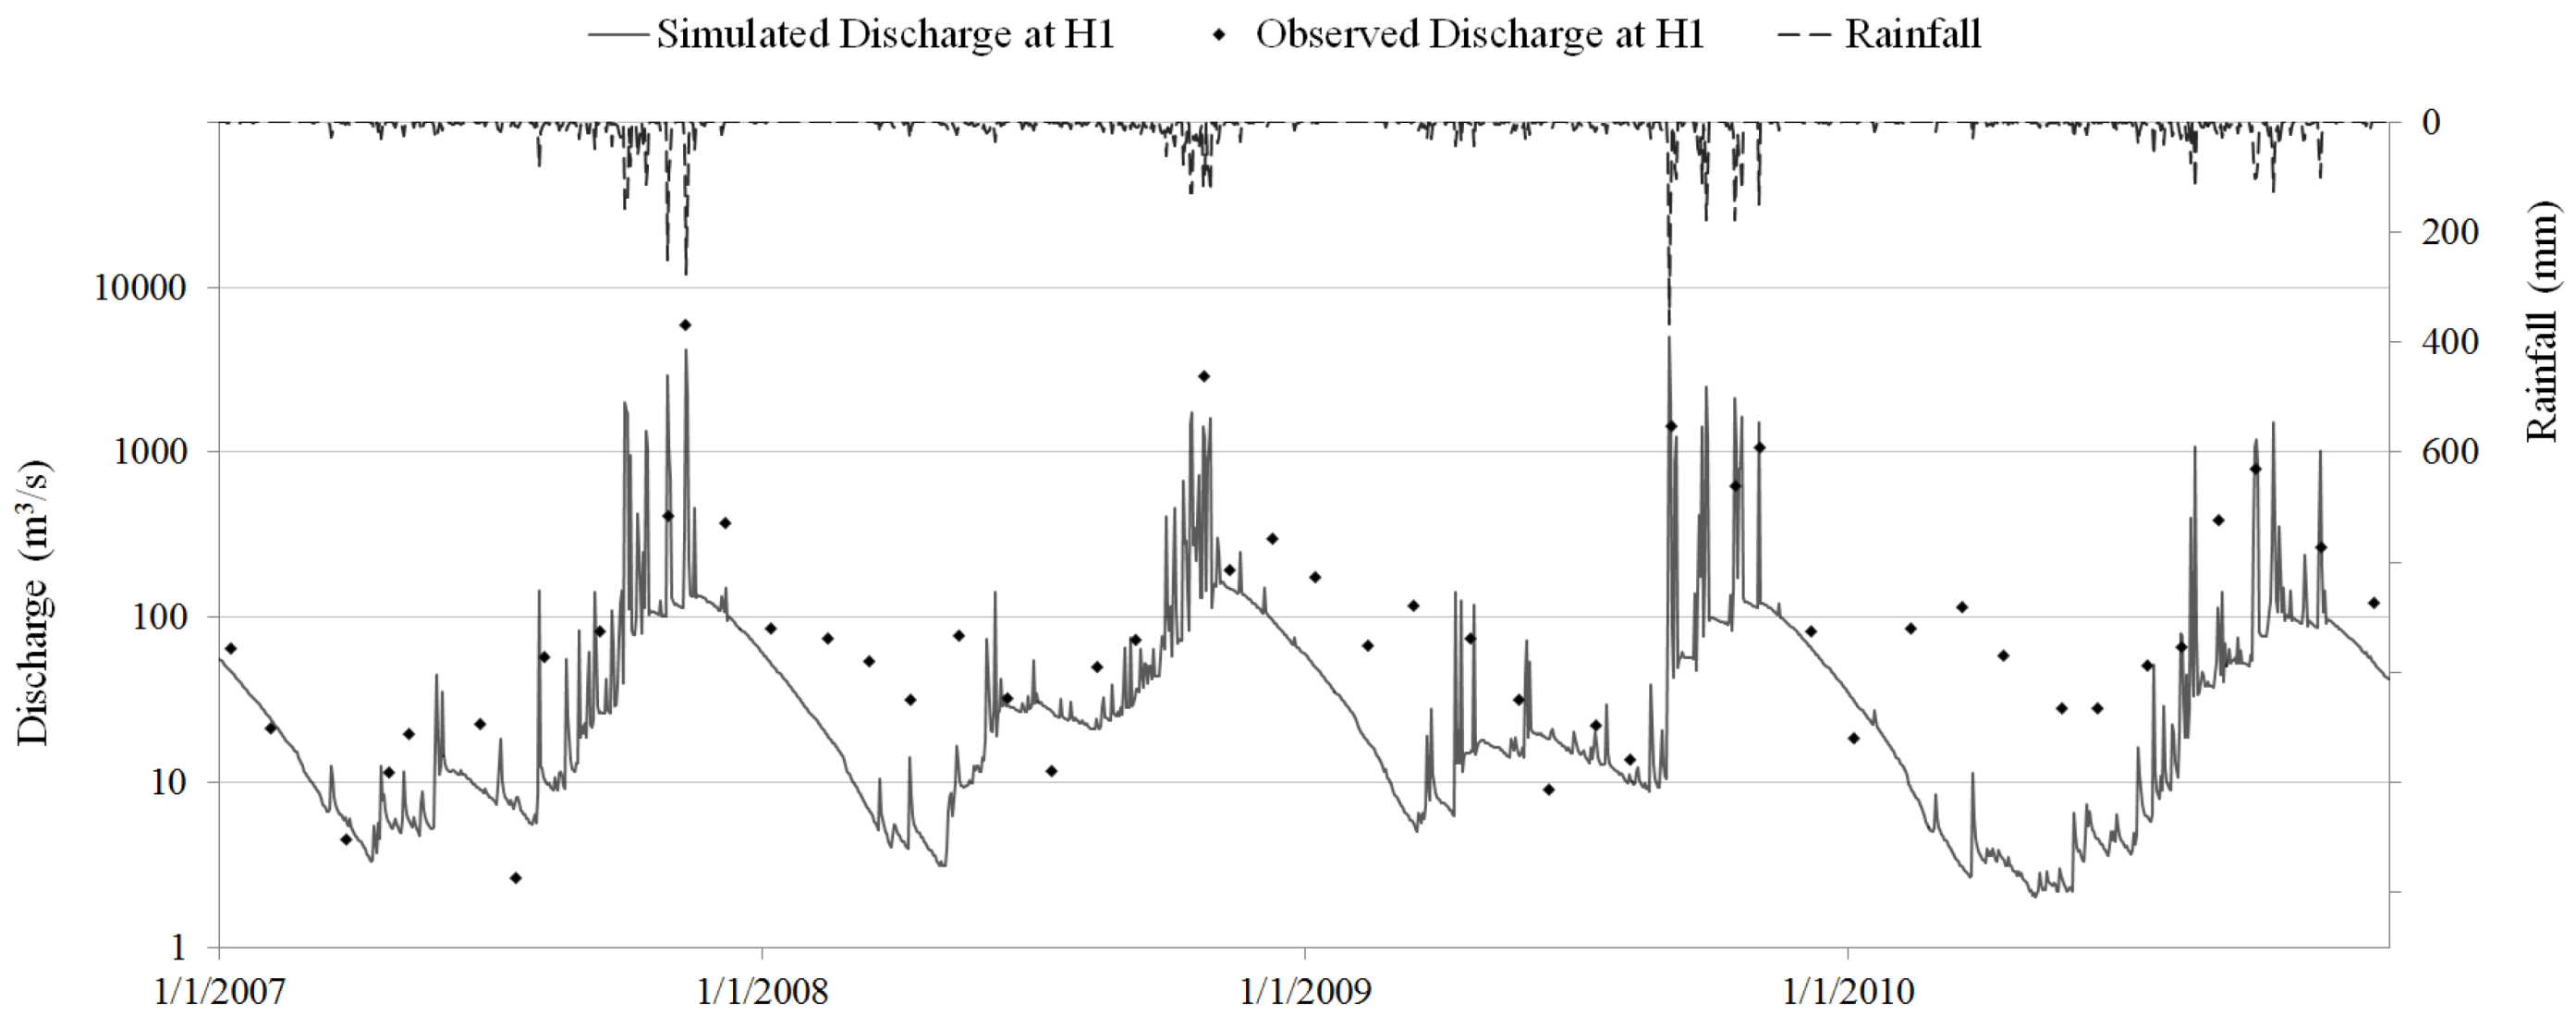
| H1 (Calibration) | 0.67 | 0.82 |
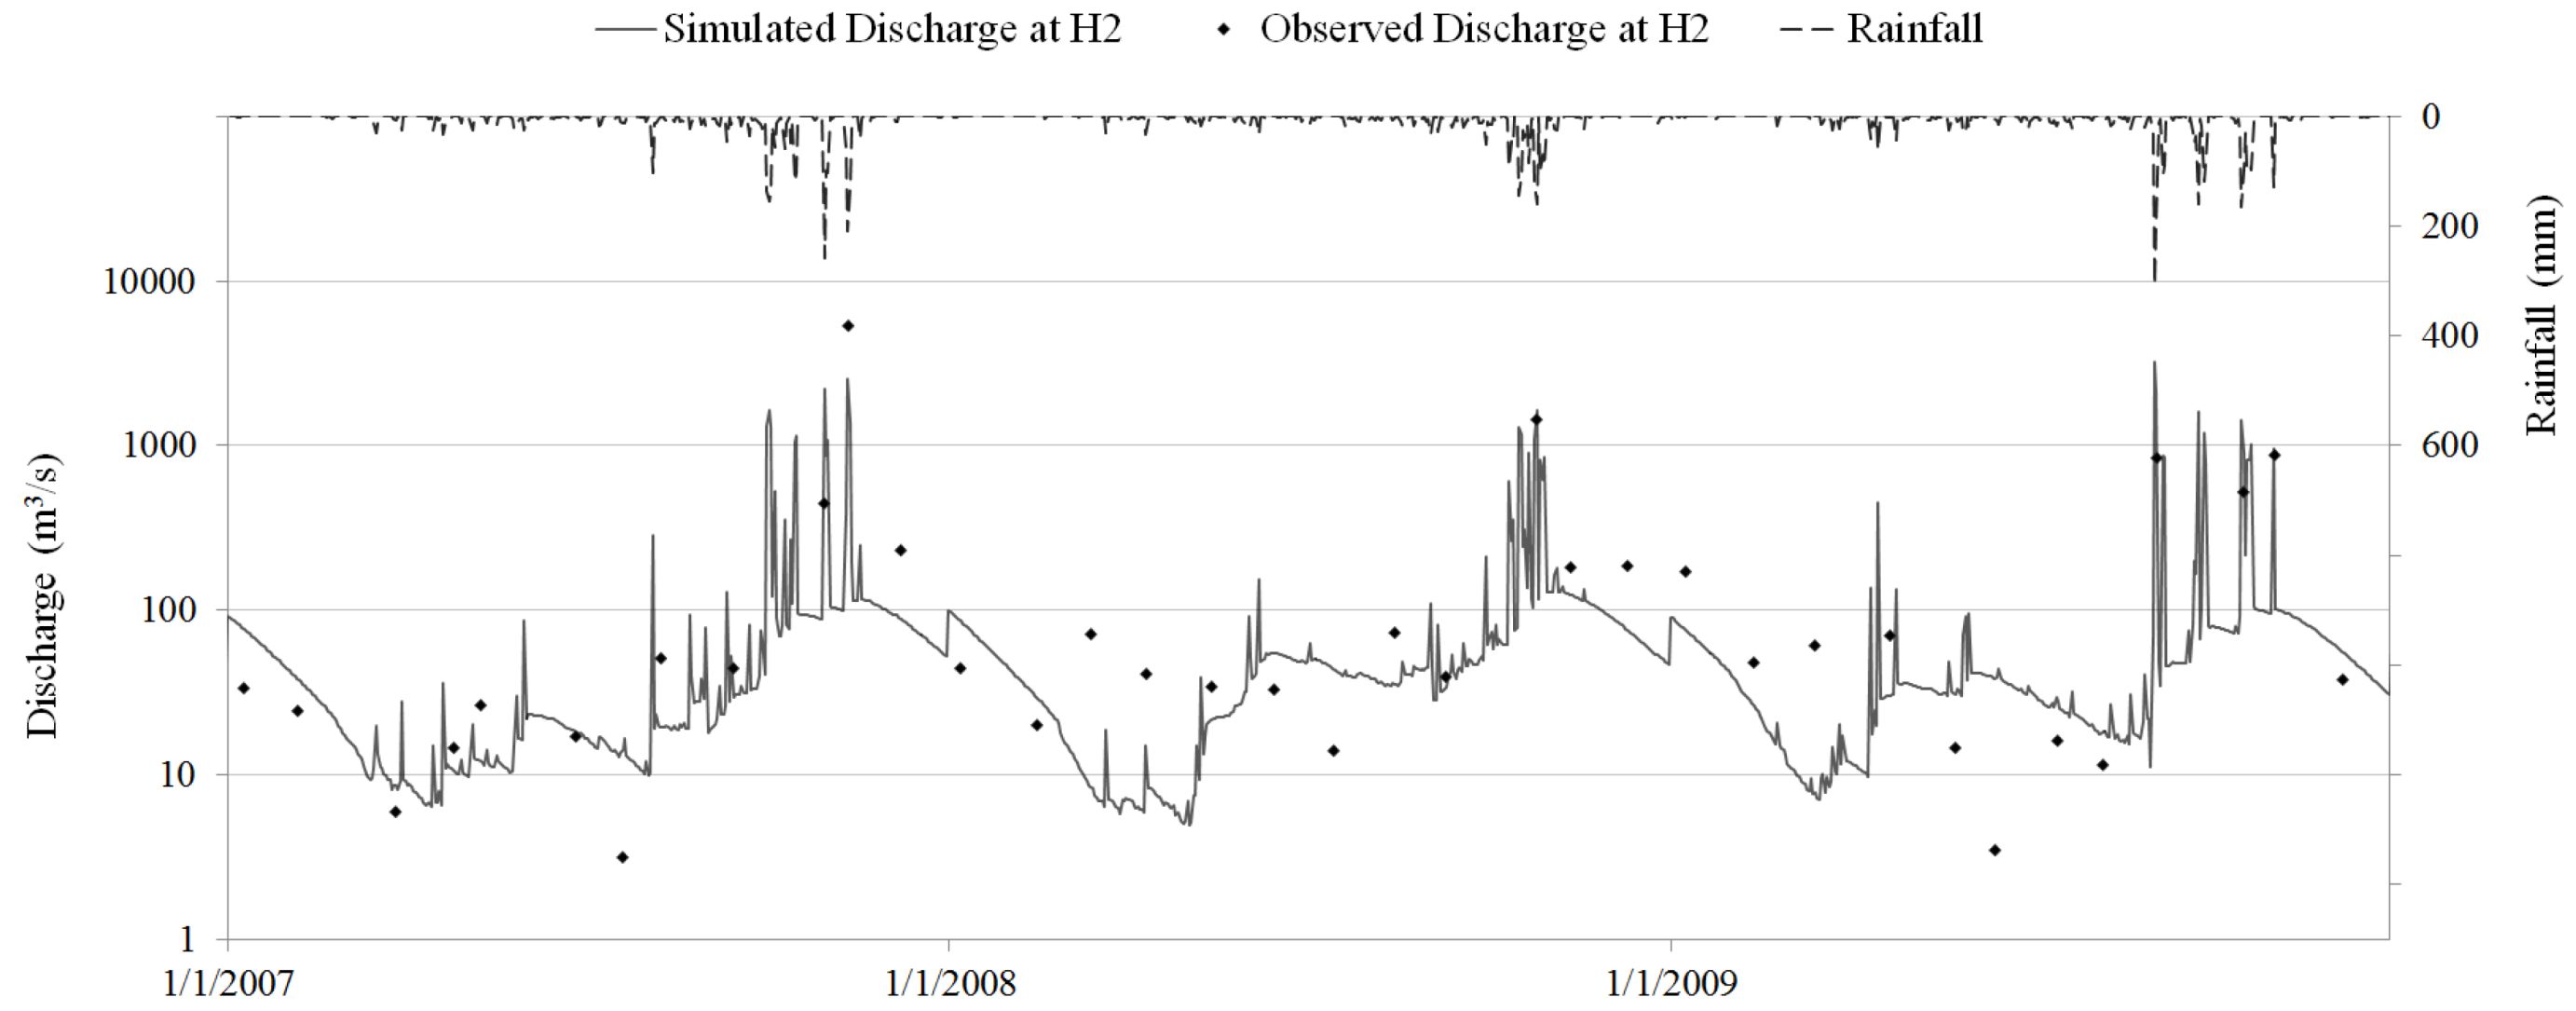
| H2 (Validation) | 0.54 | 0.74 |
| H10 (Validation) | 0.57 | 0.77 |

| Station | TSS Simulation | |
|---|---|---|
| NSE (≤1) | R (0–1) | |
| H1 (Calibration) | 0.46 | 0.71 |
| H2 (Validation) | 0.36 | 0.62 |
| H10 (Validation) | 0.41 | 0.64 |
| Calibration | Calibrated Model Parameters | Calibrated Values | |
|---|---|---|---|
| Parameters | Definitions (Unit) | ||
| Discharge | CH_N2 | Manning’s N value for stream channels | 0.035 |
| CN2 | SCS curve number | 42.00–97.00 | |
| SOL_K | Soil hydraulic conductivity (mm/h) | 0.318–690.0 | |
| SOL_AWC | Available water capacity of the soil (mm/mm) | 0.075–0.315 | |
| ALPHA_BF | Base flow alpha factor (days) | 0.25 | |
| GW_REVAP | Groundwater “revap” coefficient | 0.02 | |
| ESCO | Soil evaporation compensation factor | 1.0 | |
| Total Suspended Solids | PRF | Peak rate adjustment factor for sediment routing | 0.65 |
| USLE_P | USLE support practice factor | 0.35 | |
| SPEXP | Exponent parameter for calculating the channel sediment routing | 1.6 | |
| SLOPE | Average slope steepness (m/m) | 0.027–0.573 | |
3. Results and Discussion
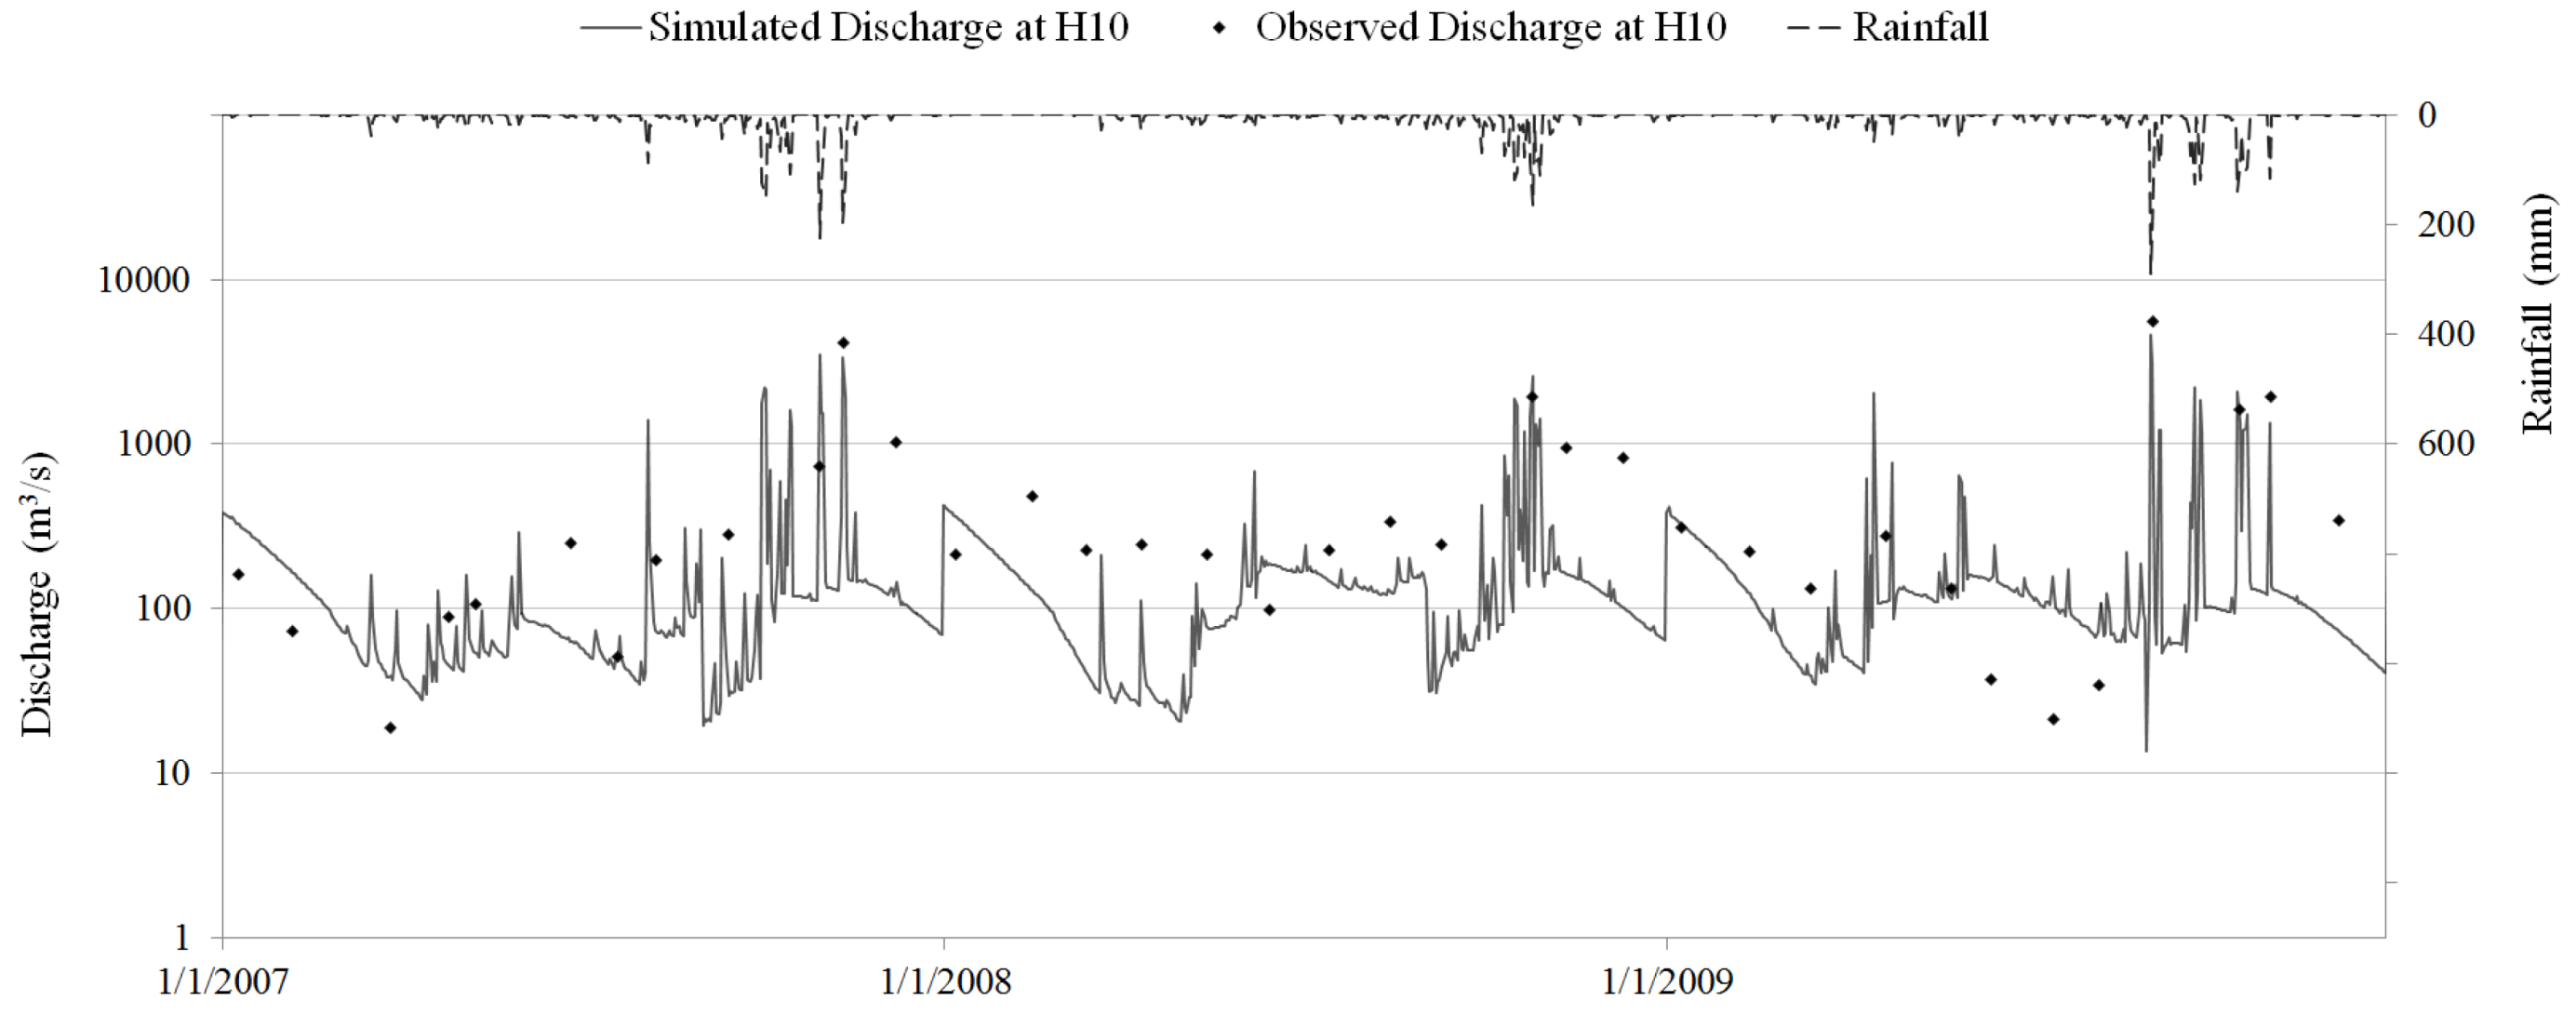
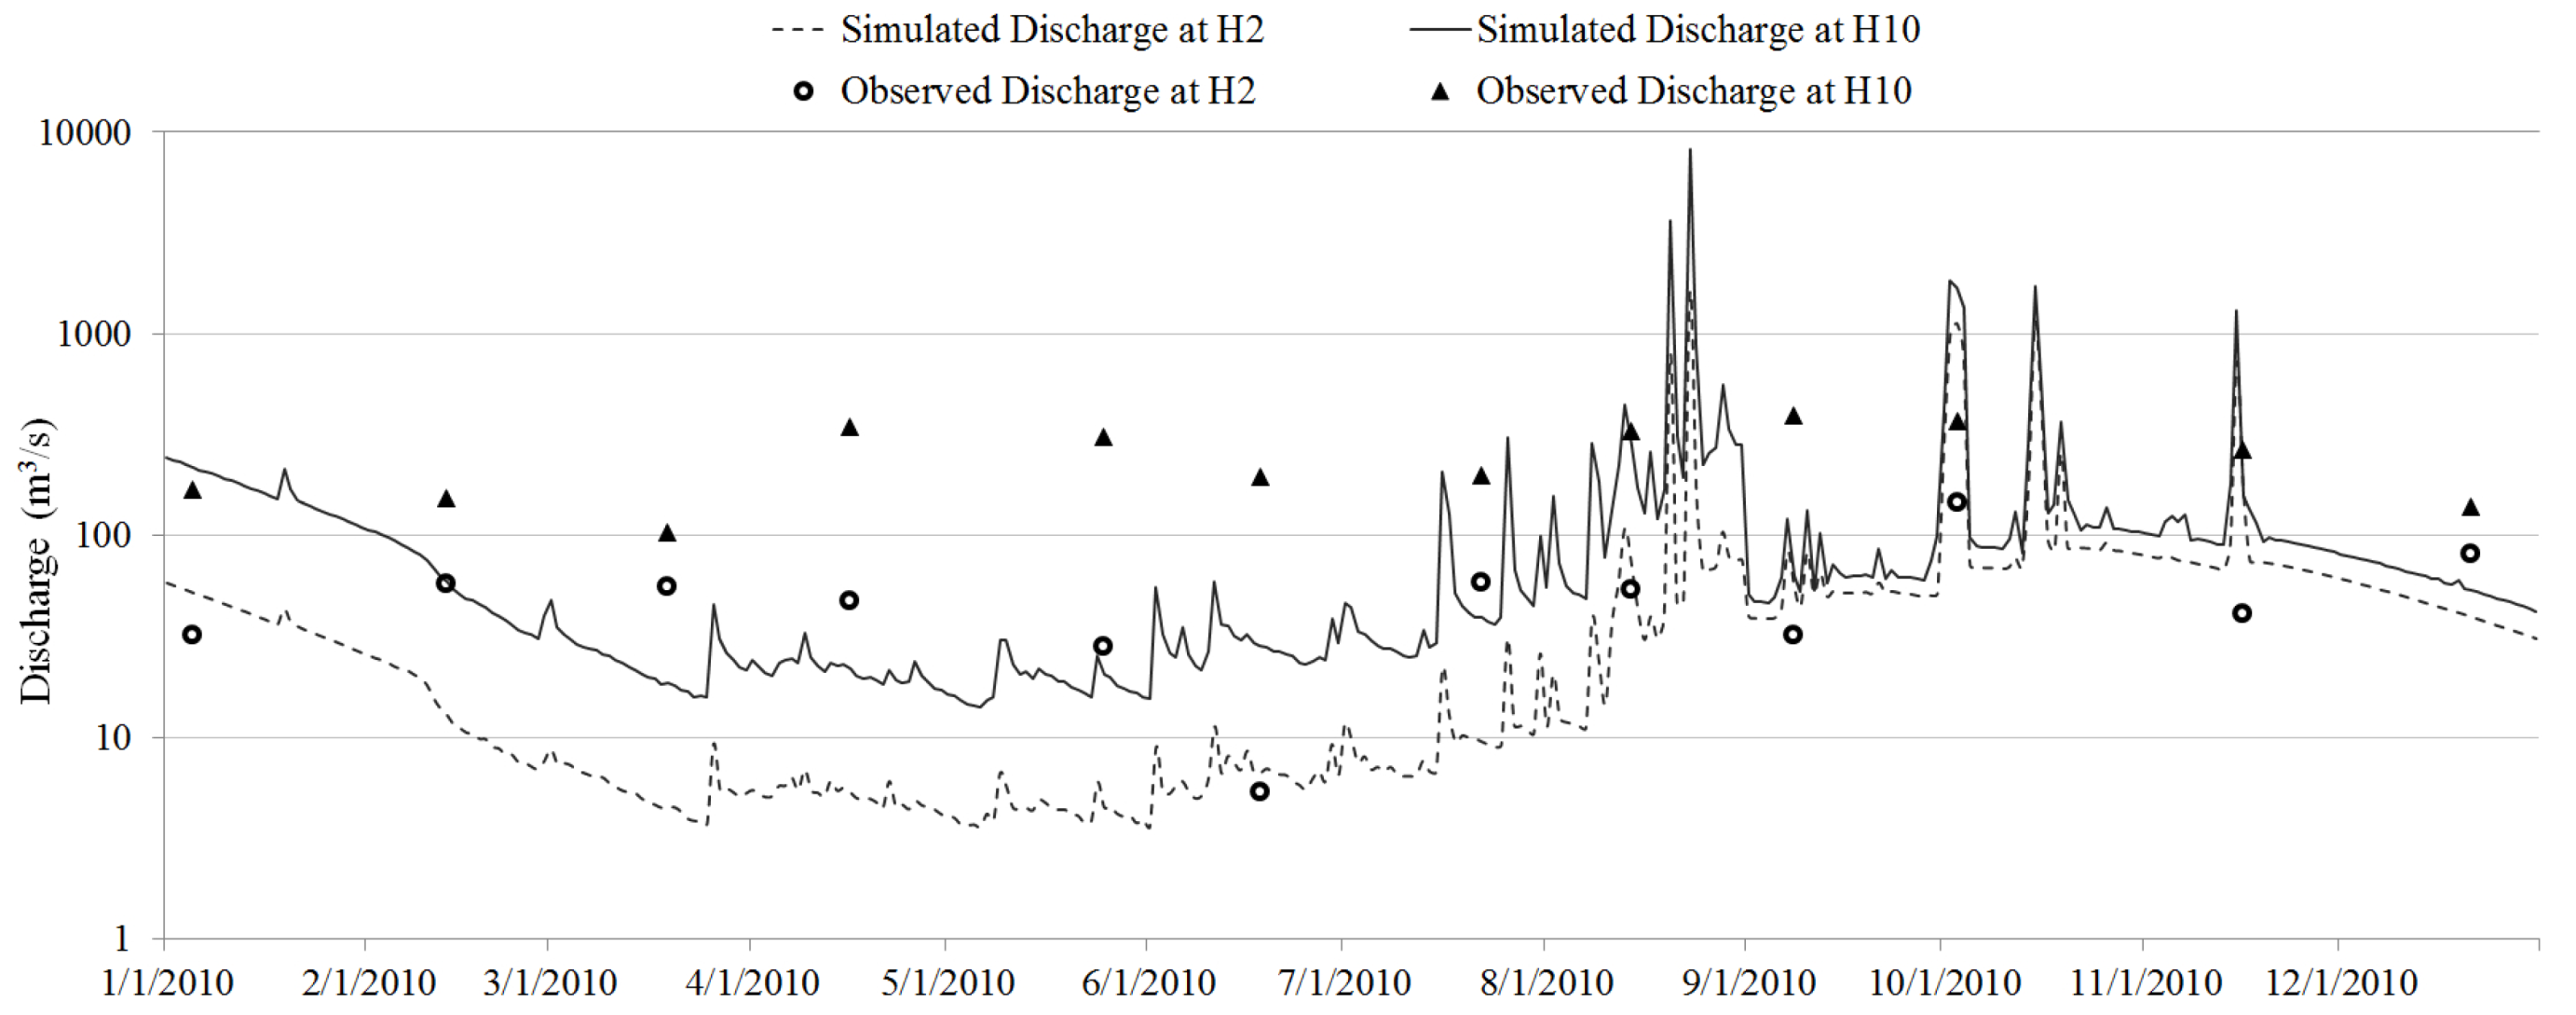
3.1. Discharge Simulations


3.2. Dam Impact on River Discharge

| Change in 2010 | Discharge | Sediment Load | ||
|---|---|---|---|---|
| H2 | H10 | H2 | H10 | |
| Dry season | 226% | 90% | 158% | 51% |
| Rainy season | −35% | −14% | −55% | −28% |
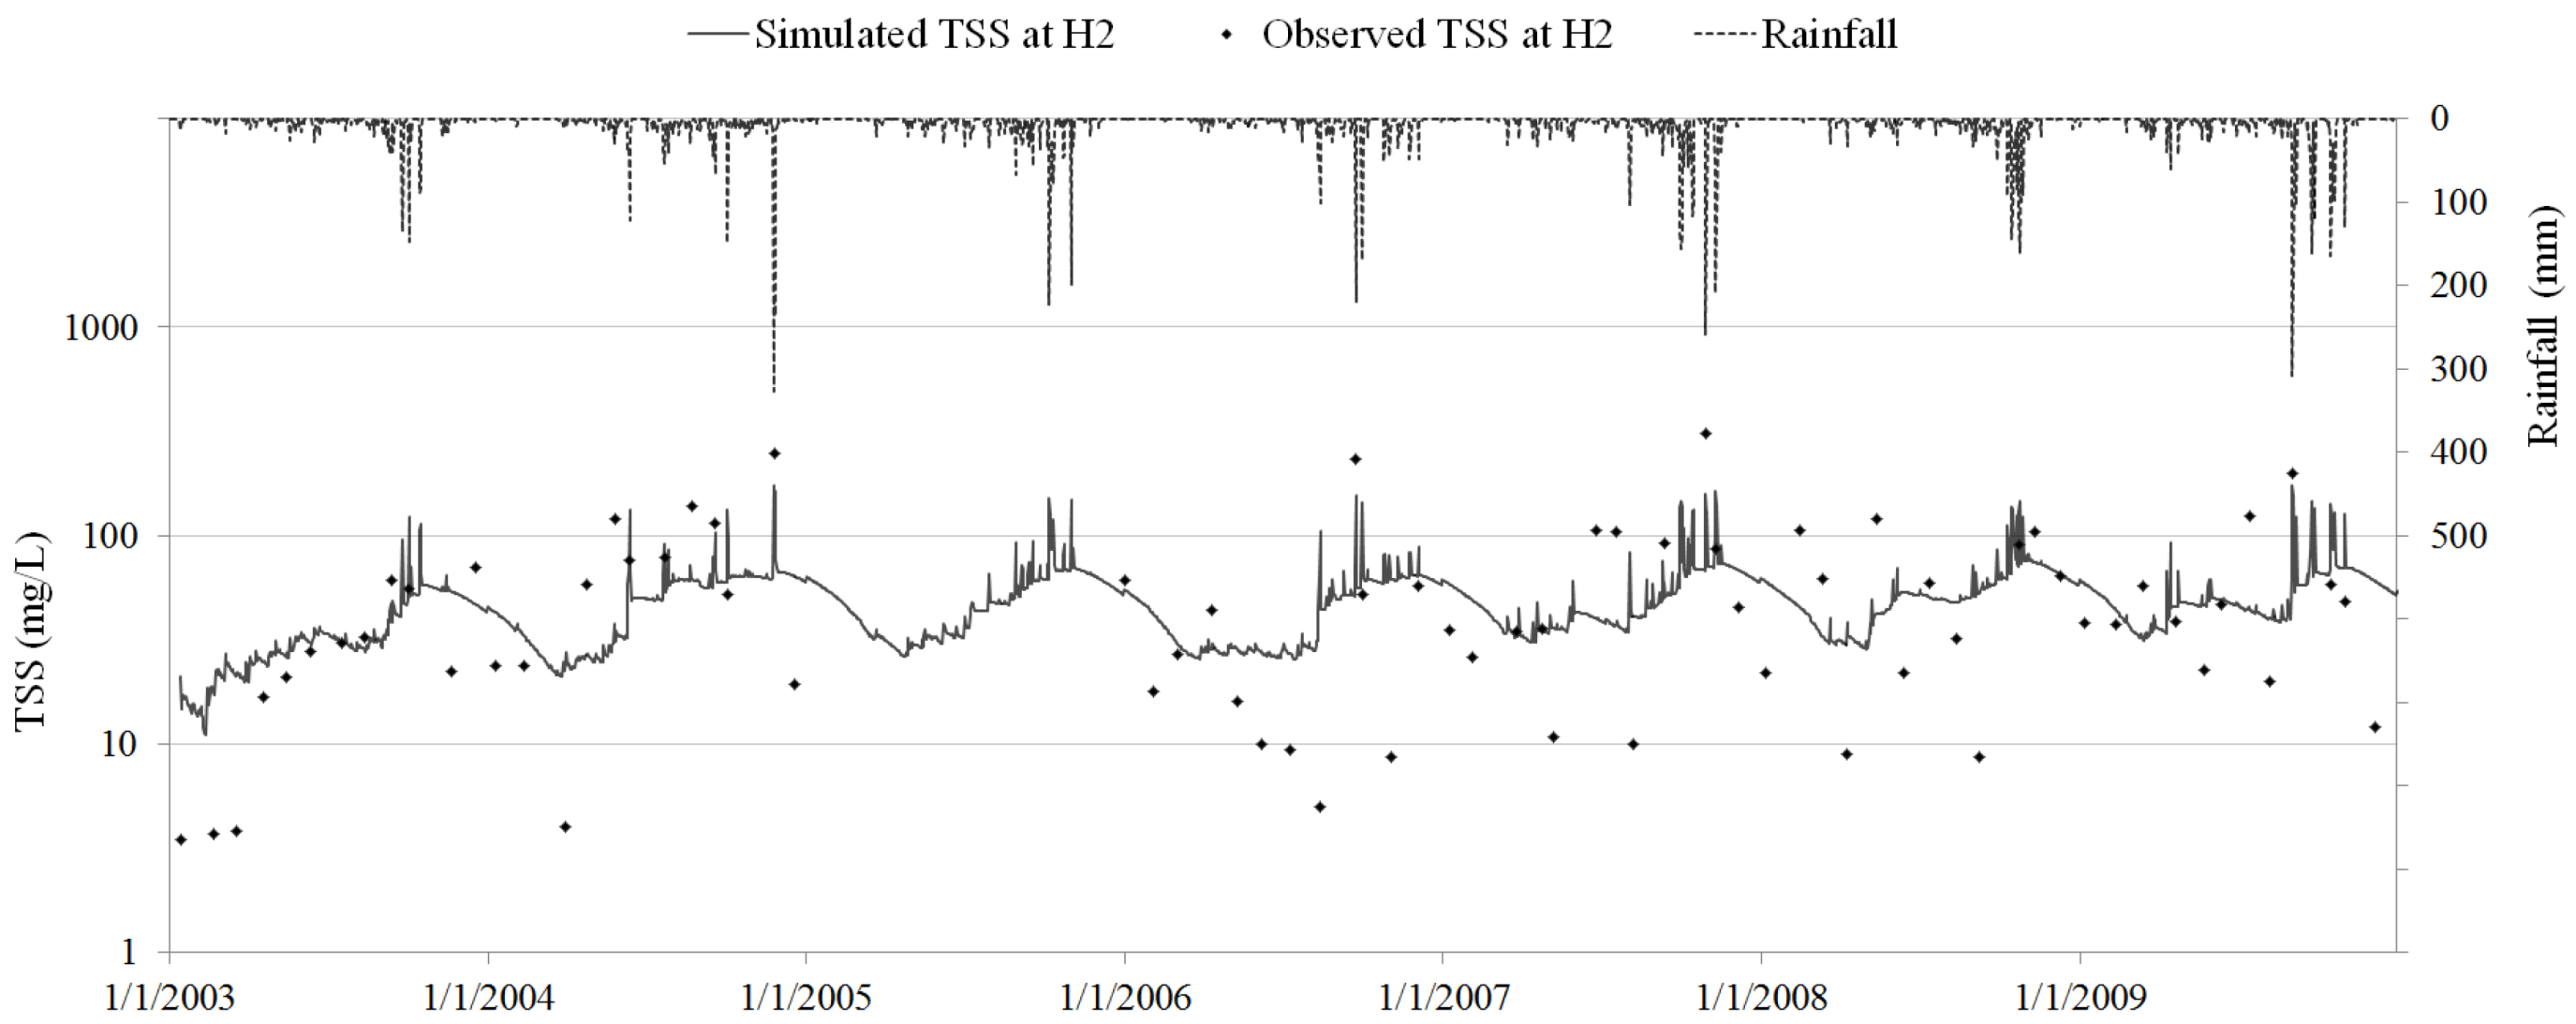
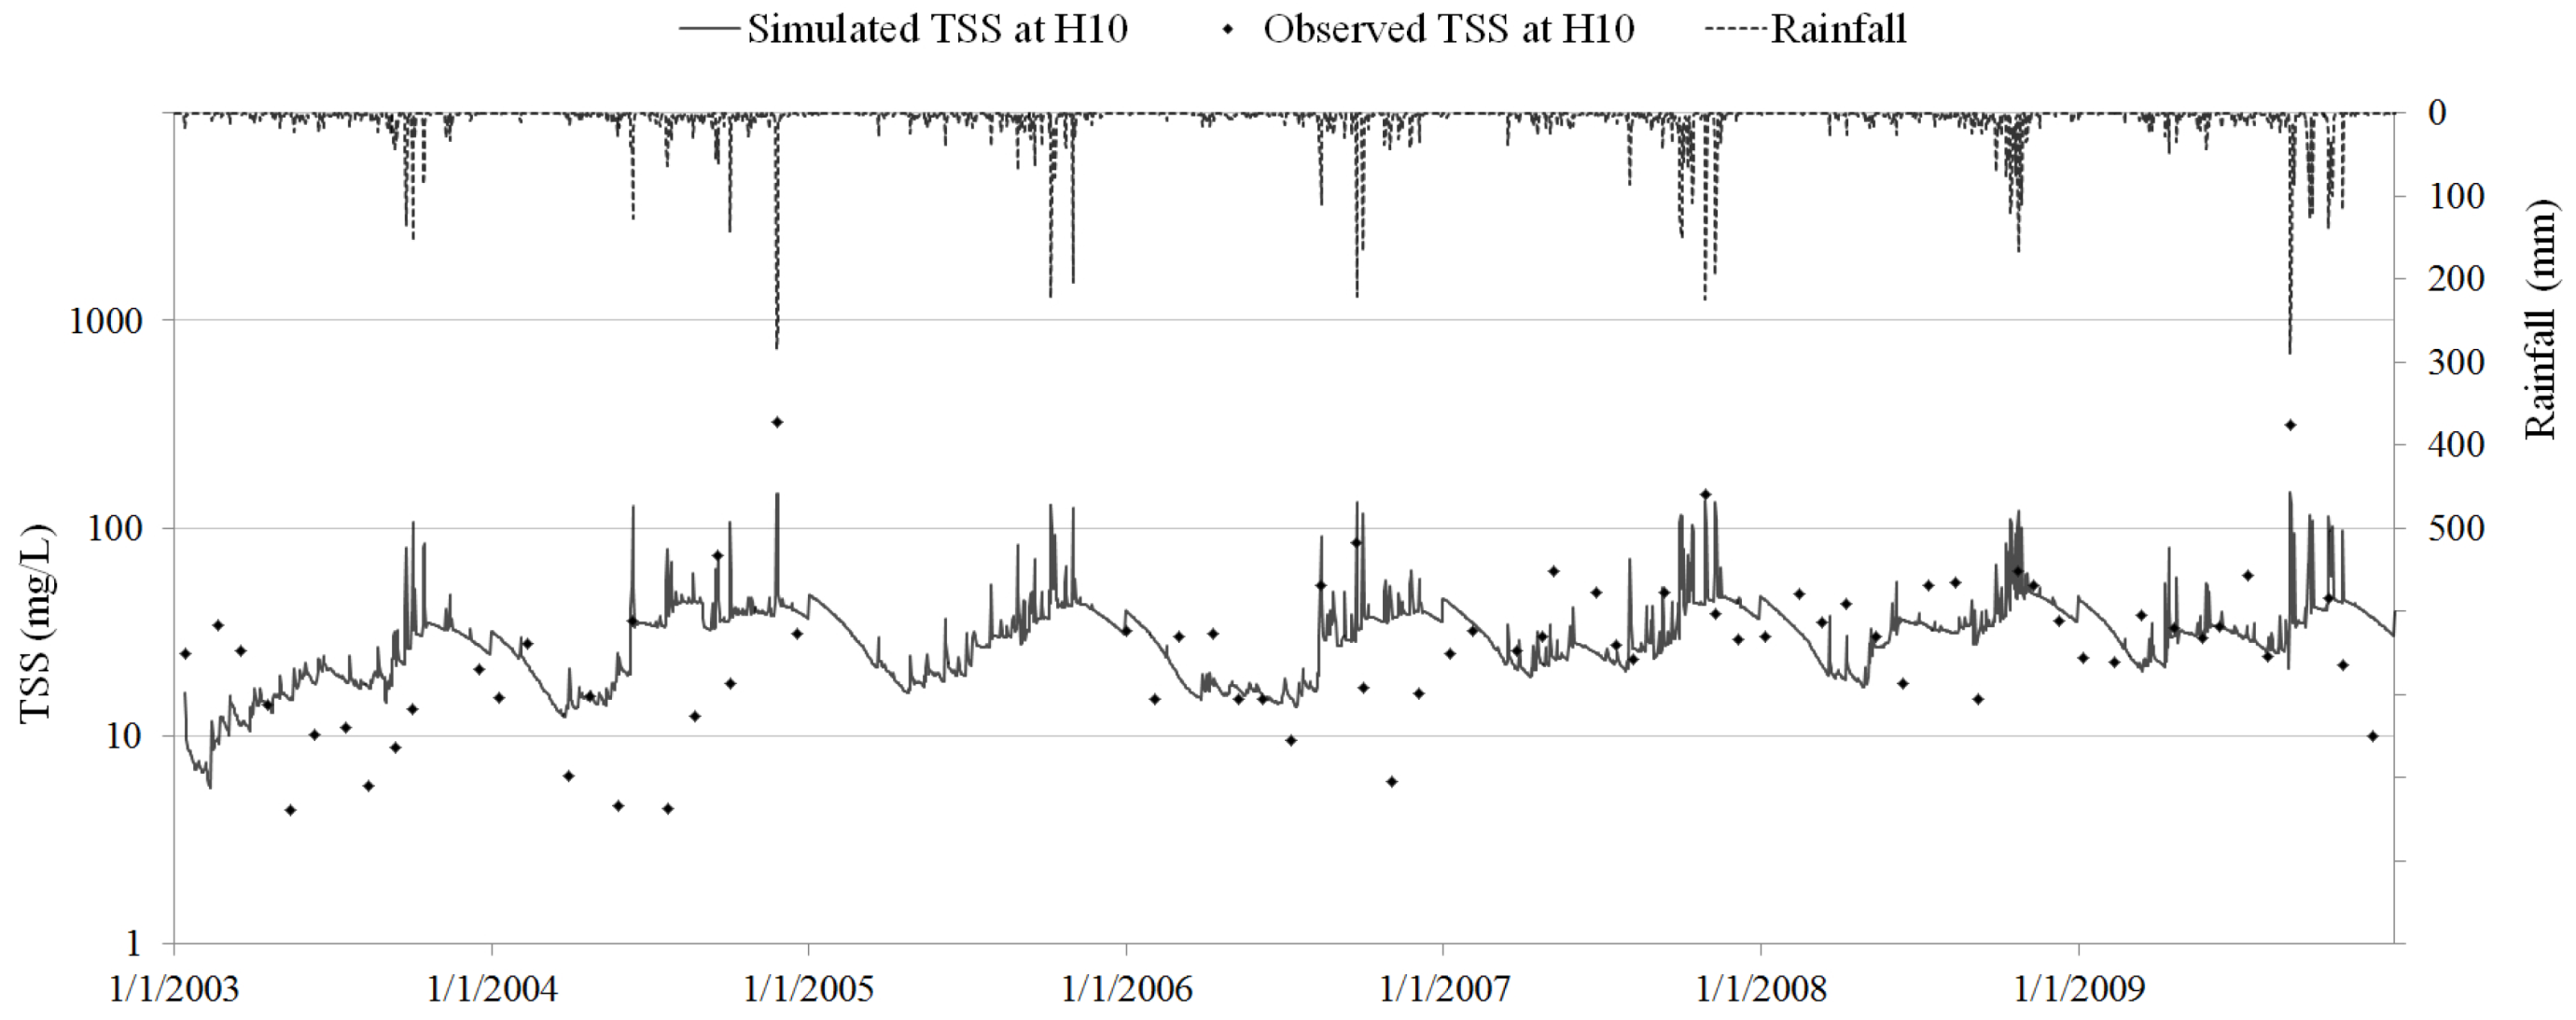
3.3. TSS Simulations


3.4. Dam Impact on TSS Concentration and Sediment Loading

4. Summary and Conclusions
Acknowledgments
Author Contributions
Conflicts of Interest
References
- Bartle, A. Hydropower potential and development activities. Energy Policy 2002, 30, 1231–1239. [Google Scholar] [CrossRef]
- Jacobson, M.Z. Review of solutions to global warming, air pollution, and energy security. Energy Environ. Sci. 2009, 2, 148–173. [Google Scholar] [CrossRef]
- Egré, D.; Milewski, J.C. The diversity of hydropower projects. Energy Policy 2002, 30, 1225–1230. [Google Scholar] [CrossRef]
- Sternberg, R. Hydropower’s future, the environment, and global electricity systems. Renew. Sustain. Energy Rev. 2010, 14, 713–723. [Google Scholar] [CrossRef]
- Rosenberg, D.M.; Bodaly, R.A.; Usher, P.J. Environmental and social impacts of large scale hydroelectricity development: Who is listening? Glob. Environ. Chang. Hum. Policy Dimens. 1995, 5, 127–148. [Google Scholar] [CrossRef]
- Abbasi, S.A.; Abbasi, N. The likely adverse environmental impacts of renewable energy sources. Appl. Energy 2000, 65, 121–144. [Google Scholar] [CrossRef]
- Sawyer, A.H.; Cardenas, M.B.; Bomar, A.; Mackey, M. Impact of dam operations on hyporheic exchange in the riparian zone of a regulated river. Hydrol. Process. 2009, 23, 2129–2137. [Google Scholar] [CrossRef]
- Rasanen, T.A.; Koponen, J.; Lauri, H.; Kummu, M. Downstream hydrological impacts of hydropower development in the upper Mekong Basin. Water Resour. Manag. 2012, 26, 3495–3513. [Google Scholar] [CrossRef]
- Le, T.B. River Basin Scale Hydrologic Modeling for Prediction of Water Availability; University of Texas at San Antonio: San Antonio, TX, USA, 2014; p. 125. [Google Scholar]
- Zhang, Y.; Xia, J.; Chen, J.; Zhang, M. Water quantity and quality optimization modeling of dams operation based on SWAT in Wenyu River Catchment, China. Environ. Monit. Assess. 2011, 173, 409–430. [Google Scholar] [CrossRef] [PubMed]
- Williams, G.P.; Wolman, M.G. Downstream Effects of Dams on Alluvial RIVERS; Geological Survey Professional Paper 1286; Unite States Government Printing Office: Washington, DC, USA, 1984; p. 83. [Google Scholar]
- Petts, G.E. Complex response of river channel morphology subsequent to reservoir construction. Prog. Phys. Geogr. 1979, 3, 329–362. [Google Scholar] [CrossRef]
- Kileshye, O.J.; Mazvimavi, D.; Love, D.; Mul, M.L. Effects of selected dams on river flows of Insiza River, Zimbabwe. Phys. Chem. Earth 2006, 31, 870–875. [Google Scholar] [CrossRef]
- Topping, D.J.; Rubin, D.M.; Vierra, L.E. Colorado River sediment transport 1. Natural sediment supply limitation and the influence of Glen Canyon Dam. Water Resour. Res. 2000, 36, 515–542. [Google Scholar] [CrossRef]
- Dang, T.H.; Coynel, A.; Orange, D.; Blanc, G.; Etcheber, H.; Le, L.A. Long-term monitoring (1960–2008) of the river-sediment transport in the Red River Watershed (Vietnam): Temporal variability and dam-reservoir impact. Sci. Total Environ. 2010, 408, 4654–4664. [Google Scholar] [CrossRef] [PubMed]
- Mekong River Commission (MRC). Overview of the Hydrology of the Mekong Basin; Mekong River Commission: Vientiane, Lao PDR, 2005. [Google Scholar]
- Nguyen, H.Đ.; Nguyen, G.B. The participation of community in Huong and Bo watershed in building and operating hydropower dams in Thua Thien Hue province. Vietnam Natl. Univ. Han. J. Sci. 2011, 27, 101–112. [Google Scholar]
- Thua Thien Hue Provincial People Committee (TTH-PPC). Thua Thien Hue Geography Book. Available online: http://www3.thuathienhue.gov.vn/GeographyBook/Default.aspx (accessed on 22 January 2013).
- Arnold, J.G.; Srinivasan, R.; Muttiah, R.S.; Williams, J.R. Large area hydrologic modeling and assessment—Part I: Model development. J. Am. Water Resour. Assoc. 1998, 34, 73–89. [Google Scholar] [CrossRef]
- Chaplot, V.; Saleh, A.; Jaynes, D.B.; Arnold, J. Predicting water, sediment and NO3-N loads under scenarios of land-use and management practices in a flat watershed. Water Air Soil Pollut. 2004, 154, 271–293. [Google Scholar] [CrossRef]
- Abbaspour, K.C.; Yang, J.; Maximov, I.; Siber, R.; Bogner, K.; Mieleitner, J.; Zobrist, J.; Srinivasan, R. Modelling hydrology and water quality in the pre-alpine/alpine Thur watershed using SWAT. J. Hydrol. 2007, 333, 413–430. [Google Scholar] [CrossRef]
- Rostamian, R.; Jaleh, A.; Afyuni, M.; Mousavi, S.F.; Heidarpour, M.; Jalalian, A.; Abbaspour, K.C. Application of a SWAT model for estimating runoff and sediment in two mountainous basins in central Iran. Hydrol. Sci. J. 2008, 53, 977–988. [Google Scholar] [CrossRef]
- Khoi, D.N.; Suetsugi, T. Unvertainty in climate change impacts on streamflow in Be River Catchment, Vietnam. Water and Environ. J. 2012, 26, 530–539. [Google Scholar] [CrossRef]
- Arnold, J.G.; Kiniry, J.R.; Srinivasan, R.; Williams, J.R.; Haney, E.B.; Neitsch, S.L. Soil and Water Assessment Tool Input/Output File Documentation Version 2009; Texas Water Resources Institute Technical Report No. 365; Texas A&M University System: College Station, TX, USA, May 2010. [Google Scholar]
- Williams, J.R.; Berndt, H.D. Sediment yield prediction based on watershed hydrology. Trans. ASAE 1977, 20, 1100–1104. [Google Scholar] [CrossRef]
- Zhang, Y.; Degroote, J.; Wolter, C.; Sugumaran, R. Integration of modified universal soil loss equation (MUSLE) into a GIS framework to assess soil erosion risk. Land Degrad. Dev. 2009, 20, 84–91. [Google Scholar] [CrossRef]
- Wischmeier, W.H.; Smith, D.D. Predicting Rainfall Erosion Losses: A Guide to Conservation Planning; Agriculture Handbook No. 537; United States Department of Agriculture: Washington, DC, USA, December 1978.
- SWAT Soil & Water Assessment Tool Website. Available online: http://swatmodel.tamu.edu/ (accessed on 7 October 2014).
- Collischonn, B.; Collischonn, W.; Tucci, C.E.M. Daily hydrologic modeling in the Amazon basin using TRMM rainfall estimates. J. Hydrol. 2008, 360, 207–216. [Google Scholar] [CrossRef]
- Curtis, S.; Crawford, T.W.; Lecce, S.A. A comparison of TRMM to other basin-scale estimates of rainfall during the 1999 Hurricane Floyd flood. Nat. Hazards 2007, 43, 187–198. [Google Scholar] [CrossRef]
- National Aeronautics and Space Administration (NASA) Mirador Website. Available online: http://mirador.gsfc.nasa.gov/ (accessed on 18 February 2013).
- Kummerow, C.; Barnes, W.; Kozu, T.; Shiue, J.; Simpson, J. The Tropical Rainfall Measuring Mission (TRMM) sensor package. J. Atmos. Ocean. Technol. 1998, 15, 809–817. [Google Scholar] [CrossRef]
- Huffman, G.J.; Adler, R.F.; Bolvin, D.T.; Gu, G.J.; Nelkin, E.J.; Bowman, K.P.; Hong, Y.; Stocker, E.F.; Wolff, D.B. The TRMM multisatellite precipitation analysis (TMPA): Quasi-global, multiyear, combined-sensor precipitation estimates at fine scales. J. Hydrometeorol. 2007, 8, 38–55. [Google Scholar] [CrossRef]
- National Climatic Data Center (NCDC) National Oceanic Atmospheric Administration (NOAA) Website. Available online: http://www.ncdc.noaa.gov/cdo-web/ (accessed on 15 April 2013).
- NASA Atmospheric Science Data Center Website. Available online: http://eosweb.larc.nasa.gov/sse/ (accessed on 15 April 2013).
- Institute of Resources, Environment, and Biotechnology of Hue University, Vietnam (IREB-Hue). Annual Reports on Water Quality Monitoring Results of Huong River; IREB-Hue: Hue, Vietnam, 2003–2010. [Google Scholar]
- Kim, N.W.; Lee, J.E.; Kim, J.T. Assessment of flow regulation effects by dams in the Han River, Korea, on the downstream flow regimes using SWAT. J. Water Resour. Plan. Manag. 2012, 138, 24–35. [Google Scholar] [CrossRef]
- Veith, T.L.; van Liew, M.W.; Bosch, D.D.; Arnold, J.G. Parameter sensitivity and uncertainty in SWAT: A comparison across five USDA-ARS watersheds. Am. Soc. Agric. Biol. Eng. 2009, 53, 1477–1486. [Google Scholar]
- International Union for Conservation of Nature and Natural Resources in Vietnam (IUCN Vietnam). Environmental Flows: Rapid Environmental Flow Assessment for the Huong River Basin, Central Vietnam; IUCN Vietnam: Hanoi, Vietnam, 2005; p. 82. [Google Scholar]
© 2014 by the authors; licensee MDPI, Basel, Switzerland. This article is an open access article distributed under the terms and conditions of the Creative Commons Attribution license (http://creativecommons.org/licenses/by/4.0/).
Share and Cite
Le, T.B.; Al-Juaidi, F.H.; Sharif, H. Hydrologic Simulations Driven by Satellite Rainfall to Study the Hydroelectric Development Impacts on River Flow. Water 2014, 6, 3631-3651. https://doi.org/10.3390/w6123631
Le TB, Al-Juaidi FH, Sharif H. Hydrologic Simulations Driven by Satellite Rainfall to Study the Hydroelectric Development Impacts on River Flow. Water. 2014; 6(12):3631-3651. https://doi.org/10.3390/w6123631
Chicago/Turabian StyleLe, Tuan B., Farhan H. Al-Juaidi, and Hatim Sharif. 2014. "Hydrologic Simulations Driven by Satellite Rainfall to Study the Hydroelectric Development Impacts on River Flow" Water 6, no. 12: 3631-3651. https://doi.org/10.3390/w6123631