Article

A Hydrograph-Based Sediment Availability Assessment: Implications for Mississippi River Sediment Diversion

School of Renewable Natural Resources, Louisiana State University, 227 Highland Road, Baton Rouge, LA 70803, USA
*
Author to whom correspondence should be addressed.
Current address: Midshore Riverkeeper Conservancy, 23 N. Harrison St Easton, MD 21601, USA
Water 2014, 6(3), 564-583; https://doi.org/10.3390/w6030564
Submission received: 19 December 2013 / Revised: 11 March 2014 / Accepted: 12 March 2014 / Published: 21 March 2014

Abstract

:
The Mississippi River Delta Plain has undergone substantial land loss caused by subsidence, relative sea-level rise, and loss of connectivity to the Mississippi River. Many restoration projects rely on diversions from the Mississippi River, but uncertainty exists about the timing and the amount of actually available sediment. This study examined long-term (1980–2010) suspended sediment yield as affected by different hydrologic regimes to determine actual suspended sediment availability and how this may affect diversion management. A stage hydrograph-based approach was employed to quantify total suspended sediment load (SSL) of the lower Mississippi River at Tarbert Landing during three river flow conditions: Peak Flow Stage (stage = 16.8 m, discharge >32,000 m3 s−1), High Flow Stage (stage = 14.6 m, discharge = 25,000–32,000 m3 s−1), and Intermediate Flow Stage (Stage = 12.1 m, discharge = 18,000–25,000 m3 s−1). Suspended sediment concentration (SSC) and SSL were maximized during High Flow and Intermediate Flow Stages, accounting for approximately 50% of the total annual sediment yield, even though duration of the stages accounted for only one-third of a year. Peak Flow Stage had the highest discharge, but significantly lower SSC (p < 0.05), indicating that diversion of the river at this stage would be less effective for sediment capture. The lower Mississippi River showed significantly higher SSC (p < 0.0001) and SSL (p < 0.0001) during the rising than the receding limb. When the flood pulse was rising, Intermediate Flow and High Flow Stages showed greater SSC and SSL than Peak Flow Stage. Together, Intermediate Flow and High Flow Stages on the rising limb annually discharged 28 megatonnes over approximately 42 days, identifying this to be the best period for sediment capture and diversion.

1. Introduction

The Mississippi River Delta Plain in Louisiana, USA has undergone extensive land loss during the past century [1]. Peak delta plain loss occurred from the mid-1950s until the 1970s at rates between 60 and 75 km2 yr−1 [2,3], but possibly exceeded 100 km2 yr−1 [4]. Couvillion et al. [1] have estimated that a total of 4877 km2 of coastal land in Louisiana has been submerged since 1932. The rapid land loss has been attributed to both natural and anthropogenically exacerbated reasons [5,6,7]. These include subsidence, erosion, relative sea level rise, and loss of connectivity to the Mississippi River. With land loss endangering coastal communities, various restoration projects have been developed in the past two decades [8,9]. In recent years much discussion has centered on diverting Mississippi River water and sediment to build and maintain coastal wetlands.
The United States Army Corps of Engineers (USACE) has built three large river diversions for the sole purpose of restoration in southeast Louisiana: Caernarvon, Davis Pond, and West Bay. The first two are managed to reduce estuarine salinity, while the latter is designed to bring sediment to the disappearing wetlands. Caernarvon Diversion Outfall Management Project, located on the east bank of the Mississippi River at river mile 82, was opened in August 1991 and is capable of discharging 227 m3 s−1 of freshwater to Breton Sound Basin [10]. Davis Pond Freshwater Diversion (DPFD), located on the west bank of the Mississippi River at river mile 118, has been in operation since July 2002 and is capable of introducing a maximum of 302 m3 s−1 of freshwater to Barataria Basin [11]. Current discharge management at both of these locations is based on salinity, with lower salinity during the spring (higher discharge) and higher salinity during the summer and fall (lower discharge) [12]. To maintain the salinity gradient the diversions are continuous [12,13]. Despite careful planning and many years of operation, a recent study [14] found no significant changes in either relative vegetation or overall marsh area from 1984 to 2005 in zones closest to the diversion inlets. The lack of positive response to the freshwater diversions during this period has been attributed to inappropriate timing of discharge, insufficient discharge magnitude (need > 100 m3 s−1 to induce sheet flow needed to carry sediment across the marsh at Caernarvon Diversion, while DPFD is too small and channelized to induce sheet flow [15], and/or overloading of nutrients affecting sediment stability [14,16]. After Hurricanes Katrina and Rita, in 2005, these areas sustained even larger losses in vegetation and overall marsh area, when compared to similar marshes of the adjacent reference sites [14,17].
The West Bay Sediment Diversion was designed for sediment capture. Completed in November 2003 on the west bank of the Mississippi at river mile 2.9 (7.6 km from the Head of Passes), it had a planned discharge of 396 m3 s−1 when the Mississippi River was at 50% discharge, but since construction the diversion has increased to 765 m3 s−1 [18,19]. It has been reported that the diversion could be impacting navigational interests in the area while not producing the desired land growth [20,21,22], although some subaerial land growth has occurred [23], especially following the 2011 Mississippi River flood. New sediment diversions further up river are under study (Myrtle Grove) or proposed for future investigation [9,24]. However, there lacks a guideline that effectively addresses various interests, such as maintaining navigation, managing fisheries and wetlands, while still efficiently using diversions to capture sediment.
A number of studies have examined long-term annual sediment loads of the Mississippi River. These studies have documented a decreasing trend of riverine sediment that has been attributed to dams, land management, and other river engineering structures [25,26,27]. Different estimates of annual suspended sediment load for Tarbert Landing, MS (longest continuous, 50 years, recording station above tidal reach) are found in literature. Differences in estimates are mainly due to calculations for different time periods, for instance, 140 MT by Kesel [25], 130 MT by Horowitz [27], 115 MT by Meade and Moody [26], or an overall average of 150 MT for 1963–2005 by Thorne et al. [28]. These estimates provide important trend data and are useful for understanding long-term sediment yield dynamics associated with river engineering, climate, and land use changes. However, they offer little insight into actual sediment availability under different river flow conditions, for example, the amount of sediment during high winter and spring flows.
The significance of the flood pulse with regards to sediment transport and healthy maintenance of river floodplains and deltas has long been recognized [29,30,31,32,33,34]. In Louisiana, it has been observed that stable marshes in the Mississippi River Delta Plain receive input of sediments and freshwater during the spring flood [35]. Mossa [36] indicated that the highest sediment concentrations occurred during the rising limb, while recent work by Allison et al. [37] reinforced these findings. In general, the positive response of sediment concentration to peak discharge is fast and short in streams draining small watersheds [38,39]. In a flood pulse of large river basins, the response can be prolonged [40] due to the longer area and distance of sediment sources. From these previous studies there is a general understanding that the rising limb provides more sediment, and that high discharge has a greater total suspended sediment load than low discharge. With this said, there is a knowledge gap concerning the quantity and variability of total suspended sediment (coarse and fine suspended material) from the Mississippi River during its flood pulse (discharge >18,000 m3s−1) and between different flood crests. This was highlighted by Allison and Meselhe [34] questioning the length and interannual variation of flow periods during which riverine coarse material can be obtained. Filling this gap in knowledge is crucial for effective sediment and diversion management in the future.
The main goal of the study was to determine the amount of total suspended sediment that is available at various river stages during the flood pulse and how this could translate to diversion management. Specific objectives were threefold: (1) calculating long-term total suspended sediment yield of the Mississippi River at Tarbert Landing; MS (2) determining how much total suspended sediment load occurs during different flood stage intervals, specifically Peak Flow Stage, High Flow Stage, and Intermediate Flow Stage at Red River Landing, LA; and (3) identifying suspended sediment concentration and total suspended sediment load during the rising and receding limb of the flood pulse as well as during different stage intervals on the rising limb and receding limb. Information gained from this study is discussed in light of using the flood pulse for diversion management through a method of Controlled Overbank Flooding (COF) for sedimentation proposed by Xu and Rosen [41] that would maximize the flood pulse and sediment for a more natural diversion without degrading other functions of the Mississippi River.

2. Methods

2.1. River Stage Classification for Sediment Availability Assessment
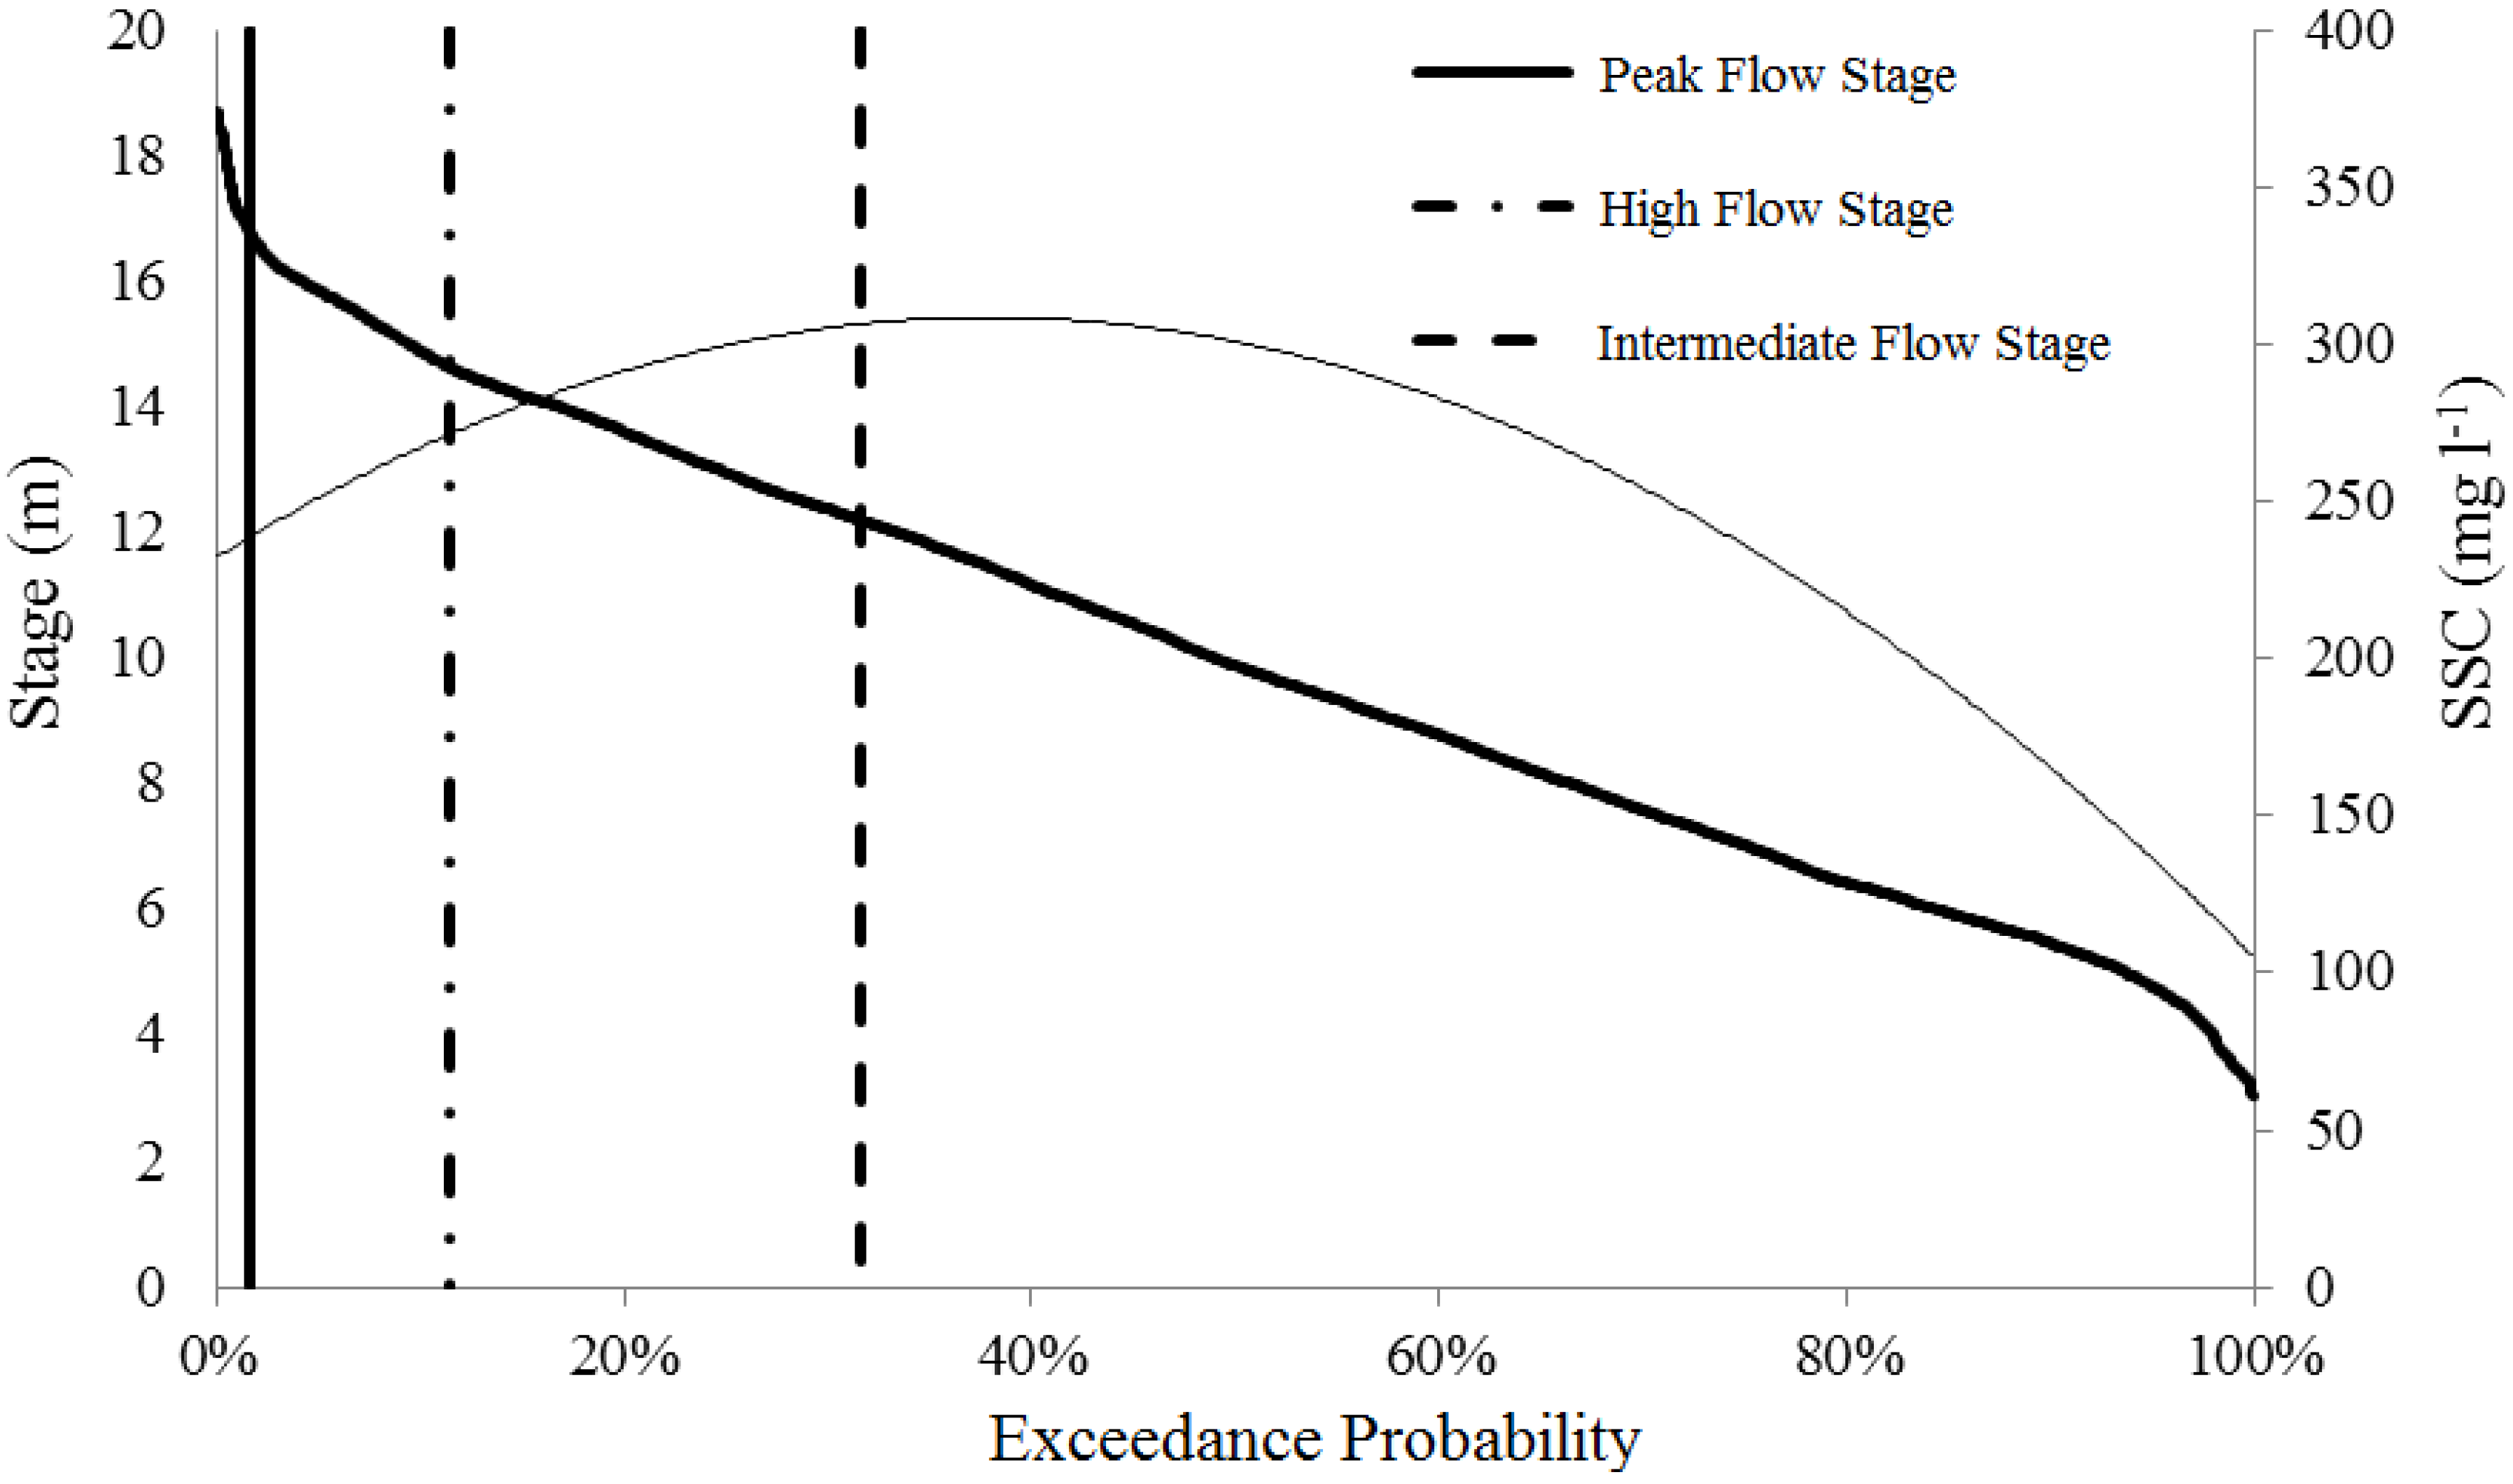
Daily stage data, for the period 1 January 1980 to 31 December 2010, were collected from the United States Army Corps of Engineers (USACE) for the Red River Landing (RRL, Figure 1) station in Louisiana (30°57′39″ N, 91°39′52′ W; river mile 302.4). This station is used by the National Oceanic and Atmospheric Administration (NOAA) for river flood forecasting in the Mississippi River Delta Plain.
Figure 1. Lower Mississippi River (MR) with the locations of Old River Control Structure (ORCS) where approximately 25% of the Mississippi River’s water is diverted into the Atchafalaya River (AR); Tarbert Landing (TBL) where long-term discharge and suspended sediment records are collected for this study; Red River Landing (RRL) and Carrolton, New Orleans (CAR) where river stage data are used for this study; and Davis Pond Freshwater Diversion (DPFD).
Water 06 00564 g001
In this study we employed stage categories based on a flow duration curve with consideration of NOAA’s flood stage classification at RRL to assess sediment availability at different river stages. The stage categories employed were (1) Intermediate Flow (stage = 12.1 m, 32% exceedance); (2) High Flow (stage = 14.6 m, 11% exceedance); and (3) Peak Flow (stage = 16.8 m, 2% exceedance) (all stage data is referenced to NAVD88). These stage divisions were used for the following reasons: (1) the river discharge at Intermediate Flow Stage exceeds 15,000 m3 s−1, the threshold where large quantities of course materials are found in suspension [34]; (2) Intermediate Flow Stage is based off of river morphology (start of overbank flooding at Raccourci Island, see Figure 1) and, thus, more representative of flood progression than stage categories at other stations downriver. RRL is close to the Tarbert Landing (TBL, about 6 km downstream, Figure 1) station in Mississippi. While the former has the longest continuous stage data, the latter has the longest continuous discharge and total suspended sediment datasets. Therefore, the information from these two stations provides the best indication of available sediment to the lower Mississippi River (below Old River Control Structure) under a multitude of river discharge conditions. Allison et al. [37] analyzed three years of data at downstream locations and provided a glimpse of sediment available during flood years, but the Mississippi River can go through tremendous drought and flooding that, at present, downstream gauge stations do not adequately describe based on the data available at those stations. Therefore, their study misses some of the long-term variability in the system.
To determine the duration of each flood stage and when suspended sediment concentration (SSC) maxima occurred, a flow duration curve was used that had SSC plotted with corresponding stage. In addition, a stage-discharge curve was created in order to determine daily discharge corresponding to the flood stages. River discharge was found to be 18,000 m3 s−1 at Intermediate Flow Stage, 25,000 m3 s−1 at High Flow Stage, and 32,000 m3 s−1 at Peak Flow Stage. Thus, Intermediate Flow Stage corresponds to a stage of 12.1 m and discharge of 18,000 to 25,000 m3 s−1, High Flow Stage corresponds to a stage of 14.6 m and discharge of 25,000 to 32,000 m3 s−1, and Peak Flow Stage corresponds to a stage of 16.8 m and discharge >32,000 m3 s−1 (Table 1). From here on these ranges will be discussed as Intermediate Flow Stage, High Flow Stage, and Peak Flow Stage.
Table 1. Stage category with corresponding river stage at Red River Landing, LA and corresponding discharge at Tarbert Landing, LA.
CategoryStage (m)Discharge (m3 s−1 )
Intermediate Flow Stage12.1 to 14.618,000 to 25,000
High Flow Stage14.6 to 16.825,000 to 32,000
Peak Flow Stage>16.8>32,000

2.2. Suspended Sediment Concentration and Load Calculation

To quantify total suspended sediment loads, suspended sediment concentration (SSC, mg L−1) data and daily river discharge (m3 s−1) were obtained from the United States Geological Survey (USGS) and USACE for the Tarbert Landing (TBL) station (31°00′30″ N, 91°37′25″ W; river mile 306.3) over the period 1 January, 1980, to 31 December, 2010. Suspended sediment sampling at TBL varied, but fell into the range of 4–8 verticals and 2–5 samples per vertical, completed 14 to 31 times a year using isokinetic point samples (P-61, P-63, D-96, and D-99) (see [28,42,43,44] for more specifics on error and sampling technique). Long-term total suspended sediment loads (SSL) were estimated using sediment rating curves based on measured sediment load and river discharge. Daily suspended sediment load (metric ton = tonnes) was calculated using:
SSL (tonnes day−1) = [Q (m3 s−1)] [SSC (mg L−1)] (0.0864)
Both linear and polynomial suspended sediment rating curves were applied with and without smearing correction. Polynomial suspended sediment rating curve with smearing correction provided the closest approximation to the calibration dataset. Smearing correction was followed using the methods of Duan [45]. The calibration dataset consisted of enough data so that a smearing correction value was calculated and applied on an annual basis. The sediment rating curve utilized for total suspended sediment load calculation at Tarbert Landing, MS was:
lnSSL = −0.4987(lnQ)2 + 3.8469(lnQ) + 6.0336
where lnSSL = natural logarithm of daily total suspended sediment load in tonnes day−1 and lnQ = natural logarithm of discharge in m3 s−1. The above equation achieved regression coefficient of r2 = 0.80. Using the equation daily total suspended sediment load was computed for 1 January 1980, to 31 December 2010. All annual total suspended sediment load and discharge data were analyzed based on the calendar year (January-December). All sediment amounts are metric ton (tonne) and not short ton.

2.3. Hydrograph Based Sediment Yield Quantification

Flood periods on the hydrograph were selected manually based on discharge exceeding Intermediate Flow Stage. Starting dates of the floods were chosen based on the lowest discharge immediately preceding the flood after previously receding discharge. Ending dates were chosen based on the lowest discharge succeeding the flood before the next rising discharge. The hydrograph was subsequently split into rising and receding limbs with the highest discharge for the flood being the delimiter. Once rising and receding limbs were established, total suspended sediment loads were calculated for each limb using Equation (1). These loads were subsequently divided into the stage categories (Intermediate Flow, High Flow, and Peak Flow) on the rising and receding limbs with average, minimum, and maximum values for each limb and stage category calculated.
SSC and SSL were analyzed based on stage category (Intermediate Flow, High Flow, and Peak Flow). SSC and SSL were then analyzed based on the corresponding limb of the hydrograph (rising/receding) and limb with stage category. Where applicable, total, mean, median, minimum, and maximum values were calculated for SSC and SSL, based on the aforementioned classifications. Trends were tested in the long-term data using Seasonal Mann-Kendall test for trend using a DOS based program developed by the USGS [46] with significance defined as p < 0.05. Differences in SSC and SSL for stage categories and limb were determined using Kruskal-Wallace and Mann-Whitney (SSC and SSL for stage categories), or Mann-Whitney (difference between rising and receding limb) using SAS software (SAS Institute Inc., Cary, NC, USA).

3. Results

3.1. Sediment Availability under Different River Stages

From 1980 to 2010 the Mississippi River at Tarbert Landing, MS averaged 127 megatonnes (MT) of total suspended sediment annually, with a daily average load of 347,000 tonnes (Table 2). The highest annual yield was in 1982 (189 MT) and lowest annual yield was in 2006 (74 MT). Between the years 1980–1989 there was a significant decreasing trend in total suspended sediment load (Seasonal Mann-Kendall, p = 0.046), followed by a slight, statistically insignificant upward trend through 2010 (Figure 2). SSC was highest in 1982 with an average of 368 mg L−1 and lowest in two dry years, 1988 and 1989, with averages of 162 mg L−1 and 163 mg L−1. Since 1990, SSC has trended significantly upward (Seasonal Mann-Kendall, p = 0.022, Figure 2). On the other hand discharge did not show a clear trend over the entire study period.
Figure 2. (a) Annual total suspended sediment yield in megatonnes and (b) mean suspended sediment concentration in milligrams per liter (SSC) for the Mississippi at Tarbert Landing, MS from 1980 to 2010.
Water 06 00564 g002
Hydrologically, from 1980 to 2010, the Mississippi River transported significantly different amounts of total suspended sediment under variable flow regimes (Table 2). About 32% (1256 MT) of the total suspended sediment yield was transported by the river at its Intermediate Flow Stage, ranging from a high of 92.5 MT in 1993 to a low of 5.21 MT in 2006 (Table 2). High Flow Stage accounted for 17.6% (691 MT) of the total suspended sediment yield over the period, with a high of 58.26 MT in 1985 and a low of 7.17 MT in 1988 (Table 2). The river delivered only 5% (225 MT) of the total suspended sediment yield at its Peak Flow Stage, with a high of 56.85 MT in 1983 and a low of 2.1 MT in 1989 (Table 2). Peak Flow Stage had the largest average daily SSL, 695,000 tonnes, due to high flow volume, but had the lowest average SSC, 178 mg L−1 (Table 3). Intermediate Flow Stage had the greatest average SSC, 313 mg L−1, but lowest daily SSL, 537,000 tonnes. High Flow Stage SSC and SSL were intermediate between both of these stage classes (Table 3). SSL and SSC were significantly different among the stage categories (Kruskal-Wallace, Mann-Whitney, p < 0.05). There was an inverse relationship between discharge and SSC when the river was above Intermediate Flow Stage. The highest average SSC was reached at the stage level between 30% and 40% on the flow duration curve (Figure 3).
Table 2. Long-term annual (January–December) sediment yield (tonnes) for the Mississippi River at Tarbert Landing, MS and for flood stages, Peak, High, and Intermediate.
YearYear TotalPeak HighIntermediateFlood Total a
1980117,290,00028,160,0009,330,00037,480,000
1981102,360,00024,290,00024,290,000
1982189,040,00019,610,00089,240,000108,850,000
1983171,650,00056,850,00022,850,00059,480,000139,190,000
1984177,040,00015,720,00044,850,00036,420,00096,980,000
1985157,330,00058,260,00039,080,00097,340,000
1986155,210,00075,140,00075,140,000
1987107,490,00010,720,00030,070,00040,780,000
198879,310,0007,170,00036,020,00043,190,000
198984,710,0002,100,00021,980,00029,350,00053,430,000
1990135,620,00011,690,00049,630,00032,930,00094,240,000
1991121,920,00021,720,00036,740,00038,620,00097,080,000
199292,550,00027,260,00027,260,000
1993178,670,00021,270,00033,540,00092,500,000147,310,000
199497,050,0003,580,00039,720,00012,980,00056,280,000
199588,190,0006,460,00010,400,00029,740,00046,600,000
1996117,430,00022,590,00039,998,00062,590,000
1997127,080,00024,750,00014,160,00052,330,00091,250,000
1998159,720,00051,120,00053,880,000105,010,000
1999129,690,0008,470,00025,080,00039,580,00073,120,000
200079,400,0008,650,0008,650,000
2001159,620,00029,340,00057,600,00086,940,000
200299,090,00030,440,00028,670,00059,110,000
2003109,790,00018,670,00023,940,00042,610,000
2004144,470,00014,200,00061,650,00075,840,000
200587,720,0008,710,00010,450,00027,740,00046,900,000
200673,640,0005,210,0005,210,000
2007115,720,0009,030,00029,750,00038,790,000
2008166,260,00031,110,00032,700,00044,690,000108,500,000
2009160,530,00013,360,00019,810,00069,990,000103,160,000
2010143,520,00029,850,00050,660,00080,510,000
Total3,929,110,000225,800,000691,080,0001,256,790,0002,173,660,000
% of Total5.7%17.6%32.0%55.3%
Average126,750,00017,370,00026,580,00040,540,00070,120,000
Note: a The sixth column, flood total, is for the combined flood stages.
Table 3. Average duration, suspended sediment concentrations (SSC) and loads under different flow regimes from 1980 to 2010.
CategoryPeakHighIntermediate
Days254276
SSC (mg L−L)
Mean178266313
1-Day Min79126122
1-Day Max306604992
Sediment Load (tonnes)
Daily Mean695,000624,000537,000
1-Day Min419,000370,000285,000
1-Day Max834,000958,000846,000
Note: a Mean values are averages for the entire period. Min and Max values are the largest and smallest values recorded during the period. Days represent the average number of days stage remains in the different stage categories.
Figure 3. Stage plotted on percent exceedance. Suspended sediment concentration (SSC) is plotted with corresponding stage exceedance value and does not represent SSC exceedance. Line at 32.0% exceedance corresponds to Intermediate Flow Stage, line at 11.0% exceedance to High Flow Stage, and line at 2.0% exceedance to Peak Flow Stage.
Water 06 00564 g003

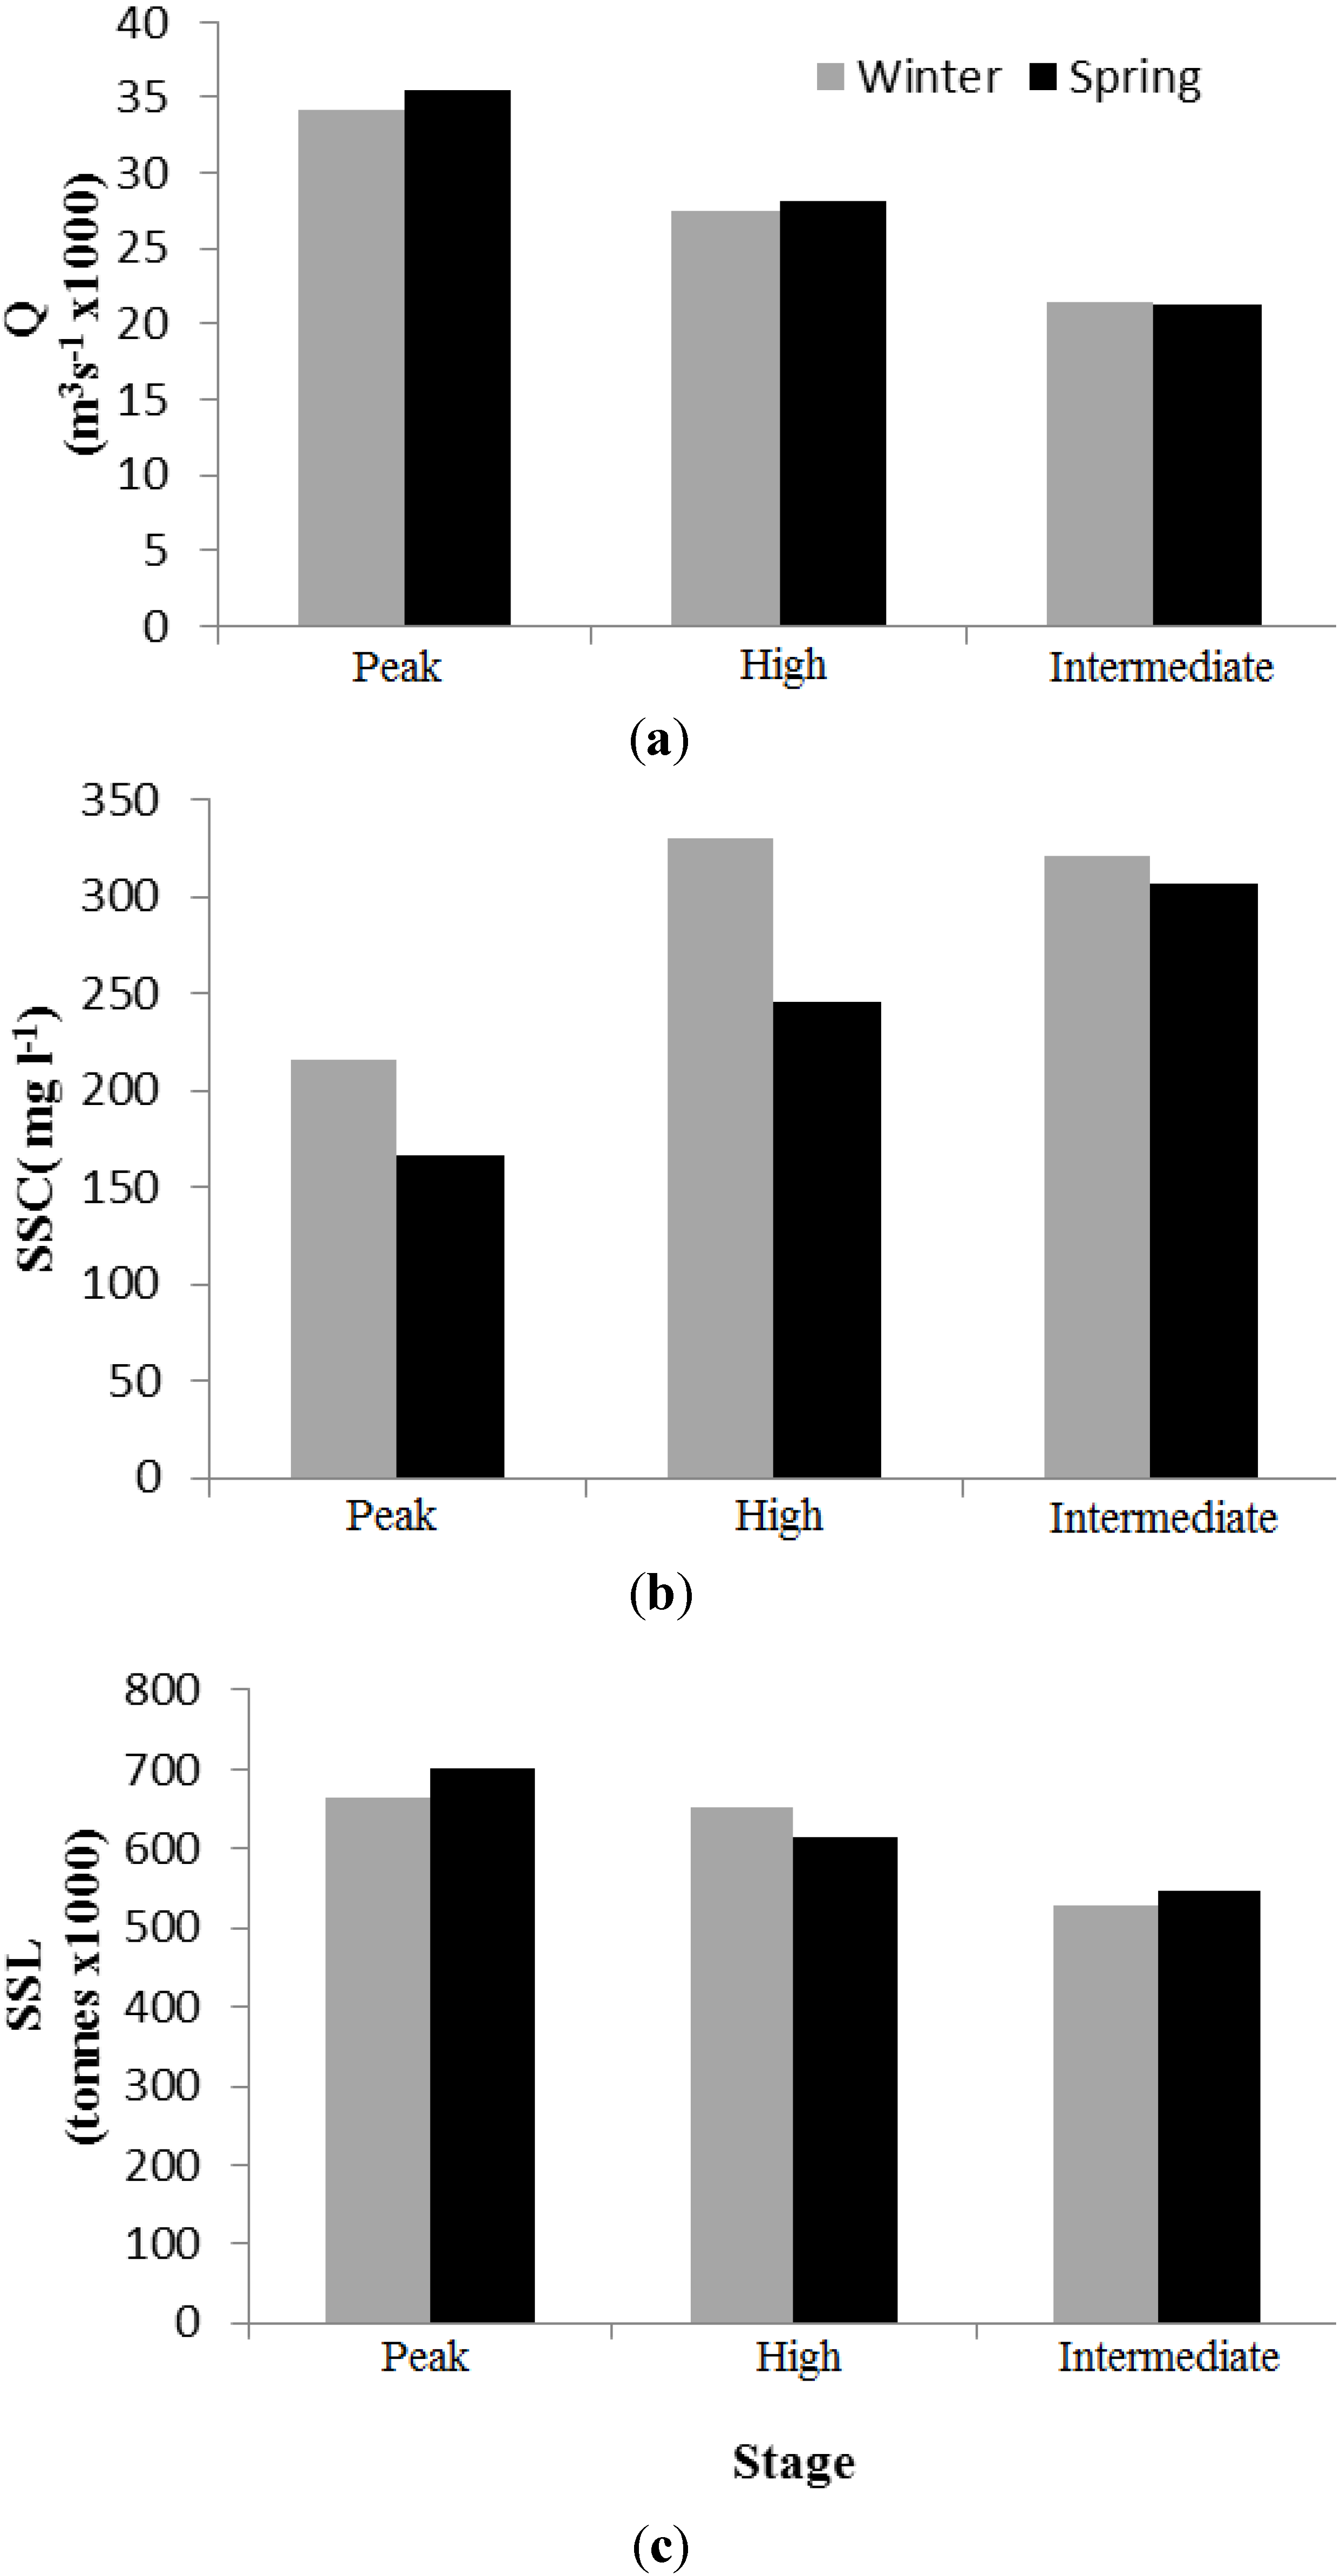
3.2. Sediment Availability on Rising and Receding Limbs

The Mississippi River displayed significantly higher SSC (mean: 317 mg L−1, Mann-Whitney, p < 0.0001) and SSL (mean: 593,999 tonnes, Mann-Whitney, p < 0.0001) on its flood rising limb than on the receding limb (SSC: 235 mg L−1, SSL: 429,255 tonnes) (Table 4). Rising limb at Peak Flow Stage was the exception, where SSC was significantly lower (187 mg L−1, Kruskal-Wallace, Mann-Whitney, p < 0.001) than SSC at the other stage categories on the rising limb. Daily average SSL on rising limb was lower at Peak Flow Stage (570,838 tonnes) than at High Flow Stage (670,480 tonnes) and Intermediate Flow Stage (709,048 tonnes) (Table 4). On average, rising limb High Flow Stage lasted for 23 days providing a total yield of over 15.4 MT, followed by rising limb Intermediate Flow Stage with an average of 19 days, producing approximately 13.5 MT (Table 4). The greatest one day SSC occurred during rising limb Intermediate Flow Stage (992 mg L−1) and the lowest SSC occurred during the rising limb and receding limb Peak Flow Stage (79 mg L−1). The receding limb, when compared to the rising limb, showed lower average SSC and lower average SSL for all stage categories, with receding limb High Flow Stage and Intermediate Flow Stage having significantly lower SSC and lower SSL (Kruskal-Wallace, Mann Whitney, p < 0.05, Table 4).
Table 4. Sediment concentration and load on the rising and receding limbs of the flood hydrograph for different stage categories a.
Stage Condition Stage CategoryDaysTotal YieldSSLSSC
Rising LimbPeak158,560,000571,000 (182,000)187 (79–306; 60)
High2315,400,000671,000 (214,000)277 (126–604; 93)
Intermediate1913,500,000709,000 (310,000)383 (188–992; 164)
Receding LimbPeak83,620,000453,000 (140,000)145 (79–229; 45)
High158,170,000545,000 (196,000)227 (126–366; 73)
Intermediate146,260,000447,000 (141,000)245 (122–496; 82)
Note: a Days (mean), total yield (mean, tonnes), mean suspended sediment load (SSL) (standard deviation), and mean suspended sediment concentration (SSC, mg L−1 ) (minimum-maximum; standard deviation).

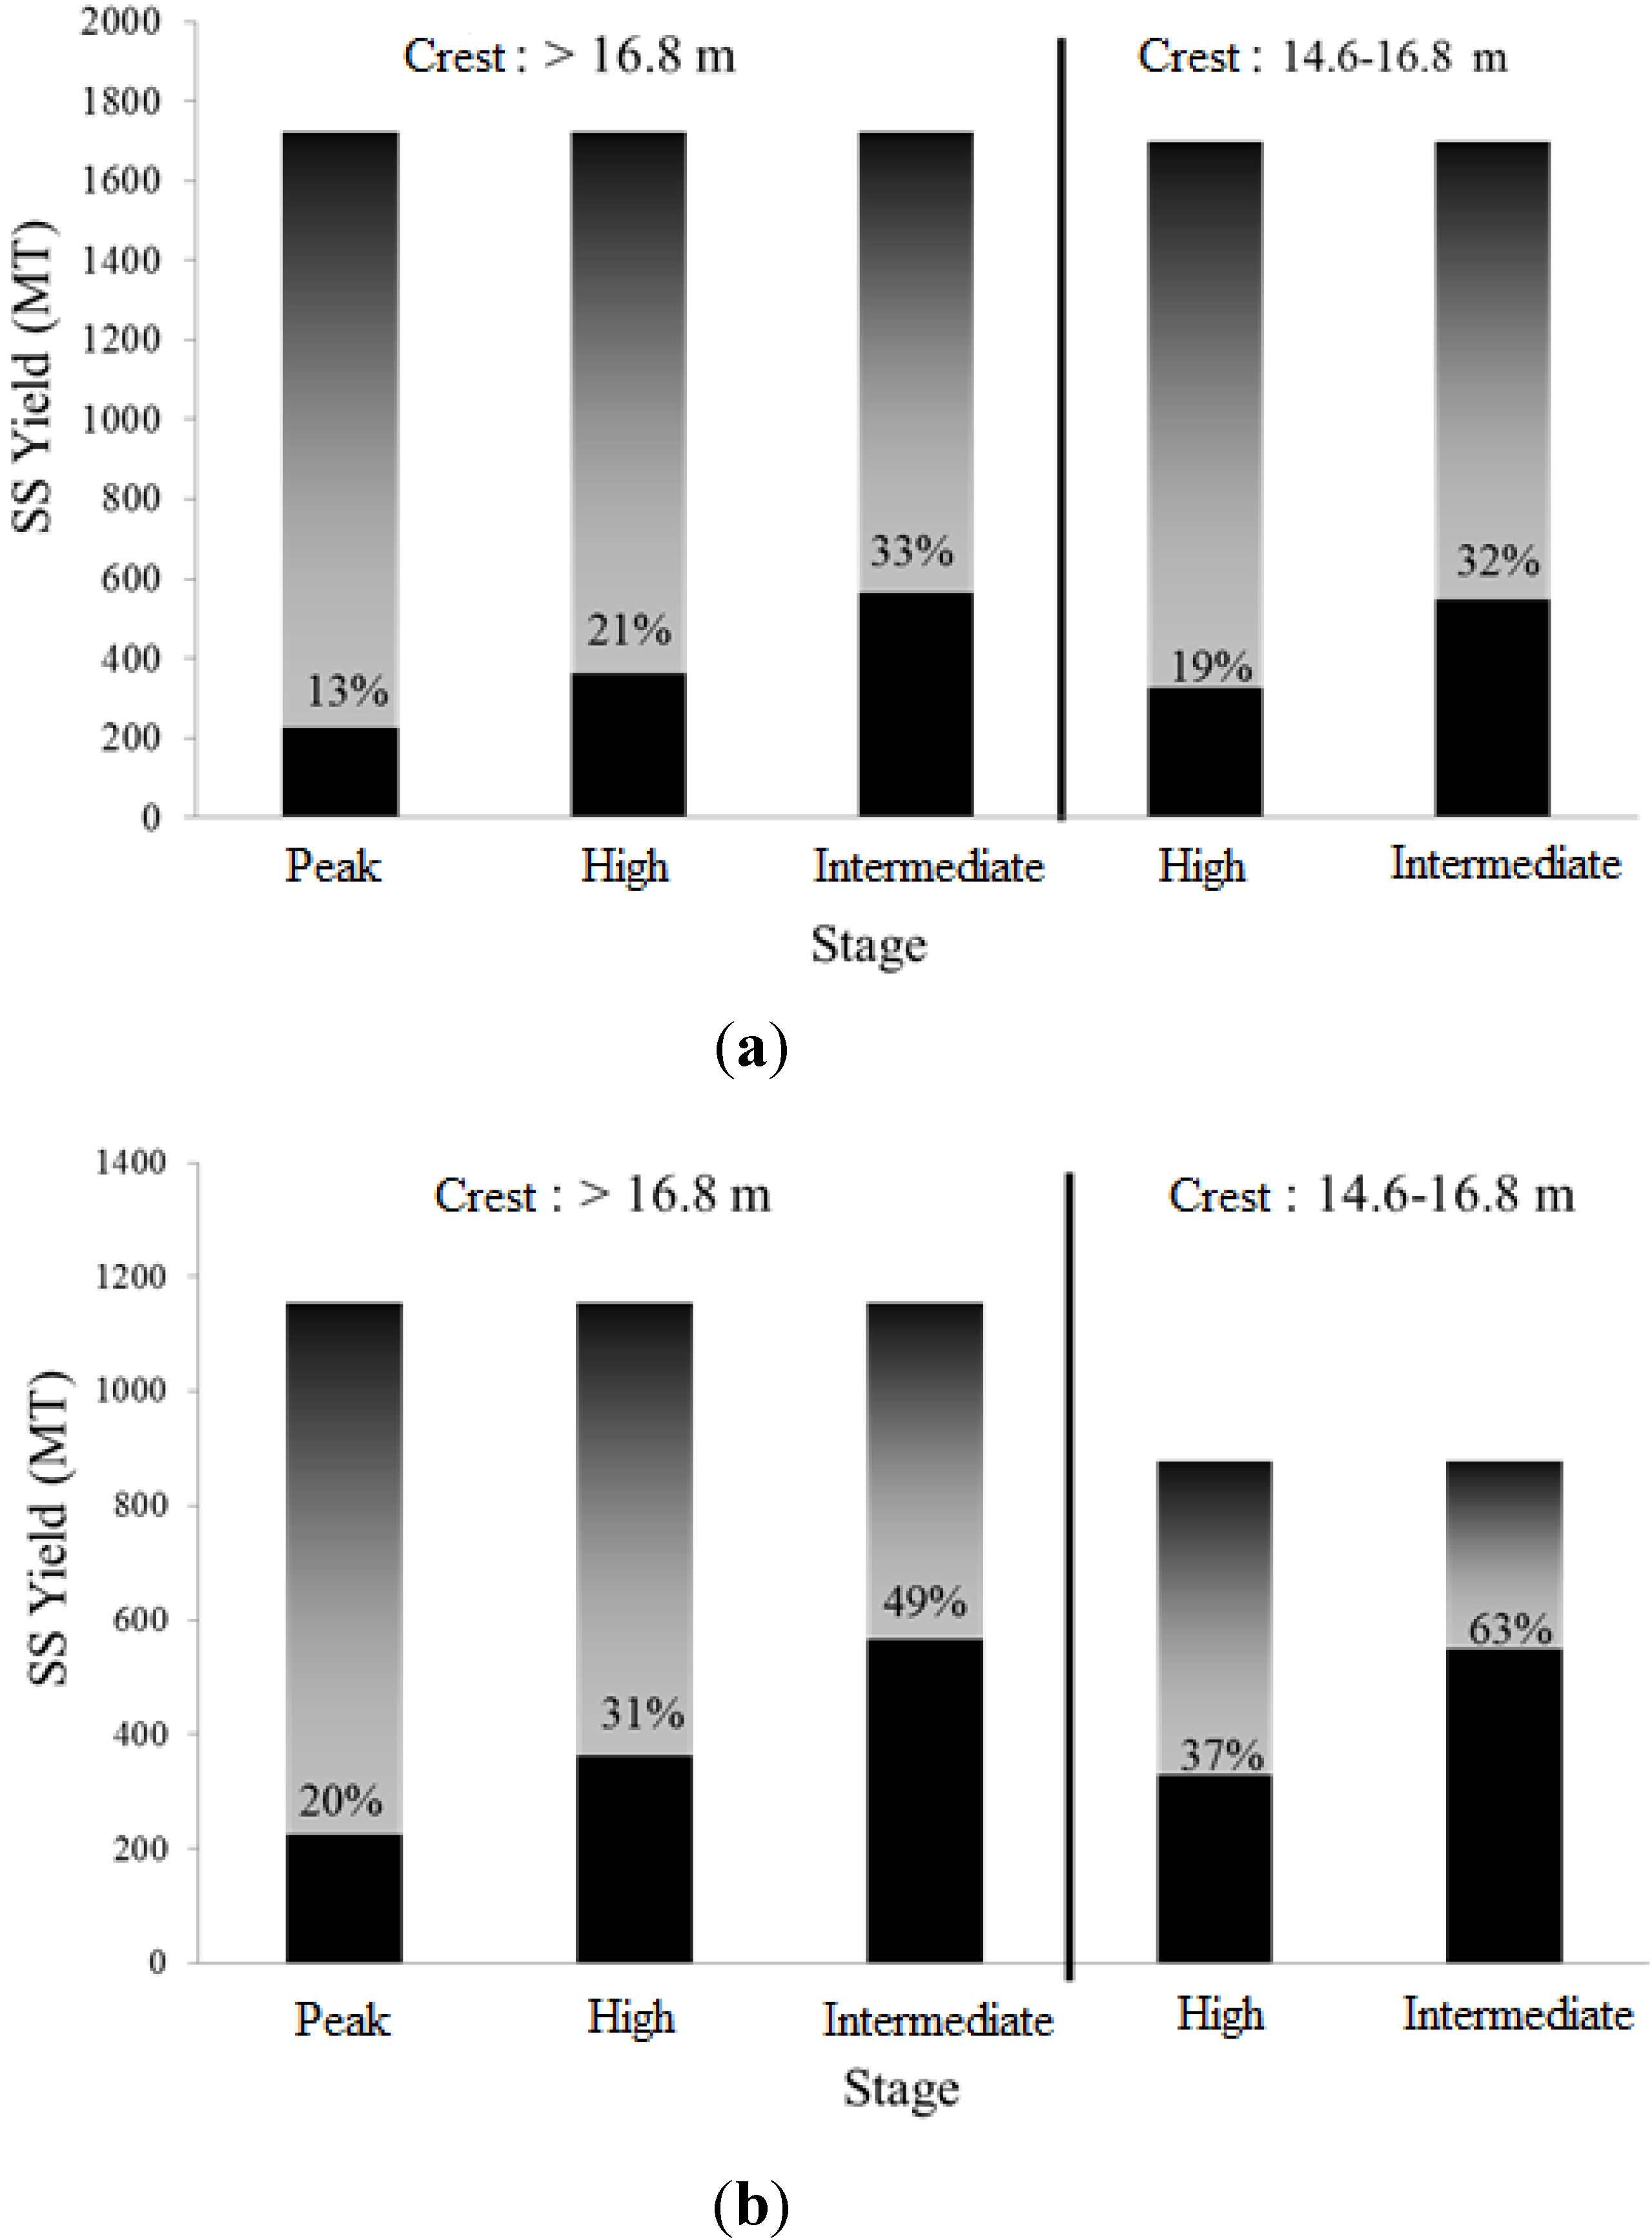
3.3. Flood Crest and Sediment Availability

During the period 1980 to 2010, Peak Flow Stage (>16.8 m) was observed in 13 years and High Flow Stage (14.6 m–16.8 m) in 26 years, while Intermediate Flow Stage (12.1 m–14.6 m) was attained every year (Table 5). High Flow Stage was the flood crest for 13 years and Intermediate Flow Stage was the flood crest for 5 years. Years in which the flood crest stage was greater than 16.8 m (Peak Flow Stage), on average, had longer flood duration in each stage category, but average SSC and average SSL was lower during the flood for each stage category when compared to years that crested between 14.6 m and 16.8 m (High Flow Stage) or 12.1–14.6 m (Intermediate Flow Stage) (Table 5). Peak Flow Stage, during years that crested at this stage (>16.8 m), had significantly lower SSC (Kruskal-Wallace, Mann-Whitney p < 0.01) than any other stage. High Flow Stage for years that crested between 14.6 m and 16.8 m averaged significantly higher SSC (Kruskal-Wallace, Mann-Whitney, p = 0.0361) and SSL (Kruskal-Wallace, Mann-Whitney p < 0.0001) than High Flow Stage of years that crested at >16.8 m. Intermediate Flow Stage average SSL was also significantly higher during years that crested at 14.6 m–16.8 m when compared to years that crested at >16.8 m (Kruskal-Wallace, Mann-Whitney, p < 0.0001). Years that crested between 12.1 m and 14.6 m had the highest average SSC, but only significantly higher than Intermediate Flow Stage during years that crested at >16.8 m (Kruskal-Wallace, Mann-Whitney, p = 0.0398) (Table 5).
Table 5. Average days, suspended sediment concentration, daily load, and yield during years that crested at Peak Flow Stage, High Flow Stage, and Intermediate Flow Stage a.
Stage (m)Stage During Flood
IntermediateHighPeak
Flood Crest>16.8Days864725
SSC300 (136.30)243 (76.36)178 (60.97)
SSL505,000 (91,000)590,000 (114,000)695,000 (103,000)
Total Yield43,400,00027,700,00017,380,000
14.6–16.8Days7438
SSC316 (155.93)296 (122.13)
SSL571,000 (108,000)666,000 (111,000)
Total Yield42,300,00025,300,000
12.1–14.6Days51
SSC352 (134.75)
SSL549,000 (100,000)
Total Yield28,000,000
Note: a Flood crest indicates the stage where the annual flood peaked. Stages used for crests are equivalent to Peak Flow Stage, High Flow Stage, and Intermediate Flow Stage. Basic statistics shown are mean days, suspended sediment concentration (SSC) (mean; standard deviation), suspended sediment load (SSL, mean; standard deviation), and average annual total suspended yield during stage.
During the years in which the flood was greater than 16.8 m, 13% of the total suspended sediment yield occurred during Peak Flow Stage, 21% during High Flow Stage, and 33% during Intermediate Flow Stage (Figure 4). As a percent of the total suspended sediment yield above the start of Intermediate Flow Stage, Peak Flow Stage accounted for 20% of the total suspended sediment, High Flow Stage accounted for 31%, and Intermediate Flow Stage accounted for 49% (Figure 4). Years that crested between 14.6 m and 16.8 m had High Flow stage, on average, account for 19% of the total suspended sediment yield and Intermediate Flow Stage account for 32% of the total suspended sediment yield (Figure 4). As a percent of the total suspended sediment yield above the start of Intermediate Flow Stage, High Flow Stage accounted for 37% of the total sediment yield and Intermediate Flow Stage 63% (Figure 4). Years that crested between 12.1 m and 14.6 m, 24% of the total suspended sediment yield occurred during Intermediate Flow Stage.
The winter flood had higher average SSC for all stage categories (values in mg L−1 descending from highest stage category, Winter: 216, 331, 322, Spring: 166, 246, 307) (Figure 5). However, the spring flood had greater average SSL in the Peak Flow Stage (702,000 tonnes) and Intermediate Flow Stage categories (549,000 tonnes) when compared with the winter flood (Peak Flow Stage: 664,000 tonnes; Intermediate Flow Stage: 528,000 tonnes) (Figure 5). The Mississippi River had nearly identical discharge at Intermediate Flow Stage during both spring and winter floods (Figure 5).
Figure 4. Percent averages for Peak Flow and High Flow Years as a percentage of total suspended sediment yield (a) and total flood suspended sediment yield (b). Horizontal axis categories correspond to different stage categories during the flood.
Water 06 00564 g004
Figure 5. Mean river discharge (a); suspended sediment concentration (b); and suspended sediment load (c) under three stage categories during spring and winter floods.
Water 06 00564 g005

4. Discussion

The results presented offer a number of important insights into the sediment dynamics and availability associated with different river flow conditions. Previous studies have shown a declining trend in Mississippi River sediment discharge following the 1950s to 1960s construction of dams, cutoffs, training structures, soil conservation and bank stabilization structures [25,26,47]. A decline of sediment discharge has occurred in many of the world’s rivers due to construction of dams and soil conservation practices [48]. Meade and Moody [26] reported an overall decline in the long-term trend (1950s to 2000s) of total suspended sediment loads at TBL. Our analysis shows that there was actually slight upward (albeit non-significant) shift of SSL since the early 1990s (Figure 2). Horowitz [27] suggested the change started in 1993, while we believe the long-term decline of Mississippi River SSL ended in 1989. This trend was not caused by changes in discharge, but by changes in SSC (Seasonal Mann-Kendall, p = 0.022). From 1980 to 1986 SSCs were elevated compared to the rest of the time period. Following 1986, the Mississippi River at TBL went through dramatic SSC reduction from an average of 323 mg L−1 in 1986 to a low of 162 mg L−1 in 1988. This reduction of SSC and discharge could have been related to a severe drought that affected the Midwestern United States that did not officially break until 1990 [49]. Another possibility is that the opening of the Auxiliary Structure at the Old River Control Structure (ORCS), in December 1986, could have affected sediment concentrations by diverting a greater portion of the sand load [50]. Since 1989, there has been great fluctuation but an overall general increase in average SSC from 163 mg L−1 in 1989 to 289 mg L−1 in 2010. The years 2008, 2009, and 2010 are notable because SSCs are all in the top ten for the time period (1980–2010). The increase may reflect suspended sediment slowly reaching equilibrium following the severe drought of 1988 to1990, opening of the Auxiliary Structure in 1986, and large flood of 1993. The trend suggests that without any further major alterations to Mississippi River engineering, land use changes, or drastic climate shifts, current sediment load will likely remain stable for the foreseeable future.
There is little doubt that the most important discharge values for sediment diversion are those greater than 15,000 m3 s−1 (approximately 11.0 m stage at RRL). Our analysis identified that Peak Flow Stage had low SSC, but high discharge, thus maximizing freshwater rather than total suspended sediment. SSC was maximized just before Intermediate Flow Stage, above the 15,000 m3 s−1 threshold (Figure 3). The higher SSC, in combination with the longer duration that the hydrograph stayed in Intermediate Flow Stage and High Flow Stage, produced the greatest total suspended sediment yield. Over the period, regardless of rising limb or receding limb, discharge during these stages produced an average yield of 26.6 MT during High Flow Stage and 40.5 MT during Intermediate Flow Stage (Table 2). Between different years, High Flow Stage was consistent, providing on average 27.7 MT during years that crested at >16.8 m (Peak Flow Stage) and 25.3 MT during years that crested between 14.6 m and 16.8 m (High Flow Stage). Intermediate Flow Stage displayed the same consistency with 43.4 MT (flood crest >16.8 m), and 42.3 MT (flood crest between 14.6 m and 16.8 m). The overall consistency between years was due to higher average SSC during the years that had a lower flood crest (14.6 m–16.8 m) making up for differences in duration (Table 5). Mossa [36] identifies that differences in SSC between annual floods can be attributed to the maxima of SSC occurring earlier during large floods and nearly coincident with the crest during minor floods. Successive flood events produced a decrease in magnitude of the SSC maxima [36]. If there was a winter flood before the spring flood there was lower SSC during the spring flood. This is demonstrated in the results for the seasonal analysis where higher SSC was observed during the winter flood (Figure 5).
On the flood pulse portion of the hydrograph our study showed that SSC is maximized on the rising limb during Intermediate Flow Stage and High Flow Stage. Other studies on the lower Mississippi River [34,35] corroborate this finding with Mossa [36] describing the sediment peak occurring more than 40 days before the discharge peak, and Allison et al. [37] indicating that sediment maxima occurs during a one week period on the rising limb. Snedden et al. [16] also reported that sediment delivery through the Caernarvon Diversion Outfall Management Project was greatest during the rising limb. In our study the rising limb, of an average flood pulse, provided 13.5 MT at Intermediate Flow Stage and 15.4 MT at High Flow Stage. To put this in perspective, this amount of sediment is comparable to the average amount, 20 MT reported by Xu and Wang [51], that is discharged through Wax Lake Outlet, a man made diversion created on the Atchafalaya River (largest Mississippi River distributary) in 1942 to alleviate flooding in Morgan City, LA. Since 1973, Wax Lake Outlet has seen subaerial land growth, generating one of the few prograding coastlines in Louisiana [52]. This indicates the importance of implementing sediment diversions during the early portion of the flood pulse to maximize total suspended sediment capture.
Quantifying the amount of total suspended sediment passing TBL gives a good indication of the available sediment resource to the Mississippi River Delta Plain. Still, translating the sediment loads calculated for TBL to diversions further down river requires careful analysis on river hydraulics and bed sediment. Allison et al. [37] identify this, quantifying that 43% of the total suspended sediment load bypassing TBL (river mile 306.3) was retained along the river stretch to Belle Chasse, LA (river mile 75.9). This is corroborated by other research that found the low stream velocity near Belle Chasse, LA caused the bed fraction to be composed of greater quantities of silt/clay compared to areas further upriver [34,53,54]. Even with this different dynamic at Belle Chasse, LA, this section of the river still maintains a similar hydrograph pattern to Tarbert Landing, MS, including higher SSC during the rising limb and decreasing at higher discharges and the receding limb [34]. The similar hysteresis at Belle Chasse, LA would indicate that effective management of sediment diversions in the reach extending upstream to TBL should take advantage of stage to maximize sediment.
Building upon the previous statement, an example of how stage hydrograph sediment analysis can benefit freshwater diversion projects can be drawn from Davis Pond Freshwater Diversion (DPFD) (river mile 118), 42.1 river miles upstream of Belle Chasse, LA and 24 miles west of New Orleans, LA (Figure 1). Current management strategies of Louisiana freshwater diversions have produced poor long-term results (see introduction). An alternative approach could be taken where levee crest elevations are dropped to the level of Intermediate Flow Stage allowing the flood pulse to act naturally through a process of Controlled Overbank Flooding for sedimentation proposed by Xu and Rosen [41]. Use of the flood pulse has been proposed as an effective method to maintain deltas against relative sea level rise [30]. Observational data from Snedden et al. [16] and Day et al. [55] documented higher sediment concentration and therefore greater sedimentation behind the Caernarvon Diversion during the rising limb of winter or spring flood pulses. To implement COS at DPFD an Intermediate Flow Stage can be determined based off the data from RRL using a two day lag (Figure 6). For instance, an equivalent Intermediate Flow Stage for Carrollton, New Orleans (river mile 102.8) east of the diversion, would be 2.9 m. Equivalent High Flow Stage would be 3.73 m and Peak Flow Stage would be 4.47 m. Current levees in this section of the river protect up to 7.3 m. If levee crest elevation were reduced to Intermediate Flow Stage level it would provide, on average, 137 days of freshwater and sediment, staying at Intermediate Flow Stage for 62 days, High Flow Stage for 44 days, and Peak Flow Stage for 31 days (variability between years, 1993: 268 days, 2006: four days). Using this method would take full advantage of the flood pulse elevated total suspended sediment, and restore a more natural hydrological regime to the area.
Utilization of this hydrograph-based approach could also be beneficial to diversion regulation of the Mississippi River’s water into the Atchafalaya River at the Old River Control Structure (ORCS). Currently the structure controls an average diversion rate of approximately 25% of the Mississippi River’s flow [27]. With the ability to estimate when the most sediment is arriving to the lower river via TBL (just south of the structure) the ratio being diverted can be adjusted between the Atchafalaya River and the Mississippi River. Based on this study’s findings we suggest that during the rising limb from Intermediate Flow Stage through High Flow Stage the diversion ratio should be reduced so that more sediment is forced down the lower Mississippi River. The diversion ratio can be increased during higher discharges to use the expansive Atchafalaya Basin as a floodplain as well as decrease sedimentation within the basin and possibly increasing scour by using a larger portion of the relatively sediment starved rising limb Peak Flow Stage and receding limb. To implement such an aggressive plan would need much study, but could have beneficial results for both Mississippi River Delta management, and Atchafalaya River Basin management.
Figure 6. Relationship of the river stage between Red River Landing (RRL, river mile 302.4) and Carrolton, New Orleans (CAR, river mile 102.8), from 1980 to 2010. A two-day lag was used to account for the distance between stations.
Water 06 00564 g006

5. Conclusions

This study has analyzed sediment availability under different flow conditions of the lower Mississippi River at Tarbert Landing, MS using river discharge and sediment records from 1980 to 2010. It is the first detailed quantification of total suspended sediment resources from the river during its flood pulses to coastal Louisiana. Three important conclusions arise from this long-term data assessment:
(1)
A hydrograph-based analysis of sediment is critical for determining the actual availability of riverine sediment due to the variability of the quantity and timing of total suspended sediment during Mississippi River flood pulses. This can be completed for other river locations where sediment diversion is considered;
(2)
The high sediment load at Intermediate Flow Stage and High Flow Stage provide approximately 50% of the total annual suspended sediment yield over a period of only 120 days. This implies that sediment diversion outside of this period would be impractical highlighting the need to manage diversions to follow the natural flood regime;
(3)
The most effective sediment diversions will rely on discharge during the rising limb of flood pulses to capture the largest quantities of sediment. Knowing that discharge during the rising limb Intermediate Flow Stage and High Flow Stage provide the greatest amount of sediment, managers can effectively operate diversions based on predictions of the timing of a flood pulse moving down the lower Mississippi River.

Acknowledgments

The authors thank the Louisiana Sea Grant College Program for providing a graduate research assistantship for Timothy Rosen and the National Science Foundation for providing financial support during this study (award number: 1212112). The authors thank the United States Geological Survey and United States Army Corps of Engineers for making the long-term data on the lower Mississippi River discharge, stage, and suspended sediment concentration available. The authors would also like to thank Emily Rosen and April Bryant-Mason for their assistance.

Conflicts of Interest

The authors declare no conflict of interest.

References

  1. Couvillion, B.R.; Barras, J.A.; Steyer, G.D.; Sleavin, W.; Fischer, M.; Beck, H.; Nadine, T.; Griffin, B.; Heckman, D. Land Area Change in Coastal Louisiana from 1932 to 2010; U.S. Geological Survey Scientific Investigations Map 3164, Scale 1:265,000; United States Geological Survey: Reston, VA, USA, 2011; p. 12.
  2. Britsch, L.D.; Dunbar, J.B. Land-loss rates: Louisiana coastal plain. J. Coast. Res. 1993, 9, 324–338. [Google Scholar]
  3. Barras, J.; Padgett, W.C.; Sanders, C.B. Aerial and Bathymetric Spatial Change Analysis of the West Bay Sediment Diversion Receiving Area, Louisiana, for U.S. Army Engineer District, New Orleans (MVN); Report MR-03; Mobile District Operations Division, Spatial Data Branch: Mobile, AL, USA, 2009; p. 39. [Google Scholar]
  4. Gagliano, S.M.; Meyer-Arendt, K.J.; Wicker, K.M. Land loss in the Mississippi River Deltaic Plain. Trans. Gulf Coast Assoc. Geol. Soc. 1981, 20, 295–300. [Google Scholar]
  5. Walker, H.J.; Coleman, J.M.; Roberts, H.H.; Tye, R.S. Wetland Loss in Louisiana. Geogr. Ann. Ser. A Phys. Geogr. 1987, 69, 189–200. [Google Scholar] [CrossRef]
  6. Kesel, R.H. The role of the Mississippi River in wetland loss in Southeastern Louisiana, U.S.A. Environ. Geol. 1989, 13, 183–193. [Google Scholar]
  7. Yuill, B.; Lavoie, D.; Reed, D.J. Understanding subsidence processes in coastal Louisiana. J. Coast. Res. 2009, 54, 23–36. [Google Scholar] [CrossRef]
  8. Louisiana Coastal Wetlands Conservation and Restoration Task Force and the Wetlands Conservation and Restoration Authority (LDNR). Coast 2050: Toward a Sustainable Coastal Louisiana; Louisiana Department of Natural Resources: Baton Rouge, LA, USA, 1998; p. 161.
  9. Coastal Protection and Restoration Authority of Louisiana (CPRA). Louisiana’s Comprehensive Master Plan for a Sustainable Coast; Coastal Protection and Restoration Authority of Louisiana: Baton Rouge, LA, USA, 2012.
  10. Sable, S.E.; Villarrubia, C. Analysis of Fisheries-Independent Data for Evaluation of Species Distribution Responses to the Caernarvon Freshwater Diversion; Louisiana Applied Coastal Engineering and Science Division, Office of Coastal Protection and Restoration: Baton Rouge, LA, USA, 2011; p. 86. [Google Scholar]
  11. Louisiana Department of Natural Resources (LDNR). Davis Pond Freshwater Diversion Project Annual Report 2003–2004; Louisiana Department of Natural Resources: Baton Rouge, LA, USA, 2005; p. 51.
  12. Office of Coastal Protection and Restoration (OCPR). Davis Pond Freshwater Diversion Project Operational Plan 2011; Louisiana Department of Natural Resources: Baton Rouge, LA, USA, 2011; p. 2.
  13. Moore, S.; Carter, B.; Bernard, T. Operations, Maintenance, and Monitoring Report for Caernarvon Diversion Outfall Management (BS-03a); Coastal Protection and Restoration Authority of Louisiana: New Orleans, LA, USA, 2011; pp. 1–52. [Google Scholar]
  14. Kearney, M.S.; Alexis Riter, J.C.; Turner, R.E. Freshwater river diversions for marsh restoration in Louisiana: Twenty-six years of changing vegetative cover and marsh area. Geophys. Res. Lett. 2011, 38, L16405–L164056. [Google Scholar]
  15. Office of Coastal Protection and Restoration (OCPR). Davis Pond Freshwater Diversion Project Draft Annual Report 2007–2009. Louisiana Department of Natural Resources: Baton Rouge, LA, USA, 2010; pp. 1–23. [Google Scholar]
  16. Snedden, G.A.; Cable, J.E.; Swarzenski, C.; Swenson, E. Sediment discharge into a subsiding Louisiana deltaic estuary through a Mississippi River diversion. Estuar. Coast. Shelf Sci. 2007, 71, 181–193. [Google Scholar] [CrossRef]
  17. Howes, N.C.; FitzGerald, D.M.; Hughes, Z.J.; Georgiou, I.Y.; Kulp, M.A.; Miner, M.D.; Smith, J.M.; Barras, J.A. Hurricane-induced failure of low salinity wetlands. Proc. Natl. Acad. Sci. USA 2010, 107, 14014–14019. [Google Scholar] [CrossRef]
  18. Carter, B. Monitoring Plan for West Bay Sediment Diversion State Project Number MR-03; Coastal Protection and Restoration Authority of Louisiana, Office of Coastal Protection and Restoration: New Orleans, LA, USA, 2003; p. 12.
  19. United States Army Corps of Engineers (USACE). Fact Sheet West Bay Sediment Diversion (MR-03); United States Army Corps of Engineers and Louisiana Department of Natural Resources: New Orleans, LA, USA, 2009; p. 2.
  20. Brown, G.; Callegan, C.; Heath, R.; Hubbard, L.; Little, C.; Luong, P.; Martin, K.; McKinney, P.; Perky, D.; Pinkard, F.; et al. ERDC Workplan Report-Draft, West Bay Sediment Diversion Effects; Coastal and Hydraulics Laboratory, U.S Army Engineer Research and Development Center: Vicksburg, MS, USA, 2009; p. 263.
  21. Louisiana Wildlife Federation. West Bay Diversion Closure; Resolution No. 8B, 2012; Louisiana Wildlife Federation: Baton Rouge, LA, USA, 2012; p. 3. [Google Scholar]
  22. Heath, R.E.; Sharp, J.A.; Pinkard, C.F., Jr. 1-Dimensional modeling of sedimentation impacts for the Mississippi River at the West Bay Diversion. In Proceedings of the 2nd Joint Federal Interagency Conference, Las Vegas, NV, USA, 27 June–1 July 2010.
  23. Kolker, A.S. Depositional dynamics in a river diversion receiving basin: The case of the West Bay Mississippi River Diversion. Estuar. Coast. Shelf Sci. 2012, 106, 1–12. [Google Scholar] [CrossRef]
  24. Moffatt and Nichol. Delta Building Diversion at Myrtle Grove (BA-33) Alternative Modeling; Louisiana Department of Natural Resources: Baton Rouge, LA, USA, 2008.
  25. Kesel, R.H. The decline in the suspended load of the lower Mississippi River and its influence on adjacent wetlands. Environ. Geol. Water Sci. 1988, 11, 271–281. [Google Scholar] [CrossRef]
  26. Meade, R.H.; Moody, J.A. Causes for the decline of suspended-sediment discharge in the Mississippi River system, 1940–2007. Hydrol. Process. 2010, 24, 35–49. [Google Scholar]
  27. Horowitz, A.J. A quarter century of declining suspended sediment fluxes in the Mississippi River and the effect of the 1993 flood. Hydrol. Process. 2010, 24, 13–34. [Google Scholar]
  28. Thorne, C.; Harmar, O.; Watson, C.; Clifford, N.; Biedenham, D.; Measures, R. Current and historical sediment loads in the lower Mississippi River; Contract Number 1106-EN-01; United States Army European Research Office of the U.S Army: London, UK, 2008.
  29. Junk, W.J.; Bayley, P.B.; Sparks, R.E. The flood pulse concept in river-floodplain systems. Can. Spec. Publ. Fish Aquat. Sci. 1989, 106, 110–127. [Google Scholar]
  30. Day, J.W.; Pont, D.; Hensel, P.F.; Ibanez, C. Impacts of sea-level rise on deltas in the Gulf of Mexico and the Mediterranean: The importance of pulsing events to sustainability. Estuaries 1995, 18, 636–647. [Google Scholar] [CrossRef]
  31. Sparks, R.E. Need for ecosystem management of large rivers and their floodplains. BioScience 1995, 45, 168–182. [Google Scholar] [CrossRef]
  32. Bayley, P.B. Understanding large river-floodplain ecosystems. BioScience 1995, 45, 153–157. [Google Scholar] [CrossRef]
  33. Walling, D.H.; He, Q. The spatial variability of overbank sedimentation on river floodplains. Geomorphology 1998, 24, 209–223. [Google Scholar] [CrossRef]
  34. Allison, M.A.; Meselhe, E.A. The use of large water and sediment diversions in the lower Mississippi River (Louisiana) for coastal restoration. J. Hydrol. 2010, 387, 346–360. [Google Scholar] [CrossRef]
  35. Baumann, R.H.; Day, J.W.; Miller, C.A. Mississippi Deltaic wetland survival: Sedimentation versus coastal submergence. Science 1984, 224, 1093–1095. [Google Scholar]
  36. Mossa, J. Sediment dynamics in the lowermost Mississippi River. Eng. Geol. 1996, 45, 457–479. [Google Scholar] [CrossRef]
  37. Allison, M.A.; Demas, C.R.; Ebersole, B.A.; Kleiss, B.A.; Little, C.D.; Meselhe, E.A.; Powell, N.J.; Pratt, T.C.; Vosburg, B.M. A water and sediment budget for the lower Mississippi-Atchafalaya River in flood years 2008–2010: Implications for sediment discharge to the oceans and coastal restoration in Louisiana. J. Hydrol. 2012, 432, 84–97. [Google Scholar]
  38. Baca, P. Hysteresis effect in suspended sediment concentration in the Rybarik basin, Slovakia. Hydrol. Sci. J. 2008, 53, 224–235. [Google Scholar]
  39. Banasik, K.; Madeyski, M.; Mitchell, J.K.; Mori, M. An investigation of lag times for rainfall-runoff-sediment yield events in small river basins. Hydrol. Sci. J. 2005, 50, 857–866. [Google Scholar]
  40. Tramblay, Y.; St-Hilaire, A.; Ouarda, T.B.M.J. Frequency analysis of maximum annual suspended sediment concentrations in North America. Hydrol. Sci. J. 2008, 53, 236–252. [Google Scholar] [CrossRef]
  41. Xu, Y.J.; Rosen, T.R. Are riverine sediment discharges sufficient to offset the sinking coast of Louisiana? In Erosion and Sediment Yields in the Changing Environment; IAHS Publication: Wallingford, UK, 2012; pp. 104–113. [Google Scholar]
  42. Skinner, J. A Spreadsheet Analysis of Suspended Sediment Sampling Errors, in Federal Interagency Sedimentation Project, Waterways Experiment Station, Report TT; Waterways Experiment Station: Vicksburg, MS, USA, 2007; pp. 1–16. [Google Scholar]
  43. Edwards, T.K.; Glysson, G.D. Field methods for measurement of fluvial sedimen. In Techniques of Water-Resources Investigations; U.S. Geological Survey: Reston, VA, USA, 1999; Book 3, Chapter C2; pp. 1–87. [Google Scholar]
  44. Beverage, J.P. Determining true depth of samplers suspended in deep, swift rivers. In A Study of Methods and Measurement Analysis of Sediment Loads in Streams; Report GG; Federal Interagency Sedimentation Project: Minneapolis, MN, USA, 1987; pp. 1–56. [Google Scholar]
  45. Duan, N. Smearing estimate: A nonparametric retransformation method. J. Am. Stat. Assoc. 1983, 78, 605–610. [Google Scholar] [CrossRef]
  46. Helsel, D.R.; Mueller, D.K.; Slack, J.R. Computer Program for the Kendall Family of Trend Tests; USGS Scientific Investigations Report 2005–5275; U.S. Geological Survey: Reston, VA, USA, 2006; p. 8. [Google Scholar]
  47. Keown, M.P.; Dardeau, E.A., Jr.; Causey, E.M. Historic trends in the sediment flow regime of the Mississippi River. Water Resour. Res. 1986, 20, 1555–1564. [Google Scholar]
  48. Walling, D.E. The changing sediment loads of the world’s rivers. Ann. Warsaw Univ. Life Sci. SGGW Land Reclam. 2008, 39, 3–20. [Google Scholar] [CrossRef]
  49. Trenberth, K.E.; Guillemot, C.J. Physical processes involved in the 1988 drought and 1993 floods in North America. J. Clim. 1995, 9, 1288–1298. [Google Scholar] [CrossRef]
  50. Copeland, R.R.; Thomas, W.A. Lower Mississippi River Tarbert Landing to East Jetty Sedimentation Study, Numerical Model Investigation; Technical Report HL-92-6; Department of the Army Waterways Experiment Station, Corps of Engineers: Vicksburg, MS, USA, 1992; p. 106. [Google Scholar]
  51. Xu, Y.J.; Wang, F. Transport and delivery of suspended sediment to Atchafalaya Bay of the northern Gulf of Mexico. J. Hydrol. 2014. submitted for publication. [Google Scholar]
  52. Roberts, H.H.; Coleman, J.M.; Bentley, S.J.; Walker, N. An embryonic major delta lobe: A new generation of delta studies in the Atchafalaya-Wax Lake Delta system. Gulf Coast Assoc. Geol. Soc. Trans. 2003, 53, 690–703. [Google Scholar]
  53. Demas, C.R.; Curwick, P.B. Suspended-Sediment and Associated Chemical Transport Characteristics of the Lower Mississippi River, Louisiana; Technical Report No. 45; USGS and Louisiana Department of Transportation and Development Water Resources: Baton Rouge, LA, USA, 1988; p. 51. [Google Scholar]
  54. Galler, J.J.; Allison, M.A. Estuarine controls on fine-grained sediment storage in the Lower Mississippi and Atchafalaya Rivers. Geol. Soc. Am. Bull. 2008, 120, 386–398. [Google Scholar] [CrossRef]
  55. Day, J.W.; Cable, J.E.; Cowan, J.H.; DeLaune, R.; de Mutsert, K.; Fry, B.; Mashriqui, H.; Justic, D.; Kemp, P.; Lane, R.R.; et al. The impacts of pulsed reintroduction of river water on a Mississippi Delta coastal basin. J. Coast. Res. 2009, 54, 225–243. [Google Scholar]

