Sorption of Emerging Organic Wastewater Contaminants to Four Soils


Colorado School of Mines, Golden, CO 80401, USA
*
Author to whom correspondence should be addressed.
Water 2014, 6(4), 1028-1042; https://doi.org/10.3390/w6041028
Submission received: 3 March 2014
/
Revised: 17 April 2014
/
Accepted: 18 April 2014
/
Published: 24 April 2014
(This article belongs to the Special Issue Advances in On-Site Wastewater Treatment and Technologies to Characterize the Fate and Transport of Wastewater Constituents)
Abstract
:Conventional onsite wastewater treatment system design relies on a septic tank and soil treatment unit (STU) for treatment of wastewater and integration of the final effluent into the environment. Organic water contaminants (OWCs), chemicals found in pharmaceutical drugs, detergents, surfactants, and other personal care and cleaning products, have been observed in septic tank effluent and the environment. Sorption of OWC mass to soil is a key mechanism in the removal and retardation of many of these chemicals in effluent as it travels through an STU. The primary purpose of this study was to investigate the relationship between the fraction of organic carbon of soil and the equilibrium sorption partitioning coefficient of a selected group of relevant and diverse OWCs. A secondary goal is to evaluate current methods of modeling the sorption of selected OWCs in soil. Five point Freundlich isotherms were constructed from equilibrium sorption batch tests for target OWCs with four different soils. For soils with organic carbon fraction between 0.021 and 0.054, Kd values were calculated between 60 and 185 for 4-nonylphenol, 75 to 260 for triclosan, 115 to 270 for bisphenol-A, 3 to 255 for 17β-estradiol, 40 to 55 for 17α-ethynylestradiol, and 28 to 70 for estrone. An empirically derived, direct relationship between foc and Kd may be a useful approach to estimating sorption for a soil based on organic carbon content.
1. Introduction
Approximately one fifth of the US population is served by onsite wastewater treatment systems (OWTSs), which are a significant and growing means of wastewater treatment in the US [1]. Conventional designs rely on a soil treatment unit (STU) for additional treatment of engineered-unit effluent (such as septic tank effluent) prior to discharge to the environment. Organic wastewater contaminants (OWCs) include a suite of wastewater chemicals such as pharmaceuticals, surfactants, and other personal care products. While the presence of OWCs in OWTS effluent has been well documented [2,3], to date, the factors dictating the efficacy of STUs to remove OWCs have not been comprehensively characterized.
OWCs can have a wide array of ecotoxicological effects and negative impacts on environmental systems. Endocrine disrupting chemicals (EDCs) are a subclass of OWCs that can impair reproductive development and hormone production in some organisms. This effect has been well documented in fish and amphibians, with some populations experiencing skewed gender ratios and/or feminization of males [4]. Other OWCs can affect the renal system, leading to kidney failure [5], while still others are carcinogenic and/or mutagenic [6]. In addition, antimicrobial OWCs may contribute to the evolution of resistant strains of bacteria [7,8,9]. Given these potential adverse impacts and the large and growing fraction of US wastewater treated by STUs, an accurate understanding of the factors controlling the removal of OWCs in STUs is needed. Moreover, this knowledge will aid in the understanding, design and operation of STUs so as to minimize environmental impacts.
One of the major factors controlling the attenuation of OWCs in STUs is removal via sorption to soil media. Building from traditional organic contaminant partitioning paradigms, most sorption models for OWCs assume that the soil-water partitioning coefficients are related to the organic carbon content (i.e., foc) of the soil material (Equation (1)) [10,11,12,13,14,15]:
where Koc is the organic carbon-normalized partition coefficient, and Kd is the soil-water partitioning coefficient. These Koc values can in turn be calculated from the octanol-water partition coefficient (Kow) using various linear free energy relationships [16,17,18].
Kd = Koc × foc
For this study, a representative suite of OWCs was selected to examine whether this modeling paradigm is appropriate for sorption of OWCs to soils typical of those used in STUs. This suite includes triclosan (TCS), 4-nonylphenol (NP), bisphenol-A (BPA), estrone (E1), 17β-estradiol (E2), and 17α-ethynylestradiol (EE2). These target OWCs are ubiquitous in wastewater effluent at significant concentrations [2,19,20] and have demonstrated ecotoxicological effects [4,7,8,21,22,23,24,25].
The overarching goal of this study was to investigate the relationship between the foc of a soil and the Kd of a selected group of relevant and diverse OWCs. In addition, data describing the sorption of these OWCs to a variety of soil types was developed, and current methods of modeling the sorption of the selected OWCs in soil were briefly evaluated.
2. Materials and Methods (or Experimental)
2.1. Chemicals and Soil
Source information and Chemical Abstract Services Registry Number (CASRN) for the six OWCs selected for this study are included in Table 1.

Table 1.
Chemical source, Chemical Abstract Services Registry Number (CASRN), Gas Chromatography Mass Spectrometry (GC/MS) retention times, and chemical indicator ions, with qualifying ions used for peak identification in parentheses.
| Chemical | Source | CASRN | Retention Time (min) | Qualifying Ions (m/z) |
|---|---|---|---|---|
| Triclosan | KIC Chem, New Paltz, NY, USA | 3380-34-5 | 16.682 | 289.9 (218.0, 146.0) |
| 4-Nonylphenol | Aldrich, St. Louis, MO, USA | 25154-52-3 | 8.22–12.0 | 135.1 (220.2, 107.1, 121.1) |
| Bisphenol A | Aldrich, St. Louis, MO, USA | 80-05-7 | 17.610 | 213.1 (228.1, 119.0) |
| Estrone | Aldrich, St. Louis, MO, USA | 53-16-7 | 23.931 | 270.2 (146.1, 185.1, 172.1) |
| 17b-Estradiol | Aldrich, St. Louis, MO, USA | 50-28-2 | 24.106 | 272.2 (160.1, 213.1) |
| 17a-Ethynylestradiol | Aldrich, St. Louis, MO, USA | 57-63-6 | 24.993 | 213.1 (296.2, 160.1, 133.1) |
| 4-normal-nonylphenol | Ehrenstorfer, Augsburg, Germany | 104-40-5 | 12.785 | 107.05 (220.2, 77.0) |
| d6 Bisphenol A | CIL, Tewksbury, MA, USA | 86588-58-1 | 17.551 | 216.1 (234.1, 121.1) |
| d4 17β-estradiol | CIL, Tewksbury, MA, USA | 66789-03-5 | 24.084 | 276.2 (161.1, 147.1, 214.1) |
Four soils were obtained from locations in Colorado, Nevada, and North Dakota, and bulk soil parameters were measured by a commercial laboratory for each soil type and included: pH, organic carbon content (foc), particle size distribution, and cation exchange capacity (Table 2).
Table 2.
Soil characteristics for the four soils considered in sorption batch tests. CEC is the cation exchange capacity.
| Characteristic | Sand | Loamy Sand | Sandy Loam | Loam |
|---|---|---|---|---|
| Organic Carbon (%) | 0.1 | 2.1 | 3.1 | 5.4 |
| Soil pH | 10.4 | 5.8 | 6.7 | 6.9 |
| CEC (cmol(+)/kg) | 6.0 | 12.0 | 11.3 | 26.4 |
| Ca (% of cations) | 86.6 | 54.2 | 73.3 | 66.2 |
| Mg (% of cations) | 10.9 | 12.5 | 19.6 | 16.7 |
| K (% of cations) | 1.0 | 10.2 | 6.6 | 5.4 |
| Na (% of cations) | 1.4 | 1 | 0.5 | 0.4 |
| % Sand | 98 | 86 | 65 | 30 |
| % Silt | 0.8 | 6 | 15 | 44 |
| % Clay | 1.2 | 8 | 20 | 26 |
2.2. Experimental Setup
Sorption isotherms were developed for the six OWCs in the four soils using the aqueous-loss batch approach. Simulated fresh water composed of 0.01 M calcium chloride (CaCl2) was used with a 1:5 soil-water mass ratio in 40 mL glass centrifuge tubes for all replicates and concentrations. This ratio was successfully used in previous experiments involving similar soil [2] and in sorption experiments using the same analytes and similar soil [26]. Prior to initiation of the isotherm experiments, the four soils (sand, loamy sand, sandy loam, and loam) were autoclaved twice for 45 min at 121 °C and 103 kPa to inactive any microbes present and minimize losses due to biodegradation. Preliminary studies comparing sterilization methods found no significant differences in sorption for autoclaved soil when compared to 5% sodium azide biocide solutions (data not shown). While extraction of solids to close the mass balance was not performed, given the short equilibration time and the use of autoclaved soil, minimal biotransformation of the target analytes was expected. Background concentrations of analytes in soils were below analytical detection limits. While pH was not directly measured in the isotherms, the pH of these batch systems was assumed to be similar to the soil pH measured (at an identical 1:5 soil-water ratio; Table 2) by the commercial laboratory.
Batch experiments were conducted in triplicate at five initial concentrations ranging from 60 to 2000 μg/L. This range was chosen based on concentrations of analytes observed in onsite wastewater influent and effluent [2] and analytical method sensitivity. After addition of the approximately 6 g of soil and 30 mL of synthetic freshwater to each tube, samples were mixed with a vortex and then agitated for 36 h on a shaker table (130 rpm). Sorption kinetics were not evaluated: several studies using a similar experimental protocol have reported that equilibrium between the aqueous and sorbed phases was achieved within 22 to 36 h [11,27,28]. After 36 h, glass centrifuge tubes were removed and centrifuged for 20 min at 7000 rpm (3600 rcf) to separate suspended soil particles from solution. The supernatant was decanted and three chemical surrogates (d6-bisphenol-A, 4-normal-nonylphenol, and d4-17β-estradiol) were added to samples at known concentrations to evaluate aqueous analyte concentrations.
2.3. Aqueous Phase OWC Analysis
Target OWCs were extracted from aqueous samples using a method adapted from Barber et al. (2007) [21]. Prepackaged solid phase extraction (SPE) cartridges (Waters Sep-Pak® Plus tC18) were preconditioned with dichloromethane (DCM) using an initial flush of approximately 100 pore volumes. Samples were then loaded on the SPE cartridges under vacuum suction maintaining low flow (approximately 1 mL per minute). Finally, the target OWCs were eluted with 5 mL of DCM under similar low flow conditions. Anhydrous sodium sulfate was used to ensure all water was removed from the vials. The remaining volume was evaporated to 0.5 mL under ultra high purity nitrogen gas and transferred to a 1 mL glass GC vial Sample analysis was conducted in triplicate and two samples spiked with analytes underwent extraction processes for every run to evaluate extraction efficiencies. Recoveries were routinely greater than 99%. Quality assurance and quality control procedures also included triplicate analysis of extractions and use of known concentrations to evaluate the mass recovery capability of the SPE method.
Sample analysis was conducted via electron impact gas chromatography (GC) coupled with selected ion monitoring mass spectrometry (MS). A Hewlett Packard (HP) 6890 GC fitted with an HP Ultra II (5% phenylmethyl silicone) column (25 m by 0.2 mm, 33 μm) was employed with ultra high purity helium as the carrier gas. The injection port was maintained at 300 °C, while the initial oven temperature was 140 °C and increased with a ramp rate of 6 °C per minute up to the final temperature of 300 °C, at which point it was held constant for 15 min. The MS (HP 5793 Mass Selective Detector) was operated with an ionization energy of 70 eV, a source temperature of 250 °C, and an interface temperature of 300 °C. Concentrations of analytes were calculated based on selective ion monitoring abundance data using diagnostic ions for each chemical relative to abundance data for the respective surrogates. These ions are identified by mass and ion retention time determined from standard analysis and a peak signal to noise ratio of 3:1 (Table 1).
2.4. Sorption Coefficients
The Freundlich isotherm model was used to describe the sorption of OWCs from solution [29]. The form of the equation employed was:
where: Cs is the concentration of the chemical adsorbed to soil particles (μg/kg), Kf is the Freundlich sorption coefficient (L/kg), Cw is the concentration of chemical in the aqueous phase (μg/L), and n is a power function related to the nonlinearity of the isotherm (n = 1 indicates a linear isotherm).When n is unity, the linear isotherm can be described by:
where Kd is the sorption coefficient (L/kg).
Cs = Kf × Cwn
Cs = Kd × Cw
If the relationship between the magnitude of sorbed concentration and the magnitude of aqueous concentration is linear (i.e., n = 1), then the Kd value is independent of the concentration. However, if the isotherm is nonlinear and a comparison between different sorbents is desired, interpolation of Kd values from the Kf and n values for a specific concentration is appropriate. In addition, if the partitioning of the OWC aqueous phase to the soil is due to the hydrophobic sorption of the contaminant to the foc of the soil, an organic carbon partitioning coefficient (Koc) can be calculated with Equation (1). Linear regressions were evaluated using the sum of least squares-method to find the straight line of best fit with Microsoft Excel.
3. Results and Discussion
3.1. Sorption of OWCs on Different Soils
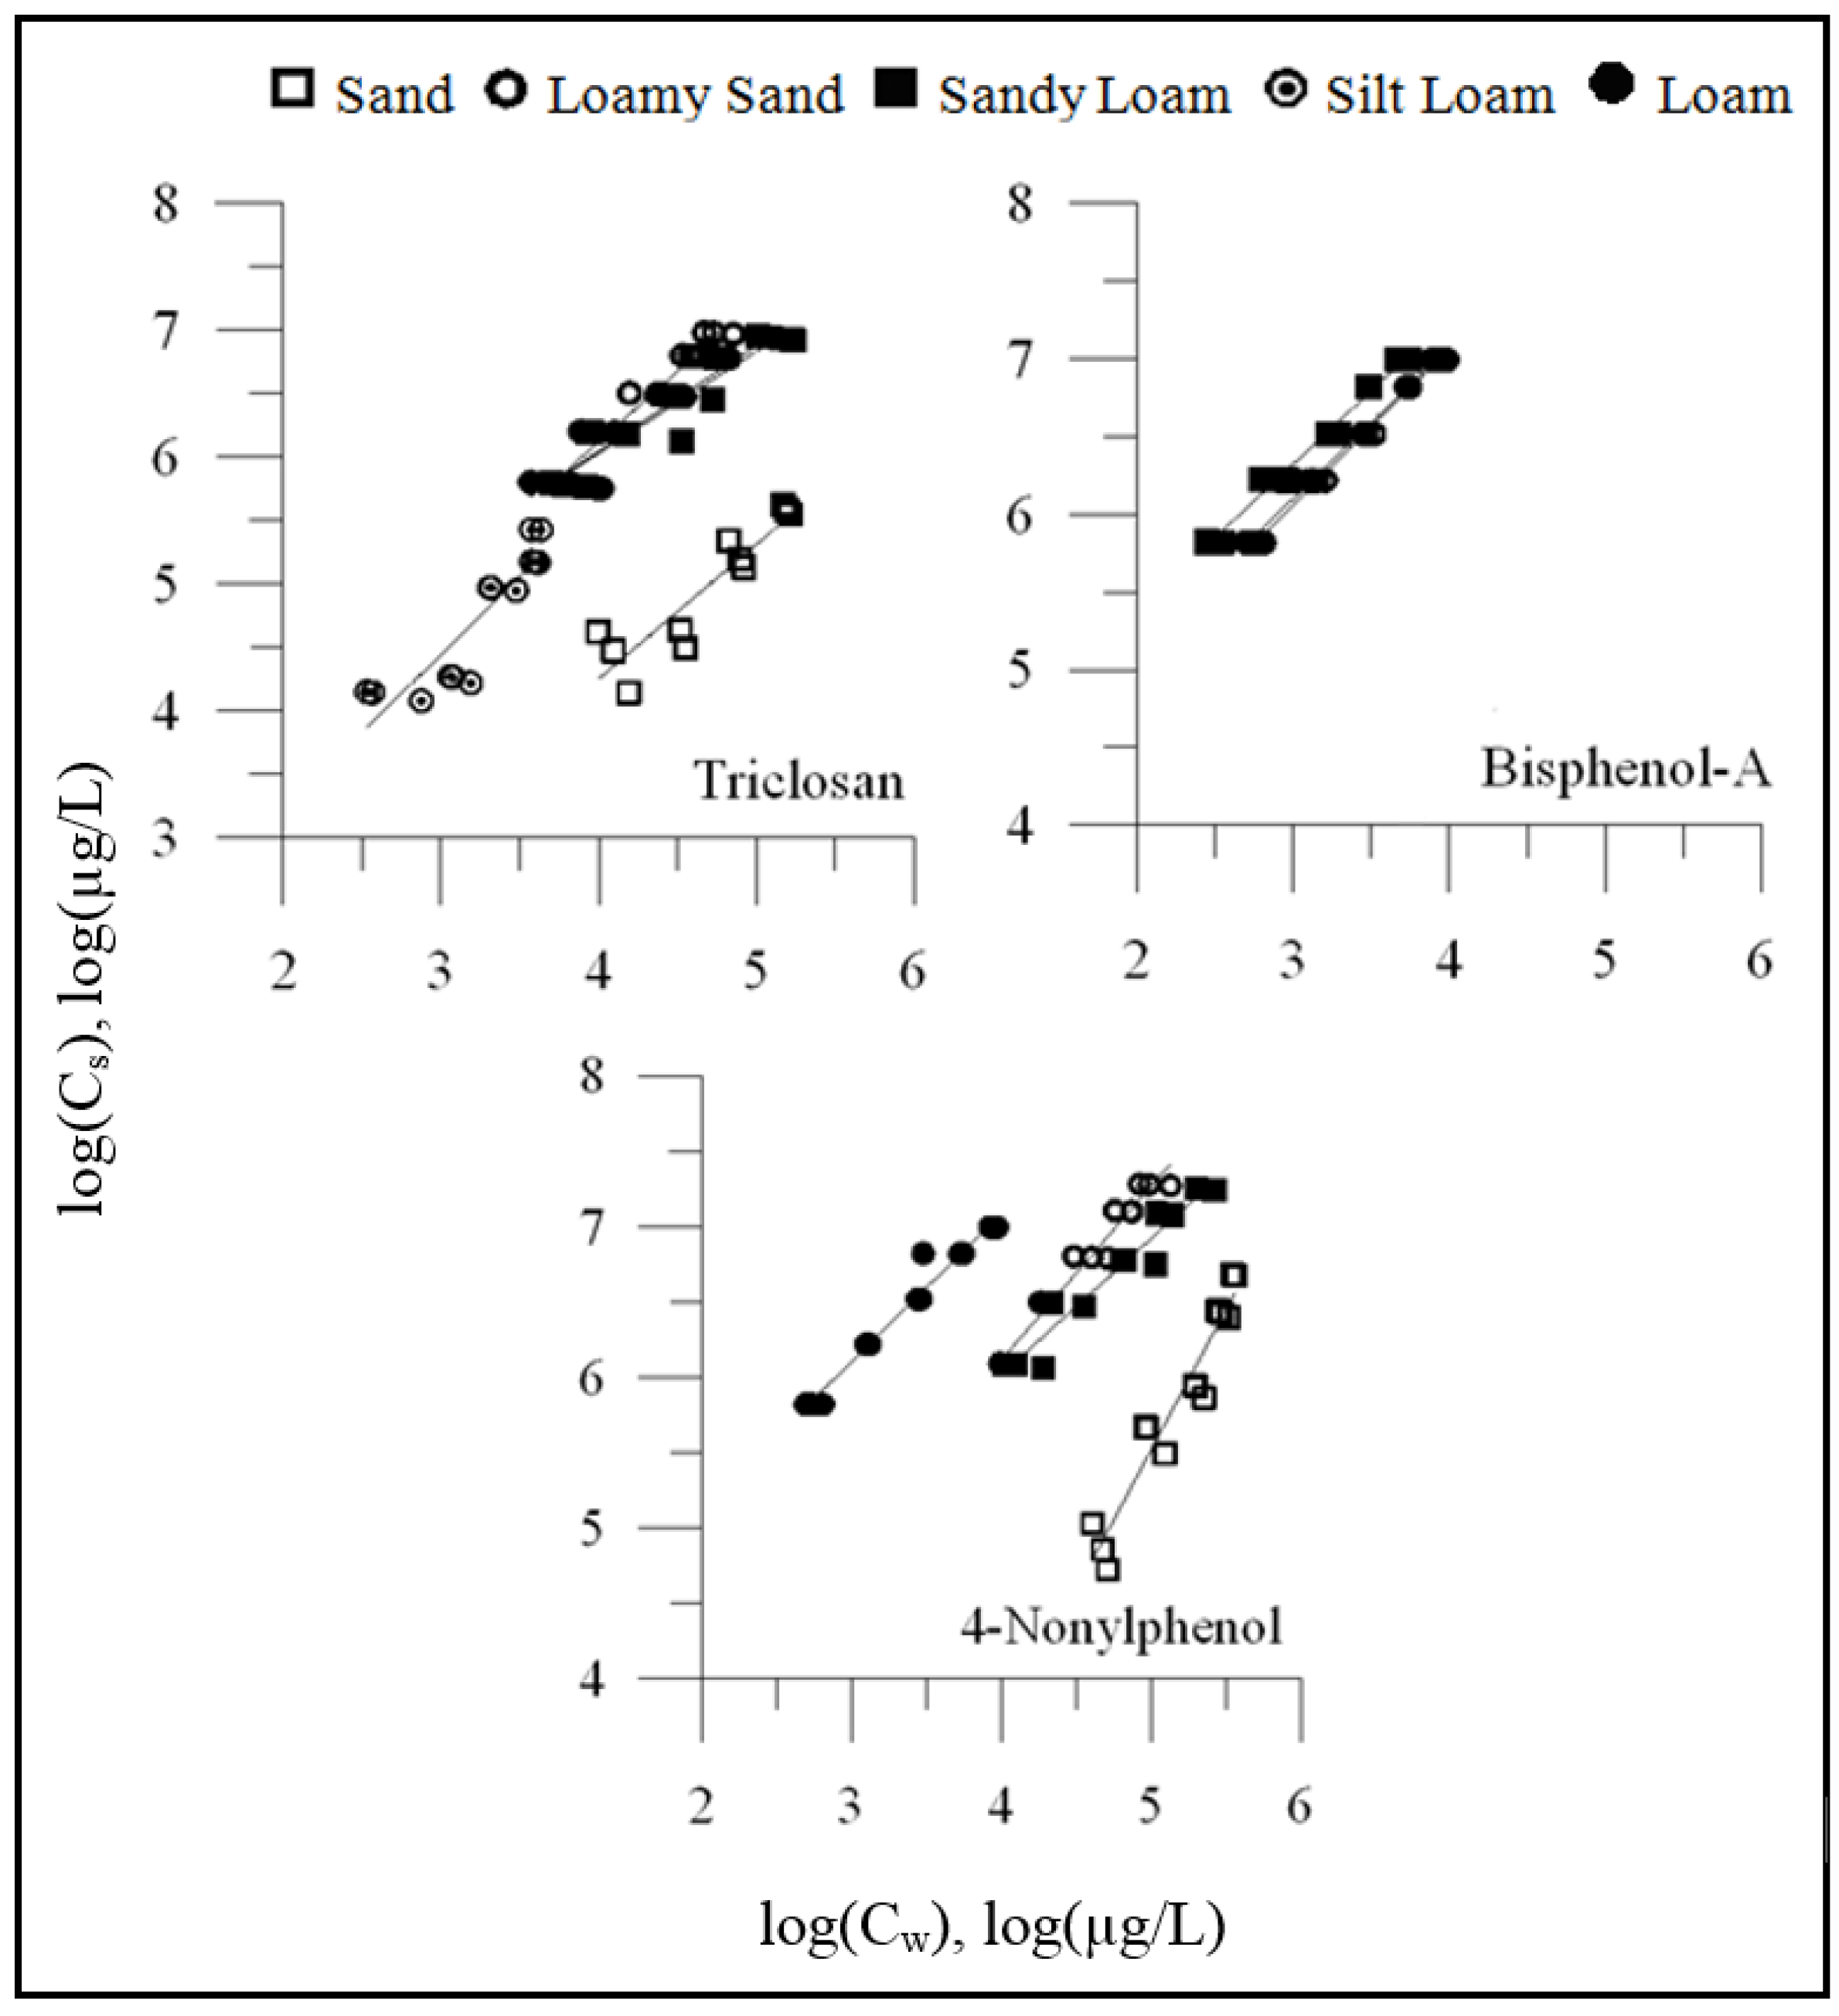
The isotherms for the batch sorption isotherms for these experiments were generally well-described by the Freundlich isotherm model (Equation (2), Figure 1), and linear in nature (i.e., the 95% confidence intervals for the Freundlich exponent (n) values included unity). In general, Kd values for all targeted OWCs (Table 4) were much lower in the sand than for all other soils and were generally higher for soils with greater organic carbon content. These values agree with those reported by Karnjanapiboonwong et al. (2010) [30].
Figure 1.
Sorption isotherms for TCS, BPA, and NP for soil isotherm data with an R2 value greater than 0.80.
Figure 1.
Sorption isotherms for TCS, BPA, and NP for soil isotherm data with an R2 value greater than 0.80.
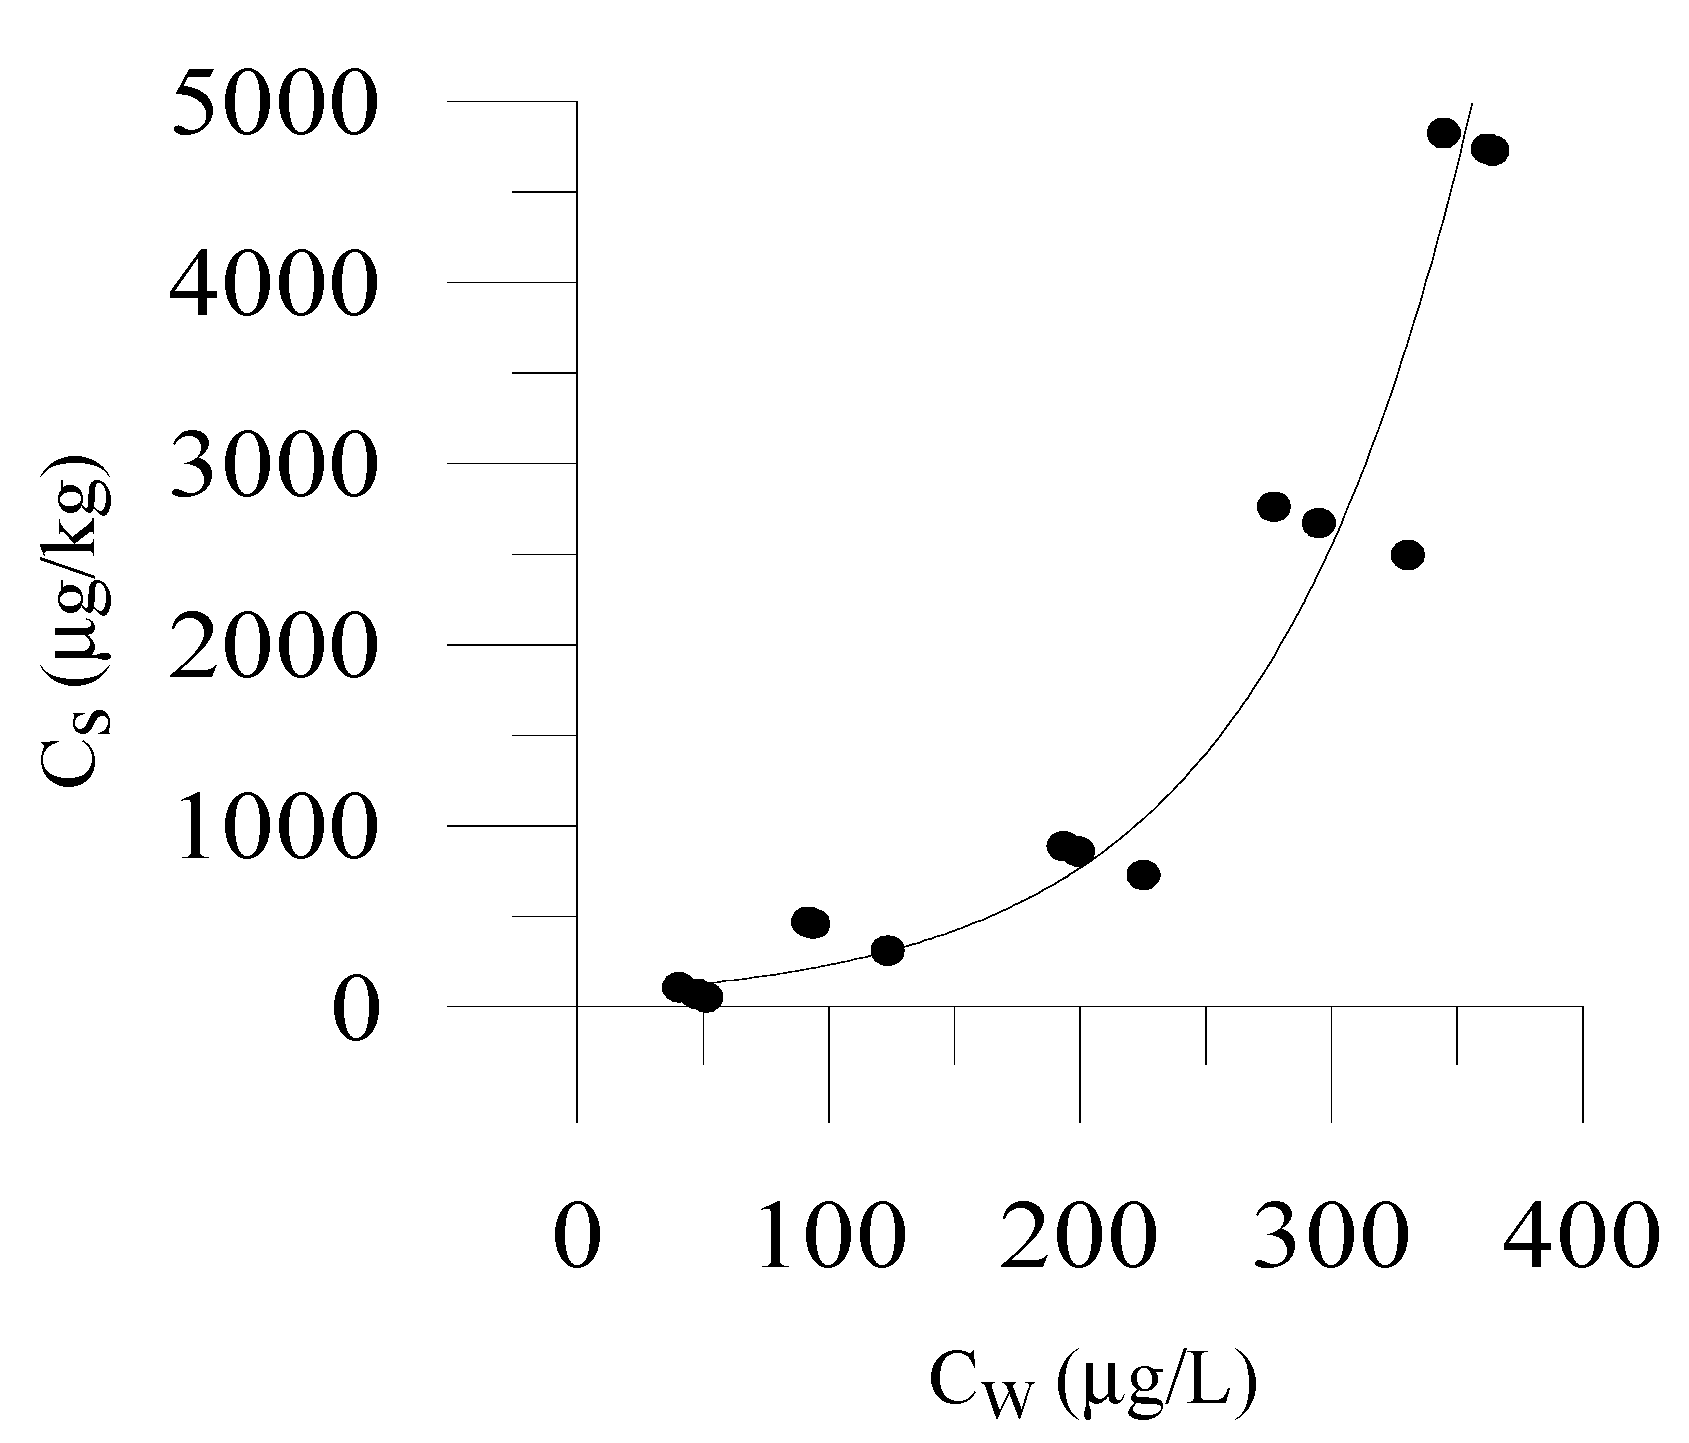
A notable exception to the linear sorption behavior was NP sorption onto the sandy soil, which exhibited highly nonlinear sorption (Figure 2). Due to the high variability of the results for some analytes in some soils, only data sets whose Freundlich model fits had R2 value greater than 0.8 were included in this analysis. Efforts to fit these data with other models (i.e., Langmuir) did not result in better fits. For the sandy soil, the n value for NP was 1.87 ± 0.14 (fitted n ± 95% CI), suggesting that the ratio of sorbed NP mass to aqueous mass increased for higher NP concentrations for this soil. Figure 2 displays equilibrium aqueous concentrations against sorbed concentrations for NP in the sandy soil and also in the sandy loam for comparison. The nonlinear trend is apparent in this plot.
This sorptive behavior has been observed previously for other surfactants, and on a mechanistic level, can be attributed to the hydrophobic self-attraction between the aliphatic carbon chain tails of the NP molecule [31,32]. As is evident in Table 2, the foc in the sandy soil was quite low (0.001). Because sorption of NP increases with increasing aqueous NP levels, it is possible that the chemical is attracted to its own sorbed phase and that this was the dominant sorption mechanism because of the low foc Sorption of NP to the sandy soil was quite low, and the Kf value extrapolated from the Freundlich fit is between 0 and 0.002 L/kg considering the 95% confidence intervals. This is at least three orders of magnitude lower than any other Kf value calculated for any chemical in any soil in the present study. It is possible that in soils where the foc was greater, the sorption to the organic carbon masked this self-sorbing effect, resulting in linear isotherms where the equilibrium between NP in the dissolved and solid phases is primarily dependent on the foc of the soil.
Figure 2.
Plots of equilibrium aqueous concentrations and sorbed concentration for 4-nonylphenol in sand.
Figure 2.
Plots of equilibrium aqueous concentrations and sorbed concentration for 4-nonylphenol in sand.

3.2. Relationship between OWC Sorption and Fraction of Organic Carbon
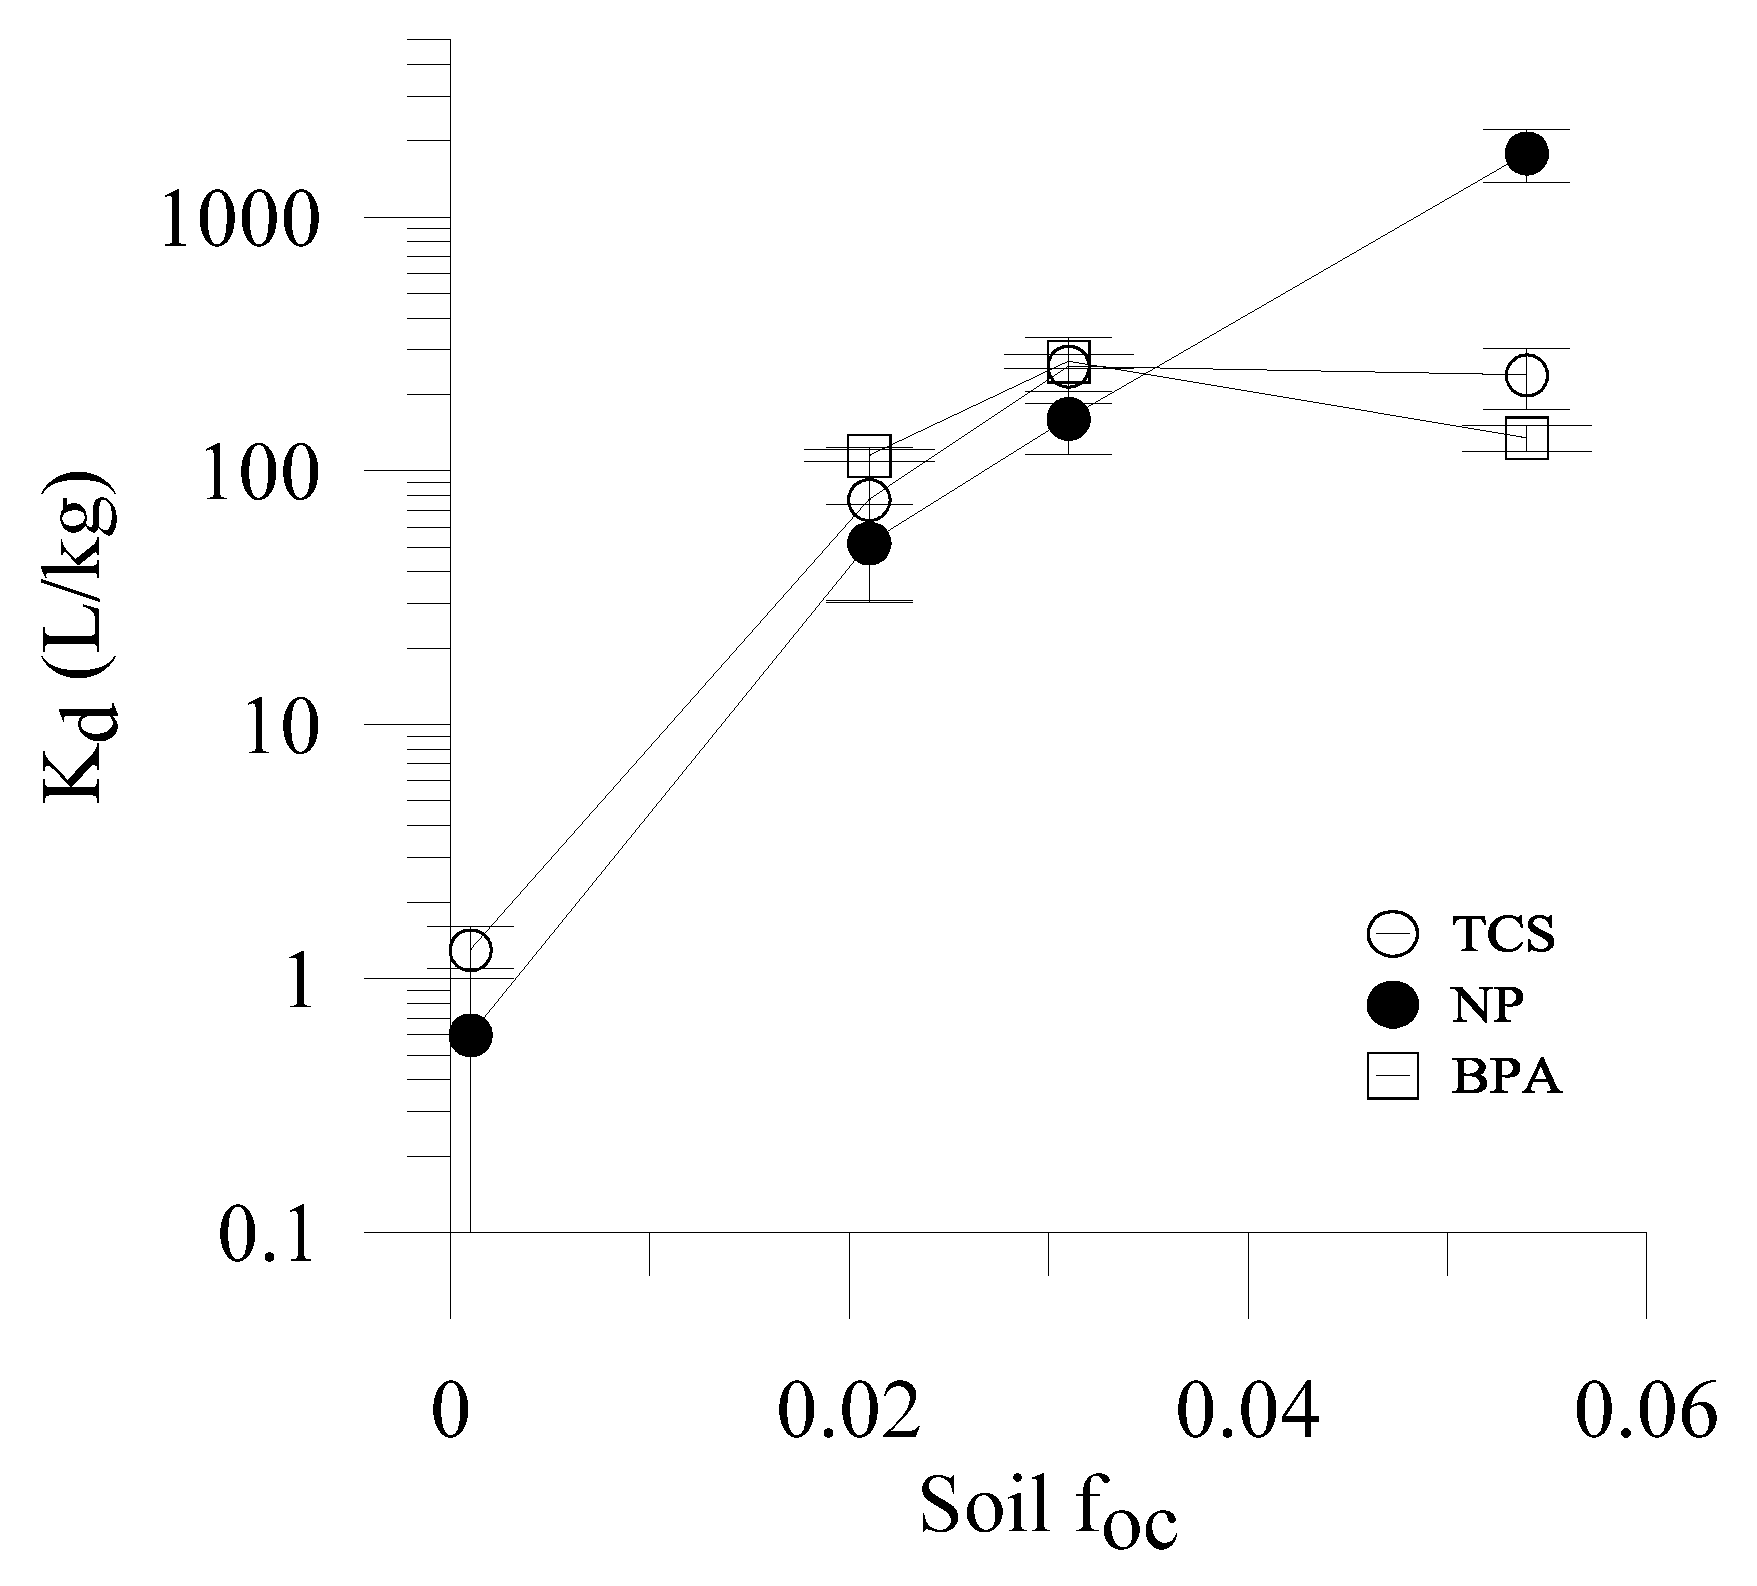
Kd values appear to generally increase with organic carbon content, and though a clear linear relationship was not evident (Figure 3), this may have been due to the limited number of soil types evaluated in the present study. In addition, the lack of a clear linear relationship may also have been due to the uncontrolled solution effects and/or the potential that sorption mechanisms other than partitioning to organic carbon may have also been important for some soils. Examples of other potential sorption mechanisms include ion exchange, surface adsorption to mineral constituents, and complex formation with metal ions. Solution characteristics, such as dissolved organic carbon content that were not accounted for in this study may influence the degree to which OWCs may sorb. The dissolved organic carbon content of the solution may decrease the sorptive capacity by decreasing the attraction of the hydrophobic molecules to the soil organic carbon.
Figure 3.
Plots of Kd values and corresponding foc for soil in which Kd values were measured for analytes.
Figure 3.
Plots of Kd values and corresponding foc for soil in which Kd values were measured for analytes.
3.3. Influence of pH on Sorption of Anionic forms of Aqueous OWCs
Hydrophobic sorption of organic chemicals to organic carbon is commonly thought to depend on the form of the chemical in solution [18,33,34], which, for ionogenic organic chemicals, is dependent on the pH of the system. For many OWCs, the pKa’s are relatively high and outside the normal pH range for wastewater systems, suggesting that pH effects would be minimal. However, for acidic OWCs, dissociation of the neutral form to form the organic anion may occur within the normal pH range of wastewater. Electrostatic repulsion between the organic anions and the typically negatively charged soil particle surfaces may result in substantially weaker sorption. A simple model for describing the effect of pH on the sorption of acidic organic chemicals to natural organic matter in soil is described by Schwarzenbach et al. (2003) with Equation (4) [29].

 is the sorption coefficient for neutral species. This relationship assumes that the deprotonated (negatively charged) OWC species do not significantly contribute to sorption of the chemical [35,36].
As can be observed in Table 3, the pKa values of most of the target OWCs considered in this study are relatively high. While no pKa values are reported for estrone or 17α-ethynylestradiol, the assumption can be made that they would be similar to that of 17β-estradiol because of chemical similarities between the three chemicals. The reported pKa of TCS (8.14) is lower than the measured pH for one soil. If the pH values measured by the commercial laboratory are truly indicative of the pH of the batch systems and the anionic forms of the OWCs do not sorb to the organic carbon, then the resultant Koc values would be substantially lowered for those soils whose pH values fall above the pKa’s for the target OWCs. However, TCS exhibited a relatively high logKoc (3.12 L/kg) in the sand. While not conclusive, this sorption of presumably anionic TCS agrees with the findings of Tulp et al. (2009), Shareef et al. (2006) and Butler et al. (2012), all of which concluded that anionic forms of organic chemicals are capable of stronger sorption than previously expected [36,37,38].
3.4. Comparison of Experimentally Determined and Literature Reported Koc Values
It is illustrative to compare the range of Koc values calculated from the present data to those reported in the literature for these OWCs (Table 3). Literature reported Koc values are grouped into those calculated using structure-activity models, those derived from single-point equilibrium sorption experiments, and those derived from isotherm equilibrium sorption experiments (which are most analogous to the present study). As is clear from Table 4, the range of Koc values reported in the literature spans more than an order of magnitude for most of the chemicals. While some variability might be expected given the range of approaches from which these data are derived, these data suggest that Koc is not a constant value for these chemicals and may be dependent on the system from which Koc values are calculated. Indeed, the range of values reported for these OWCs was one of the motivations for the present study. Table 4 also highlights the fact that relatively few studies have actually measured Koc values for the target OWCs, indicating a gap in current knowledge.
Table 3.
Koc values from isotherm experiments with R2 greater than 0.8 presented in this study compared with Koc values reported in the literature. Chemical parameters, pKa and log(Kow) are also listed for analytes. ND designates a value for which no data was reported.
| Chemical | Measured Log(Koc) Values | Literature Reported Log(Koc) Values | Chemical Parameters | |||||
|---|---|---|---|---|---|---|---|---|
| Ave ± SD (N) | Range | Range | Predicted | Measured–Single Point | Measured–Isotherm | pKa | Log (Kow) | |
| 4 Nonylphenol | 3.61 ± 0.73 (4) | 2.74–4.52 | 3.9–5.4 | ND | 4.7–5.6 d, 5.3 e, 4.5–5.2 f, 4.7 e | 3.9 j, 4.6 k | 10.28 o | 4.48 t |
| Triclosan | 3.56 ± 0.34 (5) | 3.12–3.92 | 3.2–4.6 | 3.8–4.0 a, 3.2 b | 4.6 g | ND | 7.9 p | 4.76 p |
| Bisphenol–A | 3.69 ± 0.27 (3) | 3.40–3.94 | 2.8–3.9 | 3.2 c, 2.8 b | ND | 3.5 i, 3.8 l, 2.9 m, 3.9 n | 9.6–11.3 q | 3.40 q |
| Estrone | 3.50 ± 0.16 (3) | 3.34–3.65 | 3.2–3.6 | 3.6 b | 3.2 h, 3.3 i | 3.3 l | 10.4 r | 2.95 u |
| 17β-Estradiol | 3.23 ± 0.16 (3) | 3.11–3.42 | 3.3–3.6 | 3.6 b | 3.3 i | 3.3 l | 10.2 s | 3.86 u |
| 17α-Ethynylestradiol | 3.25 ± 0.16 (2) | 3.13–3.36 | 2.9–3.3 | ND | 3.2 h, 3.3 i | 2.9 l | 10.2 s | 3.67 u |
Table 4.
Kd and n values reported ±95% CI (confidence interval) calculated from equilibrium sorption isotherm experimental results using Equation (2). ND designates a value for which no data are available or reported due to isotherm variability.
| Chemical | Sand foc = 0.001 | Loamy Sand foc = 0.021 | Sandy Loam foc = 0.031 | Loam foc = 0.054 | ||||
|---|---|---|---|---|---|---|---|---|
| n | Kd | n | Kd | n | Kd | n | Kd | |
| NP | 1.87 ± 0.32 | 0.6 ± 0.5 | 1.15 ± 0.15 | 52.0 ± 21.7 | 0.90 ± 0.14 | 161 ± 44.8 | 1.05 ± 0.21 | 1783 ± 419 |
| TCS | 1.06 ± 0.37 | 1.3 ± 0.3 | 1.11 ± 0.23 | 77.2 ± 46.5 | 0.82 ± 0.18 | 259 ± 75.5 | 0.83 ± 0.17 | 239 ± 63.9 |
| BPA | ND | ND | 0.99 ± 0.04 | 115 ± 5.9 | 0.95 ± 0.07 | 271 ± 16.9 | 0.98 ± 0.10 | 135 ± 15.3 |
| E1 | 1.22 ± 0.25 | 3.2 ± 0.6 | 0.90 ± 0.20 | 45.5 ± 23.6 | 0.89 ± 0.11 | 255 ± 48.0 | ND | ND |
| E2 | ND | ND | 0.87 ± 0.19 | 54.6 ± 0.6 | 0.93 ± 0.10 | 40.1 ± 10.9 | ND | ND |
| EE2 | ND | ND | 0.98 ± 0.22 | 28.6 ± 20.5 | 0.85 ± 0.08 | 70.3 ± 12.0 | ND | ND |
As illustrated in Table 4, the range of Koc values calculated from data in the present study generally agree with those reported previously. The generally large range of reported Koc values suggests that the approach itself may have limited applicability: Koc values tend to range over an order of magnitude for most of the target OWCs. Results from Gerstl et al. (1990) indicate that logKoc values varied by 0.3 in a study of 32 soils and 36 sediments for two OWCs, tetrachloromethane and 1,2-dichlorobenzene [55]. This variability was attributed to the source soil/sediment organic material, which may explain some of the variability in literature reported Koc values. In some cases represented in Table 4, when the foc of the soil was very low, the reported Koc value may have been distorted due to inaccurate measurements of foc. For example, the value measured from isotherm batch tests reported for NP (logKoc = 4.6) was based on sorption to aquifer material with an foc of 0.005 [46]. Conversely, the logKoc values reported by Sekela et al. (1999), ranging from 4.7 to 5.6, were derived from data for sorption to sewage sludge, which has a relatively high foc (approaching 0.5) and facilitates a greater degree of hydrophobic sorption than a soil system may potentially achieve [41]. Although Koc values should not depend on the foc, this comparison shows that the value is clearly not constant for these chemicals. Nevertheless, various fate and transport assessments have utilized a Koc value to reference estimate a Kd value for OWC fate and transport modeling in soil systems [56,57].
The calculation of this partitioning coefficient incorporates a number of assumptions. First, organic carbon is considered as a relatively homogenous phase, essentially meaning that sorption of a chemical does not depend on the type of organic carbon (i.e., root material, leaf litter, decomposing organisms). While studies have shown that the type and geologic age may play a minor role, the soils chosen for the study are analogous to soils used by STUs [58]. Second, the role of dissolved organic carbon in the wastewater stream is not considered in calculation of Kd and Koc. Dissolved organic carbon can serve to reduce the sorption capacity of an OWC to soil and can facilitate solubilization of the compound and aid in transport through the soil. Additionally, because the Koc is calculated using Kd and foc values, the assumption is made that hydrophobic partitioning is the only sorptive mechanism and this partitioning is defined by a linear relationship (Equation (3)). Nevertheless, because foc of a soil is an important factor in the degree of sorption of these chemicals, the Koc of a chemical may be useful in predicting the sorptive capacity of an OWC for a given system. Identifying a useful Koc value from literature studies may incorporate assumptions that lead to a lower degree of confidence in fate and transport modeling results. An empirically determined range of Koc values may be a superior approach to estimating a Kd model input value, but is not always possible for every soil due to resource constraints.
4. Conclusions
Sorption to soil is a key process in the fate and transport dynamics of OWCs as they infiltrate through soil. The Kd value is used to characterize sorption in fate and transport models that consider the advection-dispersion equation incorporating solute transport and, generally, model output is highly sensitive to the magnitude of this parameter. Clearly, effective characterization of a Kd value and the uncertainty surrounding it for a specific system is essential for fate and transport modeling.
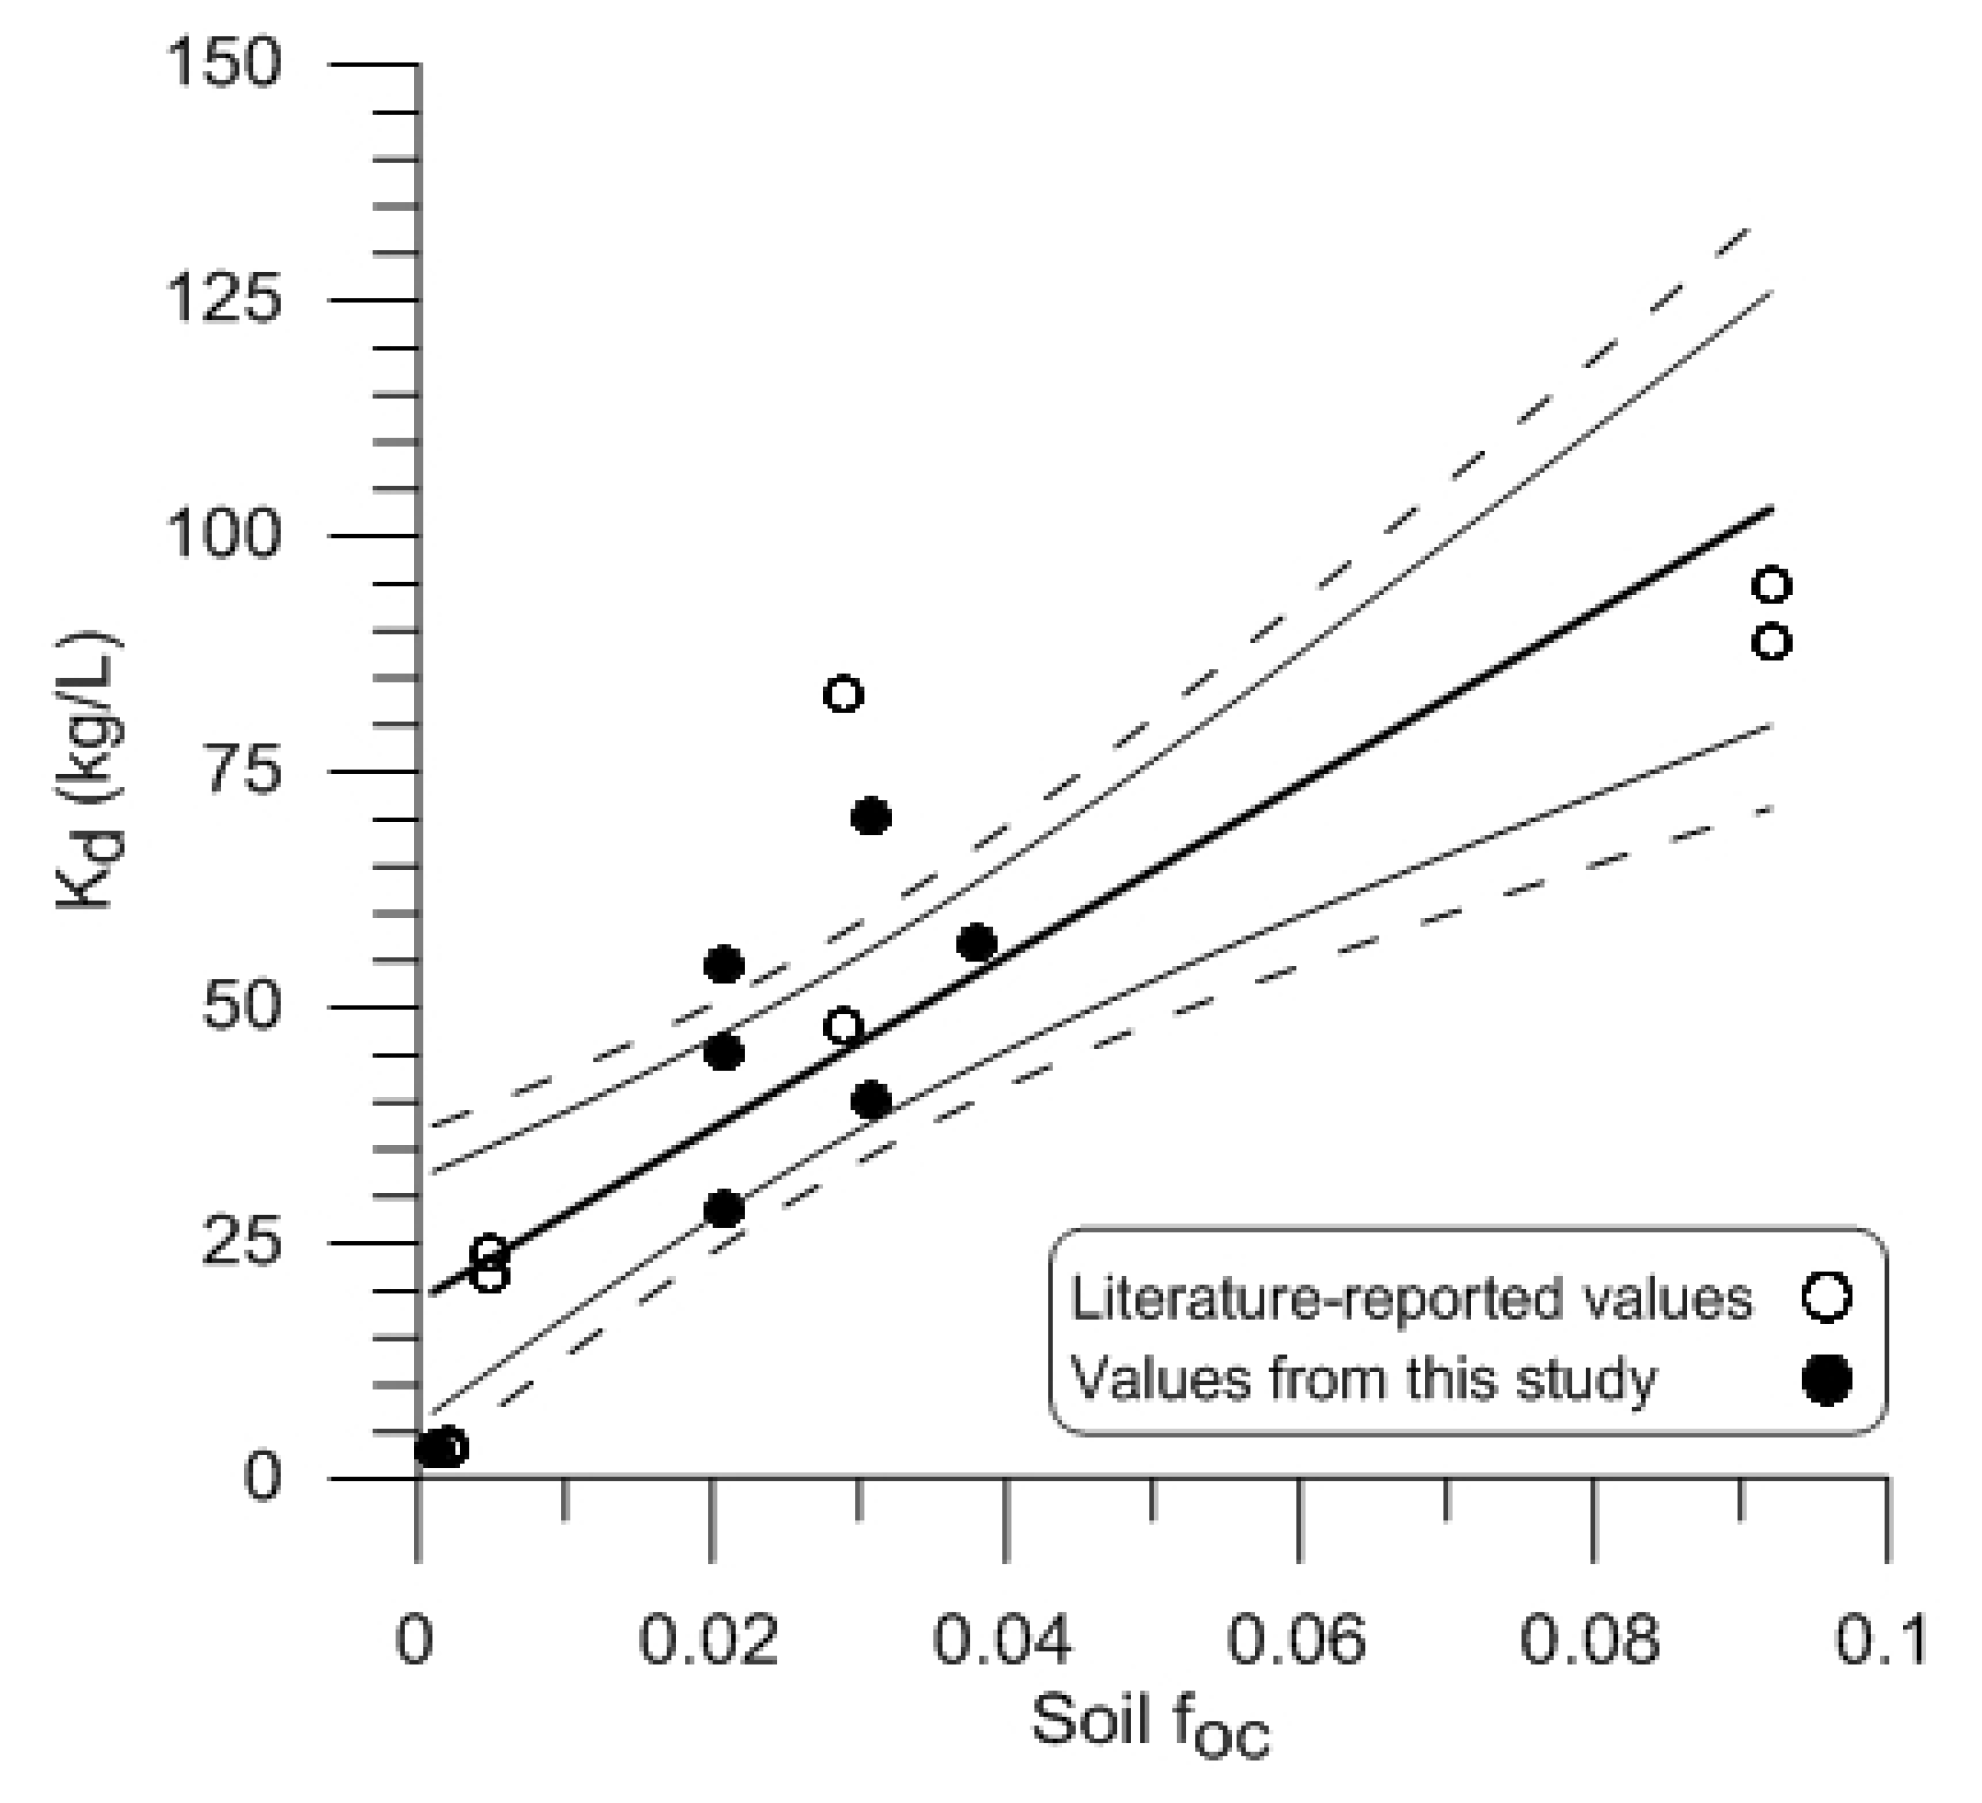
To help evaluate this uncertainty, a relationship may be defined to relate a range of Kd values to soil organic carbon content. This range (defined by 95% confidence intervals for a linear regression) incorporates the variability associated with additional soil and solution characteristics by involving a number of various experimentally determined Kd values and not accounting for the variability or effects of soil characteristics other than the foc. Using this approach, a Koc relationship is defined by considering a number of literature-reported sorption studies over an applicable range of organic carbon contents. Figure 4 illustrates an approach for using this empirical relationship. In this plot, Kd values from this study and literature for E1, E2, and EE2 are combined under the assumption that these chemicals, being similar in structure, demonstrate similar sorption characteristics [13,26,27,45]. A regression was fit between the Kd values and corresponding foc values and 95 and 99 percent confidence intervals are included. These confidence intervals may define a range of effective Kd values for an foc based on empirical evidence. It is important to note that the relationship displayed in Figure 4 suggests an approach to identifying a Kd range, but it is unlikely that current Kd information is sufficient to use this approach as a tool for estimating Kd without additional investigation for most OWCs. Rather than requiring extensive numbers of batch studies to characterize Kd values at a variety of soil conditions, a confined range defined by this type of empirical relationship may give a realistic indication as to the effect of sorption on retardation of OWC infiltration.
Figure 4.
Plots of the Kd values for associated fraction of organic carbon of soil for isotherms with less than 20% variability in this study and literature reported values [13,26,27,45] for estrogenic hormones (estrone, 17β-estradiol, and 17α-ethynylestradiol). A linear regression fit is included along with the 95% (solid lines) and 99% (dashed lines) confidence intervals.

Acknowledgments
The authors thank Kathryn S. Lowe (CSM) for an initial review of the manuscript. This work was supported by a research grant from the Water Environment Research Foundation (WERF) (Project DEC 1R06).
Author Contributions
Sarah Roberts designed and conducted the experimental work and literature review presented in this paper under the direction, review and guidance of Christopher Higgins and John McCray.
Conflicts of Interest
The authors declare no conflict of interest.
References
- U.S. Environmental Protection Agency. Onsite Wastewater Treatment Systems Manual; U.S. Environmental Protection Agency: Cincinnati, OH, US, 2002. [Google Scholar]
- Conn, K.E.; Barber, L.B.; Brown, G.K.; Siegrist, R.L. Occurrence and fate of organic contaminants during onsite wastewater treatment. Environ. Sci. Technol. 2006, 40, 7358–7366. [Google Scholar] [CrossRef]
- Matamoros, V.; Arias, C.; Brix, H.; Bayona, J.M. Preliminary screening of small-scale domestic wastewater treatment systems for removal of pharmaceutical and personal care products. Water Res. 2009, 43, 55–62. [Google Scholar] [CrossRef]
- Brown, A.R.; Riddle, A.M.; Cunningham, N.L.; Kedwards, T.J.; Shillabeer, N.; Hutchinson, T.H. Predicting the effects of endocrine disrupting chemicals on fish populations. Hum. Ecol. Risk Assess. 2003, 9, 761–788. [Google Scholar] [CrossRef]
- Oaks, J.L.; Gilbert, M.; Virani, M.Z.; Watson, R.T.; Meteyer, C.U.; Rideout, B.A.; Shivaprasad, H.L.; Ahmed, S.; Chaudhry, M.I.; Arshad, M. Diclofenac residues as the cause of vulture population decline in Pakistan. Nature 2002, 40, 65–81. [Google Scholar]
- Robertson, W.D. Chemical fate and transport in a domestic septic system: Site description and attenuation of dichlorobenzene. Environ. Toxicol. Chem. 1994, 13, 183–191. [Google Scholar] [CrossRef]
- Glaser, A. The Ubiquitous Triclosan: A Common Antibacterial Agent Exposed. Beyond Pesticides Fact Sheet. Available online: www.beyondpesticides.org/pesticides/factsheets/Triclosan%20cited.pdf (accessed on 24 March 2004).
- Singh, L. An Experiment to Identify Levels of Triclosan That are Harmful to Bacteria in Puget Sound; University of Washington: Seattle, WA, USA, 2007. [Google Scholar]
- Suarez, S.; Dodd, M.; Omil, F.; von Gunten, U. Kinetics of triclosan oxidation by aqueous ozone and consequent loss of antibacterial activity: Relevance to municipal wastewater ozonation. Water Res. 2007, 41, 2481–2490. [Google Scholar] [CrossRef]
- Das, B.S.; Lee, L.S.; Rao, P.C.; Hultgren, R.P. Sorption and degradation of steroid hormones in soils during transport: Column studies and model evaluation. Environ. Sci. Technol. 2004, 38, 1460–1470. [Google Scholar] [CrossRef]
- Duering, R. Sorption behavior of nonylphenol in terrestrial soils. Environ. Sci. Technol. 2002, 36, 4052–4057. [Google Scholar] [CrossRef]
- Duran-Alverez, J.; Prado, B.; Ferroud, A.; Narcedalia, J.; Jimenez-Cisneros, B. Sorption, desorption and displacement of ibuprofen, estrone, and 17β-estradiol in wastewater irrigated and rain-fed agricultural soils. Sci. Total Environ. 2014, 473–474, 189–198. [Google Scholar]
- Lee, L.S.; Strock, T.J.; Sarmah, A.K.; Rao, P.C. Sorption and dissipation of testosterone, estrogens, and their primary transformation products in soils and sediment. Environ. Sci. Technol. 2003, 37, 4098–4105. [Google Scholar] [CrossRef]
- Scheytt, T.; Mersmann, P.; Lindstädt, R.; Heberer, T. Determination of sorption coefficients of pharmaceutically active substances carbamazepine, diclofenac, and ibuprofen, in sandy sediments. Chemosphere 2005, 60, 245–253. [Google Scholar] [CrossRef]
- Yu, Z.; Xiao, B.; Huang, W.; Peng, P. Sorption of steroid estrogens to soils and sediments. Environ. Toxicol. Chem. 2004, 23, 531–539. [Google Scholar] [CrossRef]
- Schwarzenbach, R.P.; Westall, J. Transport of nonpolar organic compounds from surface water to groundwater. Laboratory sorption studies. Environ. Sci. Technol. 1981, 15, 1360–1367. [Google Scholar] [CrossRef]
- Wilson, J.T.; Enfield, C.G.; Dunlap, W.J.; Cosby, R.L.; Foster, D.A.; Baskin, L.B. Transport and fate of selected organic pollutants in a sandy soil. J. Environ. Qual. 1981, 10, 501–506. [Google Scholar]
- Zwiener, C.; Frimmel, F.H. Short-term tests with a pilot sewage plant and biofilm reactors for the biological degradation of the pharmaceutical compounds clofibric acid, ibuprofen, and diclofenac. Sci. Total Environ. 2003, 309, 201–211. [Google Scholar] [CrossRef]
- Lietz, A.C.; Meyer, M.T. Evaluation of emerging contaminants of concern at the south district wastewater treatment plant based on seasonal sampling events, Miami-Dade County, Florida, 2004. In Scientific Investigations Report 2006–5240; U.S. Geological Survey: Reston, VA, USA, 2006. [Google Scholar]
- Swartz, C.H.; Reddy, S.; Benotti, M.J.; Yin, H.; Barber, L.B.; Brownawell, B.J.; Rudel, R.A. Steroid estrogens, nonylphenol, ethoxylate metabolites, and other wastewater contaminants in groundwater affected by a residential septic system on Cape Cod, MA. Environ. Sci. Technol. 2006, 40, 4892–4900. [Google Scholar]
- Barber, L.B.; Thurman, E.M.; Schroeder, M.P.; LeBlanc, D.R. Long-term fate of organic microbpolutants in sewage-contaminated ground water. Environ. Sci. Technol. 1998, 22, 205–211. [Google Scholar]
- Howdeshell, K.L.; Hotchkiss, A.K.; Thayer, K.A.; Vandenbergh, J.G.; Vom Saal, F.S. Environmental toxins: Exposure to bisphenol A advances puberty. Nature 1999, 401, 763–764. [Google Scholar] [CrossRef]
- Lech, J.J.; Lewis, S.K.; Ren, L. In vivo estrogenic activity of nonylphenol in rainbow trout. Fundam. Appl. Toxicol. 1996, 30, 229–232. [Google Scholar] [CrossRef]
- Orvos, D.R.; Versteeg, D.J.; Inauen, J.; Capdevielle, M.; Rothenstein, A.; Cunningham, V. Aquatic toxicity of triclosan. Environ. Toxicol. Chem. 2002, 21, 1338–1349. [Google Scholar] [CrossRef]
- Roberts, P.; Roberts, J.P.; Jones, D.L. Behavior of the endocrine disrupting chemical nonylphenol in soil: Assessing the risk associated with spreading contaminated waste to land. Soil Biol. Biochem. 2006, 38, 1812–1822. [Google Scholar] [CrossRef]
- Ying, G.G.; Kookana, R.S. Triclosan in wastewaters and biosolids from Australian wastewater treatment plants. Environ. Int. 2007, 33, 199–205. [Google Scholar] [CrossRef]
- Casey, F.M.; Simunek, J.; Lee, J.; Larsen, G.L.; Hakk, H. Sorption, mobility, and transformation of estrogenic hormones in natural soil. J. Environ. Qual. 2005, 34, 1372–1379. [Google Scholar] [CrossRef]
- Fent, G.; Hein, W.J.; Moendel, M.J.; Kubiak, R. Fate of 14C-bisphenol A in soils. Chemosphere 2003, 51, 735–746. [Google Scholar] [CrossRef]
- Schwarzenbach, R.P.; Gschwend, P.M.; Imboden, D.M. Environmental Organic Chemistry; Wiley-Interscience: New York, NY, USA, 2003. [Google Scholar]
- Karnjanapiboonwong, A.; Morse, A.N.; Maul, J.D.; Anderson, T.A. Sorption of estrogens, triclosan, and caffeine in a sandy loam and a silt loam soil. J. Soils Sediments 2010, 7, 1300–1307. [Google Scholar] [CrossRef]
- Goloub, T.P.; Koopal, L.K.; Bijsterbosch, B.H.; Sidorova, M.P. Adsorption of cationic surfactants on silica. Surface charge effects. Langmuir 1996, 12, 3188–3194. [Google Scholar] [CrossRef]
- Xiaoping, L.; Laixiang, Z.; Linlin, Y.; Jiale, L.; Liang, X; Mulindankaka, E. Sorption behavior of nonylphenol (NP) on sewage-irrigated soil: Kenetic and thermodynamic studies. Sci. Total Environ. 2012, 473–474, 520–536. [Google Scholar]
- Scheytt, T.J.; Mersmann, P.; Heberer, T. Mobility of pharmaceuticals carbamazepine, diclofenac, ibuprofen, and propyphenazone in miscible-displacement experiments. J. Contam. Hydrol. 2006, 83, 53–69. [Google Scholar] [CrossRef]
- Tsai, W.; Chi-Wei, S.; Ting-Yi, S. Adsorption of bisphenol-A from aqueous solution onto minerals and carbon adsorbents. J. Hazard. Mate. 2006, 134, 169–175. [Google Scholar] [CrossRef]
- Escher, B.I.; Scharzenbach, R.P. Partitioning of substituted phenols in liposome−water, biomembrane−water, and octanol−water systems. Environ. Sci. Technol. 1995, 30, 260–270. [Google Scholar] [CrossRef]
- Tulp, H.C.; Fenner, K.; Schwarzenbach, R.P.; Goss, K.U. pH-dependent sorption of acidic organic chemicals to soil organic matter. Environ. Sci. Technol. 2009, 43, 419–445. [Google Scholar]
- Shareef, A.; Angove, M.J.; Wells, J.D.; Johnson, B.B. Sorption of bisphenol A, 17 -ethynylestradiol and estrone to mineral surfaces. J. Colloid Interface Sci. 2006, 297, 62–69. [Google Scholar] [CrossRef]
- Butler, E.; Whelan, M.J.; Sakrabani, R.; van Egmond, R. Fate of triclosan in field soils receiving sewage sludge. Environ. Pollut. 2012, 167, 101–109. [Google Scholar] [CrossRef]
- Lindstroem, A.; Buerge, I.J.; Poiger, T.; Bergqvist, P.A.; Mueller, M.D.; Buser, H.R. Occurrence and environmental behavior of the bactericide triclosan and its methyl derivative in surface waters and in wastewater. Environ. Sci. Technol. 2002, 36, 2322–2329. [Google Scholar] [CrossRef]
- Staples, C.A.; Dome, P.B.; Klecka, G.M.; Oblock, S.T.; Harris, L.R. A review of the environmental fate, effects, and exposures of bisphenol A. Chemosphere 1998, 36, 2149–2173. [Google Scholar] [CrossRef]
- Sekela, M.; Brewer, R.; Moyle, G.; Tuominen, T. Occurrence of an environmental estrogen (4-nonylphenol) in sewage treatment plant effluent and the aquatic receiving environment. Water Sci. Technol. 1999, 39, 217–220. [Google Scholar]
- Ferguson, P.L.; Iden, C.R.; Brownawell, B.J. Distribution and fate of neutral alkylphenol ethoxylate metabolites in a sewage-impacted urban estuary. Environ. Sci. Technol. 2001, 35, 2428–2435. [Google Scholar] [CrossRef]
- Isobe, T.; Nishiyama, H.; Nakashima, A.; Takada, H. Distribution and behavior of nonylphenol, octylphenol, and nonylphenol monoethoxylate in Tokyo metropolitan area: Their association with aquatic particles and sedimentary distributions. Environ. Sci. Technol. 2001, 35, 1041–1049. [Google Scholar] [CrossRef]
- Singer, H.; Müller, S.; Tixier, C.; Pillonel, L. Triclosan: Occurrence and fate of a widely used biocide in the aquatic environment: Field measurements in wastewater treatment plants, surface waters, and lake sediments. Environ. Sci. Technol. 2002, 36, 4998–5004. [Google Scholar] [CrossRef]
- Clara, M.; Strenn, B.; Gans, O.; Martinez, E.; Kreuzinger, N.; Kroiss, H. Removal of selected pharmaceuticals, fragrances and endocrine disrupting compounds in a membrane bioreactor and conventional wastewater treatment plants. Water Res. 2005, 39, 4797–4807. [Google Scholar] [CrossRef]
- Ying, G.G.; Kookana, R.S.; Dillon, P. Sorption and degradation of selected five endocrine disrupting chemicals in aquifer material. Water Res. 2003, 37, 3785–3791. [Google Scholar] [CrossRef]
- Li, C.; Li, X.Z.; Graham, N.; Gao, N.Y. The aqueous degradation of bisphenol A and steroid estrogens by ferrate. Water Res. 2008, 42, 109–120. [Google Scholar]
- Müller, S.; Schlatter, C. Estrogenic potency of nonylphenol in vivo—A case study to evaluate the relevance of human non-occupational exposure. Pure Appl. Chem. 1998, 70, 1847–1853. [Google Scholar] [CrossRef]
- National Library of Medicine. Triclosan. Available online: http://toxnet.nlm.nih.gov/cgi-bin/sis/search/a?dbs+hsdb:@term+@DOCNO+7194 (accessed on 12 October 2012).
- Cousins, I.T.; Staples, C.A.; Kleĉka, G.M.; Mackay, D. A multimedia assessment of the environmental fate of bisphenol A. Hum. Ecol. Risk Assess. 2002, 8, 1107–1135. [Google Scholar] [CrossRef]
- Nghiem, L.D.; Schäfer, A.I. Adsorption and transport of trace contaminant estrone in NF/RO membranes. Environ. Eng. Sci. 2002, 19, 441–451. [Google Scholar] [CrossRef]
- Hurwitz, A.R.; Liu, S.T. Determination of aqueous solubility and pKa values of estrogens. J. Pharm. Sci. 1977, 66, 624–627. [Google Scholar] [CrossRef]
- Ahel, M.; Giger, W. Partitioning of alkylphenols and alkylphenol polyethoxylates between water and organic solvents. Chemosphere 1993, 26, 1471–1478. [Google Scholar] [CrossRef]
- Machatha, S.G.; Yalkowsky, S.H. Comparison of the octanol/water partition coefficients calculated to experimentally determined values. Int. J. Pharm. 2005, 294, 185–192. [Google Scholar] [CrossRef]
- Gerstl, Z. Estimation of organic chemical sorption by soils. J. Contam. Hydrol. 1990, 6, 357–375. [Google Scholar] [CrossRef]
- Patrolecco, L.; Capri, S.; Angelis, S.D.; Pagnotta, R.; Polesello, S.; Valsecchi, S. Partition of nonylphenol and related compounds among different aquatic compartments in Tiber River (Central Italy). Water Air Soil Pollut. 2006, 172, 151–166. [Google Scholar] [CrossRef]
- Porter, A.J.; Hayden, N.J. Nonylphenol in the Environment: A Critical Review. Available online: http://www.emba.uvm.edu/~nhayden/npreview.Pdf (accessed on 12 August 2002).
- Huang, W.; Weber, W.J. A distributed reactivity model for sorption by soils and sediments. Relationships between desorption, hysteresis, and the chemical characteristics of organic domains. Environ. Sci. Technol. 1997, 31, 2562–2569. [Google Scholar] [CrossRef]
© 2014 by the authors; licensee MDPI, Basel, Switzerland. This article is an open access article distributed under the terms and conditions of the Creative Commons Attribution license (http://creativecommons.org/licenses/by/3.0/).
Share and Cite
MDPI and ACS Style
Roberts, S.; Higgins, C.; McCray, J. Sorption of Emerging Organic Wastewater Contaminants to Four Soils. Water 2014, 6, 1028-1042. https://doi.org/10.3390/w6041028
AMA Style
Roberts S, Higgins C, McCray J. Sorption of Emerging Organic Wastewater Contaminants to Four Soils. Water. 2014; 6(4):1028-1042. https://doi.org/10.3390/w6041028
Chicago/Turabian StyleRoberts, Sarah, Christopher Higgins, and John McCray. 2014. "Sorption of Emerging Organic Wastewater Contaminants to Four Soils" Water 6, no. 4: 1028-1042. https://doi.org/10.3390/w6041028