Review

Review and Research Needs of Bioretention Used for the Treatment of Urban Stormwater

1
Department of Biological Systems Engineering, Hampton Roads Agricultural Research and Extension Center, Virginia Polytechnic Institute and State University, 1444 Diamond Springs Rd, Virginia Beach, VA 23455, USA
2
Graduate School at Shenzhen, Tsinghua University, Shenzhen 518055, China
3
State Environmental Protection Key Laboratory of Microorganism Application and Risk Control (MARC), Beijing 100084, China
*
Author to whom correspondence should be addressed.
Water 2014, 6(4), 1069-1099; https://doi.org/10.3390/w6041069
Submission received: 3 January 2014 / Revised: 13 April 2014 / Accepted: 17 April 2014 / Published: 24 April 2014
(This article belongs to the Special Issue Sustainable Drainage Systems)

Abstract

:
The continued development of urban areas in recent decades has caused multiple issues affecting the sustainability of urban drainage systems. The increase of impervious surface areas in urban regions alters watershed hydrology and water quality. Typical impacts to downstream hydrologic regimes include higher peak flows and runoff volumes, shorter lag times, and reduced infiltration and base flow. Urban runoff increases the transport of pollutants and nutrients and thus degrades water bodies downstream from urban areas. One of the most frequently used practices to mitigate these impacts is bioretention. Despite its widespread use, research on bioretention systems remains active, particularly in terms of mix design and nitrogen treatment. Recent research focusing on bioretention is reviewed herein. The use of mesocosms provides the ability to isolate particular treatment processes and replicate variability. Computational models have been adapted and applied to simulate bioretention, offering potential improvements to their operation, maintenance, and design. Maintenance practices are important for sustained operation and have also been reviewed. Predicting maintenance is essential to assessing lifecycle costs. Within these research areas, gaps are explored, and recommendations made for future work.

1. Introduction

The 20th century has witnessed the rapid transformation of rural lands to urban areas on a global scale. By 2050, it is projected that 64.1% developing and 85.9% of the developed world will be urbanized [1]. The growth in cities is caused mainly by rural migration to urban areas in the developing world and suburban development in the developed world [2]. Urban development causes a variety of impacts associated with serving the human population, including increased withdrawals of fresh water from surface and groundwater sources to meet demand, increased wastewater loading in separate and combined sewer areas, increased generation of solid wastes, and issues associated with human transportation [3]. The impervious surfaces created by buildings and pavement significantly alter the way water flows through and from watersheds, conveying additional pollutants with it [4]. Understanding and mitigating the consequences of urbanization on urban stormwater hydrology and quality is the key to addressing some of these issues.

1.1. Urban Stormwater Impacts

In urban areas, impervious surfaces include pavement and buildings, structures, and, in some cases, heavily compacted urban soils [5]. With the removal of vegetation and creation of hard surfaces, rainwater infiltration and natural groundwater recharge decrease. This results in increased runoff rates and volumes, reduced infiltration, groundwater recharge, and baseflow to urban streams [6,7]. The altered hydrology then causes environmental impacts [8], including downstream flooding [9], streambank erosion and stream downcutting [4,9,10]; declining water quality due to increases in sediment, nutrients, and heavy metals [11,12], and a decline in aquatic biota [13]. The hydrologic patterns before and after development are conceptually illustrated in Figure 1, adapted from [14].
Figure 1. Schematic illustration of the pertinent impacts of urbanization on hydrology at the catchment scale.
Water 06 01069 g001
Note that post development runoff is greater in volume and peak with a lower baseflow, and reduced time to peak. A study of a 4047 m2 (1-ac) paved parking lot found that it generates 16 times more runoff than a meadow of the same size [15]. In urban areas, various pollutants that accumulate on impervious surfaces during dry periods, are subsequently washed off during storm events and then discharged into receiving waters [16]. Changes in rainfall—runoff behavior and the generation of pollutants by urban land surfaces and activities result in the degradation of water quality and associated aquatic life in receiving waters. In general, this degradation is the result of two primary mechanisms (i) increased generation of pollutants, through changes in land use due to human activity [17], increased mobilization and transport as a result of increased surface runoff, and the hydraulic efficiency of the stormwater conveyance network [6]. Urban stormwater can contain numerous pollutants including suspended solids, nutrients, organic compounds, pathogenic bacteria, heavy metals, toxic pesticides or herbicides, trash, debris, and floatable materials [16]. Stormwater is highly variable [18], and with respect to nutrients like phosphorus, a portion is associated with hetero-disperse particulate matter [19]. Rainfall depth, catchment area, and the percentage of asphalt and natural surrounding land use have proven adequate predictors of nutrient concentrations and loads [20]. Other possible pollutants, such as heavy metals, pesticides, bacteria, hydrocarbons, and vehicle byproducts may also be conveyed by urban runoff from impervious surfaces to receiving waters, causing a wide variety of adverse (toxic, pathogenic, and sanitary) environmental issues in urban receiving waters [21]. For more information, the reader may consult data from the National Urban Runoff Program, or NURP [22] and the National Stormwater Quality Database, or NSQD [23] for further information.

1.2. Low Impact Development (LID)

Low impact development, or LID, is an ecological engineering practice that was introduced by Prince George’s County, Maryland in the early 1990s as a means to holistically address the impacts of urban development. LID, also known as sustainable urban drainage, is a land planning and engineering design approach that implements small-scale hydrologic controls with integrated pollutant treatment to compensate for land development impacts on hydrology and water quality. The goal of LID is to maintain or replicate the predevelopment hydrologic regime using enhanced infiltration and evapotranspiration to reduce off-site runoff and ensure adequate groundwater recharge [24]. LID practices have multiple purposes, including: enhancing management of runoff, improving surface water quality, improving groundwater recharge, improving habitat, and enhancing the aesthetics of the community [25].
One of the most frequently used LID practices is bioretention. Despite its widespread use, research on bioretention systems is active, particularly in terms of mix design and treatment. The objective of this paper is to review recent research on bioretention systems, including field and mesocosm monitoring studies, the development of computational models, and the assessment of lifecycle costs. These areas are important for implementing the practice and improving the sustainability of urban drainage systems. Research gaps are identified and explored, and recommendations made for future work.

2. Bioretention and Its Applications

2.1. Definition and Function

A bioretention system is a landscaped depression that receives runoff from upgradient impervious surfaces, and consists of several layers of filter media, vegetation, an overflow weir, and an optional underdrain (see Figure 2 adapted from [26]). Bioretention cells are typically small and usually treat catchment areas less than 2 hectares [27]. Bioretention systems mimic the natural hydrologic cycle by retaining runoff to decrease flow rates and volumes [28]. Other benefits may also include an improvement in the aesthetics of the neighborhood, the enhancement of habitat for wildlife, a reduction in soil erosion, and the recharge of groundwater [29] and thus enhance base flows to local streams. Incoming runoff infiltrates through the media layers and is discharged through underdrain pipes. Internal water can also be lost through exfiltration and evapotranspiration. Exfiltration refers to a loss of water from a drainage system as the result of percolation or absorption into the in situ soil. Vegetation within the bioretention cell uptakes water and nutrients from the media. Overflow may occur if the media is saturated, and the small storage area then ponds until reaching a control elevation, upon which it begin to discharge. Bioretention normally consists of a layer comprised of media (sand/soil/organic mixture) for treating runoff, a surface mulch layer, various forms of vegetation, a storage pool of between 15 and 30 cm of depth and associated hydraulic control appurtenances for inlet, outlet, and overflow conveyance [30]. An underdrain is a preferable option when underlying soils are low in permeability [31] (<13 mm/h), effectively reducing the bioretention toa filter system [26]. Figure 2 demonstrates the profile of a typical bioretention facility with an underdrain. Runoff is filtered sequentially through each layer; however, the main filtration action is performed in the media layer [32]. Debris, particles, sediments, and other pollutants from runoff are filtered and treated before draining into a stormwater conveyance system or directly into receiving waters. The vegetated surface layer slows the runoff velocity and traps sediment [33]. Within a bioretention cell, treatment is performed by a variety of unit processes making use of the chemical, biological, and physical properties of plants, microbes, and soils to remove pollutants from urban runoff. Bioretention reduces peak flows [34], runoff volume [35], and pollutant loads [36,37]; increases evapotranspiration by vegetation uptake [38], and increases lag time [34]. An example of a field-scale bioretention cell is shown in Figure 3.

2.2. Media Specification and Amendment

Media is a key factor in bioretention design. Selection criteria are intended to improve runoff reduction and pollutant removal performance of bioretention and address local conditions. Examples of selected specifications from Virginia Department of Conservation; Maryland Department of the Environment; and Delaware Department of Natural Resources and Environmental Control and Recreation are compared for hydrologic management effectiveness, pollutant removal efficiency, construction and maintenance costs, and constructability. In general, a typical bioretention ideally contains approximately 50%–60% sand and 40%–50% mix of loam/sandy loam/loamy sand on a per volume basis. Clay content should be minimized to maintain proper cell hydrology, ideally in the range of 5%–8% [39]. A media with too much clay may reduce infiltration into the media. There are a wide variety of bioretention blends.
Figure 2. Schematic diagram of a bioretention facility and its hydraulic pattern.
Water 06 01069 g002
Figure 3. A bioretention facility at the Science Museum of Virginia in Richmond, Virginia.
Water 06 01069 g003
Another key aspect of media specification is the P content. Soil P should be balanced between the growth needs of the plant for nutrients and to reduce the potential to leach nutrients in the long term. A media specification developed by the Virginia Tech Crop, Soils, and Environmental Sciences Department recommends that soil P the within the range of 5–15 mg/kg under the Mehlich I extraction procedure or 18–40 mg/kg Mehlich III extraction. There is a conversion table between these two methods [40]. According to Beck et el, keeping soil P within these ranges helps to minimize leaching [41].
The depth of the media layer is one of the primary design features controlling hydrologic performance of bioretention systems. A monitoring study was conducted that compared six bioretention cells in Maryland and North Carolina that differed by media depth, two were 1.2 m, and the rest were 0.5–0.6 m in depth. The larger media depths met their water quality volume capture target 80% the time; for the smaller, it was 44%, suggesting media depth may be the primary parameter influencing hydrologic performance [42]. A long-term observation from 2004 to 2006 of a bioretention cell in Charlotte, NC demonstrated that the peak outflow for 16 storms with less than 42 mm of rainfall was at least 96.5% less than the peak inflow, with the mean peak flow reduction being 99% [27]. From this study, it can be concluded that in an urban environment, bioretention can effectively reduce peak runoff from small to midsize storm events. This finding suggested that deeper media depths could improve hydrologic performance of bioretention systems. The depth of the layer should also consider construction cost and the local groundwater level. In general, a media layer of 0.7–1.0 m thickness is recommended in bioretention design [43]. It may be advantageous to use two media layers with the top designed to support vegetation and the bottom optimized for filtration. According to soil column studies by Hsieh and Davis, [44] a layer having a greater sand content optimized for pollutant removal media could be used below a media optimized for plant health to achieve increased pollutant removal.

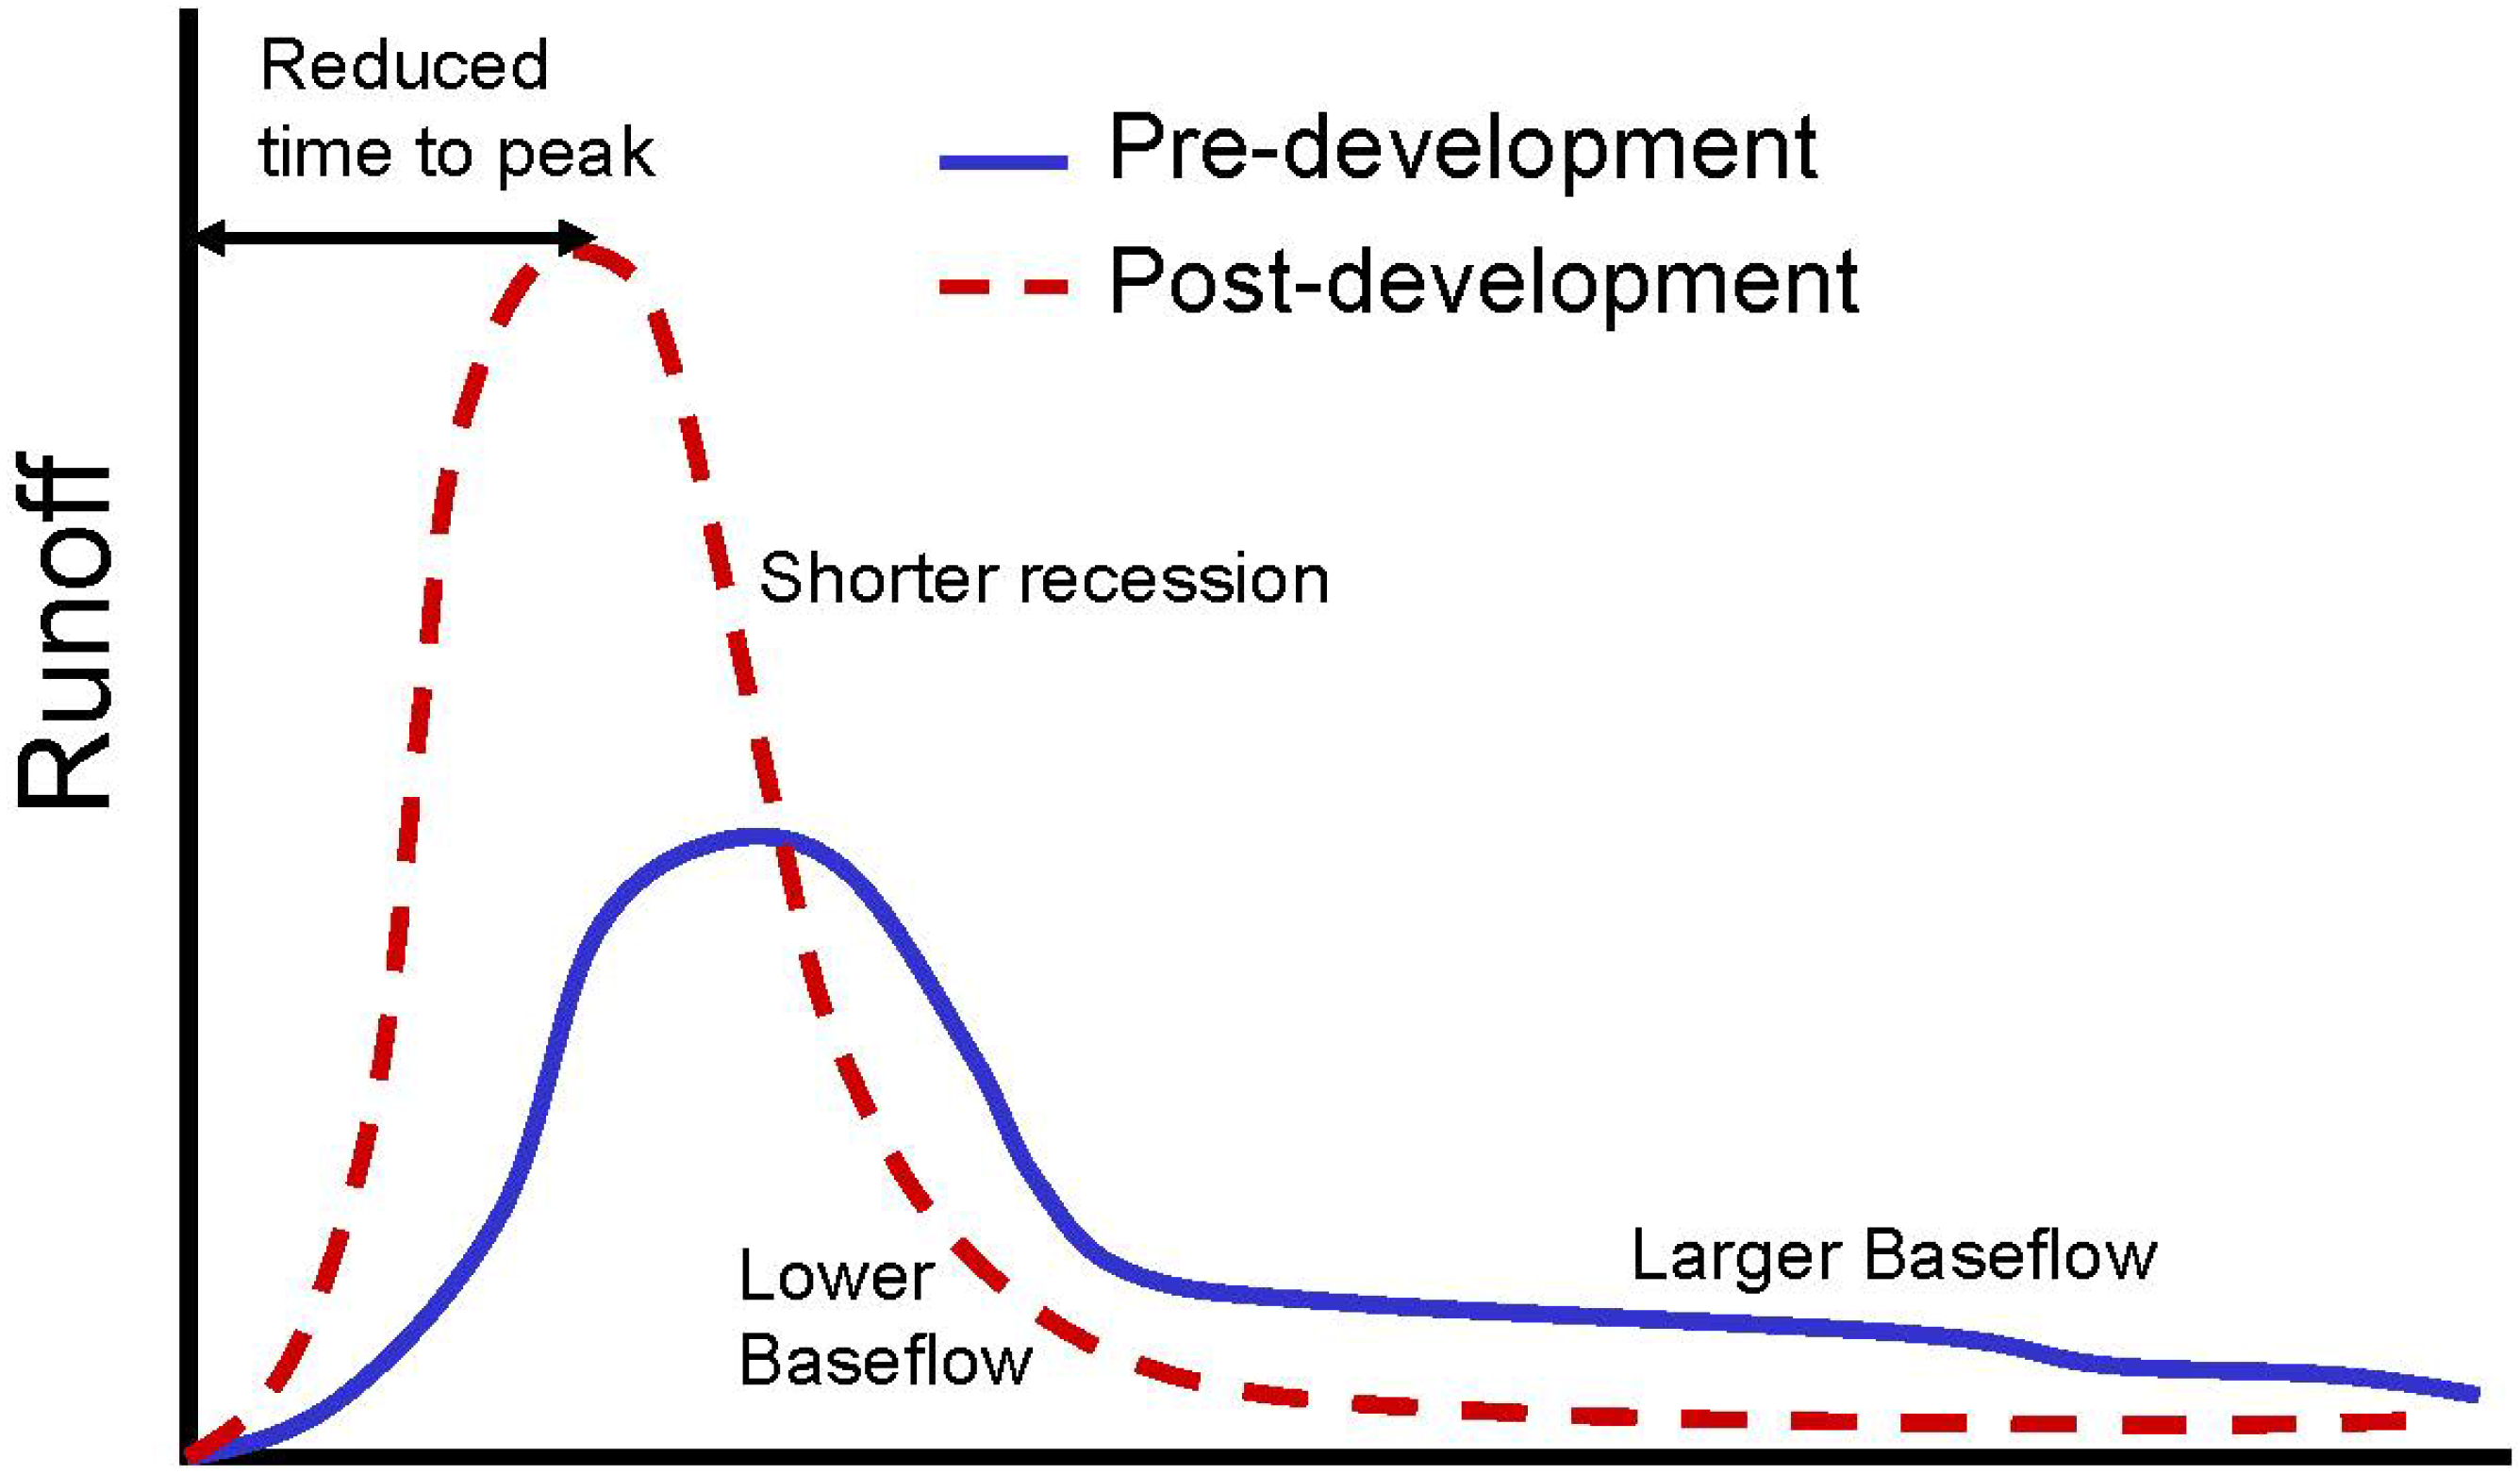
2.3. Hydrologic Restoration

For this review, field monitoring studies that were published in peer-reviewed journals were evaluated. Design details, watershed characteristics and available hydrologic performance data for the reviewed studies are provided in Table 1. Only studies with an underdrain were included. One key feature of bioretention is its ability to mimic the pre-development hydroperiod of an undeveloped watershed and thus help to maintain a natural water cycle in urban areas. A study was conducted that compared underdrain flow from four bioretention cells in North Carolina within comparably sized, undeveloped watersheds draining to small streams, normalized by drainage area. The results indicated no statistical difference between flow rates from the undeveloped watersheds and bioretention outflow rates for the two days following the commencement of flow [45]. This study confirmed that bioretention outflow can mimic non-urban, shallow interflow to streams, and thus help restore the natural hydroperiod.
The use of bioretention facilities can also increase runoff time of concentration [34]. A typical time of concentration value would be in the range of 5–10 min for a parking lot 0.2–0.4 ha in size draining directly to a storm drain. In contrast, the placement of a bioretention facility in front of the drainage outlet will increase the time of concentration, or time for the runoff to discharge, from a quarter hour to several hours [34], depending on the flow rates through the treatment media. Up to 31% of runoff entering the bioretention cells was lost through these exfiltration, and up to 19% was lost to evapotranspiration [42].
Table 1. Summary of bioretention field studies, hydrologic performance.
SourceLocationBioretention CharacteristicsWatershed CharacteristicsHydrologic Performance
DescriptionMedia CompositionMedia Depth (cm)Bioretention Surface Area (m2)Ponding Depth (cm)IWS depth (cm)Impervious %Drainage Area Surface Area (ha)Delay Tp(out)/Tp(in)Peak Flow Reduction %Runoff Volume Reduction %
Brown and Hunt, 2008 [46]Rocky Mount, NCDifferent vegetation98% sand, 2% fines90140**30760.22****90 2
150**60720.24****98 2
Nashville, NCMedia depth change87% sand, 13% fines6042523790.65****75 3
90300**940.43****50 3
Brown and Hunt, 2011 [47]Rocky Mount, NCDepth change of IWS96% sand, 4% fines1101461688760.22****89
58****93
961421372720.25****98
42****100
Brown and Hunt, 2012 [48]Nashville, NCPre-Repair87% sand, 13% fines6029013830.68**84 263
Post32220**92 288
Pre-Repair9020615970.43**92 365
Post22627**95 389
Davis, 2008 [34]College Park, MDLined50% sand, 30% topsoil, 20% OM9028**1000.247.24452
120**905.86365
Debusk and Wynn, 2011 [49]Blacksburg, VAWashed sand with fines and leaf compost, 88% sand, 8% fines, 4% OM1803510150960.17**9997
Hunt et al., 2006 [35]Greensboro, NC15 cm IWSOrganic Sand12010**75**0.2******
High P indexOrganic Sand12010****0.2****78
Chapel Hill, NCLow P indexQuarried Sand1209****0.06******
Hunt et al., 2008 [27]Charlotte, NCLoamy Sand, 6% fines120229**>990.37**97**
Li et al., 2009 [42]College Park, MDSandy Loam, 12% OM50–8015610–34**0.262214 160 1
Silver Spring, MDSandy Clay Loam, 5.7% OM909030**0.452002 110 1
Greensboro, NCLoamy Sand, 3% OM1202502360**0.52000 10 1
12024023**0.48130 110 1
Louisburg, NCSandy Loam, 5% OM50–6016215**0.3644 136 1
50–609915**0.22310 160 1
Olszewski and Davis, 2013 [50]Silver Spring, MD-54% sand 46% fines50–80102****0.37**8379
Notes: ** Not available; 1 Expressed as fraction, i.e., Qp,out/Qp,in, rather than a% reduction. Values are in %; 2 Measured when there was outflow; 3 Value at 50% exceedence probability.
To enhance the reduction of outflow volume and facilitate denitrification, a modified design was introduced, known as Internal Water Storage (IWS). IWS is an optional subsurface portion of the media to provide storage volume in the bioretention cell [51]. The IWS layer is often created by installing an elbow at the end of the drain so that an IWS zone was produced between the bottom of the cell and the top of elbow [46]. Introducing an IWS layer tends to increase runoff reduction. The effects on hydrology caused by IWS within bioretention cells were investigated in North Carolina. IWS cells experienced pronounced reductions on stormwater volume (99.6% and 100%), while conventional cell reduced 78% volume under the same hydrologic condition. A study of bioretention performance in North Carolina showed that among 63 events monitored, the bioretention cell with IWS had outflow on 18 occasions, while the bioretention with a conventional underdrain design had 40 [46]. The effect of IWS depth is currently being explored. Two bioretention cells were constructed with equal drainage conditions with 30 and 60 cm IWS zones. In 40 precipitation events of, the two cells generated outflow in 34 and 22 times, respectively. The deeper IWS resulted in more retainage of storm runoff and alleviated hydrologic impacts to the surrounding environment. Evapotranspiration and exfiltration play major roles in volume reduction in a bioretention cell and its IWS layer [46]. Including an IWS layer may assist in nitrate (NO3) removal through denitrification process by providing an anoxic zone in the bottom media layer of bioretention [51]. Studies of pilot-scale bioretention with IWS layers had positive results of 80% NO3 mass removal [52]. Passeport et al. conducted a field study comparing two grassed bioretention cells including IWS zones for 16 months. Significant load reductions were observed for NO3 and nitrite (NO2) that varied from 47% to 88% in the growing season [53].
A critical concern that negatively impacts bioretention functions is surface clogging caused by fine silts and sediments in urban runoff. Hydrologic performance of bioretention can significantly degrade if impacted by large quantities of sediment, leading to less-than-adequate water storage volume and surface infiltration rates [48]. A study on urban particle capture in bioretention media showed clay-sized components of incoming TSS clogged the media [54]. In a survey of 43 bioretention cells across North Carolina, Wardynski et al. [55] found that 65% of the cells were undersized. Despite 71% not meeting particle size distribution specifications, most were found to adequately drain and still meet hydrologic goals by treating the water quality storm.
A key feature of hydrologic restoration is exfiltration of water to surrounding soils. Eventually this water migrates to the groundwater table. This has raised some concerns in some regions and has resulted in suggested buffers from building foundations. In a modeling study in Syracuse, NY, Endreny and Collins [56] estimate a 1.1 m rise in the water table after bioretention implementation. The mass load reductions associated with the loss of water due to exfiltration may simply be transferred to groundwater, with a lag time for nutrients of 4–5 years [57].

2.4. Pollutant Treatment

For this review, field monitoring studies that were published in peer-reviewed journals were evaluated, and are listed with design details, watershed characteristics in Table 2. As with Table 1, only studies with an underdrain were included. Performance results on pollutant removal of bioretention systems from both laboratory and field studies suggest that bioretention practices have the potential to be one of the most effective BMPs in pollutant removal [30]. The water quality improvement by bioretention has been extensively observed and reported through field experiment or management. Note, all references to pollutant removals are referring to mass load reduction, unless specified otherwise.

2.4.1. Nitrogen

The treatment of N species includes ammonification, volatilization, nitrification, denitrification, and vegetative uptake. Ammonification is the process to breaking organic N chemicals into ammonium. Volatilization processes are mainly responsible for the loss of ammonia in bioretention systems. Ammonium ions can be transferred to ammonia gas with a pH above 7.5 or 8 [58], however, media are typically below these values. Nitrification is a microbial process by which reduced N compounds (primarily NH4) are sequentially oxidized to NO2 and NO3 [35]. The process of nitrification, which is controlled by autotrophic microbes, is dependent on pH and dissolved oxygen content. Nitrification occurs in waterlogged soils in the thin aerobic zone created around the roots of plants [59], and in other aerobic zones. Denitrification is the process through which NO3 is converted to gaseous N by microorganisms under anaerobic conditions. It is the only point in the N cycle at which fixed N reenters the atmosphere as N2. The complete denitrification process can be expressed as a redox reaction [60]. NH4 and NO3 in soil are assimilated by plants through their root systems for physiological activities. The N uptake rate is influenced by plant growth rate, and concentrations of inorganic N forms [61]. Field sampling and analysis on 3 bioretention sites found that high annual NO3 mass removal rates varied between 13% and 75% [35].

2.4.2. Phosphorus

Phosphorus can serve as a throttle to the productivity of most freshwater systems and can lead to eutrophication under high inputs [59]. The main treatment processes for P removal within bioretention are precipitation, adsorption, filtration, and vegetation uptake. Precipitation of P occurs when the critical concentration for nucleation of seed crystals is exceeded and two or more substances combine to form a solid phase [58]. Precipitation can be an important removal process in stormwater high in metal ion content. P ions can be adsorbed readily by many soils through the process of ion exchange or ligand exchange [62]. Adsorption is considered a necessary process to remove P within bioretention, and can be modeled using isotherm equations including linear, Freundlich, and Langmuir among others. In bioretention systems, particulate phosphorus (P) can be retained in soils through filtration, and become part of the soil-water system of bioretention [63]. The soluble PO4 is the most readily available form of P species for vegetative uptake [64]. Factors that influence the rate of P uptake in plants include the proportion of plant roots that are exposed to P, plant and root age, as well as environmental conditions including temperature and soil pH [65]. Long-term PO4 removal in a field-scale bioretention system was observed. The study found that the median PO4 concentration decreased by 0.21–0.25 mg/L in the ponded water and down to 0.03 mg/L in the pore water at the bottom of the infiltration bed. The removal performance did not decrease during 9 years of monitoring [66].
Table 2. Summary of bioretention field studies, water quality performance.
SourceLocationBioretention CharacteristicsWatershed CharacteristicsWater Quality Performance
DescriptionMedia CompositionMedia Depth (cm)Bioretention Surface Area (m2)Ponding Depth (cm)IWS depth (cm)Impervious %Drainage Area Surface Area (ha)TSS %TN %TP %Coliform %Zn %Cu %Pb %
Brown and Hunt, 2008 [46]Rocky Mount, NC98% sand, 2% fines90146**30–60760.22928072********
Brown and Hunt, 2011 [47]Rocky Mount, NCDepth change of IWSSandy Clay Loam, 96% sand, 4% fines1101461688720.225858−10********
Brown and Hunt, 2012 [48]Nashville, NCPre-Repair87% sand, 13% fines6029013830.6871125.3********
Post32220793512********
Pre-Repair9020615970.43841344********
Post22627893219********
Chen, 2013 [67]Lenexa, KSSand with hardwood mulch and sandy loam planting soil, 20% OM7120023400.25**56**********
Debusk and Wynn, 2011 [49]Blacksburg, VAWashed sand with fines and leaf compost, 88% sand, 8% fines, 4% OM1803510150960.17999999********
Hathaway and Hunt, 2011 [68]Wilmington, NCDifferent soil depthsBaymead fine sand, 87%–88% sand, 12%–13% fines6055281000.1100****70******
Hunt et al., 2006 [35]Greensboro, NCIWS addedOrganic Sand12010**75**0.2**68****>98>98>80
High P index**10****0.2−17040−240********
Chapel Hill, NCLow P indexSand**9****0.06**4065********
Hunt et al., 2008 [27]Charlotte, NCLoamy Sand, 6% fines120229**980.3760323171607732
Li and Davis, 2008 [54]Washington DC50% sand, 30% topsoil, 20% mulch11017**1000.07755–99************
Li and Davis, 2009 [37]College Park, MDSandy Loam, 80% sand, 20% fines, 6% OM50–8018115900.2896−3−3695926583
Silver Spring, MDSandy Clay Loam, 54% sand, 46% fines, 12% OM9010230900.4599971001009996100
Passeport and Hunt, 2009 [53]Graham, NCNorth cellExpanded slate, 15% sand, 80% fines, 5% OM601022345400.69**546395******
South cell9075****545885******
Note: ** Not available.

2.4.3. Metals

Metals are of particular concern due to their ecotoxicity accumulation potential [69]. It has been observed that the surface layer of bioretention systems performs a significant role in retaining metals [70]. Field studies suggest that bioretention appears to be an efficient facility to remove heavy metallic elements from runoff. A bioretention cell in an urban setting in North Carolina was studied from 2004 to 2006. Water quality samples were collected for 23 events and analyzed for some typical heavy metals including Cu, Zn, and Pb. There were significant reductions in the concentrations of Cu, Zn, and Pb. Efficiency ratios for Cu, Zn, and Pb were 0.54, 0.77, and 0.31, respectively [35]. Another bioretention cell in the District of Columbia accumulated Zn, Pb, and Cu with total metal concentrations of 532, 660, and 75 mg/kg, respectively [70].

2.4.4. Solids

Total suspended solids (TSS) can be effectively removed through bioretention layers, typically through sedimentation in the basin and filtration in the media. A bioretention system in North Carolina under study with 23 rainfall events showed a removal ratio as 0.60 for TSS [35]. A Maryland field study of two cells has documented 54% and 59% mass removals of TSS [71]. Mature systems demonstrate enhanced filtration and sedimentation of TSS with improved TSS removal efficacy. Care must be taken to avoid the use of bioretention as a sediment trap. Despite their efficient sediment removal, clogging may occur.

2.4.5. Pathogens

Bacteria that can cause infection are known as pathogenic bacteria, and are a major water quality concern that can be treated by bioretention. A significant reduction of pathogenic bacteria was observed in an urban bioretention from 19 storms for fecal coliform and 14 events for E. coli. The efficiency ratios for fecal coliform and E. coli are 0.69 and 0.70 respectively [27].
These results of pollutant treatment indicate that in an urban environment bioretention systems can reduce concentrations of most target pollutants, including pathogenic bacteria indicator species. It also reduces mass loading because of runoff reduction through exfiltration to surrounding soils [34]. One study examined water quality improvements of numerous pollutant parameters including total arsenic, total cadmium, chloride, total chromium, total and dissolved copper, Escherichia coli (E. coli), fecal coliform, lead, mercury, N species, oil and grease, P species, total organic carbon, TSS, and Zn via monitoring for a 15-month period at 2 bioretention cells in Maryland. The monitoring results showed both bioretention cells effectively removed suspended solids, lead, and zinc from runoff and the effluent EMCs met local water quality criteria [37]. The variability in bioretention treatment performance may be influenced by the site’s environment, including the climate, the groundwater, the surrounding watershed characteristics, and background pollutant levels. The following section describes current research on bioretention performance.

2.5. Temperature Reduction

Thermal impacts have been demonstrated to result in a decline in coldwater fisheries [72] of the salmonid family. Rainfall falling on hot pavement in the summer will increase in temperature significantly by the time it is discharged. Control practices differ in how they improve or exacerbate these thermal impacts. In a four-year study, Roseen et al. [73] evaluated thermal impacts from a retention pond and a gravel wetland, and found that the retention pond was more susceptible to thermal variability. The gravel wetland was found to have a greater capacity for thermal buffering of discharges. Bioretention has been found to also provide thermal buffering by both runoff reduction and attenuation [74]. Another study evaluated the size of bioretention and its thermal buffering capacity, and found smaller bioretention cells may be more effective at reducing thermal impacts.

2.6. Biological Diversity

Bioretention systems in urban Australia have shown to support greater diversity and species richness than both lawn and garden bed-type green spaces in the same area [75,76]. These studies found bioretention had a significant increase in plant and invertebrates taxa, both of which are used as indicators of aquatic ecosystem health. While microbial action and plant uptake play a role in the treatment processes involved in bioretention, little is known how these mechanisms can be augmented by system design. Variation among plant species has been shown to affect bioretention performance [77], which was one of the factors identified by Zhang et al. [78], in which more diverse plant species resulted in reductions in nutrient loading. Whether ecosystems facilitated by different plants and invertebrates foster pollutant removal in bioretention remains an open research area.

3. Current Research

3.1. Aspects of Bioretention Research

Major aspects of bioretention research have focused upon hydrologic mitigation and runoff treatment. A common means to investigate these features is through direct observation on field-scale bioretention facilities. Another method employed in research is to simulate a bioretention system within an artificial container, called a mesocosm. Mesocosms clarify the roles of media, plants, and microbes in this complicated and interrelated ecosystem. Computational models may extend the reach of our ability to simulate complex bioretention processes based upon physical laws and mathematical equations. Modeling simplifies the bioretention system, helps characterize its internal water flow, pollutant mass fluxes and hydrology, and assists in evaluating pollutant treatment performance. Since the mechanisms and maintenance practices of bioretention systems are still evolving, long-term performance and life-cycle cost [30] relationships are still being documented. As these relationships become better understood, simulations can better predict lifecycle costs and maintenance intervals. These areas of research are detailed in the following sections.

3.2. Column and Mesocosm Bioretention Studies

A mesocosm is an experimental tool for small-scale laboratory study of bioretention [79]. The merit of mesocosm studies is their simplification of a complex full scale system, and ability to separate individual factors for evaluation through replication. Mesocosm experiments can be used to determine optimal designs with specific combinations of media selection and layer setting. They can also circumvent some impediments in large scale implementation of bioretention practices, including uncertainties related to performance and cost, insufficient standards and technical regulations, institutional and legislative gaps, insufficient funding, and effective market incentives [79]. Although a mesocosm is an artificial system with limited space, and less realistic than field scale studies, they can be used as a tool to reveal the internal mechanisms and fluxes within bioretention cells.
Mesocosm experiments have been extensively conducted to evaluate bioretention performance and understand internal treatment processes [80,81,82]. An early example of this research is Hsieh and Davis [44], who performed two experiments with 18 bioretention mesocosms using synthetic runoff. The experiment compared pollutant removals between two designs to show that a uniform profile was a more cost-effective alternative than multilayer media. Another mesocosm experiment was conducted [83] to evaluate bioretention media characteristics. Results showed media with excess clay could clog and increase TSS discharge.
Amendment of media to improve bioretention performance is an active area of research. Water treatment residuals (WTRs), containing alum, are used as an admixture within bioretention media to enhance P removal. A specific media using WTR as an admixture can provide effective initial total P retention >94% [81]. Other research on WTR P removal demonstrated that Al oxides in WTR could adsorb P, and increasing WTR content in the media resulted in greater P adsorption [81,84,85]. Another mesocosm study [86] examined the capability of a bioretention soil mixtures with 60% sand, 15% compost derived from yard, garden, wood, and food wastes, 15% shredded cedar bark, and 10% water treatment residuals containing alum to reduce nutrients from storm runoff. Results showed that a saturation zone could reduce NO3 significantly in the effluent (71%), however PO4 removal was higher without it (80% compared to 67% with IWS). Vegetation did not make a difference in this study. A higher P removal of >94% removal was achieved using a specific media with WTR as an admixture with coir peat to reduce nutrient leaching losses [81]. The presence of vegetation was a significantly correlated with improved P retention [81,82,87]. Carbon-enriched media was hypothesized to enhance N removal, with carbon serving as an electron donor to facilitate the denitrification process. Modifying bioretention media with newspaper and wood chips provided N removal above 90% [52].
Some mesocosm research has shown that nutrient removal from stormwater can be enhanced by promoting plant growth and microbial activity. Retention and removal of nutrients in vegetated and unvegetated bioretention mesocosms were investigated with 30 well-established 240-L “wheelie-bin” containers to evaluate the effects of plants [82]. The experiment demonstrated that the vegetated sandy loam mesocosms retained higher amounts of nutrients, suggesting that this combination of media type and vegetation may promote pollutant removal in bioretention cells. The improvement in N removal indicates that denitrification is being facilitated by plants and associated microbes in the root zone.
Mesocosm experiments can also help determine hydraulic retention time (HRT) for optimizing treatment. Lucas and Greenway conducted a series of bioretention mesocosm experiments with planted vegetation to compare hydraulic response and N retention with free discharge and regulated outlets to increase the HRT by up to 8 times. At a hydraulic loading rate (HLR) of 60 cm over 90 minutes, the regulated outlet retained 68% of NO2-3 and 60% of total N; while the corresponding free-draining treatment retained 25% of NO2-3 and 27% of total N [80]. At half this HLR, TN removal was as high as 78%, and NO2-3 removal was over 90% [80]. Outlet control and lower HLRs provided longer HRTs and thus improves N removal. However, runoff capture is compromised with longer HRTs [80,82]. This result indicates that HRT should be a significant point of consideration in design for nutrient and metal removal, especially for those pollutants that require redox or biological conversion.

3.3. Field-Scale Bioretention Monitoring

Studies of a field-scale bioretention cells have been conducted to provide design factors that are important to meet hydrologic and water quality goals [35,42,48,66,88,89]. To evaluate the hydrologic impacts of bioretention within an urban environment, Davis [34] monitored the performance of two bioretention cells receiving runoff from adjacent parking lots for approximately two years, covering 49 rainfall events. Results indicated that discharge flow peaks were reduced by over 50%, and were lagged in time by a factor of 2 or more. Another study on six cells in Maryland and North Carolina showed that bioretention could achieve substantial hydrologic benefits by delaying and reducing peak flows and decreasing runoff volume. Performance diminished as rainfall depths increased and rainfall durations became longer. The authors found a large cell media volume to drainage area ratio and drainage configurations were the most dominant factors that improved performance. Annual water budget analysis suggested that approximately 19% of runoff entering the bioretention cells was lost to evapotranspiration, and 8% was loss to exfiltration [38]. The sites in Louisburg, North Carolina monitored the infiltration rate, and it was found to be in the range of 2.5–3.8 cm/h.
Li and Davis [37] evaluated water quality improvements of two bioretention cells for a 15-month period in Maryland. The authors found that bioretention performed effectively in removing TSS, Pb, and Zn from runoff. They found runoff volume reduction promoted pollutant mass removal and linked outflow quality benefits with hydrologic performance. Lloyd and Wong [90] found that a landscaped bioretention reduced suspended sediments by 68% and total P and N by 60% and 57%, respectively. In some cases, effluent from bioretention areas might have higher pollutant concentrations than those of the influent. A monitoring experiment in North Carolina indicated mean pollutant reduction efficiencies for the bioretention cells of 79% reduction for TSS with an increase in NO3 and NO2, resulting from a combination of N additions within the cell and conversion [91]. This is consistent with other observations as bioretention typically reduces TSS, oil and grease, heavy metals and P, but have been less effective for N [44]. Yang et al. [92] evaluated a biphasic bioretention cell; which uses sequencing batch reactor processes including alternating aerobic and anaerobic sounds in a longer HRT to facilitate denitrification. Approximately 91% of introduced NO3 was removed.

3.4. Development of Computational Models

Numerical modeling of bioretention systems is an area of active research. Computational models can provide assistance in characterizing the multiple physiochemical and biological processes occurring within a bioretention cell. Coupling these processes with the hydrology of a site can provide a means of predicting treatment performance of a given design. Before models can be used to predict behavior, however, they must reliably replicate observed data and/or be calibrated. Most studies focus on model calibration and performance of the model.
A variety of models have been applied to LID practices, including bioretention, and a selection of these is listed in Table 3. A review of these and other similar models can be found in [93,94].The US EPA’s SWMM, or Storm Water Management Model [95,96] uses a rainfall–runoff model to estimate runoff volumes, peak flows, and with continuous simulation, flow duration. Bosley modeled multiple bioretention cells within a watershed using SWMM to evaluate their hydrologic performance [97]. Bioretention is one of the LID options within SWMM. As currently configured, a bioretention cell must be contained within a sub catchment, effectively limiting its use to upper portions of a watershed [98], which is the norm. Most of the components of a typical cell can be input by the user, including underdrains. Water quality treatment is limited to mass load reduction. A computational model of a bioinfiltration cell (similar to a bioretention cell, no underdrain) [99] in a traffic island was developed using the Hydrologic Modeling System, or HEC-HMS [100]. The authors were able to separately simulate many key hydrologic elements, such as infiltration using the Green-Ampt infiltration submodel. However, key control and routing elements needed for design were beyond the capability of the model, which is limited primarily to simulating storage, i.e., detention. A new feature of the model was added in version 4.0, in which the nutrients N and P concentrations are simulated, incorporating overland flow and within stream processes.
Lucas conducted a design of integrated bioretention urban retrofits with storm event simulations by HydroCAD [101]. The author found that, excluding reverse flows, HydroCAD simulated the hydraulics of the cell in a manner virtually identical to SWMM, however the latter model can provide continuous simulation [31], whereas the former cannot. DRAINMOD [102], originally developed for the purpose of simulating agricultural fields, was recently adapted to simulate bioretention [103], due to the similarity between an underdrain and subsurface drain tiles. The authors found that the model was able to simulate IWS and replicate soil water characteristic curves, a unique capability. Model validation was performed on two bioretention cells in Rocky Mount and Nashville, North Carolina. It became evident after beginning the study that there were problems in measuring soil moisture at Rocky Mount because drainage removed water too quickly. Issues also arose at Nashville in terms of overflows. It was found that the model performed reasonably well after adjusting for a design modification that added surface storage at Nashville and an IWS at Rocky Mount. While these applications do not include water quality simulation, additional modules of DRAINMOD are available to simulate the N cycle [104,105]. P currently is not simulated.
Two derived distribution models have been applied to LID simulation, WinSLAMM, and IDEAL. WinSLAMM uses a small storm methodology for hydrology [106], coupled with characterization of land use to develop predictions of water quality input to a control. Pollutant treatment through a variety of processes is also simulated within the control such as bioretention. WinSLAMM is usually applied at a watershed scale, in contrast with IDEAL, which is usually applied at the site scale. IDEAL also provides process-based estimates of pollutant removal for each control, including a very detailed sediment submodel [107]. The Western Washington Hydrologic Model, or WWHM is an adaptation of HSPF, or Hydrological Simulation Program—Fortran. Like its parent model, WWHM uses continuous simulation of most hydraulic processes to model LID [108], and must be calibrated to specific watersheds.
Table 3. Descriptions and uses of major computational models to simulate bioretention systems.
ModelBrief DescriptionCapabilitiesReferences
SWMMHydrologic, hydraulic and water quality model with optional continuous simulationDetailed analysis of watershed with storage-focused LIDDocumentation: [95,96]
Applications: [31,109,110,111,112]
Download: [113]
Hydro-CAD *Hydrologic model that uses a design storm methodology to calculate runoff and detention pond routing with exfiltration optionAnalysis of storage and infiltration based LID within a watershedDocumentation: [101]
Applications: [31,114]
Download: [101]
HEC-HMSModel to develop standard hydrograph based on precipitation inputObtaining standard, non-adjusted hydrographs. Not recommended for modeling integrated practicesDocumentation: [115]
Applications: [99,116,117]
Download: [100]
RECARGAHydraulic model for optional event and continuous simulation or design purposeDetailed analysis for bioretention hydraulics and runoff retentionDocumentation: [118,119,120]
Applications: [119,121,122,]
Download: [120]
DRAINMODHydrologic model based upon agricultural field drainage, and treatment, a similar process to bioretentionSimulates water table and soil-moisture profile.Documentation: [102]
Applications: [103,104,105]
Download: [123]
WinSLAMM **Hydrologic model that uses a derived distribution based upon small storm hydrology to simulate performance of controlsPollutant washoff calculated based upon land characteristics. Model traces pollutants from sources and predicts effects of controlsDocumentation: [124]
Applications: [106,110,125]
Download: [126]
IDEAL *Hydrologic model that uses a derived distribution to simulate performance of controls, for both quality and quantityProcess-based pollutant loading and treatment model, includes decay, settling, and infiltration, focused upon evaluation of a site before and after development.Documentation: [127]
Applications: [107]
Download: [128]
WWHMHydrologic model based upon HSPF adapted for control practice design using continuous simulationCalibrated regional parameters for the 19 counties of Western Washington, Version 2012 includes modeling elements to more accurately model bioretention and other LID practices.Documentation: [129]
Applications: [108]
Download:[130]
Notes: * Proprietary; and ** Licensed, the remaining are public domain.
Another model, RECARGA [120] was specifically developed to simulate an individual bioretention cell to assist in design. RECARGA uses a physically-based approach to simulate the water balance for runoff inputs, surface ponding, infiltration, evapotranspiration, overflows, underdrain outflows, and exfiltration or groundwater recharge [118]. RECARGA was applied to the Sugar River watershed in Verona, WI to develop site-specific hydrologic criteria [131]. These RECARGA simulations illustrate trade-offs in design; i.e., maintaining a predevelopment recharge rate while minimizing increases in runoff. RECARGA replicated site hydrology well. It does not, however, simulate constituents nor estimate water quality treatment at present.
Roy-Poirier et al. developed a numerical model to calculate unit processes of bioretention that reduce P in both soluble and particulate forms [63]. The authors presented simplified reaction equations to describe the processes of precipitation, dilution, vegetative uptake, isotherm sorption, and settlement. This model does not consider vegetation uptake and defoliation and thus cannot complete the full cycle of P transformation within a bioretention system. A sophisticated model of nutrient flux was developed by Kadlec and Hammer that describes the dynamic changes of P, N, and carbon within wetlands [132]. These processes included mineralization, plant uptake, nitrification, denitrification, and volatilization using coupled differential equations [133]. Event-based simulations are typically used to define limits of nutrient retention under standard conditions for regulatory compliance, and can be informative in comparing performance of design alternatives. A review of similar models for nutrient simulation is provided by Langergraber et al. [134]. Most of these models incorporate vegetation, but assume biomass content remains constant, i.e., no growth, and no seasonal defoliation.
A computational model of bioretention can be a useful tool to provide a means to estimate output metrics such as runoff peak, runoff volume and nutrient removal for the purpose of guiding design and enhancing performance. In effect, this allows the user to try multiple designs. Models simplify the complicated processes within bioretention using mathematical constructs and equations. The initial models of bioretention systems suffered from lack of data and inappropriate assumptions. Improving computational programs for bioretention modeling is an ongoing research need.

3.4. Maintenance, Costs, and Life Cycle Analysis

3.4.1. Maintenance

Recent studies have focused upon the management and maintenance of bioretention in order to enhance performance and reduce lifecycle costs. In a recent study, 2 sets of bioretention cells were repaired by excavating the top 75 mm of fill media to remove accumulated fine sediments. This increased the surface storage volume by nearly 90% and the infiltration rate by up to a factor of 10. Overflow volume decreased from 35%–37% to 11%–12% respectively. Nearly all effluent pollutant loads exiting the post-repair cells were lower than their pre-repair conditions [48]. This outcome showed that clogging was limited to the surficial media layer, and maintenance was critical to performance. In another study, 43 bioretention cells were evaluated across North Carolina to assess if they were constructed in compliance with their design [55]. In addition to discrepancies between their design and practice, media specification also changed in 2005. Despite more than 65% of the cells being undersized, most were meeting their infiltration drawdown goal after a storm event. In addition to the visual drawdown inspection, infiltrometer tests can be performed, allowing calculation of the saturated hydraulic conductivity across the bioretention cell [135]. In a study of two bioretention cells receiving bridge deck runoff in North Carolina [136], the units were sized for the 25 (standard design) and 8 mm (undersized) rain events and had similar depth, and water storage characteristics. Despite its size, outflow pollutant loads between the two cells were not significantly different. Because smaller systems are likely less expensive, this suggests that undersized systems may perform better in terms of cost per unit of drainage area.

3.4.2. Costs

Costs of bioretention have been found to be highly variable, and depend greatly upon design objectives and the characteristics of a given site [30]. The U.S. EPA model SUSTAIN [137] (System for Urban Stormwater Treatment and Analysis Integration) contains links to various cost databases that assist in general and specific cost estimates of bioretention [138]. Generalized relationships have been developed for construction and operation and maintenance costs in North Carolina [139], using regression analysis to develop a power equation between costs and drainage area. An alternative approach is a spreadsheet cost model developed by the Water Environment Research Foundation (WERF). Because of the relative newness and uniqueness of the different bioretention designs, the WERF cost model [140] had few experiential examples to base its calculations upon; instead estimates are developed based upon unit costs from national sources such as RS Means [141]. Since maintenance requirements for bioretention practices are still being established [30], costs will then very substantially based upon what activities are conducted. In a recent study, Houle et al. [142] provided insight into maintenance activities by tracking costs and labor demands for bioretention practices over a period of 2–4 years. The authors found that despite conventional wisdom, LID practices such as bioretention, which typically require proactive rather than reactive maintenance, experience lower marginal costs than conventional practices. In addition to maintenance, an often overlooked but substantial component of costs is the opportunity costs of the space or land occupied by the bioretention practice [143,144]. Roy et al. [145] pointed out that performance enhancements from bioretention are very difficult to measure unless implementation is targeted on a small watershed scale. Because of limited resources, implementation is usually spread out and not focused a single watershed where impacts can be focused and measured. Roy et al. contended that costs and performance are inseparable and future research should target both of these metrics through implementation at a watershed scale where improvements can be measured and assessed.

3.4.3. Lifecycle Analysis

Flynn and Traver [146] trace the life cycle of a bio-infiltration cell and assess its performance using metrics such as carbon footprint, acidification potential, human life cycle economic costs and etc. to evaluate its benefits and impacts. Results showed that the construction phase is the main contributing life cycle phase for all adverse environmental impacts, as well as total life cycle cost and labor impacts [146]. The assessment provided guidance towards refined design and possible sustainable management of bioretention practices. Taylor and Fletcher [147] describe a new costing module that is part of MUSIC (Model for Urban Stormwater Improvement Conceptualization). A key benefit of using a module such as this is the potential collection of additional data sets to improve the accuracy of cost estimates.

3.5. Implications for Design

Design practices, including that of the media blend and hydraulics of bioretention cells are evolving. Due to the propensity of bioretention to collect sediment and potentially clog, pretreatment removal of sediment prior to treatment in a bioretention cell is essential. Current practice in media design is to use blends heavy in sand content, to eliminate clogging and provide rapid infiltration into the bioretention cell, an example of one of these is the Commonwealth of Virginia recommendation [148]. Plants should be selected carefully considering the anticipated cycles of wet and dry soil moisture conditions, with sandy mixes typically resulting in drier conditions. Multiple layers may be with dual purposes [44], may be an option. Underdrainage is usually needed for soils with slow infiltration rates, i.e., less than 13 mm/h. A range of compost materials have been used in media blends, as organic carbon can provide an electron source and facilitate denitrification. However, recent Washington State monitoring data [149] indicates that compost with sources other than yard waste may contain loosely bound heavy metals and nutrients which may result in an increase in these compounds in discharges, at least initially. Admixtures such as water treatment residuals (WTRs) containing alum have been demonstrated to increase P removal. However, performance varies substantially depending upon the specific blend of WTRs. Inclusion of a means of retaining water for longer periods, such as an IWS may increase N removal. Models may be able to facilitate hydraulic design of bioretention, future models should be able to assist in customized treatment processes.

5. Summary and Research Needs

Bioretention is one of the most recognized LID practices for mitigating the hydrologic impacts of urbanization development and improving water quality in urban areas. Extensive research work has been conducted on bioretention to understand its function, improve its performance, and lengthen and predict its lifecycle. After compiling this review, the authors make the following recommendations for further research:
  • Direct monitoring experiments of field-scale bioretention provides a means to evaluate hydrologic and treatment performance. Much work has been conducted in terms of field-scale bioretention monitoring. Several interesting studies have been conducted on undersized systems. A continuing study of the operation of undersized systems (currently underway through the Washington State TAPE program) until a substantial decline in performance can be observed may provide insight into the life cycle of bioretention. . This would require continued collection of performance monitoring, maintenance activities, and costs. Sufficient numbers of these studies need to be performed in various locations so the observations can be generalized. Groundwater data should be collected, where appropriate, at any field study location. This is to address potential mounding issues and to evaluate eventual fate and transport. Evaluating the thermal impacts of stormwater, and the benefits of bioretention remains a research need. Evaluating the biodiversity of existing bioretention systems, comparing them with forested ecosystems, and assessing that the effect on performance is also a research need.
  • Mesocosms may provide a cost-effective alternative to field scale studies, and are similar in cost to column studies. They are less realistic than field scale studies. However, because of the ease of replication, use of mesocosms enable studies to focus on optimization of differing media blends and other factors such as HRT. Research is needed to better optimize mix design and provide better guidance to designers. Media amendments such as WTRs should be further evaluated. To maximize the utility of both field studies and mesocosm studies, results of both should be compared to assess whether generalizations can be made.
  • Construction costs for bioretention vary widely. Part of this is due to the novelty of bioretention to the design community, but often there are unique factors at each site that influence costs. While municipalities are the main implementers of bioretention, there is presently little incentive to collect cost data or share it. While there are a few studies on maintenance activities and associated costs with bioretention, much more needs to be done over long durations. Research is needed to identify cost drivers, account for variability, and develop better tools for predicting costs. These activities will lead to a better understanding of lifecycle costs for bioretention.
  • While there are a wide variety of computational models available for bioretention, there are still shortcomings of each. There is a need for a model that can estimate the hydrologic performance and nutrient removal of bioretention for design. Computation of biomass change, plant uptake, and defoliation are important processes which should be included to complete N and P cycles within bioretention systems, and complete the lifecycle of the practice. Computational models may provide a means to identify what is being transferred to groundwater.
Bioretention systems are small but highly complex. The physical and biological processes that occur within bioretention mimic ecological processes similar to those that occur in nature. These systems are perhaps the best effort so far at providing hydrologic ecological restoration of urban areas. To the extent that these systems can be installed cost-effectively and operated reliably for water quality treatment of runoff, they may represent a truly sustainable treatment practice. Improved estimates of performance will help meet downstream water quality goals. Continued research should lead to refinement of bioretention design and improved performance and help provide sustainable solutions to our urban drainage problems.

Acknowledgments

This study was funded in part by the U.S. Department of Agriculture Mid Atlantic Water Program research project: “Evaluation of Bioretention Recipes for Sequestering Stormwater Nitrogen and Phosphorus.” The authors would also like to thank two anonymous reviewers whose review greatly improved this manuscript. The authors also thank Bill Lucas, who is chairing an American Society of Civil Engineer’s Task Committee focusing on computational models for use in LID, for his insight.

Conflicts of Interest

The authors declare no conflicts of interest.

References

  1. The Economist Open-air Computers: Cities are Turning into Vast Data Factories. Available online: http://www.economist.com/news/special-report/21564998-cities-are-turning-vast-data-factories-open-air-computers (accessed on 13 April 2014).
  2. UN News Center Half of Global Population Will Live in Cities by End of This Year, Predicts UN. Available online: http://www.un.org/apps/news/story.asp?NewsID=25762 (accessed on 13 April 2014).
  3. Heaney, J.P. Chapter 2: Principles of tegrated Urban Water Management. In Innovative Urban Wet-Weather Flow Management Systems; Heaney, J.P., Pitt, R., Field, R., Eds.; U.S. Environmental Protection Agency: Cincinatti, OH, USA, 1999; p. 62. [Google Scholar]
  4. Cianfrani, C.M.; Hession, W.C.; Rizzo, D.M. Watershed imperviousness impacts on stream channel condition in Southeast Pennsylvania. J. Am. Water Resour. Assoc. 2006, 42, 941–956. [Google Scholar] [CrossRef]
  5. Chen, Y.; Day, S.D.; Wick, A.F.; Strahm, B.D.; Wiseman, P.E.; Daniels, W.L. Changes in soil carbon pools and microbial biomass from urban land development and subsequent post-development soil rehabilitation. Soil Biol. Biochem. 2013, 66, 38–44. [Google Scholar] [CrossRef]
  6. Fletcher, T.D.; Andrieu, H.; Hamel, P. Understanding, management and modelling of urban hydrology and its consequences for receiving waters: A state of the art. Adv. Water Resour. 2013, 51, 261–279. [Google Scholar] [CrossRef]
  7. Yang, G.; Bowling, L.C.; Cherkauer, K.A.; Pijanowski, B.C. The impact of urban development on hydrologic regime from catchment to basin scales. Landsc. Urban Plan. 2011, 103, 237–247. [Google Scholar] [CrossRef]
  8. Kaushal, S.S.; Belt, K.T. The urban watershed continuum: Evolving spatial and temporal dimensions. Urban Ecosyst. 2012, 15, 409–435. [Google Scholar] [CrossRef]
  9. Meierdiercks, K.L.; Smith, J.A.; Baeck, M.L.; Miller, A.J. Analyses of urban drainage network structure and its impact on hydrologic response. J. Am. Water Resour. Assoc. 2010, 46, 932–943. [Google Scholar] [CrossRef]
  10. Nelson, E.J.; Booth, D.B. Sediment sources in an urbanizing, mixed land-use watershed. J. Hydrol. 2002, 264, 51–68. [Google Scholar] [CrossRef]
  11. Carey, R.O.; Hochmuth, G.J.; Martinez, C.J.; Boyer, T.H.; Dukes, M.D.; Toor, G.S.; Cisar, J.L. Evaluating nutrient impacts in urban watersheds: Challenges and research opportunities. Environ. Pollut. 2013, 173, 138–149. [Google Scholar] [CrossRef]
  12. Hatt, B.E.; Steinel, A.; Deletic, A.; Fletcher, T.D. Retention of heavy metals by stormwater filtration systems: Breakthrough analysis. Water Sci. Technol. 2011, 64, 1913–1919. [Google Scholar] [CrossRef]
  13. Alberti, M.; Booth, D.; Hill, K.; Coburn, B.; Avolio, C.; Coe, S.; Spirandelli, D. The impact of urban patterns on aquatic ecosystems: An empirical analysis in Puget lowland sub-basins. Landsc. Urban Plan. 2007, 80, 345–361. [Google Scholar] [CrossRef]
  14. Thompson, T.M. Low Impact Development Presentation; Biological Systems Engineering, Virginia Polytechnic Institute and State University: Blacksburg, VA, USA, 2009. [Google Scholar]
  15. Schueler, T.R. Site Planning for Urban Stream Protection; Metropolitan Washington Council of Governments: Washington, DC, USA, 1995. [Google Scholar]
  16. Akan, A.O. Urban Stormwater Hydrology: A Guide to Engineering Calculations; Technomic Pub. Co.: Lancaster, PA, USA, 1993. [Google Scholar]
  17. Booth, D.B.; Hartley, D.; Jackson, R. Forest cover, impervious-surface area, and the mitigation of stormwater impacts. J. Am. Water Resour. Assoc. 2002, 38, 835–845. [Google Scholar] [CrossRef]
  18. Arias, M.; Brown, M.; Sansalone, J. Characterization of storm water—Suspended sediments and phosphorus in an urban catchment in Florida. J. Environ. Eng. 2013, 139, 277–288. [Google Scholar] [CrossRef]
  19. Sample, D.J.; Grizzard, T.J.; Sansalone, J.; Davis, A.P.; Roseen, R.M.; Walker, J. Assessing performance of manufactured treatment devices for the removal of phosphorus from urban stormwater. J. Environ. Manag. 2012, 113, 279–291. [Google Scholar] [CrossRef]
  20. Passeport, E.; Hunt, W. Asphalt parking lot runoff nutrient characterization for eight sites in North Carolina, USA. J. Hydrol. Eng. 2009, 14, 352–361. [Google Scholar] [CrossRef]
  21. Makepeace, D.K.; Smith, D.W.; Stanley, S.J. Urban stormwater quality: Summary of contaminant data. Crit. Rev. Environ. Sci. Technol. 1995, 25, 93–139. [Google Scholar] [CrossRef]
  22. US Environmental Protection Agency. Results of the Nationwide Urban Runoff Program: Volume 1—Final Report; U.S. Environmental Protection Agency, Water Planning Division: Washington, DC, USA, 1983; Volume 1. [Google Scholar]
  23. Pitt, R. The National Stormwater Quality Database (NSQD). Version 3. Available online: http://rpitt.eng.ua.edu/Research/ms4/Paper/Mainms4paper.html (accessed on 13 April 2014).
  24. Prince George’s County. Low-Impact Development Design Strategies, An Integrated Design Approach; Department of Environmental Resources, Programs and Planning Division: Largo, MD, USA, 2000. [Google Scholar]
  25. University of Arkansas. Low Impact Development: A Design Manual for Urban Areas; University of Arkansas Press: Fayetteville, AR, USA, 2010. [Google Scholar]
  26. Sample, D.; Liu, J. Best Management Practice Fact Sheet 9: Bioretention. Available online: http://pubs.ext.vt.edu/426/426-128/426-128.html (accessed on 13 April 2014).
  27. Hunt, W.; Smith, J.; Jadlocki, S.; Hathaway, J.; Eubanks, P. Pollutant removal and peak flow mitigation by a bioretention cell in urban Charlotte, N.C. J. Environ. Eng. 2008, 134, 403–408. [Google Scholar] [CrossRef]
  28. Dietz, M. Low impact development practices: A review of current research and recommendations for future directions. Water Air Soil Pollut. 2007, 186, 351–363. [Google Scholar] [CrossRef]
  29. US Environmental Protection Agency. Benefits of Low Impact Development: How LID can Protect Your Community’s Resources; Office of Wetlands, Oceans, and Watersheds: Washington, DC, USA, 2012. [Google Scholar]
  30. Davis, A.P.; Hunt, W.; Traver, R.; Clar, M. Bioretention technology: Overview of current practice and future needs. J. Environ. Eng. 2009, 135, 109–117. [Google Scholar] [CrossRef]
  31. Lucas, W.C. Design of integrated bioinfiltration-detention urban retrofits with design storm and continuous simulation methods. J. Hydrol. Eng. 2010, 15, 486–498. [Google Scholar] [CrossRef]
  32. Davis, A.P.; Traver, R.G.; Hunt, W.F. Improving urban stormwater quality: Applying fundamental principles. J. Contemp. Water Res. Educ. 2010, 146, 3–10. [Google Scholar] [CrossRef]
  33. DeBusk, K.M.; Wynn, T.M. Storm-water bioretention for runoff quality and quantity mitigation. J. Environ. Eng. 2011, 137, 800–808. [Google Scholar] [CrossRef]
  34. Davis, A.P. Field performance of bioretention: Hydrology impacts. J. Hydrol. Eng. 2008, 13, 90–95. [Google Scholar] [CrossRef]
  35. Hunt, W.; Jarrett, A.; Smith, J.; Sharkey, L. Evaluating Bioretention hydrology and nutrient removal at three field sites in North Carolina. J. Irrig. Drain. Eng. 2006, 132, 600–608. [Google Scholar] [CrossRef]
  36. Brown, R.A.; Hunt, W.F. Underdrain configuration to enhance Bioretention exfiltration to reduce pollutant loads. J. Environ. Eng. 2011, 137, 1082–1091. [Google Scholar] [CrossRef]
  37. Li, H.; Davis, A.P. Water quality improvement through reductions of pollutant loads using bioretention. J. Environ. Eng. 2009, 135, 567–576. [Google Scholar] [CrossRef]
  38. Li, H.; Sharkey, L.J.; Hunt, W.F.; Davis, A.P. Mitigation of impervious surface hydrology using bioretention in North Carolina and Maryland. J. Hydrol. Eng. 2009, 14, 407–415. [Google Scholar] [CrossRef]
  39. O’Neill, S.; Davis, A. Analysis of Bioretention Media Specifications and Relationships to Overall Performance. In Proceedings of the World Environmental and Water Resources Congress 2009, Kansas City, MO, USA, 17–21 May 2009; pp. 1–9.
  40. Virginia Department of Conservation and Recreation. Virginia Nutrient Management Standards and Criteria; Commonwealth of Virginia, Department of Conservation and Recreation: Richmond, VA, USA, 2005; p. 120. [Google Scholar]
  41. Beck, M.B. Vulnerability of water quality in intensively developing urban watersheds. Environ. Model. Softw. 2005, 20, 381–400. [Google Scholar] [CrossRef]
  42. Li, H.; Sharkey, L.; Hunt, W.; Davis, A. Mitigation of impervious surface hydrology using bioretention in North Carolina and Maryland. J. Hydrol. Eng. 2009, 14, 407–415. [Google Scholar] [CrossRef]
  43. US Department of Housing and Urban Development. The Practice of Low Impact Development; Office of Policy Development and Research: Washington, DC, USA, 2003. [Google Scholar]
  44. Hsieh, C.-H.; Davis, A.P. Evaluation and optimization of Bioretention media for treatment of urban storm water runoff. J. Environ. Eng. 2005, 131, 1521–1531. [Google Scholar] [CrossRef]
  45. DeBusk, K.; Hunt, W.; Line, D. Bioretention outflow: Does it mimic nonurban watershed shallow interflow? J. Hydrol. Eng. 2011, 16, 274–279. [Google Scholar] [CrossRef]
  46. Brown, R.; Hunt, W. Bioretention Performance in the Upper Coastal Plain of North Carolina. In Low Impact Development for Urban Ecosystem and Habitat Protection; American Society of Civil Engineers, Reston: VA, USA, 2008; pp. 1–10. [Google Scholar]
  47. Brown, R.; Hunt, W. Underdrain configuration to enhance bioretention exfiltration to reduce pollutant loads. J. Environ. Eng. 2011, 137, 1082–1091. [Google Scholar] [CrossRef]
  48. Brown, R.A.; Hunt, W.F. Improving bioretention/biofiltration performance with restorative maintenance. Water Sci. Technol. 2012, 65, 361–367. [Google Scholar] [CrossRef]
  49. DeBusk, K.; Wynn, T. Storm-water bioretention for runoff quality and quantity mitigation. J. Environ. Eng. 2011, 137, 800–808. [Google Scholar] [CrossRef]
  50. Olszewski, J.; Davis, A. Comparing the hydrologic performance of a bioretention cell with predevelopment values. J. Irrig. Drain. Eng. 2013, 139, 124–130. [Google Scholar] [CrossRef]
  51. Hunt, W.; Davis, A.; Traver, R. Meeting hydrologic and water quality goals through targeted bioretention design. J. Environ. Eng. 2012, 138, 698–707. [Google Scholar] [CrossRef]
  52. Kim, H.; Seagren, E.A.; Davis, A.P. Engineered Bioretention for removal of nitrate from stormwater runoff. Water Environ. Res. 2003, 75, 355–367. [Google Scholar] [CrossRef]
  53. Passeport, E.; Hunt, W.; Line, D.; Smith, R.; Brown, R. Field study of the ability of two grassed Bioretention cells to reduce storm-water runoff pollution. J. Irrig. Drain. Eng. 2009, 135, 505–510. [Google Scholar] [CrossRef]
  54. Li, H.; Davis, A.P. Urban particle capture in bioretention media. I: Laboratory and field studies. J. Environ. Eng. 2008, 134, 409–418. [Google Scholar] [CrossRef]
  55. Wardynski, B.; Hunt, W. Are bioretention cells being installed per design standards in North Carolina? A Field Study. J. Environ. Eng. 2012, 138, 1210–1217. [Google Scholar] [CrossRef]
  56. Endreny, T.; Collins, V. Implications of bioretention basin spatial arrangements on stormwater recharge and groundwater mounding. Ecol. Eng. 2009, 35, 670–677. [Google Scholar] [CrossRef]
  57. Barron, O.V.; Barr, A.D.; Donn, M.J. Evolution of nutrient export under urban development in areas affected by shallow watertable. Sci. Total Environ. 2013, 443, 491–504. [Google Scholar] [CrossRef]
  58. Blake, L.; Mercik, S.; Koerschens, M.; Moskal, S.; Poulton, P.R.; Goulding, K.W.T.; Weigel, A.; Powlson, D.S. Phosphorus content in soil, uptake by plants and balance in three European long-term field experiments. Nutr. Cycl. Agroecosyst. 2000, 56, 263–275. [Google Scholar] [CrossRef]
  59. Hunt, W.F. Pollutant Removal Evaluation and Hydraulic Characterization for Bioretention Stormwater Treatment Devices. Ph.D. Thesis, The Pennsylvania State University, University Park, PA, USA, August 2003. [Google Scholar]
  60. Hamlin, H.J.; Michaels, J.T.; Beaulaton, C.M.; Graham, W.F.; Dutt, W.; Steinbach, P.; Losordo, T.M.; Schrader, K.K.; Main, K.L. Comparing denitrification rates and carbon sources in commercial scale upflow denitrification biological filters in aquaculture. Aquac. Eng. 2008, 38, 79–92. [Google Scholar] [CrossRef]
  61. Reddy, K.R.; Patrick, W.H. Nitrogen transformations and loss in flooded soils and sediments. CRC Crit. Rev. Environ. Control 1984, 13, 273–309. [Google Scholar] [CrossRef]
  62. Goldberg, S. Equations and models describing adsorption processes in soils. In Soil Science Society of America Book Series Number 8; Soil Science Society of America Inc.: Madison, WI, USA, 2005; pp. 489–517. [Google Scholar]
  63. Roy-Poirier, A.; Champagne, P.; Filion, Y. Bioretention processes for phosphorus pollution control. Environ. Rev. 2010, 18, 159–173. [Google Scholar] [CrossRef]
  64. Schachtman, D.P.; Reid, R.J.; Ayling, S.M. Phosphorus uptake by plants: From soil to cell. Plant Physiol. 1998, 116, 447–453. [Google Scholar] [CrossRef]
  65. Barber, S.A. Soil Nutrient Bioavailability: A Mechanistic Approach; Wiley: New York, NY, USA, 1984. [Google Scholar]
  66. Komlos, J.; Traver, R. Long-term orthophosphate removal in a field-scale storm-water bioinfiltration rain garden. J. Environ. Eng. 2012, 138, 991–998. [Google Scholar] [CrossRef]
  67. Chen, X.L.; Peltier, E.; Sturm, B.S.M.; Young, C.B. Nitrogen removal and nitrifying and denitrifying bacteria quantification in a stormwater bioretention system. Water Res. 2013, 47, 1691–1700. [Google Scholar] [CrossRef]
  68. Hathaway, J.; Hunt, W.; Graves, A.; Wright, J. Field evaluation of Bioretention indicator bacteria sequestration in Wilmington, North Carolina. J. Environ. Eng. 2011, 137, 1103–1113. [Google Scholar] [CrossRef]
  69. Jones, P.S.; Davis, A.P. Spatial accumulation and strength of affiliation of heavy metals in Bioretention media. J. Environ. Eng. 2013, 139, 479–487. [Google Scholar] [CrossRef]
  70. Li, H.; Davis, A.P. Heavy metal capture and accumulation in bioretention media. Environ. Sci. Technol. 2008, 42, 5247–5253. [Google Scholar] [CrossRef]
  71. Davis, A.P. Field performance of bioretention: Water quality. Environ. Eng. Sci. 2007, 24, 1048–1064. [Google Scholar] [CrossRef]
  72. Kumar, R.; Martell, S.J.; Pitcher, T.J.; Varkey, D.A. Temperature-driven decline of a cisco population in Mille Lacs Lake, Minnesota. North Am. J. Fish. Manag. 2013, 33, 669–681. [Google Scholar] [CrossRef]
  73. Roseen, R.; Ballestero, T.; Houle, J.; Avellaneda, P.; Briggs, J.; Fowler, G.; Wildey, R. Seasonal performance variations for storm-water management systems in cold climate conditions. J. Environ. Eng. 2009, 135, 128–137. [Google Scholar] [CrossRef]
  74. Long, D.L.; Dymond, R.L. Thermal pollution mitigation in cold water stream watersheds using Bioretention. J. Am. Water Resour. Assoc. 2003. [Google Scholar] [CrossRef]
  75. Kazemi, F.; Beecham, S.; Gibbs, J. Streetscale bioretention basins in Melbourne and their effect on local biodiversity. Ecol. Eng. 2009, 35, 1454–1465. [Google Scholar] [CrossRef]
  76. Kazemi, F.; Beecham, S.; Gibbs, J. Streetscape biodiversity and the role of bioretention swales in an Australian urban environment. Landsc. Urban Plan. 2011, 101, 139–148. [Google Scholar] [CrossRef]
  77. Read, J.; Wevill, T.; Fletcher, T.; Deletic, A. Variation among plant species in pollutant removal from stormwater in biofiltration systems. Water Res. 2008, 42, 893–902. [Google Scholar] [CrossRef]
  78. Zhang, Z.; Rengel, Z.; Liaghati, T.; Antoniette, T.; Meney, K. Influence of plant species and submerged zone with carbon addition on nutrient removal in stormwater biofilter. Ecol. Eng. 2011, 37, 1833–1841. [Google Scholar] [CrossRef]
  79. Pop, P.I.; Dîrja, M.; Dumitraş, A. Outdoor experimental mesocosm construction for the evaluation of bioretention in Cluj-Napoca condition. Bull. Univ. Agric. Sci. Vet. 2012, 69, 529–530. [Google Scholar]
  80. Lucas, W.C.; Greenway, M. Hydraulic response and nitrogen retention in bioretention mesocosms with regulated outlets: Part I, hydraulic response. Water Environ. Res. 2011, 83, 692–702. [Google Scholar]
  81. Lucas, W.; Greenway, M. Phosphorus retention by bioretention mesocosms using media formulated for phosphorus sorption: Response to accelerated loads. J. Irrig. Drain. Eng. 2011, 137, 144–153. [Google Scholar] [CrossRef]
  82. Lucas, W.C.; Greenway, M. Nutrient retention in vegetated and nonvegetated Bioretention mesocosms. J. Irrig. Drain. Eng. 2008, 134, 613–623. [Google Scholar] [CrossRef]
  83. Stander, E.; Borst, M. Hydraulic test of a bioretention media carbon amendment. J. Hydrol. Eng. 2010, 15, 531–536. [Google Scholar] [CrossRef]
  84. O’Neill, S.; Davis, A. Water treatment residual as a Bioretention amendment for phosphorus. II: Long-term column studies. J. Environ. Eng. 2012, 138, 328–336. [Google Scholar]
  85. O’Neill, S.; Davis, A. Water treatment residual as a Bioretention amendment for phosphorus. I: Evaluation studies. J. Environ. Eng. 2012, 138, 318–327. [Google Scholar] [CrossRef]
  86. Palmer, E.T.; Poor, C.J.; Hinman, C.; Stark, J.D. Nitrate and phosphate removal through enhanced Bioretention media: Mesocosm study. Water Environ. Res. 2013, 85, 823–832. [Google Scholar] [CrossRef]
  87. Henderson, C.F.K. The Chemical and Biological Mechanisms of Nutrient Removal from Stormwater in Bioretention Systems. Ph.D. Thesis.
  88. Brown, R.; Birgand, F.; Hunt, W. Analysis of consecutive events for nutrient and sediment treatment in field-monitored Bioretention cells. Water Air Soil Pollut. 2013, 224, 1–14. [Google Scholar]
  89. Paus, K.H.; Morgan, J.; Gulliver, J.S.; Leiknes, T.; Hozalski, R.M. Assessment of the hydraulic and toxic metal removal capacities of Bioretention cells after 2 to 8 years of service. Water Air Soil Pollut. 2013, 225, 1–12. [Google Scholar]
  90. Lloyd, S.; Wong, T. Paired catchment storm event monitoring: Assessing the performance of a bioretention system (rain garden). Aust. J. Water Resour. 2008, 12, 133–141. [Google Scholar]
  91. Line, D.E.; Hunt, W.F. Performance of a Bioretention area and a level spreader-grass filter strip at two highway sites in North Carolina. J. Irrig. Drain. Eng. 2009, 135, 217–224. [Google Scholar] [CrossRef]
  92. Yang, H.; Dick, W.A.; McCoy, E.L.; Phelan, P.L.; Grewal, P.S. Field evaluation of a new biphasic rain garden for stormwater flow management and pollutant removal. Ecol. Eng. 2013, 54, 22–31. [Google Scholar] [CrossRef]
  93. Montalto, F.; Lucas, B. How Are Low Impact Stormwater Control Measures Simulated by Different Computational Models? In Proceedings of the World Environmental and Water Resources Congress 2011, Palm Springs, CA, USA, 22–26 May 2011; pp. 538–546.
  94. Elliott, A.H.; Trowsdale, S.A. A review of models for low impact urban stormwater drainage. Environ. Model. Softw. 2007, 22, 394–405. [Google Scholar] [CrossRef]
  95. Huber, W.C.; Dickinson, R.E.; Rosener, L.A.; Aldrich, J.A. Stormwater Management Model User’s Manual, Version 4. U.S.; Environmental Protection Agency: Athens, GA, USA, 1988. [Google Scholar]
  96. Rossman, L.A. Storm Water Management Model User’s Manual, Version 5.0. U.S.; Environmental Protection Agency: Cincinatti, OH, USA, 2004. [Google Scholar]
  97. Bosley, E.K. Hydrologic Evaluation of Low Impact Development Using a Continuous, Spatially-Distributed Model. Master’s Thesis, Virginia Polytechnic Institute and State University, Blacksburg, VA, USA, 2008. [Google Scholar]
  98. Gironas, J.; Roesner, L.; Rossman, L.A.; Davis, J. A new applications manual for the Storm Water Management Model (SWMM). Environ. Model. Softw. 2010, 25, 813–814. [Google Scholar] [CrossRef]
  99. Heasom, W.; Traver, R.G.; Welker, A. Hydrologic modeling of a bioinfiltration best management practice. J. Am. Water Resour. Assoc. 2006, 42, 1329–1347. [Google Scholar] [CrossRef]
  100. U.S. Army Corps of Engineers Hydrologic Modeling System. Version 4.0.. Available online: http://www.hec.usace.army.mil/software/hec-hms/index.html (accessed on 14 April 2014).
  101. HydroCAD Stormwater Modeling. Available online: http://www.hydrocad.net/ (accessed on 13 April 2014).
  102. Skaggs, R.W. DRAINMOD: A Simulation Model for Shallow Water Table Soils. In Proceedings of the South Carolina Water Resources Conference, Charleston, SC, USA, 14–15 October 2008.
  103. Brown, R.A.; Skaggs, R.W.; Hunt, W.F. Calibration and validation of DRAINMOD to model bioretention hydrology. J. Hydrol. 2013, 486, 430–442. [Google Scholar] [CrossRef]
  104. Bechtold, I.; Köhne, S.; Youssef, M.A.; Lennartz, B.; Skaggs, R.W. Simulating nitrogen leaching and turnover in a subsurface-drained grassland receiving animal manure in Northern Germany using DRAINMOD-N II. Agric. Water Manag. 2007, 93, 30–44. [Google Scholar] [CrossRef]
  105. Youssef, M.A.; Skaggs, R.W.; Chescheir, G.M.; Gilliam, J.W. The nitrogen simulation model, DRAINMOD−N II. Trans. ASAE 2005, 48, 611–626. [Google Scholar] [CrossRef]
  106. Pitt, R.; Voorhees, J. The Use of WinSLAMM to Evaluate the Benefits of Low Impact Development. In Proceedings of the Low Impact Development Conference: Putting the LID on SWM, College Park, MD, USA, 14 April 2004.
  107. Alexander, M.; Barfield, B.; Hayes, J.; Harp, S.; Chalavadi, M.; Yeri, S.; Stevens, E.; Bates, B. Modeling Low Impact Development Water Quality BMPs with IDEAL. In Proceedings of the World Environmental and Water Resources Congress 2011, Palm Springs, CA, USA, 22–26 May 2011; pp. 547–557.
  108. Beyerlein, D. Low Impact Development Computations—WWHM. In Proceedings of the World Environmental and Water Resources Congress 2011, Palm Springs, CA, USA, 22–26 May 2011; pp. 558–576.
  109. Masi, M.D. A SWMM-5 Model Of A Denitrifying Bioretention System To Estimate Nitrogen Removal From Stormwater Runoff. Master’s Thesis, University of South Florida, Tampa, FL, USA, 2 November 2011. [Google Scholar]
  110. Neilson, I.B.; Turney, D. Green Infrastructure Optimization Analyses for Combined Sewer Overflow (CSO) Control; Scott, S., Keith, H.L., Eds.; American Society of Civil Engineers: Reston, Virginia, USA, 2010; p. 132. [Google Scholar]
  111. Wang, R.; Eckelman, M.J.; Zimmerman, J.B. Consequential environmental and economic life cycle assessment of green and gray stormwater infrastructures for combined sewer systems. Environ. Sci. Technol. 2013, 47, 11189–11198. [Google Scholar] [CrossRef]
  112. Aad, M.P.A.; Suidan, M.T.; Shuster, W.D. Modeling techniques of best management practices: Rain barrels and rain gardens using EPA SWMM-5. J. Hydrol. Eng. 2010, 15, 434–443. [Google Scholar] [CrossRef]
  113. Storm Water Management Model (SWMM) Version 5.1.003 with Low Impact Development (LID) Controls. Available online: http://www.epa.gov/nrmrl/wswrd/wq/models/swmm/ (accessed on 13 April 2014).
  114. Jacobson, C.R. Identification and quantification of the hydrological impacts of imperviousness in urban catchments: A review. J. Environ. Manag. 2011, 92, 1438–1448. [Google Scholar] [CrossRef]
  115. Scharffenberg, W.A. Hydrologic Modeling System HEC-HMS, User’s Manual; US Army Corps of Engineers, Institute for Water Resources: Ft. Belvoir, VA, USA, 2013. [Google Scholar]
  116. Giacomoni, M.; Zechman, E.; Brumbelow, K. Hydrologic footprint residence: Environmentally friendly criteria for best management practices. J. Hydrol. Eng. 2012, 17, 99–108. [Google Scholar] [CrossRef]
  117. He, Z.; Davis, A.P. Process modeling of storm-water flow in a Bioretention cell. J. Irrig. Drain. Eng. 2011, 137, 121–131. [Google Scholar] [CrossRef]
  118. Atchison, D.; Severson, L. Recarga User’s Manual, Version 2.3. University of Wisconsin—Madison; Civil and Environmental Engineering Department, Water Resource Group: Madison, WI, USA, 2004. [Google Scholar]
  119. Wisconsin Department of Natural Resources. Bioretention for Infiltration (1004); Wisconsin Department of Natural Resources: Madison, Wisconsin, USA, 2010; p. 14. [Google Scholar]
  120. Wisconsin Department of Natural Resources RECARGA Model. Available online: http://dnr.wi.gov/topic/stormwater/standards/recarga.html (accessed on 14 April 2014).
  121. Carpenter, D.D.; Hallam, L. Influence of planting soil mix characteristics on Bioretention cell design and performance. J. Hydrol. Eng. 2010, 15, 404–416. [Google Scholar] [CrossRef]
  122. Turney, I.D.; Neilson, B. Ultra Urban Green Street Design Criteria. In Low Impact Development, Redefining Water in the City, 2010; Scott, S., Keith, H.L., Eds.; American Society of Civil Engineers: Reston, Virginia, USA, 2010; p. 57. [Google Scholar]
  123. Soil & Water Management Group NCSU BAE Dept. DRAINMOD. Available online: http://www.bae.ncsu.edu/soil_water/drainmod/index.html (accessed on April 13, 2014).
  124. PV & Associates. WinSLAMM Version 10 runoff volume, total suspended solids and other pollutant calculations and regional calibration files. Available online: http://www.winslamm.com/docs/Small%20Storm%20Hydrology%20and%20WinSLAMM.pdf (accessed on 14 April 2014).
  125. Talebi, L.; Pitt, R. Roof Runoff Harvesting Benefits for Regional Conditions in Low Density and Medium Density Residential Areas. In Proceedings of the World Environmental and Water Resources Congress, Albuquerque, NM, USA, 20–24 May 2012; pp. 3724–3731.
  126. PV & Associates. WinSLAMM. Available online: http://winslamm.com (accessed on 13 April 2014).
  127. Hayes, J.; Barfield, B.; Harp, S.; Chalavadi, M.; Stevens, E.; Alexander, M.; Bates, B. Modeling LID Treatment Train Impacts on Runoff, Sediment, and Water Quality in U.S. Urban Areas Using IDEAL: Part 2—Model Application to Example US Cities. In Proceedings of the World Environmental and Water Resources Congress 2008, Honolulu, HI, USA, 12–16 May 2008; pp. 1–10.
  128. StormOPS. Stormwater Quality Modeling Software. Available online: https://www.stormopssoftware.com/ (accessed on 13 April 2014).
  129. Clear Creek Solutions. Western Washington Hydrology Model 2012 User Manual. Washington. Available online: http://www.clearcreeksolutions.info/ftp/public/downloads/WWHM2012/WWHM2012%20User%20Manual.pdf (accessed on 13 April 2014).
  130. State of Washington Department of Ecology: Western Washington Continuous Simulation Hydrology Model (WWHM). Available online: http://www.ecy.wa.gov/PROgrams/wq/stormwater/wwhmtraining (accessed on 13 April 2014).
  131. Montgomery, R.; Gaffield, S.; Sigmarrson, S.; Severson, L.; Lefers, J. The Challenges of Mitigating Hydrologic Impacts of Development: Lessons Learned in Dane County, Wisconsin. In Watershed Management 2010; American Society of Civil Engineers: Reston, VA, USA, 2010; pp. 807–816. [Google Scholar]
  132. Kadlec, R.H.; Hammer, D.E. Modeling nutrient behavior in wetlands. Ecol. Model. 1988, 40, 37–66. [Google Scholar] [CrossRef]
  133. Senzia, M.A.; Mayo, A.W.; Mbwette, T.S.A.; Katima, J.H.Y.; Jørgensen, S.E. Modelling nitrogen transformation and removal in primary facultative ponds. Ecol. Model. 2002, 154, 207–215. [Google Scholar] [CrossRef]
  134. Langergraber, G.; Giraldi, D.; Mena, J.; Meyer, D.; Peña, M.; Toscano, A.; Brovelli, A.; Korkusuz, E.A. Recent developments in numerical modelling of subsurface flow constructed wetlands. Sci. Total Environ. 2009, 407, 3931–3943. [Google Scholar] [CrossRef]
  135. Luell, S.K.; Hunt, W.F.; Winston, R.J. Evaluation of undersized bioretention stormwater control measures for treatment of highway bridge deck runoff. Water Sci. Technol. 2011, 64, 974–979. [Google Scholar] [CrossRef]
  136. Asleson, B.C.; Nestingen, R.S.; Gulliver, J.S.; Hozalski, R.M.; Nieber, J.L. Performance assessment of rain gardens. J. Am. Water Resour. Assoc. 2009, 45, 1019–1031. [Google Scholar] [CrossRef]
  137. Lee, J.G.; Selvakumar, A.; Alvi, K.; Riverson, J.; Zhen, J.X.; Shoemaker, L.; Lai, F.-H. A watershed-scale design optimization model for stormwater best management practices. Environ. Model. Softw. 2012, 37, 6–18. [Google Scholar] [CrossRef]
  138. Herrera Environmental Consultants. Technical Memorandum: Puget Sound Stormwater BMP Cost Database; Washington State Department of Ecology Environmental Assessment Program: Olympia, WA, USA, 2011; p. 30. [Google Scholar]
  139. Wossink, A.; Hunt, B. The Economics of Structural Stormwater BMPs in North Carolina; North Carolina State University Water Resources Research Institute: Raleigh, NC, USA, 2003; p. 53. [Google Scholar]
  140. Houdeshel, C.D.; Pomeroy, C.A.; Hair, L.; Moeller, J. Cost-estimating tools for low-impact development Best Management Practices: Challenges, limitations, and implications. J. Irrig. Drain. Eng. 2011, 137, 183–189. [Google Scholar] [CrossRef]
  141. RS Means. Square Foot Costs, 34th ed.; RS Means: Norwell, MA, USA, 2013. [Google Scholar]
  142. Houle, J.; Roseen, R.; Ballestero, T.; Puls, T.; Sherrard, J. Comparison of Maintenance Cost, Labor Demands, and System Performance for LID and Conventional Stormwater Management. J. Environ. Eng. 2013, 139, 932–938. [Google Scholar] [CrossRef]
  143. Sample, D.; Heaney, J.; Wright, L.; Fan, C.; Lai, F.; Field, R. Costs of best management practices and associated land for urban stormwater control. J. Water Resour. Plan. Manag. 2002, 129, 59–68. [Google Scholar]
  144. Thurston, H.W. Opportunity costs of residential best management practices for stormwater runoff control. J. Water Resour. Plan. Manag. 2006, 132, 89–96. [Google Scholar] [CrossRef]
  145. Roy, A.; Wenger, S.; Fletcher, T.; Walsh, C.; Ladson, A.; Shuster, W.; Thurston, H.; Brown, R. Impediments and solutions to sustainable, watershed-scale urban stormwater management: Lessons from Australia and the United States. Environ. Manag. 2008, 42, 344–359. [Google Scholar] [CrossRef]
  146. Flynn, K.M.; Traver, R.G. Green infrastructure life cycle assessment: A bio-infiltration case study. Ecol. Eng. 2013, 55, 9–22. [Google Scholar] [CrossRef]
  147. Taylor, A.; Fletcher, T. Estimating life cycle costs of stormwater treatment measures. Aust. J. Water Resour. 2007, 11, 79–92. [Google Scholar]
  148. Virginia Department of Environmental Quality. Virginia DEQ Stormwater Design Spec. No. 9, Bioretention. Version 1.9. Available online: http://vwrrc.vt.edu/swc/NonPBMPSpecsMarch11/VASWMBMPSpec9BIORETENTION.html (accessed on 13 April 2014).
  149. Herrera Environmental Consultants. Pollutant Export from Bioretention Soil Mix, 185th Avenunue, Redmond, Washington; Washington State Department of Ecology: Olympia, WA, USA, 2012; p. 226. [Google Scholar]

