Global Changes and Drivers of the Water Footprint of Food Consumption: A Historical Analysis

Abstract
:1. Introduction
2. Materials and Methods
2.1. Water Footprint

2.2. Water Footprint of Consumption
- a)
- b)
- Data on food consumption, production, trade and crop yield (period 1961–2009) from FAO [30];
- c)
2.3. Decomposition Analysis

2.4. Water Savings through Trade


3. Results and Discussion
3.1. Global Changes in Food Supply and WFcons for Food


3.2. Contributions of Population, Diet and Agricultural Practices to Changes in WFcons

| Regions | WFcons 2007 | 1963–1985 | 1985–2007 | 1963–2007 | |||||||||
|---|---|---|---|---|---|---|---|---|---|---|---|---|---|
| ∆p | ∆d | ∆ap | ∆tot | ∆p | ∆d | ∆ap | ∆tot | ∆p | ∆d | ∆ap | ∆tot | ||
| World | 6954 | 1982 | 671 | −1494 | 1158 | 1935 | 1041 | −1405 | 1571 | 3969 | 1629 | −2868 | 2730 |
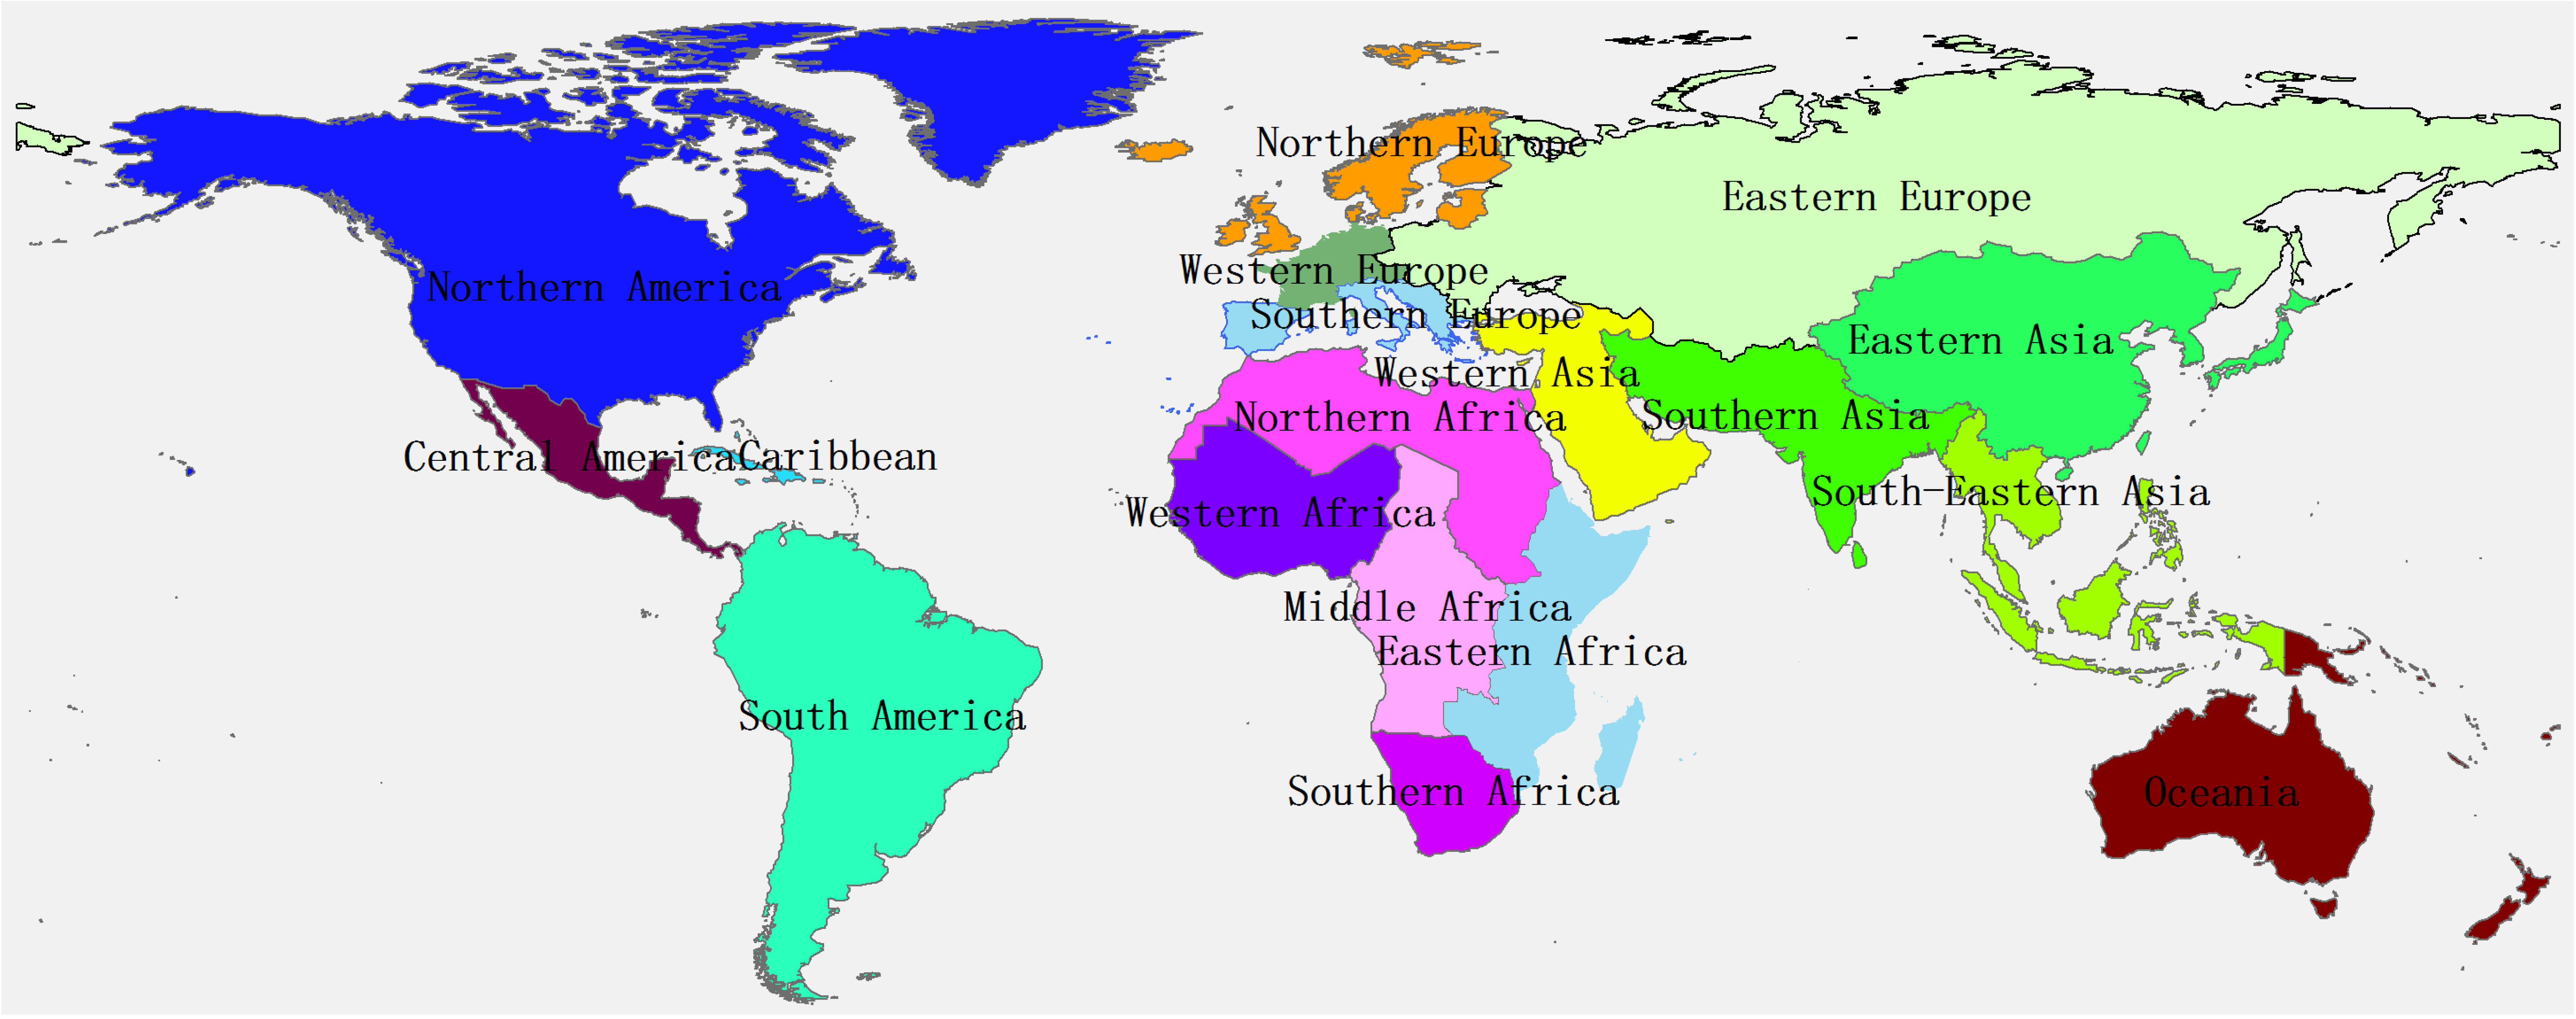
| Eastern Africa | 283 | 91 | −5 | −32 | 54 | 132 | 8 | −32 | 109 | 230 | 2 | −69 | 163 |
| Middle Africa | 120 | 31 | 4 | −6 | 28 | 58 | 8 | −15 | 52 | 89 | 12 | −21 | 79 |
| Northern Africa | 332 | 75 | 43 | −31 | 87 | 105 | 40 | 9 | 154 | 185 | 92 | −36 | 241 |
| Southern Africa | 54 | 23 | 0 | −4 | 19 | 21 | 5 | −22 | 4 | 40 | 3 | −21 | 23 |
| Western Africa | 370 | 82 | 29 | −48 | 63 | 149 | 78 | −39 | 188 | 247 | 133 | −128 | 251 |
| Northern America | 579 | 109 | 24 | −79 | 53 | 124 | 48 | −106 | 65 | 232 | 73 | −187 | 118 |
| Central America | 195 | 66 | 38 | −47 | 57 | 64 | 23 | −36 | 51 | 126 | 61 | −80 | 107 |
| Caribbean | 50 | 12 | 6 | −6 | 12 | 11 | 0 | −1 | 10 | 23 | 7 | −7 | 23 |
| South America | 552 | 165 | 23 | −59 | 129 | 161 | 115 | −114 | 162 | 330 | 124 | −164 | 290 |
| Eastern Asia | 1453 | 327 | 745 | −904 | 167 | 230 | 616 | −285 | 561 | 602 | 1445 | −1319 | 728 |
| Southern Asia | 1428 | 503 | 317 | −563 | 257 | 534 | 178 | −395 | 317 | 1029 | 548 | −1004 | 573 |
| South-Eastern Asia | 539 | 178 | 74 | −125 | 128 | 166 | 178 | −214 | 129 | 338 | 223 | −305 | 257 |
| Western Asia | 249 | 85 | 26 | −45 | 65 | 113 | 8 | −43 | 78 | 194 | 38 | −88 | 144 |
| Eastern Europe | 514 | 122 | 96 | −160 | 58 | 9 | −58 | −93 | −142 | 115 | 37 | −236 | −83 |
| Northern Europe | 96 | 6 | 0 | −17 | −10 | 8 | 13 | −9 | 12 | 15 | 14 | −27 | 2 |
| Southern Europe | 245 | 31 | 67 | −59 | 39 | 19 | 29 | −30 | 18 | 50 | 92 | −84 | 57 |
| Western Europe | 226 | 23 | 48 | −92 | −21 | 20 | −6 | −28 | −13 | 43 | 41 | −119 | −34 |
| Oceania | 59 | 18 | −2 | −6 | 10 | 18 | 0 | −10 | 9 | 35 | −2 | −15 | 19 |
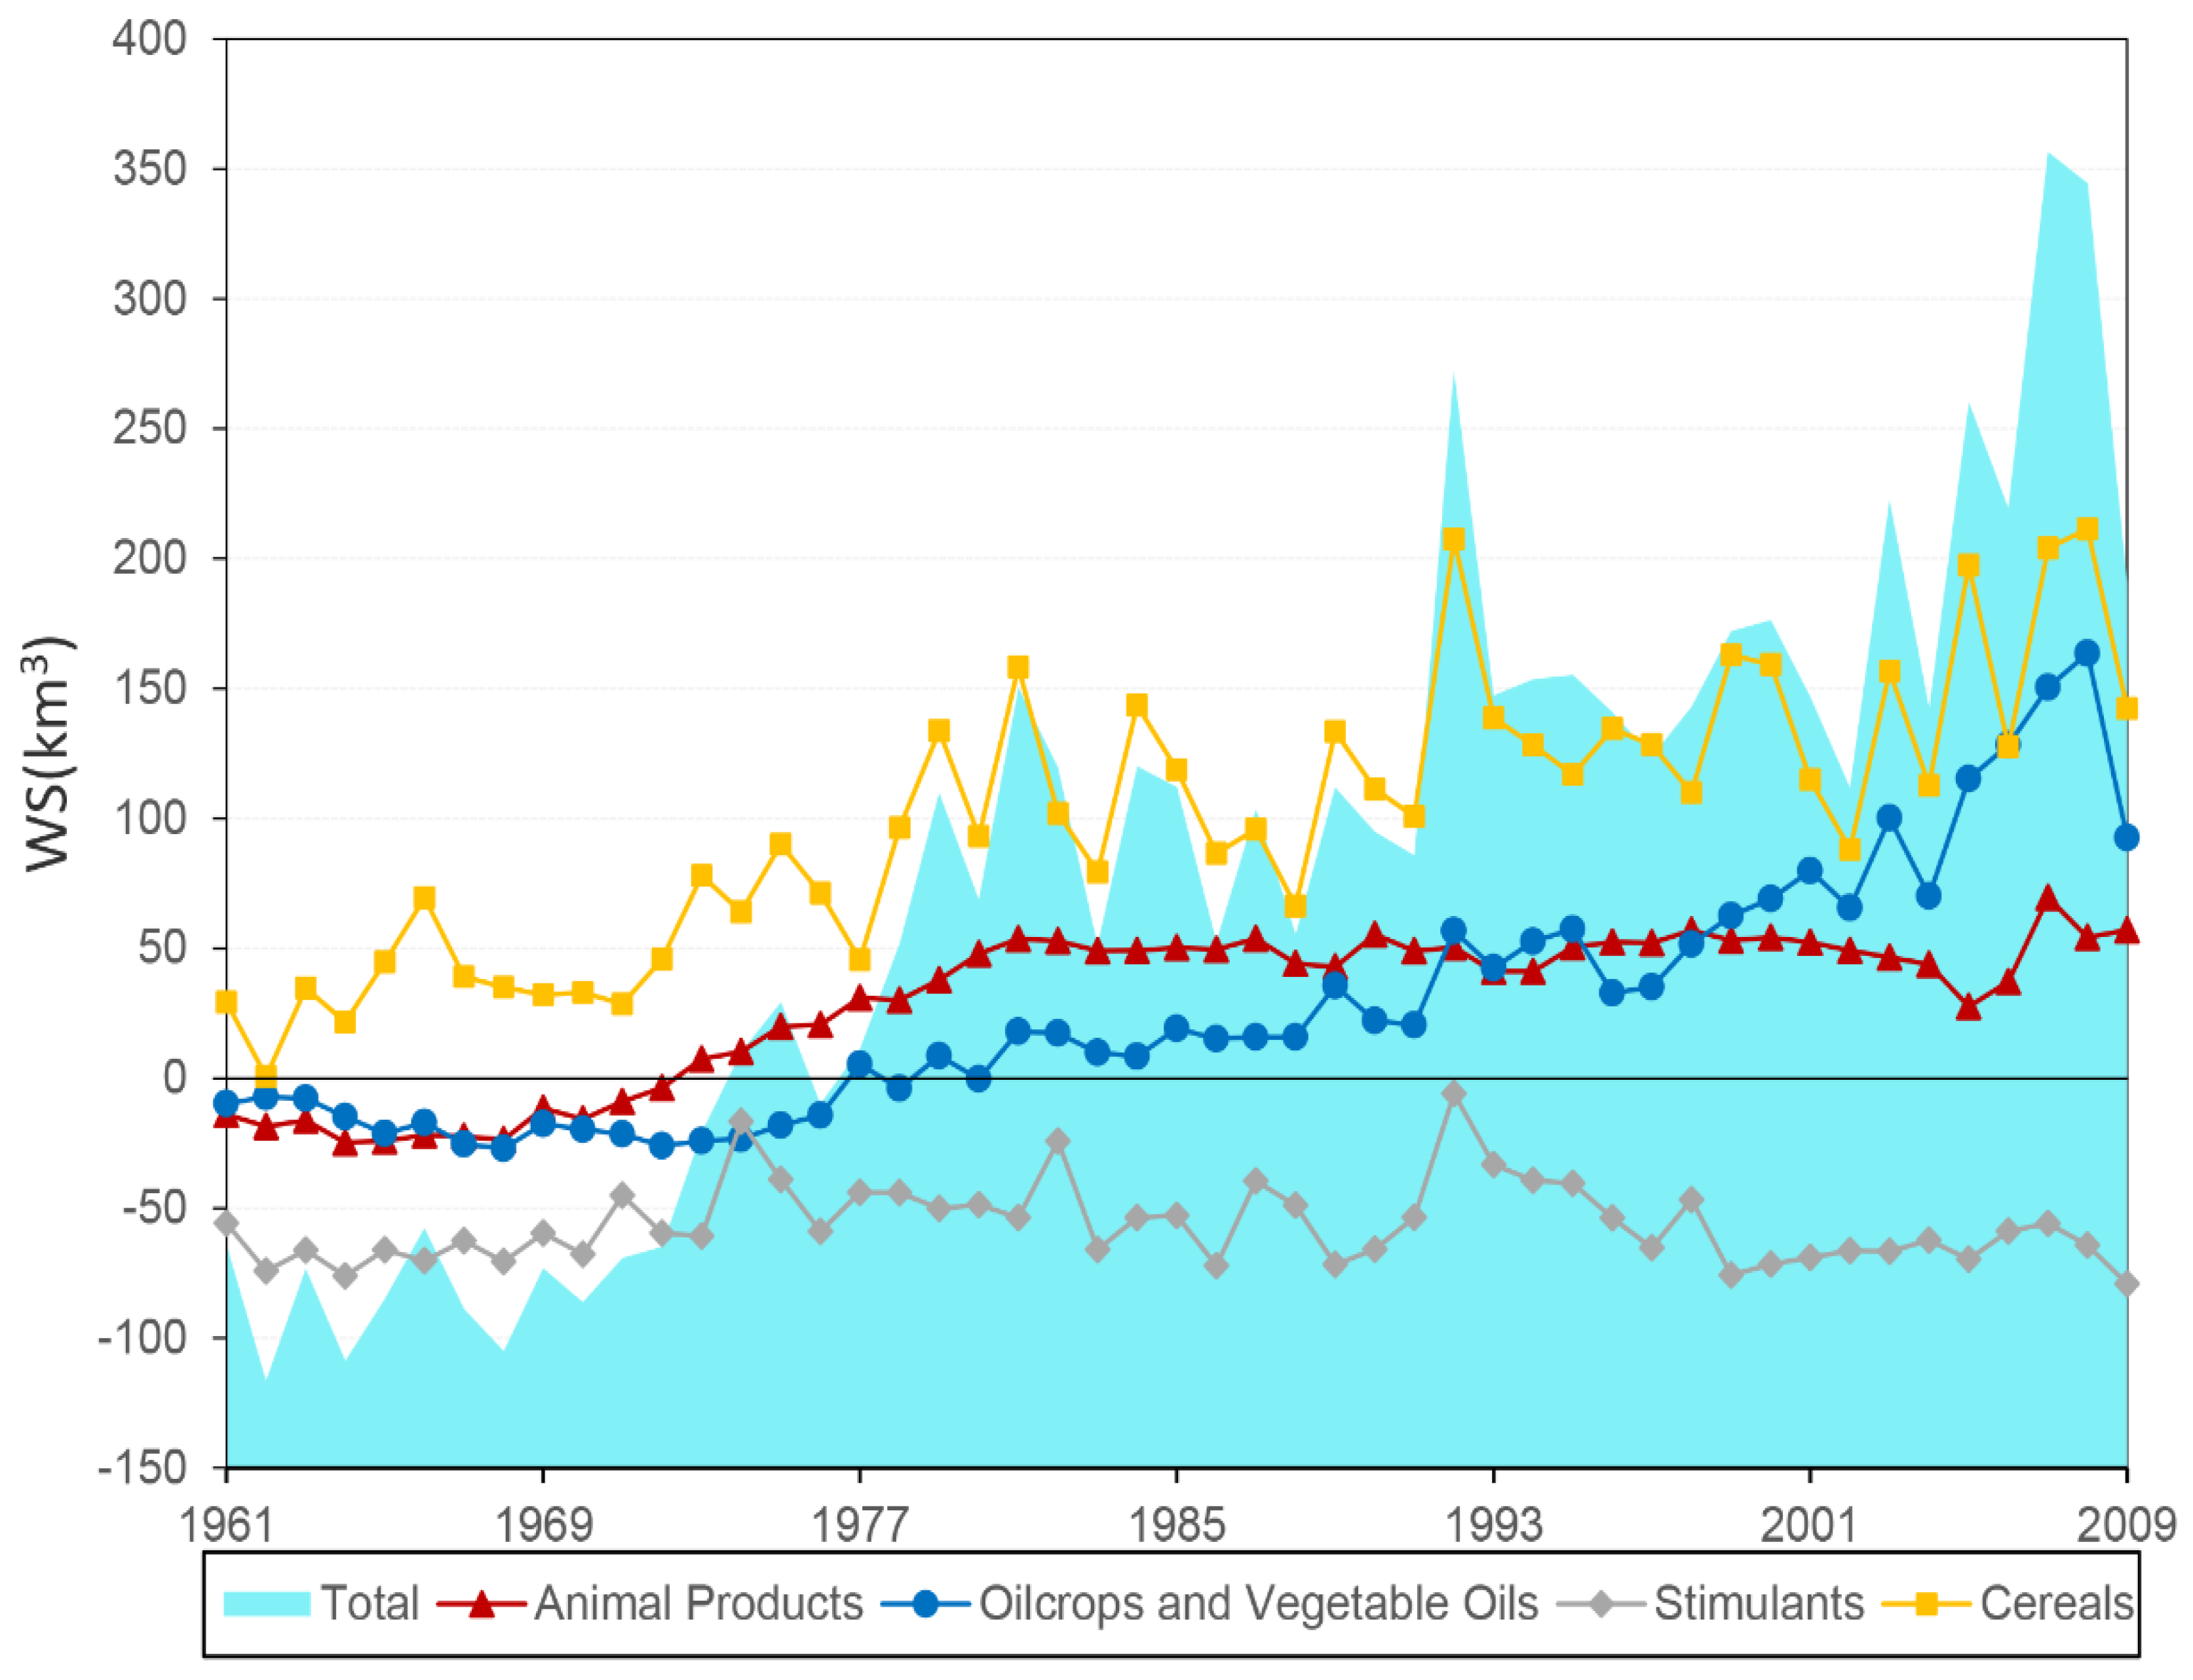
3.3. Global Water Savings through Trade over Time

3.4. Discussion
3.5. Limitations and Uncertainties
4. Conclusions
Acknowledgments
Author Contributions
Conflicts of Interest
References
- Oki, T.; Kanae, S. Global hydrological cycles and world water resources. Science 2006, 313, 1068–1072. [Google Scholar] [CrossRef]
- Suweis, S.; Rinaldo, A.; Maritan, A.; D’Odorico, P. Water-controlled wealth of nations. Proc. Natl. Acad. Sci. USA 2013, 110, 4230–4233. [Google Scholar]
- Tilman, D.; Balzer, C.; Hill, J.; Befort, B.L. Global food demand and the sustainable intensification of agriculture. Proc. Natl. Acad. Sci. USA 2011, 108, 20260–20264. [Google Scholar] [CrossRef]
- Barrett, C.B. Measuring food insecurity. Science 2010, 327, 825–828. [Google Scholar] [CrossRef]
- Gebbers, R.; Adamchuk, V.I. Precision agriculture and food security. Science 2010, 327, 828–831. [Google Scholar] [CrossRef]
- Ehrlich, P.R.; Kareiva, P.M.; Daily, G.C. Securing natural capital and expanding equity to rescale civilization. Nature 2012, 486, 68–73. [Google Scholar] [CrossRef]
- Lee, R. The outlook for population growth. Science 2011, 333, 569–573. [Google Scholar] [CrossRef]
- Kearney, J. Food consumption trends and drivers. Philos. Trans. R. Soc. Lond. Ser. B Biol. Sci. 2010, 365, 2793–2807. [Google Scholar] [CrossRef]
- Mekonnen, M.M.; Hoekstra, A.Y. A global assessment of the water footprint of farm animal products. Ecosystems 2012, 15, 401–415. [Google Scholar] [CrossRef]
- Rockström, J.; Lannerstad, M.; Falkenmark, M. Assessing the water challenge of a new green revolution in developing countries. Proc. Natl. Acad. Sci. USA 2007, 104, 6253–6260. [Google Scholar] [CrossRef]
- Frija, A.; Chebil, A.; Speelman, S.; Buysse, J.; Van Huylenbroeck, G. Water use and technical efficiencies in horticultural greenhouses in tunisia. Agr. Water Manag. 2009, 96, 1509–1516. [Google Scholar] [CrossRef]
- Speelman, S.; D’Haese, M.; Buysse, J.; D’Haese, L. A measure for the efficiency of water use and its determinants, a case study of small-scale irrigation schemes in north-west province, south africa. Agr. Syst. 2008, 98, 31–39. [Google Scholar] [CrossRef]
- Brauman, K.A.; Siebert, S.; Foley, J.A. Improvements in crop water productivity increase water sustainability and food security—A global analysis. Environ. Res. Lett. 2013, 8. [Google Scholar] [CrossRef]
- Wang, X.-Y. Irrigation water use efficiency of farmers and its determinants: Evidence from a survey in northwestern china. Agric. Sci. China 2010, 9, 1326–1337. [Google Scholar] [CrossRef]
- Chapagain, A.; Hoekstra, A.; Savenije, H. Water saving through international trade of agricultural products. Hydrol. Earth Syst. Sci. 2006, 10, 455–468. [Google Scholar] [CrossRef]
- Dalin, C.; Konar, M.; Hanasaki, N.; Rinaldo, A.; Rodriguez-Iturbe, I. Evolution of the global virtual water trade network. Proc. Natl. Acad. Sci. USA 2012, 109. [Google Scholar] [CrossRef]
- Mekonnen, M.M.; Hoekstra, A.Y. The green, blue and grey water footprint of crops and derived crop products. Hydrol. Earth Syst. Sci. 2011, 15, 1577–1600. [Google Scholar] [CrossRef]
- Kanakoudis, V.; Tsitsifli, S.; Papadopoulou, A. Integrating the carbon and water footprints’ costs in the water framework directive 2000/60/ec full water cost recovery concept: Basic principles towards their reliable calculation and socially just allocation. Water 2012, 4, 45–62. [Google Scholar] [CrossRef]
- Vanham, D.; Bidoglio, G. A review on the indicator water footprint for the EU28. Ecol. Indic. 2013, 26, 61–75. [Google Scholar] [CrossRef]
- Liu, J.; Savenije, H.H. Food consumption patterns and their effect on water requirement in china. Hydrol. Earth Syst. Sci. Discuss. 2008, 12, 887–898. [Google Scholar] [CrossRef]
- Falkenmark, M.; Rockstrom, J.; Karlberg, L. Present and future water requirements for feeding humanity. Food Secur. 2009, 1, 59–69. [Google Scholar] [CrossRef]
- Vanham, D.; Mekonnen, M.; Hoekstra, A. The water footprint of the eu for different diets. Ecol. Indic. 2013, 32, 1–8. [Google Scholar] [CrossRef]
- Vanham, D.; Hoekstra, A.; Bidoglio, G. Potential water saving through changes in european diets. Environ. Int. 2013, 61, 45–56. [Google Scholar] [CrossRef]
- Vanham, D.; Bidoglio, G. The water footprint of milan. Water Sci. Technol. 2013, 69, 789–795. [Google Scholar] [CrossRef]
- Vanham, D. The water footprint of austria for different diets. Water Sci. Technol. 2013, 67, 824–830. [Google Scholar]
- Kastner, T.; Rivas, M.J.I.; Koch, W.; Nonhebel, S. Global changes in diets and the consequences for land requirements for food. Proc. Natl. Acad. Sci. USA 2012, 109, 6868–6872. [Google Scholar] [CrossRef]
- Konar, M.; Dalin, C.; Suweis, S.; Hanasaki, N.; Rinaldo, A.; Rodriguez-Iturbe, I. Water for food: The global virtual water trade network. Water Resour. Res. 2011, 47. [Google Scholar] [CrossRef]
- Luan, Y.B.; Cui, X.F.; Ferrat, M.; Nath, R. Dynamics of arable land requirements for food in south africa: From 1961 to 2007. S. Afr. J. Sci. 2014, 110, 83–90. [Google Scholar]
- Aldaya, M.M.; Chapagain, A.K.; Hoekstra, A.Y.; Mekonnen, M.M. The Water Footprint Assessment Manual: Setting the Global Standard; Routledge: London, UK, 2012. [Google Scholar]
- Food and Agriculture Organization of the United Nations. FAOSTAT Database. Available online: http://faostat3.fao.org/faostat-gateway/go/to/home/E (accessed on 26 October 2013).
- Zhang, K.; Kimball, J.S.; Mu, Q.; Jones, L.A.; Goetz, S.J.; Running, S.W. Satellite based analysis of northern et trends and associated changes in the regional water balance from 1983 to 2005. J. Hydrol. 2009, 379, 92–110. [Google Scholar] [CrossRef]
- Zhang, K.; Kimball, J.S.; Nemani, R.R.; Running, S.W. A continuous satellite‐derived global record of land surface evapotranspiration from 1983 to 2006. Water Resour. Res. 2010, 46. [Google Scholar] [CrossRef]
- Mu, Q.; Zhao, M.; Running, S.W. Improvements to a modis global terrestrial evapotranspiration algorithm. Remote Sens. Environ. 2011, 115, 1781–1800. [Google Scholar]
- Siebert, S.; Döll, P.; Hoogeveen, J.; Faures, J.-M.; Frenken, K.; Feick, S. Development and validation of the global map of irrigation areas. Hydrol. Earth Syst. Sci. Discuss. 2005, 2, 535–547. [Google Scholar]
- Monfreda, C.; Ramankutty, N.; Foley, J.A. Farming the planet: 2. Geographic distribution of crop areas, yields, physiological types, and net primary production in the year 2000. Glob. Biogeochem. Cycles 2008, 22. [Google Scholar] [CrossRef]
- Ramankutty, N.; Evan, A.T.; Monfreda, C.; Foley, J.A. Farming the planet: 1. Geographic distribution of global agricultural lands in the year 2000. Glob. Biogeochem. Cycles 2008, 22. [Google Scholar] [CrossRef]
- Thornton, P.K. Livestock production: Recent trends, future prospects. Philos. Trans. R. Soc. B Biol. Sci. 2010, 365, 2853–2867. [Google Scholar] [CrossRef]
- Robinson, T.; Thornton, P.; Franceschini, G.; Kruska, R.; Chiozza, F.; Notenbaert, A.; Cecchi, G.; Herrero, M.; Epprecht, M.; Fritz, S. Global Livestock Production Systems; Food and Agriculture Organization of the United Nations (FAO): Rome, Italy, 2011. [Google Scholar]
- Gerbens-Leenes, P.W.; Nonhebel, S.; Krol, M.S. Food consumption patterns and economic growth. Increasing affluence and the use of natural resources. Appetite 2010, 55, 597–608. [Google Scholar] [CrossRef]
- United Nations. Composition of Macro Geographical (Continental) Regions, Geographical Sub-Regions, and Selected Economic and Other Groupings. Available online: http://unstats.un.org/unsd/methods/m49/m49regin.htm (accessed on 26 October 2013).
- Ang, B. The lmdi approach to decomposition analysis: A practical guide. Energ. Policy 2005, 33, 867–871. [Google Scholar] [CrossRef]
- Caballero, B. The Nutrition Transition: Diet and Disease in the Developing World; Academic Press: London, UK, 2002. [Google Scholar]
- Rockström, J.; Barron, J.; Fox, P. Water productivity in rain-fed agriculture: Challenges and opportunities for smallholder farmers in drought-prone tropical agroecosystems. In Water Productivity in Agriculture: Limits and Opportunities for Improvement; CABI: Cambridge, MA, USA, 2003; pp. 145–162. [Google Scholar]
- Pelletier, N.; Tyedmers, P. Forecasting potential global environmental costs of livestock production 2000–2050. Proc. Natl. Acad. Sci. USA 2010, 107, 18371–18374. [Google Scholar] [CrossRef]
- Steinfeld, H.; Gerber, P. Livestock production and the global environment: Consume less or produce better? Proc. Natl. Acad. Sci. USA 2010, 107, 18237–18238. [Google Scholar] [CrossRef]
- Conference Board and Groningen Growth and Development Centre. Total Economy Database. Available online: http://www.conference-board.org/data/economydatabase/ (accessed on 26 October 2013).
- Popkin, B.M. The nutrition transition and obesity in the developing world. J. Nutr. 2001, 131, 871S–873S. [Google Scholar]
- Popkin, B.M.; Gordon-Larsen, P. The nutrition transition: Worldwide obesity dynamics and their determinants. Int. J. Obes. 2004, 28, S2–S9. [Google Scholar] [CrossRef]
- Godfray, H.C.J.; Garnett, T. Food security and sustainable intensification. Philos. Trans. R. Soc. B Biol. Sci. 2014, 369. [Google Scholar] [CrossRef]
- Jacobs, K.; Sumner, D.A. The Food Balance Sheets of the Food and Agriculture Organization: A Review of Potential Ways to Broaden the Appropriate Uses of the Data; Food and Agriculture Organization: Rome, Italy, 2002. [Google Scholar]
- Smil, V. Feeding the World: A Challenge for the Twenty-First Century; MIT Press: Cambridge, USA, 2001. [Google Scholar]
- Gustavsson, J.; Cederberg, C.; Sonesson, U.; van Otterdijk, R.; Meybeck, A. Global Food Losses and Food Waste; Food and Agriculture Organization of the United Nations: Rome, Italy, 2011. [Google Scholar]
© 2014 by the authors; licensee MDPI, Basel, Switzerland. This article is an open access article distributed under the terms and conditions of the Creative Commons Attribution license (http://creativecommons.org/licenses/by/3.0/).
Share and Cite
Yang, C.; Cui, X. Global Changes and Drivers of the Water Footprint of Food Consumption: A Historical Analysis. Water 2014, 6, 1435-1452. https://doi.org/10.3390/w6051435
Yang C, Cui X. Global Changes and Drivers of the Water Footprint of Food Consumption: A Historical Analysis. Water. 2014; 6(5):1435-1452. https://doi.org/10.3390/w6051435
Chicago/Turabian StyleYang, Chen, and Xuefeng Cui. 2014. "Global Changes and Drivers of the Water Footprint of Food Consumption: A Historical Analysis" Water 6, no. 5: 1435-1452. https://doi.org/10.3390/w6051435