1. Introduction
In current cities, households have a significant fraction of total water production [
1]. To control this situation, the Spanish Public Administration has run several campaigns to promote the responsible use of water, thanks to which the consumption in Spain has been reduced. Some of those awareness campaigns are:
The National Hydrological Plan (2005–2008): Plan AGUA (Actions for the Management and Usage of Water). The objective of this program was to reorient water policies towards ensuring the sustainability of use, in terms of quantity and quality, raising the efficiency in water use and minimizing the cost of supplying it, saving water resources amounting to 1,100,000 m
3 annually by fostering demand management, recycling water and encouraging efficiency in water consumption [
2];
The current National Plan for Water Quality (2007–2015) was created to accomplish the environmental objectives that were established in the Directive 91/271/EEC by 2015. This plan is focused on collecting, treating and discharging urban waste water [
3].
Although the previous campaigns have had good results, the reduction is not enough. For instance, the current policy from Melbourne [
4] expects a 40% reduction in water consumption per resident by 2020 from 2000 levels. Analyzing the data of
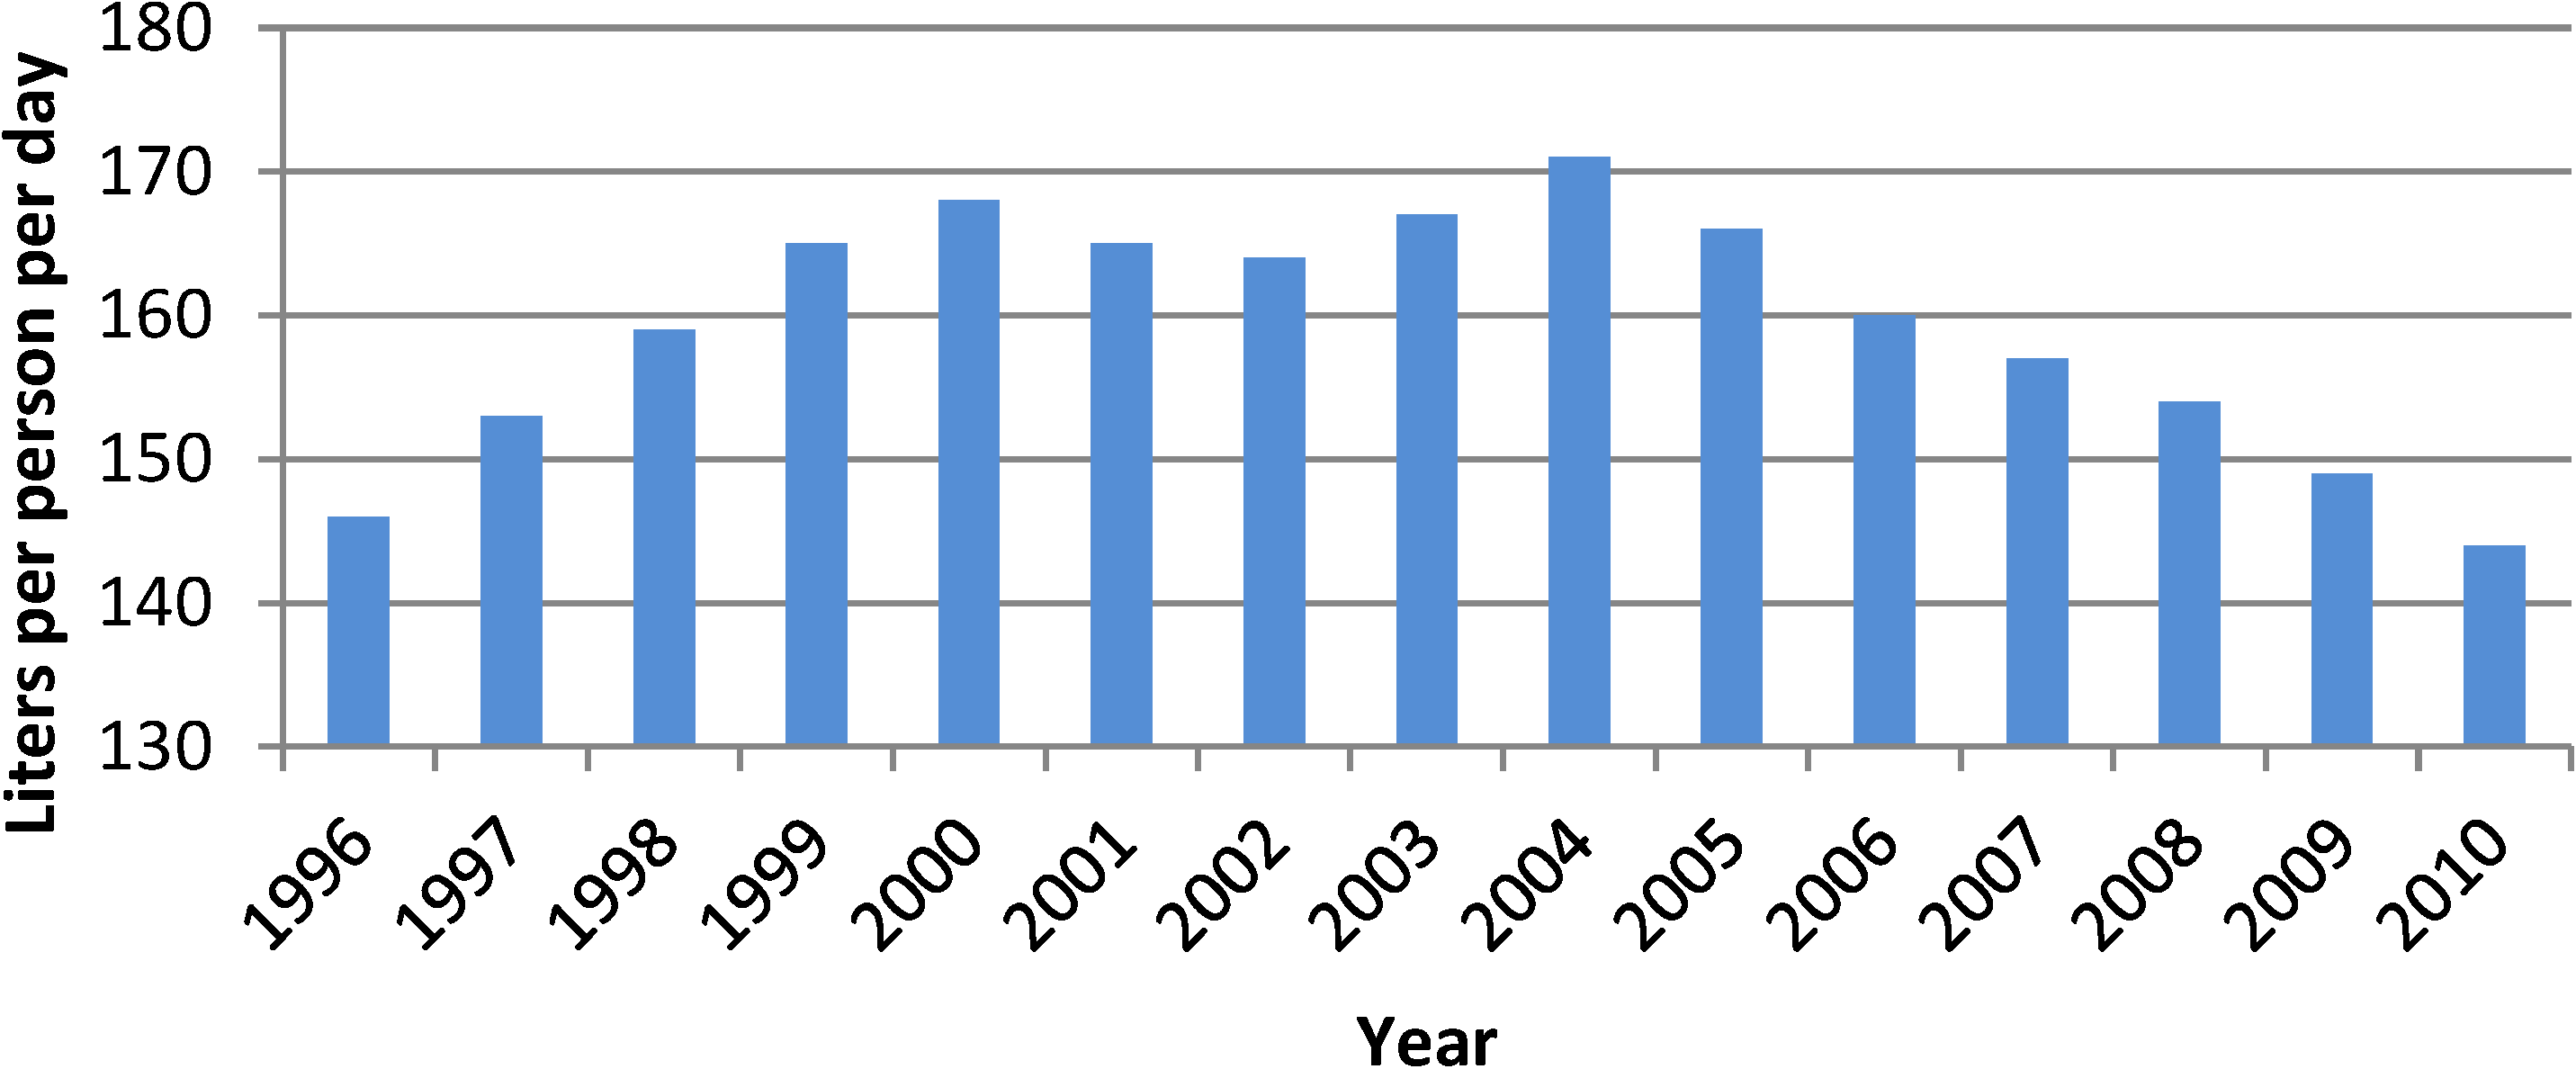
Figure 1, which shows the evolution of water consumption in Spain, the reduction reached from 2000 to 2010 was only 14%. The main problem is that customers do not know if they are making good use of this resource in full.
Figure 1.
Evolution of water consumption in residential buildings [
5].
Figure 1.
Evolution of water consumption in residential buildings [
5].
Water consumption can be divided into two different types of use: cold water and domestic hot water. It should be noticed that domestic hot water involves extra electricity consumption, which is important to be taken into account when using this resource, due to this consumption representing 18.9% of the final energy consumption of households [
6].
To give an example, Barata [
7] created a questionnaire survey that was answered by a sample of 236 residential customers. The results of the perceived consumption show that only 13% of respondents assent to answer when they were asked if they knew the amount of cubic meters they consume. Therefore, 87% of customers did not know their water consumption at home.
According to Walker [
8], water efficiency information should be personalized to the household and tied into the local company’s water efficiency strategy,
i.e., households should receive comparative consumption and meaningful information related to their individual use, e.g., a comparison with other local customers or similar households.
The aim of this paper is to propose a new way to improve the contents in water bills by adding a new water label that allows for checking the efficiency of water use. The water tag provides information to tenants about their efficiency of water consumption. In case of houses with a special meter to obtain the domestic hot water consumption, an extra water label can be shown with the evaluation of this kind of consumption. Furthermore, this information is compared to the average consumption value of citizens from the same province. To go further in citizens’ awareness about this subject, some recommendations should also be included, which will help to reduce water consumption.
This paper is organized into several sections. Firstly,
Section 2 presents the literature review related to this work.
Section 3 describes studies about Spanish housing water consumption, water use distribution, a survey together with collecting data and the reasons for incorporating a section with recommendations. After that, it describes the water labels and how they should be incorporated in the bill. Finally the paper finishes with the conclusion.
2. Literature Review
First of all, before starting to develop improvements in water bills, reviewing the existing system for pricing urban water is necessary.
The urban residential water pricing has some costs that are usually jointly funded by the State and the water company. These costs cover a substantial part of the investment costs, a substantial part of the opportunity costs and a part of the environmental costs. To cover those cost, water companies have three different methods [
9]:
A uniform rate (UR) price, where households pay a single volumetric marginal price at all levels of consumption;
Increasing block-rate (IBR), where higher marginal prices are charged for higher quantities consumed;
Decreasing block-rate (SBR), which are stacked in the opposite direction than the IBR case.
The un-allocatable character of much of the fixed costs implies that equal fees or discriminatory fees across customer classes can be similarly efficient. However, a large proportion of capital costs are caused by peak loads, with some infrastructure resting idle much of the time. This means that while a consumer of small amounts of water is less costly to serve in terms of total costs, the marginal costs (in case of URs) are no different than those imposed by users of larger amounts of water [
10].
The pricing system in Spain is based on increasing block rates, while most connections are measured. Nevertheless, this system seems unable to effectively support social equity in the use of water, because it works without taking into account the number of members in each household. As a consequence, the target of social equity in the use of water is not sufficiently served [
11].
Once the billing system has been analyzed, it is interesting to make a review of existing applications or tools that use water bills, water efficiency or water consumption.
The NABERS (National Australian Built Environment Rating Scheme) Home Rating Calculator [
12] is an application that uses water and energy bills to evaluate household consumption. After that, energy and water use is compared to the same home average to find out the performance through star indicators.
The French sustainability certificate, designed by Haute Qualité Environmentale association (HQE) [
13], is an instrument for evaluating the quality of sustainable buildings. To obtain the certification, mandatory categories, such as harmful substances, energy management and water efficiency have to be proven.
To reduce the consumption of potable water for sanitary use in new buildings through the use of water-efficient components and water recycling systems, the Building Research Establishment Environmental Assessment Methodology (BREEAM) [
14] guideline can be used, where the water consumption (liters/person/day) for the assessed building is compared against a baseline performance.
A webpage created by United States Environmental Protection Agency (EPA) was created to increase users’ awareness about water use. This site has interesting information about water efficiency publications and also some links to other websites focused on the improvement of consumption efficiency [
15].
Furthermore, different initiatives are being introduced to establish the efficiency requirements for showers, dishwashers, washing machines, taps and flow regulators, such as the Water Efficiency Labelling Scheme (WELS) [
16] from Australia or Waterwise [
17] from the United Kingdom.
3. Method
The first step was to obtain regular values about water consumption in Spanish residential buildings from other research studies. Once the reference values were established, the distribution of water use was analyzed. After studying the prior research, it was considered timely to make a survey to collect real data and to confirm the data of previous studies. Finally, the assessment criteria of the recommendations are explained.
3.1. Studies about Spanish Housing Water Consumption
To make a realistic assessment, the first step was to obtain real data from Spanish housing water consumption through a survey. However, before carrying out the survey, a study of related prior research was conducted to provide information to the system.
One of the works, conducted by the Institute of Geography of the University of Alicante [
18], consisted of a detailed study about the consumption of water in the housing of some coastal neighborhoods. The results obtained from billing indicated that housing holding up to 4 members, reached values ranging from 140 to 180 liters per capita per day.
However, the research of Saurí [
19], who studied the water consumption of 40 neighborhoods of Barcelona, reflects important differences within regions. Some municipalities consume more than 400 liters per capita per day, while others consume as little as 110.
Nevertheless, another research carried out in Barcelona [
20] reflected a huge variety of domestic water consumption, ranging from an average of 145 liters per capita per day in the compact urban fabric, to an average of 245 liters per capita per day in the suburban periphery, where some neighborhoods reached 500 liters per capita per day or more.
In Majorca, a sharp contrast between water consumption in different neighborhoods in the same province was observed [
21]. The main output of this research that can be used in our research is that individually owned swimming pools cause an additional average water consumption of 22 liters per person per day.
To investigate the influencing factors of residential water consumption, the research conducted by the Autonomous University of Barcelona [
22] was followed, which analyzed 532 households located in 22 different neighborhoods. Each house did a phone questionnaire of 42 questions, which took place between January and March, 2004. Three different types of housing were selected: high-density housing (apartments in multistory buildings); mid-density housing (apartment blocks with a shared garden and swimming pool); and low-density housing (condominiums and detached houses). The distribution of indoor and outdoor uses showed a significant difference among the three different types of housing, although the behavior for high-density and mid-density was very similar. The results of the research showed that 36% of water consumption in low-density housing was used for irrigating the garden. Another interesting point was that the number of tenants and its behavior may affect the domestic water consumption per capita.
All the previous studies only evaluate locations in Barcelona, Majorca and Alicante, but thanks to a survey made by the Spanish National Statistical Office (INE) [
23], information about water consumption in all Spanish autonomous communities was obtained.
According to
Table 1, the average consumption in Spain in 2011 was 142 liters per capita per day. This means a decrease of 1.4% compared to the 144 liters of the previous year. The highest average consumptions were in Castille and Leon, and Ceuta and Melilla, while the lowest average consumptions were in homes from the Basque Country and La Rioja.
Table 1.
Averagewater consumption by autonomous community. Year 2011 [
23].
Table 1.
Averagewater consumption by autonomous community. Year 2011 [23].
| Autonomous Community | L/p/d | Annual variation percentage |
|---|
| Andalusia | 140 | −2.1% |
| Aragon | 132 | −8.3% |
| Asturias | 153 | −3.8% |
| Balearic Islands | 124 | 2.5% |
| Canary Islands | 150 | 0.7% |
| Cantabria | 161 | −6.9% |
| Castille and Leon | 170 | 1.8% |
| Castille la Mancha | 156 | 2.6% |
| Catalonia | 130 | −2.3% |
| Valencia | 152 | −3.2% |
| Estremadura | 144 | −10.0% |
| Galicia | 133 | 0.8% |
| Community of Madrid | 141 | 0.7% |
| Murcia | 152 | −3.8% |
| Navarre | 135 | 5.5% |
| Basque Country | 117 | −4.1% |
| Rioja | 123 | 0.8% |
| Ceuta and Melilla | 170 | 4.3% |
| Total | 142 | −1.4% |
The previous survey provides useful data about the reference level of water consumption in the autonomous communities, even if it does not provide the details of the provinces. For that reason, and taking into account that this survey was made with a large number of households, these values are very useful to check our study.
3.2. Water Use Distribution
To complete the study, giving information about the distribution of consumption was considered advisable. The research carried out by the Water Technology Institute of the Polytechnic University of Valencia [
24] consisted of a study of a sample composed of 64 building apartments without a garden, located in four different villages on the east coast of Spain, and the measurements were performed during 807 days. The final distribution of water use obtained in this study is the following: faucets (38.6%), toilets (22.2%), showers (19.9%), clothes washers (9.7%), leaks (8.9%) and, finally, dishwashers (0.6%). The average water consumption considered per property and day was 334.1 liters.
The research works from Barcelona [
22] and Valencia [
24] were analyzed to establish the distribution of water. However, both studies show different values in each device. Hence, this information cannot be shown, because it would not be realistic and could be confusing for the customers.
Although the previous research studied the distribution of consumption of each element, this information is complicated to obtain, because most of the dwellings are only equipped with meters to indicate the amount of water used. Nevertheless, it is possible to obtain information about the amount of domestic hot water consumption in housings equipped with a solar thermal power system. Therefore, an analysis of similar studies has been performed to establish this value.
The current Spanish standard UNE 94002:2005 [
25] establishes that the hot water consumption per capita in apartment houses would be 22 liters per day and 30 liters per day for a detached house. The Portuguese Decree Law 80:2006 [
26] determines an average consumption of 40 liters per person per day, independent of the type of building. Another standard from U.K., known as BS6700 [
27], recommends that the hot water consumption of a dwelling should be between 35 liters and 45 liters per bedroom, respectively. According to Spanish Technical Building Code (CTE) [
28], which establishes the connection between tenants and the bedrooms of houses, the quantity of domestic hot water use per capita is similar to the Spanish standard.
Table 2 shows an approximation between the consumption per user of different standards. It should be noted that the values of domestic hot water consumption per tenant according the BS6700 are similar to the Spanish standard, although this is independent of the type of building, like the Portuguese standard.
Table 2.
Amount in liters of domestic hot water per person in different standards.
Table 2.
Amount in liters of domestic hot water per person in different standards.
| Standard | 1 tenant | 2 tenants | 3 tenants | 4 tenants |
|---|
| Spanish Standard | 22–30 | 44–60 | 66–90 | 88–120 |
| United Kingdom Standard | 23–30 | 47–60 | 70–90 | 105–135 |
| Portuguese Standard | 40 | 80 | 120 | 160 |
Research performed in Greece [
29] shows a similar conclusion to the Spanish standard, since it was appreciated that most of the families consumed between 25 and 35 liters per person per day.
On the other hand, the Residential End use Monitoring Program (REMP) [
30] measured the hot water consumption of five different houses in Melbourne. This project has revealed that hot water usage patterns are extremely variable inside households, because the hot water consumption per person per day oscillated between 16 and 56 liters per person per day with an average consumption of 23.1 liters per person per day.
3.3. Survey and Collecting Data
After analyzing the previous studies, it was considered appropriate to check the previous values and to obtain more data. To validate the data of total water consumption, it was decided to carry out a survey where the information was collected through a webpage [
31]. To fill out the survey, users were asked about the main characteristics of the house, such as the size, number of tenants, province, water billings of the last few months, and so on.
To ensure the best performance of the water label, the survey collected data provided by different customers. The houses evaluated are located in the community of Madrid.
Table 3 shows the water consumption collected by the survey and the deviation with respect to the INE values that, in the case of the community of Madrid, is 141 liters per person per day.
Table 3.
Comparison between survey and INE data.
Table 3.
Comparison between survey and INE data.
| Survey house | Water consumption | Deviation with respect to the INE value |
|---|
| (liters per capita per day) |
|---|
| House 1 | 115.0 | 18.3% |
| House 2 | 169.3 | 20.1% |
| House 3 | 170.8 | 21.1% |
| House 4 | 132.3 | 6.1% |
| House 5 | 188.8 | 33.9% |
| House 6 | 98.6 | 30.0% |
| House 7 | 105.2 | 25.3% |
| House 8 | 87.6 | 37.8% |
| Total | 133.4 | 5.3% |
As may be seen in
Table 3, the average error produced by these data is only 5.3% in relation to the INE values (141 liters per person per day). Consequently, the water label estimates the daily consumption with the data of the survey from INE, because it matches reality.
The next step is to study the variation of consumption throughout the year.
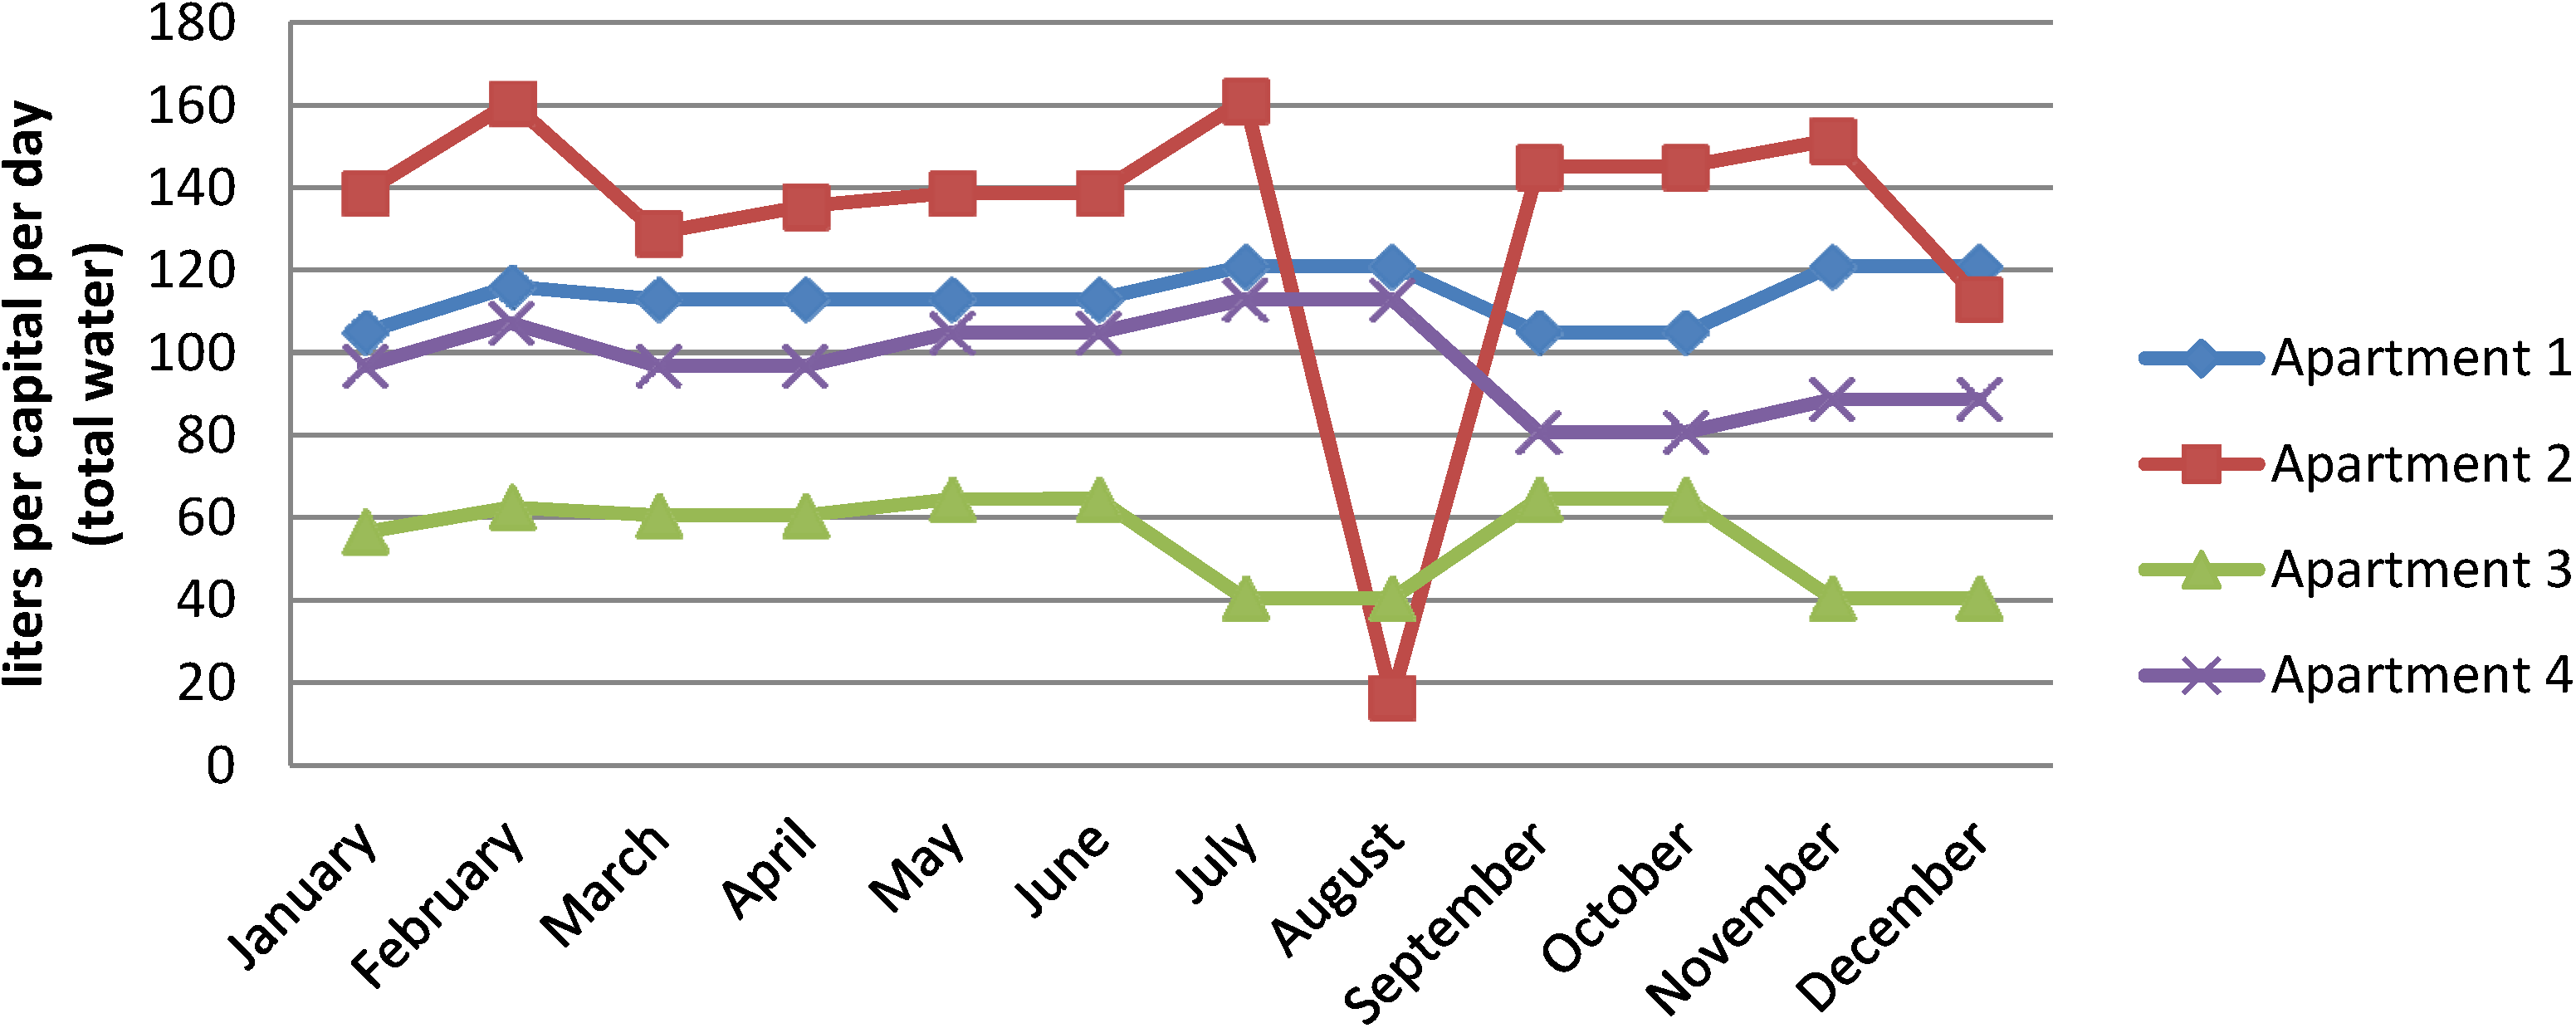
Figure 2 shows some examples of the variation of water consumption per tenant.
As can be perceived in
Figure 2, water consumption remains almost constant during the different months, except in summer. The reason could be due to the holiday period.
A research carried out in Benidorm (Spain) [
32] has also examined the variation of consumption throughout the year. The outcome did not present considerable variation between the maximum and the minimum value in the case of apartments. Consequently, the value of water consumption is considered constant in households without a garden or pool.
To obtain data about domestic hot water, 10 apartments in the same building were tracked during eighteen months in the community of Madrid. We focused on these households, because they are equipped with a specific meter for domestic hot water. Therefore, data about the domestic hot water consumption can be collected.
Figure 2.
Variation of water consumption per tenant throughout the year.
Figure 2.
Variation of water consumption per tenant throughout the year.
The average of domestic hot water was 25.7 liters per capita per day. The month with the highest consumption was January, with 43.1 liters per capita per day, while the month with less consumption was July, with 9.7 liters per capita per day.
Figure 3 shows a chart with the domestic hot water consumption along the eighteen months in one of the houses studied.
Figure 3.
Amount of domestic hot water consumption in an apartment by month.
Figure 3.
Amount of domestic hot water consumption in an apartment by month.
These data suggest that hot water consumption in winter can be even 4 times higher than in summer. Therefore, domestic hot water is not constant along the year.
Similar conclusions were also obtained from the research conducted by Goldner [
33], who studied for fourteen months the domestic hot water consumption in 30 multi-family buildings in New York. This research also shows that hot water consumption levels increase from summer to autumn and then to winter.
3.4. Recommendations
According to a study conducted by the United Kingdom Energy and Climate Change Department [
34], there is a huge potential for water savings across Europe. In the public water supply sector (including households), water savings up to 50% could be achieved by reducing leakage in water supply networks, introducing water saving devices and using more efficient household appliances. Blanco [
35] obtained similar results in some locations by improving tenants’ awareness.
The aim of this incorporation is that customers can reduce their water consumption by means of recommendations.
Table 4 shows that it is necessary to remind customers of the most typical recommendations that can be enacted for reducing their water consumption, because, as can be appreciated, there are no recommendation with 100% of incorporation.
Table 4.
Steps taken to reduce water consumption in Spanish residential buildings, 2008 [
36].
Table 4.
Steps taken to reduce water consumption in Spanish residential buildings, 2008 [36].
| Step taken | Percent incorporation |
|---|
| Reusing water | 22.9% |
| Defrost food in advance | 86.6% |
| Wait to fill up the dishwasher/washing machine | 81.9% |
| Decrease the flow of the faucets | 30.8% |
| The bathroom has a bin | 54.7% |
| Single handle faucet | 65.6% |
| Other saving devices | 17.0% |
| The toilet has a discharge interrupt system | 34.0% |
As each step taken is directed at an appliance, it is necessary to study appliances with more consumption. If we know where water is consumed, the recommendations will be better focused. Hence, if users take into account these tips, they will reduce the amount of water more.
To do this, we have used the percentages of the Water Technology Institute of the Polytechnic University of Valencia [
24] and the percent of total hot water use proposed by Willian [
37].
Table 5 shows the total of water consumption and domestic hot water consumption in each appliance.
Table 5.
Appliances with higher water consumption.
Table 5.
Appliances with higher water consumption.
| Appliance | Percent | Water Consumption | Percent of Total Hot Water Use | Domestic Hot Water Consumption |
|---|
| (liters per capita per day) | (liters per capita per day) |
|---|
| Showers | 19.9% | 28.2 | 25.1% | 6.6 |
| Toilets | 22.2% | 31.5 | 0.0% | 0.0 |
| Faucets | 38.6% | 54.8 | 51.0% | 13.3 |
| Dishwashers | 0.6% | 0.9 | 3.6% | 0.9 |
| Washers | 9.8% | 14.0 | 15.5% | 4.0 |
| Leaks | 8.9% | 12.6 | 4.8% | 1.2 |
| Total | 100% | 142.0 | 100% | 26.0 |
As may be seen in
Table 5, the consumption of water in dishwashers is fully with hot water. On the other hand, the water consumption in toilets includes only cold water. Finally,
Table 5 points out that most of the recommendations must be focused on showers, toilets and faucets.
4. Results
The water label created and presented in this paper is a tag that establishes the efficiency of water consumption in Spanish residential buildings per tenant.
To assess whether water consumption is efficient or not, it is necessary to establish different levels. In order to set the margins of classification by the use of this resource, the Code for Sustainable Homes (CSH) [
38] has been referenced.
The water label has six levels of performance bands, each one with a different number of drops to avoid possible conflict with the current energy label, and uses liters per person per day as the type of measurement.
Table 6 shows the water label and its levels for total water consumption.
Table 6.
Water label as a function of total water consumption per person per day.
In order to ensure that the costumers live in the house, the minimum value has been established as 50 liters per capita per day, as shown in the research done by Gleick [
39]. Once this range was established, when the water usage is less than 90 liters per capita per day, it was considered to be efficient consumption.
In the case of dwellings having an exclusive meter to measure hot water consumption, a new water label has to be created to assess this case.
Table 7 shows the domestic hot water label, which reflects the efficiency in this kind of consumption.
Table 7.
Water label as a function of domestic hot water consumption per person per day.
In most Spanish homes, domestic consumers have no way of knowing whether or not their behaviors contribute to an efficient use of water. At present, there is not an application that makes a real comparison between customers in Spain. For that reason, water billing should give this kind of information to give them the chance to have a reference level of water consumption in their province. That kind of comparison between users makes them increase their efforts to reduce consumption by around 5%–15% [
40].
Although the next research analyzes the benefits of comparing energy (not water) consumption among users, the conclusions are noteworthy. Department of Energy and Climate Change (DECC) [
41] indicated an appetite for consumption comparison information and recommends that, even in the absence of smart meters, consumers could benefit from additional advice on how to reduce their energy bills. Therefore, introducing a section of recommendations may be also advisable for reducing water consumption.
5. Discussion
This research takes a new step forward in terms of billing, since it evaluates, compares and gives recommendations with the purpose of improving the actual water billing system, thus increasing the awareness of citizens and decreasing water consumption in Spanish housing. Although bills are only a means of transmission, considering that it is a receipt of a service, they are subject to certain legal restrictions that, in the case of Spain, are established by Royal Decree 87/2005 [
42]. This document indicates the minimum data that bills should contain, such as the invoice number, name and surname, and so on. In addition, there is a part that is considered appropriated to give better customer service. Our proposals are focused on this part.
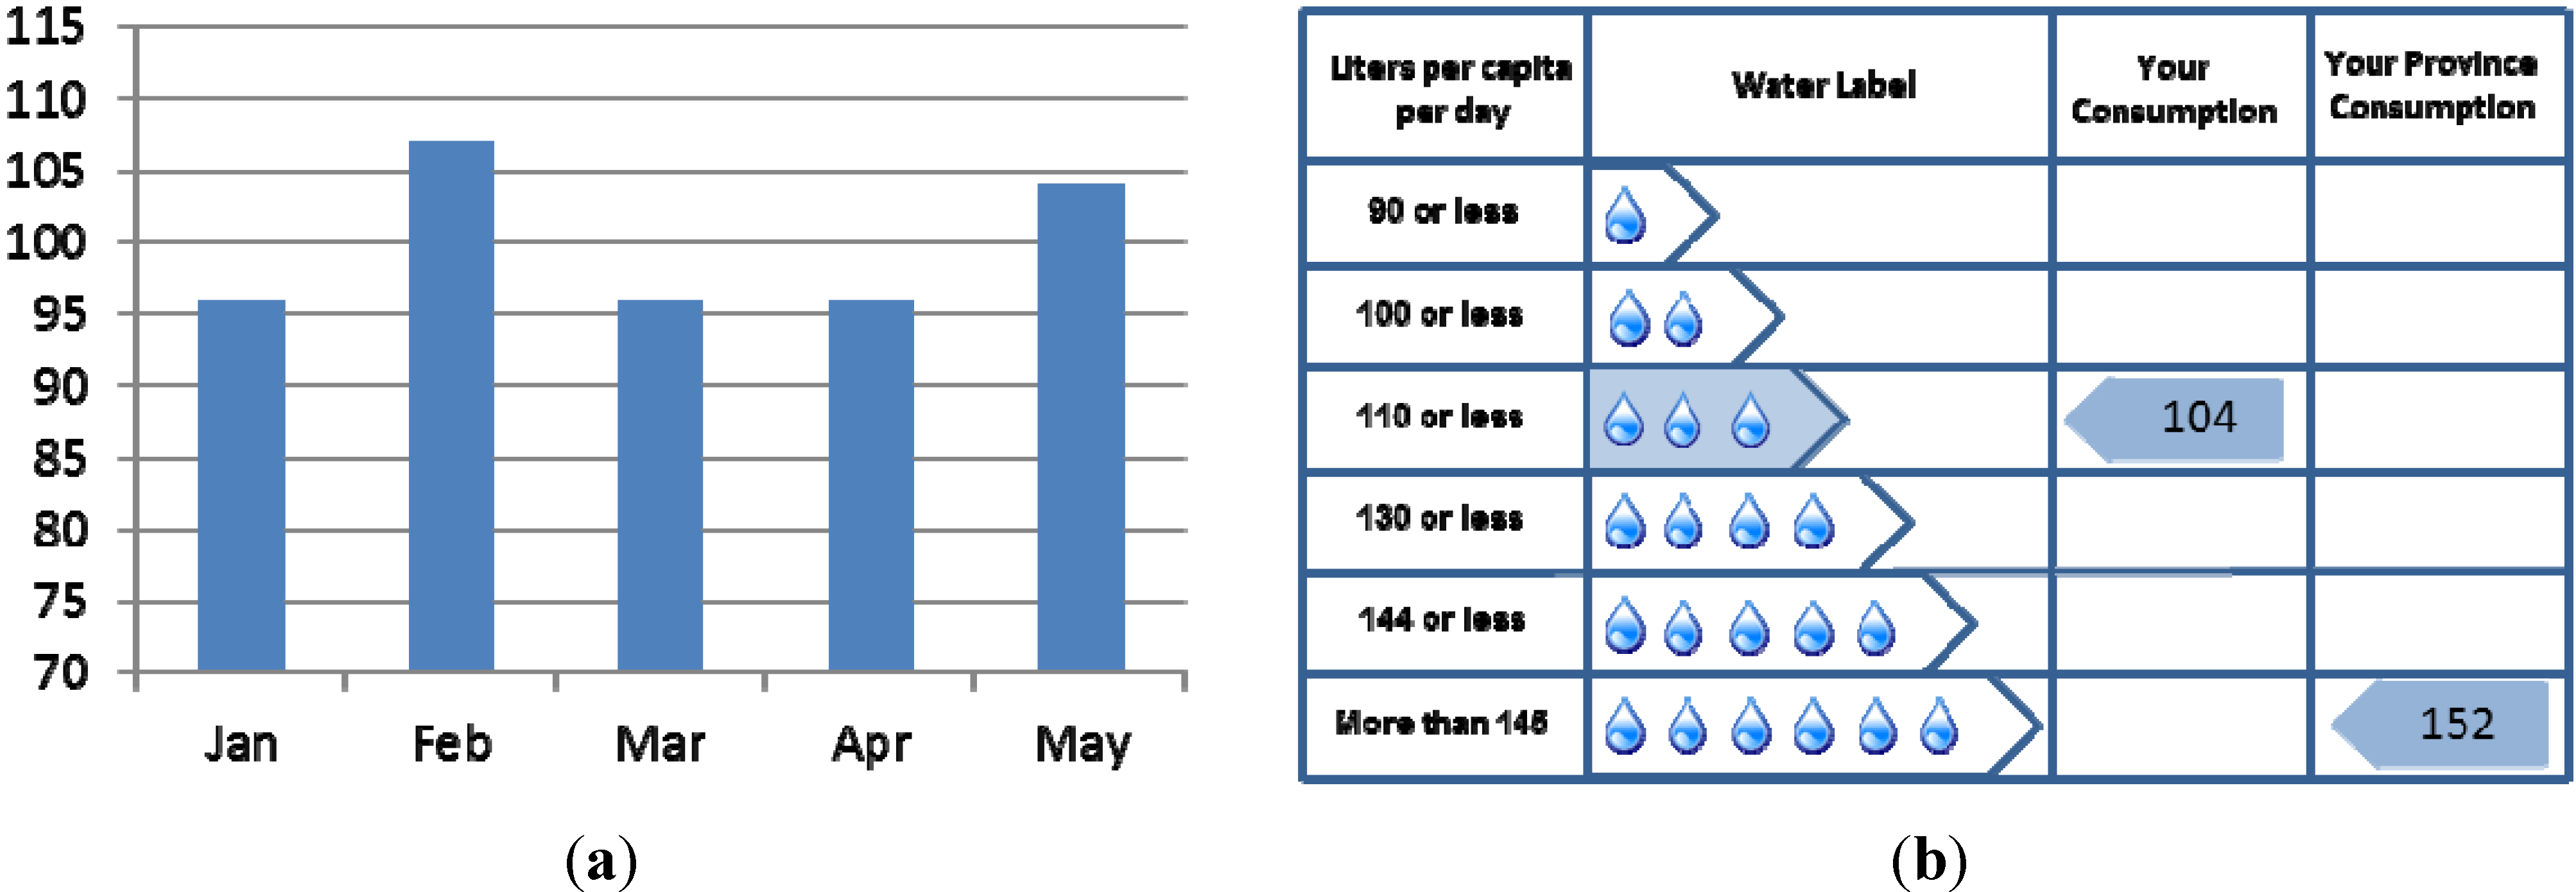
To establish the water label, it is necessary to know the number of tenants and the province to obtain the efficiency level as a function of the liters used per person per day. However, most of the water distribution companies do not know the number of inhabitants. To solve this drawback, it was thought that electronic bills would be the best way, considering that the information about the inhabitants can be entered through the webpage of the distribution company. In any case, the tag would be useful despite not knowing the number of tenants. In the case that the company does not have enough information to establish the current water label, it would be interesting to add a standard label that shows the range of values used to evaluate the efficiency and the daily consumption during the period of the billing. It was then discussed that the best place to insert the water label and the comparison in the bill was beside the graph of historical consumption, as shown in
Figure 4. Thereby, the user may check the evolution of water consumption at the same time as the evaluation for the current bill.
Figure 4.
Water label in a bill. (a) Historical consumption, your historical daily water consumption; (b) water label for the last month.
Figure 4.
Water label in a bill. (a) Historical consumption, your historical daily water consumption; (b) water label for the last month.
Owing to the recommendations being tips to decrease water consumption and that they are not mandatory on the bill, it was thought that it would be appropriate that the best place to insert them was at the end of it. The aim above all is to help people find the best way to save water, improving their behavior and incorporating efficient technologies at their homes. In each bill, the recommendations should be different from continua attracting the attention of customers.
It is important to note that the qualification of water consumption induced by the implementation of building policies has important benefits for the environment. A good example for that is the outcome of the NABERS implementation, which has shown a savings of around 222,000 m
3 of water per year for a one star-certified non-residential building (e.g., retail centers, hospital and schools) [
43].
6. Conclusions
Nowadays, most developed countries are taking initiatives to decrease water consumption in buildings. The best example is Australia, where a reduction of 40% of water consumption in 2020 from 2000 levels is expected. If Spain wants to improve the current situation, it should keep and improve the awareness campaigns, because the reduction reached until 2010 compared with 2000 is only 14%.
The main outcome is the contribution of an efficient water consumption evaluation system that provides a water label and makes a comparison between consumers of the same province, which could give them the opportunity to have a reference level to improve their consumption.
Following the completion of this paper, the research has revealed some aspects that we consider important to point out.
The fact that the highest average consumptions are located in Castille and Leon, Ceuta and Melilla, while the lowest average consumptions are in homes from the Basque Country and La Rioja, shows how the location has an important role in water consumption. For that reason, the comparison between household consumptions have been made by province.
The hot water consumed in winter can be even four times higher than in summer. The month with the highest consumption is January, and the month with the least consumption is July. Therefore, domestic hot water is not constant.
The only appliance in households that consumes exclusively hot water is the dishwasher. On the other hand, the only appliance that consumes exclusively cold water is the toilet.
Curiously enough, citizens do not know the most common recommendations to reduce water consumption. There are no steps taken with a percent of incorporation of 100%.
It is noteworthy that the savings in domestic hot water have more advantages, not only related with water savings, but also in energy consumption. It is important to control this consumption, which represents up to 18.9% of the energy consumption in households.
Beyond the previous aspects, the possible impact on customers may be determined by two variables: household income and the difference between its water label and the average consumption from citizens of the same province.
In the case of families with low incomes, this water label may not influence their habits, because their consumption basically depends on their budget. Nevertheless, in families with high incomes, it is necessary to look for other motivations, such as the comparison with other users as being necessary, because saving money usually does not affect their behavior. For that reason, we thought that indicating the average consumption, combined with the water label, could serve to motivate all kinds of users.
Finally, if customers have a low level in the water consumption, they are unlikely to improve their behavior, but when the level is high, they can change their behavior, so, the recommendations are important too for these situations.

 ,
, 


