Article

Effect of Selected Plant Extracts and D- and L-Lysine on the Cyanobacterium Microcystis aeruginosa

by
Miquel Lürling
1,2,* and
Frank Van Oosterhout
1
1
Aquatic Ecology and Water Quality Management Group, Department of Environmental Sciences, Wageningen University, P.O. Box 47, Wageningen 6700 AA, The Netherlands
2
Department of Aquatic Ecology, Netherlands Institute of Ecology (NIOO-KNAW), P.O. Box 50, Wageningen 6700 AB, The Netherlands
*
Author to whom correspondence should be addressed.
Water 2014, 6(6), 1807-1825; https://doi.org/10.3390/w6061807
Submission received: 26 April 2014 / Revised: 7 June 2014 / Accepted: 10 June 2014 / Published: 17 June 2014

Abstract

:
We tested extracts from Fructus mume, Salvia miltiorrhiza and Moringa oleifera as well as l-lysine and d-Lysine as curative measures to rapidly suppress the cyanobacterium Microcystis aeruginosa NIVA-CYA 43. We tested these compounds under similar conditions to facilitate comparisons. We hypothesized that for each compound, relatively low concentrations—i.e., 5–50 mg L−1, would reduce M. aeruginosa biomass. At these low concentrations, only L-lysine caused a decline in M. aeruginosa biomass at ≥4.3 mg L−1. F. mume extract was effective to do so at high concentrations, i.e., at ≥240 mg L−1, but the others were virtually non-effective. Low pH caused by organic acids is a probable explanation for the effect of F. mume extract. No complete wipe-outs of the experimental population were achieved as Photosystem II efficiency showed a recovery after six days. l-lysine may be effective at low concentrations—meaning low material costs. However, the effect of l-lysine seems relatively short-lived. Overall, the results of our study did not support the use of the tested plant extracts and amino-acid as promising candidates for curative application in M. aeruginosa bloom control.

1. Introduction

Excessive nutrient loading (eutrophication) of lakes and ponds is the major cause of water blooms [1,2] and surface scums of cyanobacteria (blue-green algae). Scums often accumulate at the leeside shores [3] and because cyanobacteria can produce potent toxins, such scums pose a threat to human and animal health [4,5]. Consequently, blooms and scums of cyanobacteria may hamper the use of surface waters through swimming bans, or may impact irrigation and lead to drinking water shortages [3,6,7].
Microcystis aeruginosa is one of the world wide and most frequently encountered bloom-forming cyanobacteria in freshwater bodies, several of its strains produce powerful toxins—microcystins [8,9]. In the Netherlands, accumulations of cyanobacteria are reported to contain microcystin concentrations well over 10,000 μg L−1 [10,11]. Such high toxin concentrations conflict with societal demands for safe water and need to be dealt with according to the European Water Framework Directive (WFD) [12] and the EU Bathing Water Directive (BWD) [13].
Nutrient reduction—with a focus on phosphorus control [14], is considered the most effective way to mitigate cyanobacterial nuisance [15]. However, methods to this effect often operate longer-term, which leave water authorities with a great need to instantaneously curate cyanobacterial nuisances at the moment they occur. For example, at official bathing areas the BWD demands that “when cyanobacterial proliferation occurs and a health risk has been identified or presumed, adequate management measures shall be taken immediately to prevent exposure”. Accordingly, curative methods are wanted to immediately suppress the proliferation of cyanobacteria or (safely) end a massive bloom with the purpose to provide—at least in the summer season, access to the water for drinking, irrigation, aquaculture, industry and recreation [16].
Many curative products to control cyanobacteria are proposed as Columbus’s Egg to the Dutch water authorities. These water authorities have a preference for biological curative measures above chemical approaches, because the former are considered environmental friendly. The biological anti-cyanobacterial products are viewed, and reported, as promising in controlling cyanobacteria [17,18]. The majority of these products are compounds extracted from plant tissues and tested on M. aeruginosa [17,18,19]. In such testing, extracts from Fructus mume [19], Salvia miltiorrhiza (Chinese Danshen) [20] and extracts from seeds of the pan tropical tree Moringa oleifera [21] are observed to express anti-cyanobacterial activity against M. aeruginosa. In addition, the amino acid l-lysine is reported as active against cyanobacteria [22,23,24]. However, with respect to d-Lysine reports are less conclusive; while Kaya and Sano [22] reported that d-Lysine was equally suppressive to Microcystis as l-Lysine, others found no effect of d-Lysine on Microcystis [25].
The literature data on effective concentrations against cyanobacteria of the above mentioned plant extracts and amino acids are not comparable, as different studies used quite dissimilar test conditions [18] (Appendix Table A1). Importantly, several of these studies most likely did not use agitation of the cultures (Table A1), whereas mixing enhances biomass [26] and was recently found to affect growth inhibition by a filtrate from a Tychonema culture towards M. aeruginosa [27]. In our current study, we tested the effect of filtrates from Fructus mume, Salvia miltiorrhiza, and Moringa oleifera as well as l-lysine and d-Lysine on growth of M. aeruginosa, under similar experimental conditions with continuous shaking. For each compound we hypothesized that a sufficiently high concentration will reduce the growth of M. aeruginosa and diminish M. aeruginosa biomass. We relate our results to similar studies reported in literature and discuss our results regarding the feasibility of the use of these compounds in actual mitigation of blooms of cyanobacteria. As previously reported in the literature, we also observed a strong effect of F. mume on the solution pH.

2. Materials and Methods

2.1. Test Organism

The cyanobacterium Microcystis aeruginosa NIVA-CYA 43 was obtained from the Norwegian Institute for Water Research (NIVA, Oslo, Norway). A stock culture of this strain was grown in a 1000 mL Erlenmeyer flask containing 400 mL modified WC medium [28] and that was closed with a cellulose plug. To promote a dense green culture, the culture flask was placed in a Gallenkamp ORBI-SAFE Netwise Orbital Incubator at 24 °C under continuous light of 80 µmol quanta m−2 s−1 and continuous orbital shaking at 60 rpm. This strain of M. aeruginosa is completely uni- and bicellular under the given growth conditions and does not contain any measurable amounts of microcystin [29]. Inoculums for the experiments were taken from the late-log phase dense culture and diluted to ~10 µg L−1 in fresh modified WC medium in 2 L Erlenmeyer’s.

2.2. Test Compounds

Dried fruits (Fructus) of Prunus mume and the roots of Salvia miltiorrhiza were purchased from NatuurApotheek (Pijnacker, The Netherlands). Seeds of Moringa oleifera were obtained from the Miracle Trees Foundation (Rotterdam, The Netherlands). The amino acids d-lysine (CAS Number 923-27-3) and l-lysine (CAS Number 56-87-1) were purchased from Sigma-Aldrich Chemie BV (Zwijndrecht, The Netherlands).

2.3. Preparation Extracts

The fruit tissue of Fructus mume was separated from the kernel by cutting with a knife. The kernels were discarded. Whereas the purchased F. mume were obtained as dried material, the roots of S. miltiorrhiza and seeds of M. oleifera were not dry when obtained. Drying was done in a stove at 50 °C for 96 h. M. oleifera seed coats were removed after drying. Each dried tissue was separately grinded to a powder using a mortar and pestle. Of these ground tissues 24 g of the F. mume tissue and 37 g root tissue of S. miltiorrhiza were boiled separately for 30 min in Millipore water under continuous stirring using a magnetic stirrer. Evaporation losses were compensated with Millipore water such that for each a final concentration of 100 g L−1 was obtained. These suspensions were centrifuged for seven min at 3000 rpm, where after the supernatants were filtered through a glass-fiber filter (GF/A, Whatman International Ltd., Maidstone, UK) and transferred to 250 mL flasks. The filtrates were autoclaved and stored in the dark at room temperature until further use.
For M. oleifera 10 g powder was added to 1 L Millipore water, stirred for 30 min, filtered through a glass-fiber filter (GF/C Whatman) and transferred to a 1 L flask that was closed and stored in a refrigerator until further use.
Stock solutions for d-lysine and l-lysine were prepared by adding aliquots of 4.0 g to separate flasks and dissolving it in 250 mL Millipore water yielding final concentration of the stocks of 16.0 g L−1.
The pH of the extracts were: F. mume, pH = 3.1; S. miltiorrhiza, pH = 5.2; M. oleifera seed extract, pH = 4.5. The corresponding electric conductivity (EC) of the extracts were 9500, 4300 and 362 µS cm−1. The pH of the l-lysine stock solution was 5.2, for the d-lysine pH was 5.7, while the EC was 6800 and 6700 µS cm−1, respectively.

2.4. Dose-Range Finding Experiment

A dose-range finding experiment was done to determine how much of the stock solutions of the F. mume, S. miltiorrhiza extracts and which concentration of the lysine stereo-isomers should be used in the bioassay. The active dose range for the M. oleifera extracts was based on [21]. A dilution series of each stock solution was made in WC medium such that the added volume was always 1 mL. The range finding experiment was done in triplicate in 100 mL Erlenmeyer flasks containing 49 mL of M. aeruginosa suspensions in WC medium to which 1 mL of F. mume, S. miltiorrhiza or l-lysine was added yielding concentrations of 0, 3 and 300 mg L−1 for F. mume and S. miltiorrhiza, and 0, 1, 5, 10, 40 mg L−1 for l-lysine. The initial M. aeruginosa concentration was 14.4 (±0.7) µg L−1 chlorophyll-a (CHLa) for F. mume and S. miltiorrhiza and 27.7 (±1.1) µg L−1 for the l-lysine trial as determined with a PhytoPAM phytoplankton analyzer (Heinz Walz GmbH, Effeltrich, Germany). The flasks were incubated for two days (F. mume, S. miltiorrhiza) or three days (l-lysine) in a Gallenkamp ORBI-SAFE Netwise Orbital Incubator at 24 °C under continuous light of 80 µmol quanta m−2 s−1 and continuous orbital shaking at 60 rpm, where after CHLa was measured again.

2.5. Bioassay

Based on the range finding experiment, different amounts of extracts and d- and l-lysine were tested (Table 1). For each extract and d- and l-lysine serial dilutions were made in WC medium such that for every desired concentration 1 mL was added to 49 mL M. aeruginosa suspensions in 100 mL Erlenmeyer flasks. The flasks were closed with a cellulose plug. The bioassay experiment consisted of a 4 day pretreatment growth period to allow M. aeruginosa to adapt to the prevailing conditions and a six day post treatment period. The initial M. aeruginosa concentration was ~10 µg L−1. CHLa concentrations (µg L−1) and Photosystem II efficiencies (ΦPSII) were determined using a PhytoPAM phytoplankton analyzer (Heinz Walz GmbH, Effeltrich, Germany). The biovolume concentration (µm3 mL−1) was measured using a CASY cell counter (Schärfe System Gmbh., Reutlingen, Germany). The measurements were taken four days (4 d), one day (1 d) and just before (0 d) the application of the treatments as well as three and six days after the application (i.e., 3 d and 6 d). Just after the application of the treatments and at the end of the experiment pH and electric conductivity were measured using a WTW pH/cond 340i meter. The experiment was done in fivefold. The experimental flasks were divided systematically over two incubators (Gallenkmap, ORBI-SAFE Netwise) set at identical conditions; 24 °C under continuous light of 80 µmol quanta m−2 s−1 and continuous orbital shaking at 60 rpm, i.e., three replicates were placed in one and the other two in the other incubator. Light intensity was checked with a Li-COR Li-185B quantum/radiometer/photometer connected with a LI-190SB quantum sensor.
Table 1. Amounts of dried Fructus mume, Salvia miltiorrhiza and Moringa oleifera that were extracted in water and tested in different concentrations against Microcystis aeruginosa NIVA-CYA 43, including the concentration ranges for the amino-acids d- and l-lysine tested.
F. mume (mg L−1)S. miltiorrhiza (mg L−1)M. oleifera (mg L−1)D- and L-lysine (mg L−1)
0000
304040.5
608081.4
120160164.3
2403203213
4806406438.9

2.6. Data Analysis

In controls and treatments where exponential growth was observed over the entire experimental period, the slope of the regression line between natural log-transformed CHLa concentrations and time was used to estimate the population growth rate. In treatments where growth was affected, growth rates (µ) were determined from the difference in CHLa concentrations at the start of the application and after 6 days according: Water 06 01807 i001. In addition, growth rates were also calculated similarly based on changes in biovolume concentrations. For each compound the estimated growth rates (µ) at different concentrations were compared by a one-way ANOVA or when prerequisites for parametric testing were not met by Kruskal-Wallis One Way Analysis of Variance on Ranks. As some products caused a decline in population growth yielding negative growth rates, finite rates of increase of the population (λ) were calculated (λ = eµ) based on which EC50 values were determined by four parameter logistic regression in the tool pack SigmaPlot version 12.5. The effect of each extract/compound on ΦPSII was tested by running repeated measure ANOVAs in the statistical program IBM SPSS version 19 (IBM Corporation, Armonk, NY, USA).

3. Results

3.1. Range Finding Assay
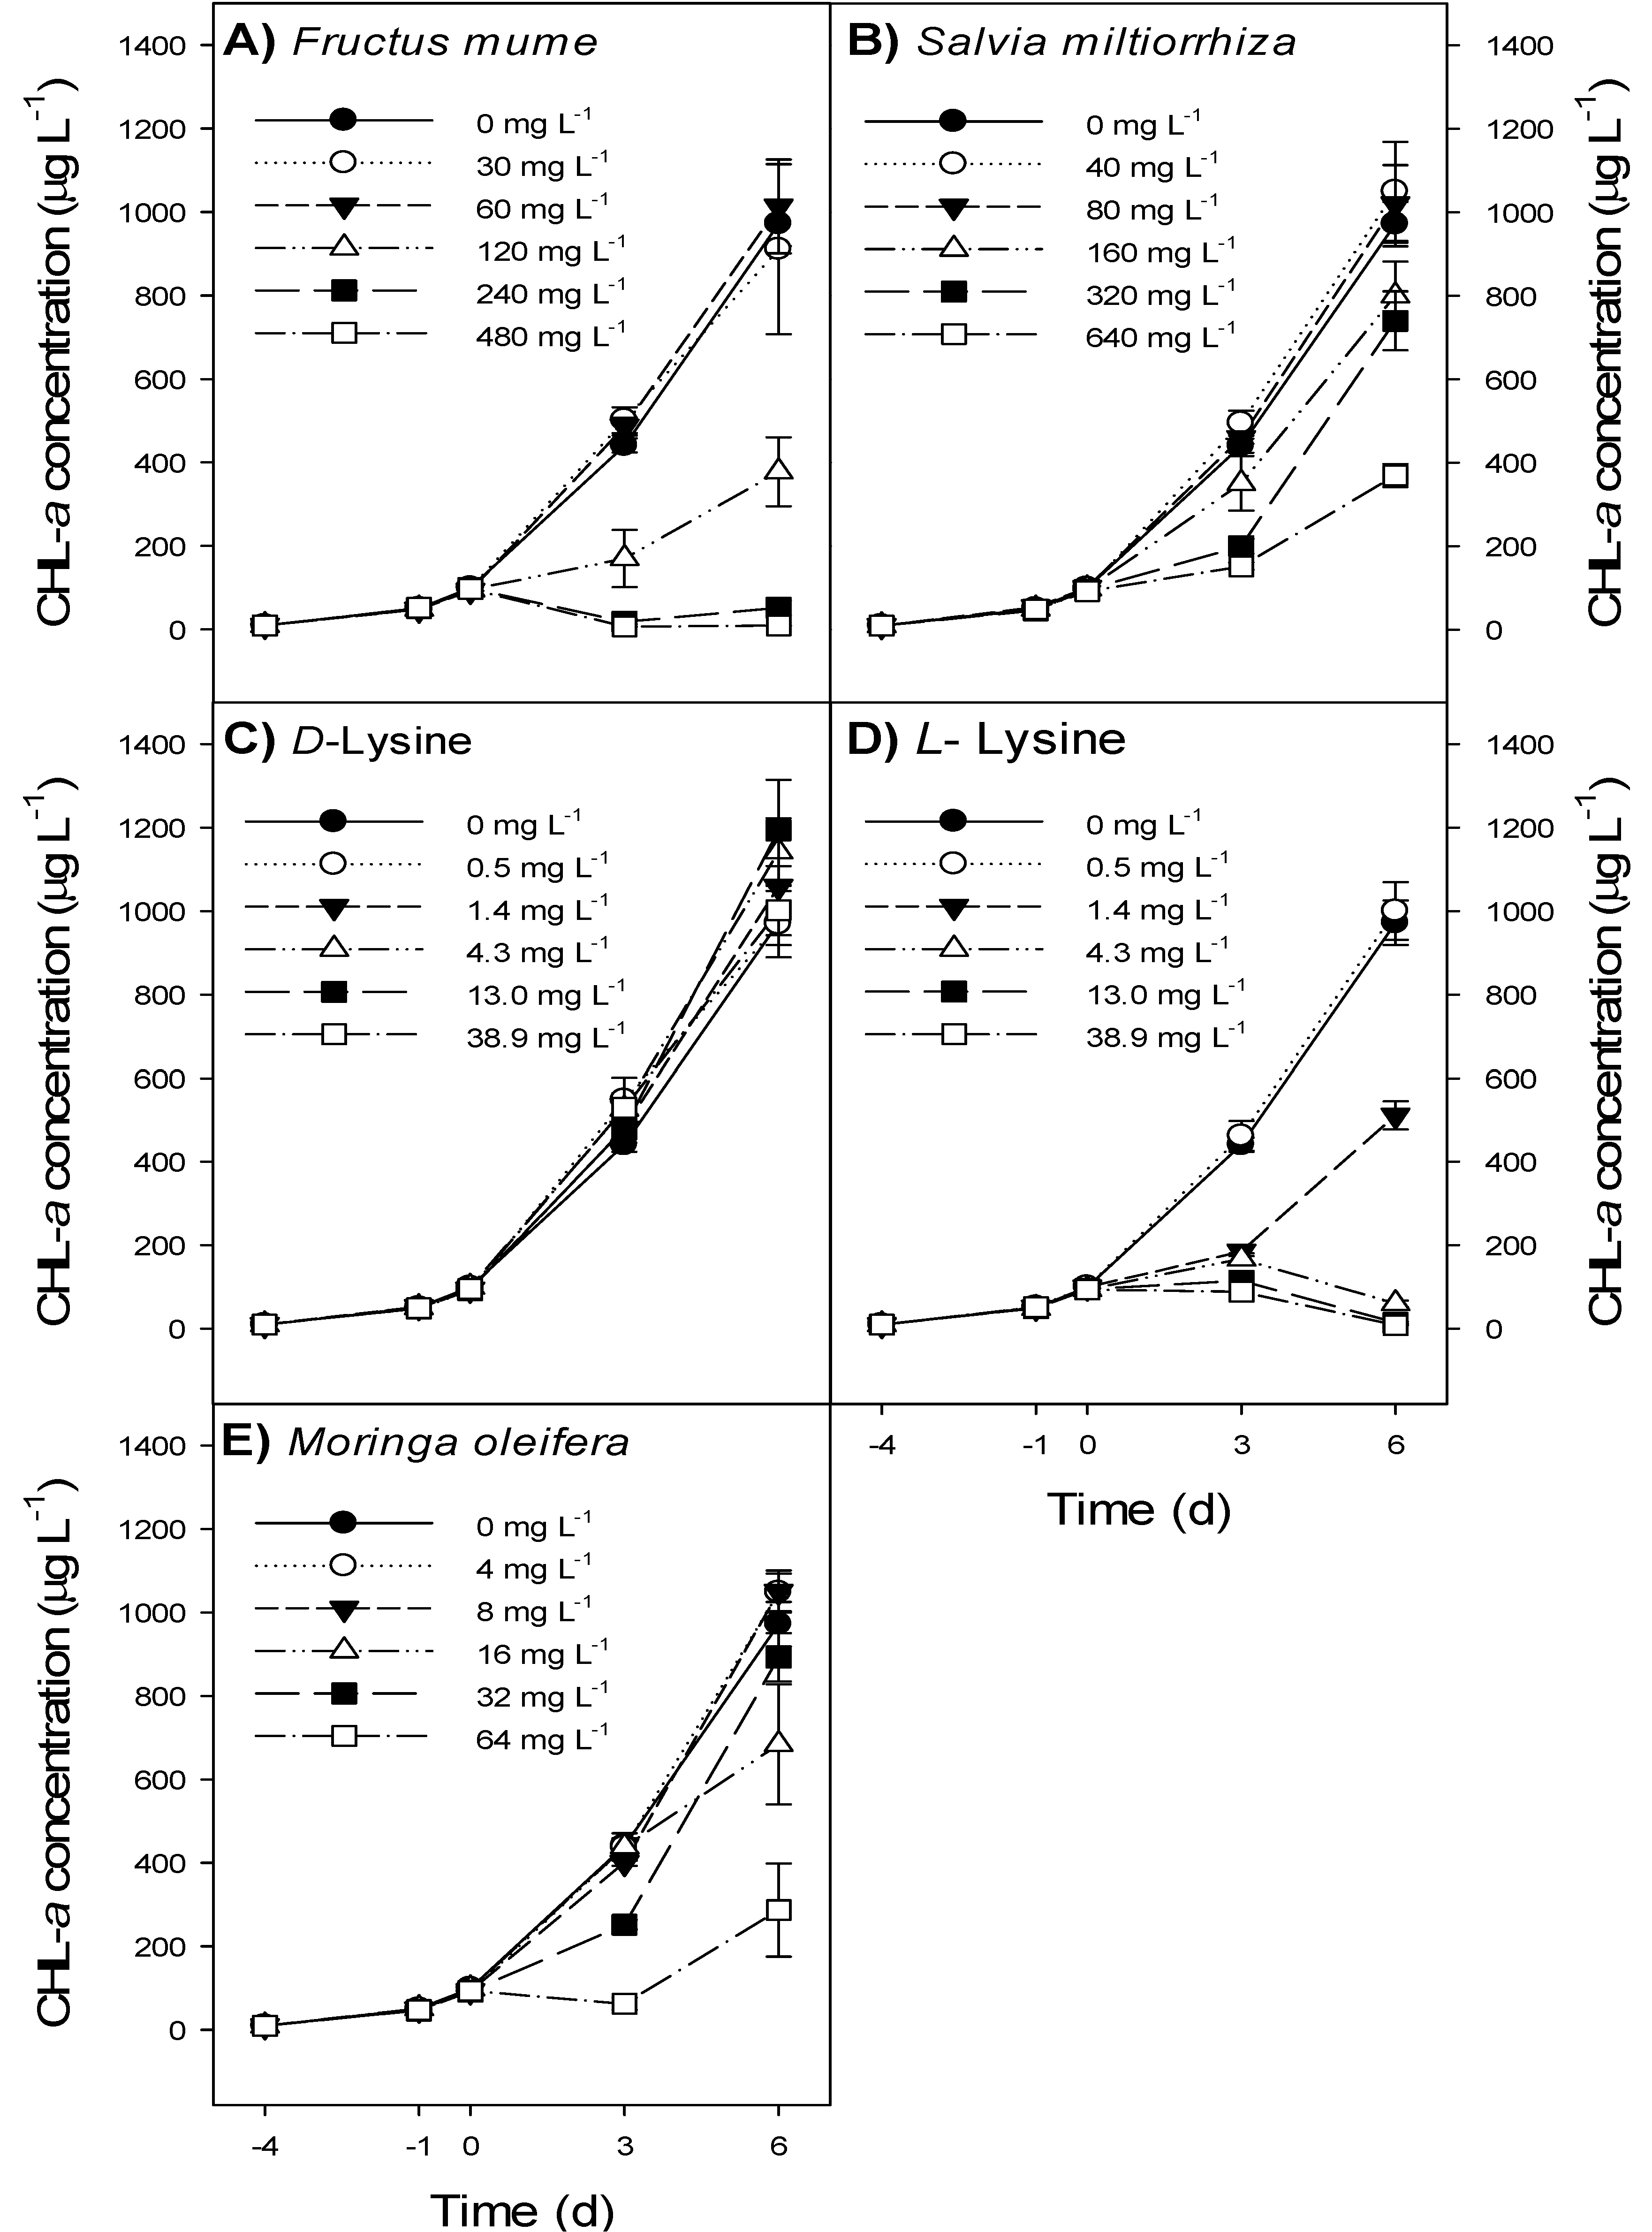
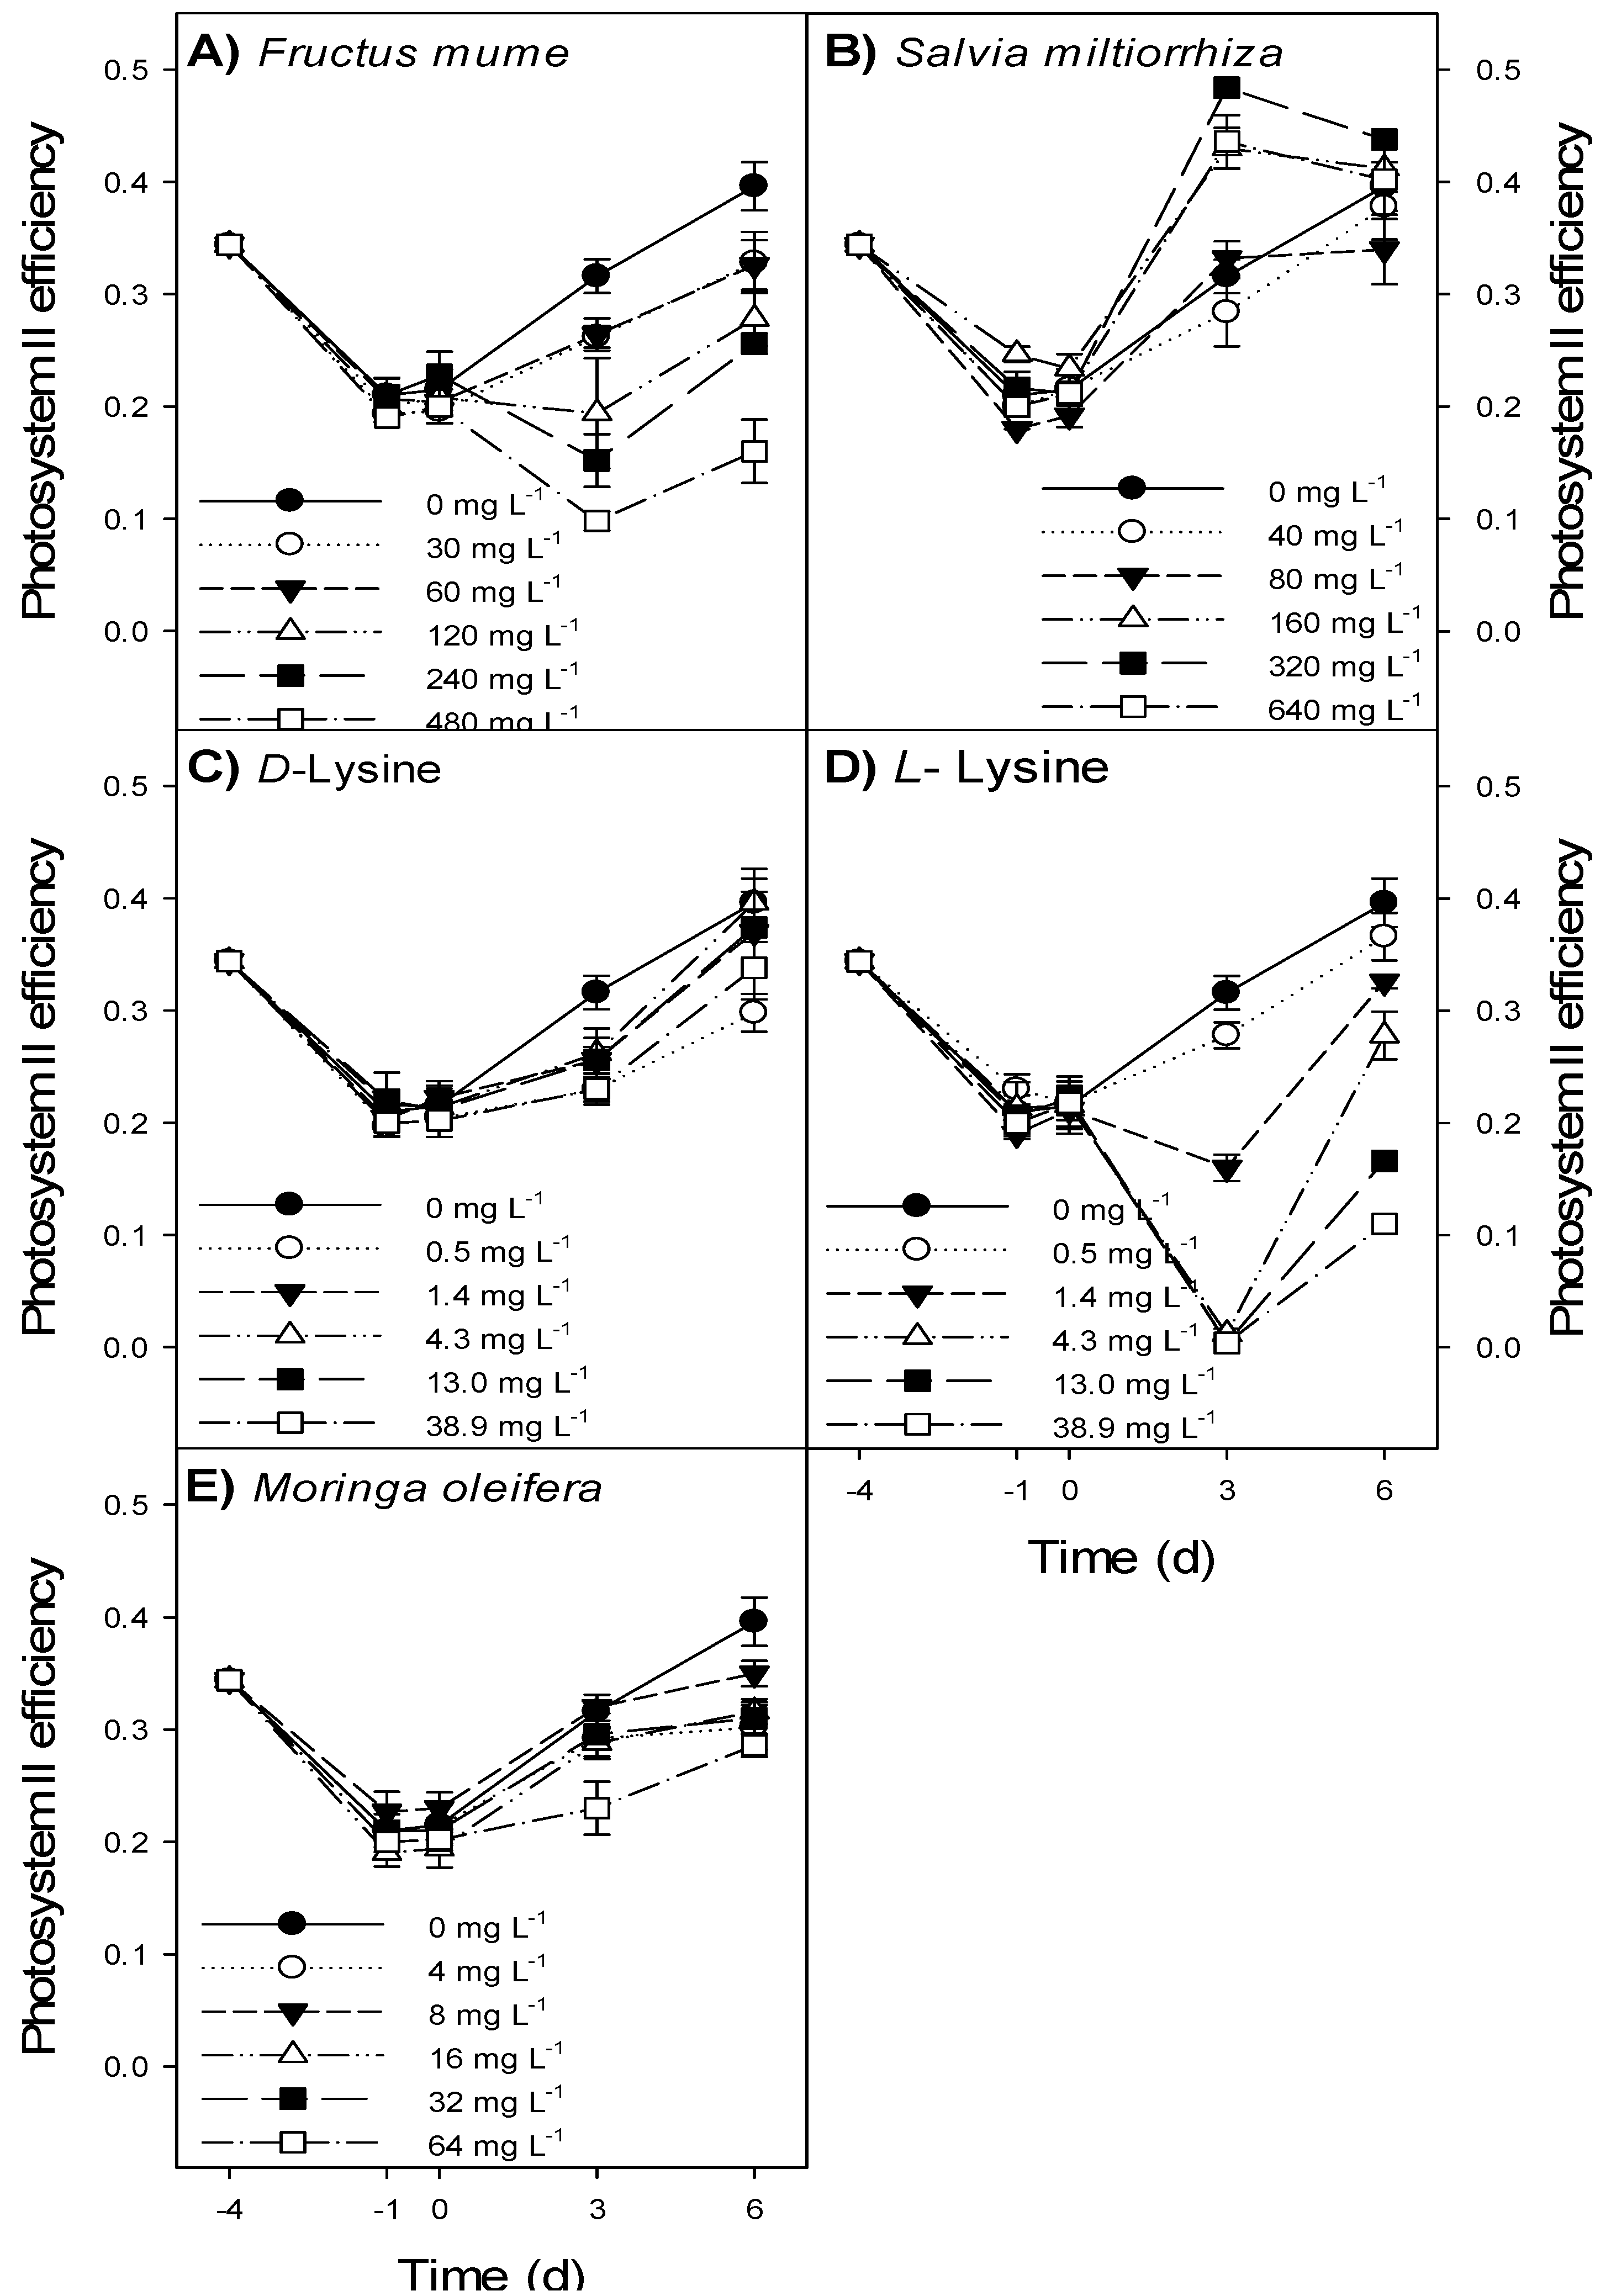
The range finding assay revealed that F. mume and S. miltiorrhiza extracts and l-lysine can inhibit growth of M. aeruginosa (Table 2). Based on these results the concentration range was further extended.

3.2. Bioassay

The CHLa concentration of M. aeruginosa populations was not affected by F. mume extract up to 60 mg L−1, reflected in strong exponential increase over time (Figure 1A). However, at 120 mg L−1 the increase in CHLa concentration was reduced, while it even declined after adding the extract in 240 and 480 mg L−1 (Figure 1A). Consequently, growth rates were significantly different; they were on average 0.47 d−1 in controls and F. mume extract up to 60 mg L−1, but negative at the two highest doses tested (Table 3). Extract of S. miltiorrhiza had no effect on M. aeruginosa CHLa concentrations up to 80 mg L−1. However, S. miltiorrhiza extracts at 160,320 and 640 mg L−1 did lower CHLa concentrations (Figure 1B). The growth rates were on average 0.48 d−1 in controls and S. miltiorrhiza extracts up to 80 mg L−1 Although growth rates were significantly reduced at higher doses, at the highest S. miltiorrhiza dose tested (640 mg L−1) growth was still 75% of the growth measured in controls, indicating considerable increase in M. aeruginosa population even in this highest dose (Table 3). d-lysine in the concentration range tested had no effect on the course of the CHLa concentrations in M. aeruginosa populations (Figure 1C) and growth rates were similar (Table 3). l-lysine caused a decline in CHLa concentrations in concentration at 4.3 mg L−1 and higher (Figure 1D), which was also expressed in significantly reduced growth rates (Table 3). Extract of M. oleifera seeds had no effect on CHLa concentrations up to dose 8 mg L−1 (Table 3). At 16 mg L−1 and higher M. oleifera extracts lowered the CHLa concentrations (Table 3). Three groups of significantly different growth rates were observed: 0–8 mg L−1 (group a), 16 and 32 mg L−1 (group ab) and 64 mg L−1 (group b) (Table 3; Figure 1E).
The biovolume-based growth rates in controls and F. mume extract up to 60 mg L−1 were on average 0.30 d−1, they were slightly lower in 120 mg L−1 (Table 4). No growth was observed after addition of F. mume extract at 240 and 480 mg L−1 (Table 4). Only the highest dose of S. miltiorrhiza extract (640 mg L−1) reduced the biovolume-based growth rate to 73% of that in the control, but this difference was not statistically significant (Table 4). d-lysine had no effect on biovolume-based growth rates, whereas l-lysine completely blocked growth in concentration of 4.3 mg L−1 and more (Table 4). The biovolume-based growth rate of M. aeruginosa in extract of M. oleifera seeds at 64 mg L−1 was 75% of that in control, but the difference was not statistically significant due to rather large within group variability (Table 4). The biovolume-based growth rates in controls (Table 4) were about 65% of the CHLa-based growth rates (Table 3).
The EC50 of F. mume extract to M. aeruginosa was 148 mg L−1 for CHLa-based growth and 128 mg L−1 for biovolume-based growth, while EC50 of l-lysine was 2.2 mg L−1 for CHLa-based growth and 1.7 mg L−1 for biovolume-based growth (Table 3 and Table 4). The EC50 for S. miltiorrhiza, M. oleifera and d-lysine were outside the concentration range tested, i.e., higher than 640, 64 and 38.9 mg L−1, respectively (Table 3 and Table 4).
Table 2. Growth rates (d−1) of Microcystis aeruginosa NIVA-CYA 43 grown for three days in different concentrations of l-lysine, including F- and P-value of a one-way ANOVA, as well as growth rates of M. aeruginosa exposed for two days to different concentrations of extracts from Fructus mume or Salvia miltiorrhiza, including F- and P-values of a two-way ANOVA. Values between brackets indicate one standard deviation (n = 3). Similar letters (a,b,c and α,β,γ) indicate homogenous groups that are not different at the p = 0.05 level (Holm-Sidak method).
Growth Rate (d−1)
Concentrationl-lysineConcentrationF. mumeS. miltiorrhiza
00.67 (0.03) a00.46 (0.05) α0.46 (0.05) α
10.52 (0.02) b30.45 (0.02) α0.40 (0.05) α
50.21 (0.02) c300−0.35 (0.04) β0.05 (0.04) γ
100.17 (0.01) cExtractF1,17 = 37.3p < 0.001
400.16 (0.04) cConcentrationF2,17 = 428.9p < 0.001
F4,14 = 282.3
p < 0.001
InteractionF2,17 = 56.7p < 0.001
Figure 1. Course of chlorophyll-a concentrations (CHL-a, µg L−1) in Microcystis aeruginosa NIVA-CYA 43 populations grown for four days (−4 to 0) in absence and six days (0 to 6) in presence of filtered extracts from Fructus mume (A); Salvia miltiorrhiza (B); or Moringa oleifera (C); and in different concentrations d-lysine (D) or l-lysine (E). Error bars indicate one standard error (n = 5).
Water 06 01807 g001
Table 3. Chlorophyll-a based growth rates (d−1) of Microcystis aeruginosa NIVA-CYA 43 exposed to different concentrations (C, mg L−1) of extracts from Fructus mume , Salvia miltiorrhiza, Moringa oleifera and d-and l-lysine, including F- and P-values of one-way ANOVAs, or H-values of Kruskal-Wallis One Way Analysis of Variance on Ranks. Values between brackets indicate one standard deviation (n = 5). Similar letters per column (a,b,c) indicate homogenous groups that are not different at the p = 0.05 level. Also given are EC50 values (mg L−1) and adjusted r2 of non-linear regression (four parameter logistic curve).
F. mumeS. miltiorrhizad-Lysinel-LysineM. oleifera
[C]growth (d-1)[C]growth (d-1)[C]growth (d-1)[C]growth (d-1)[C]growth (d-1)
00.47 (0.01) a00.47 (0.01) a00.47 (0.01) a00.47 (0.01) a00.47 (0.01) a
300.45 (0.08) a400.48 (0.02) a0.50.48 (0.01) a0.50.48 (0.01) a40.48 (0.01) a
600.48 (0.03) a800.48 (0.02) a1.40.48 (0.01) a1.40.38 (0.01) ab80.48 (0.01) a
1200.33 (0.05) ab1600.44 (0.02) b4.30.49 (0.01) a4.3−0.02 (0.01) b160.43 (0.07) ab
240−0.04 (0.03) ab3200.42 (0.02) b130.49 (0.02) a13−0.09 (0.02) b320.45 (0.02) ab
480−0.12 (0.01) b6400.35 (0.02) c38.90.48 (0.02) a38.9−0.13 (0.02) b640.26 (0.11) b
H5 = 26.6
p < 0.001
F5,34 = 40.6
p < 0.001
F5,34 = 1.94
p = 0.118
H5 = 31.0
p < 0.001
H5 = 20.7
p < 0.001
EC50 (mg L−1)
148 >640 >38.92.2 >64
r2adj
0.994 --- ---0.998 ---
Table 4. Biovolume-based growth rates (d−1) of Microcystis aeruginosa NIVA-CYA 43 exposed to different concentrations (C, mg L−1) of extracts from Fructus mume, Salvia miltiorrhiza, Moringa oleifera and d-and l-lysine, including F- and P-values of one-way ANOVAs, or H-values of Kruskal-Wallis One Way Analysis of Variance on Ranks. Values between brackets indicate one standard deviation (n = 5). Similar letters per column (a,b,c) indicate homogenous groups that are not different at the p = 0.05 level. Also given are EC50 values (mg L−1) and adjusted r2 of non-linear regression (four parameter logistic curve).
F. mumeS. miltiorrhizad-Lysinel-LysineM. oleifera
[C]growth (d-1)[C]growth (d-1)[C]growth (d-1)[C]growth (d-1)[C]growth (d-1)
00.31 (0.05) a00.31 (0.05) a00.31 (0.05) a00.31 (0.05) a00.31 (0.05) a
300.28 (0.04) a400.30 (0.00) a0.50.30 (0.00) a0.50.30 (0.00) a40.31 (0.02) a
600.31 (0.07) a800.30 (0.04) a1.40.30 (0.04) a1.40.30 (0.04) a80.31 (0.05) a
1200.25 (0.06) a1600.31 (0.04) a4.30.31 (0.04) a4.30.31 (0.04) a160.30 (0.04) a
2400.00 (0.01) b3200.31 (0.07) a130.31 (0.07) a130.31 (0.07) a320.29 (0.07) a
4800.00 (0.01) b6400.23 (0.10) a38.90.23 (0.10) a38.90.23 (0.10) a640.23 (0.05) a
F5,34 = 51.6
p < 0.001
F5,34 = 1.57
p = 0.201
F5,34 = 1.57
p = 0.201
F5,34 = 1.57
p = 0.201
F5,34 = 2.00
p = 0.109
EC50 (mg L−1)
128 >640 >38.91.7 >64
r2adj
0.985 --- ---0.991 ---
In all incubations, the ΦPSII changed significantly over time (Figure 2; Table 5). ΦPSII declined with higher concentrations of F. mume extract over the first three days of exposure, but all increased again between day 3 and 6 (Figure 2A). In S. miltiorrhiza, the rmANOVA also indicated a significant extract concentration effect (Table 5), but here the highest doses caused a significant increase in ΦPSII (Figure 2B). d-lysine had no effect on ΦPSII of M. aeruginosa (Figure 2C; Table 5), while l-lysine caused a significant drop in ΦPSII over the first three days where after ΦPSII increased again in all treatments (Figure 2D). M. oleifera seed extract had no significant effect on ΦPSII of M. aeruginosa (Figure 2E; Table 5).
Figure 2. Course of the Photosystem II efficiencies in Microcystis aeruginosa populations grown for four days (−4 d to 0 d) in the absence and six days (0 d to 6 d) in the presence of filtered extracts from Fructus mume (A); Salvia miltiorrhiza (B); in presence of different concentrations d-lysine (C); l-lysine (D); and in Moringa oleifera seed extract (E). Error bars indicate one standard error (n = 5).
Water 06 01807 g002
Table 5. Summary of repeated measures ANOVAs of Photosystem II efficiencies in Microcystis aeruginosa NIVA-CYA 43 populations exposed to different concentrations of extracts from Fructus mume, Salvia miltiorrhiza, Moringa oleifera and d-and l-lysine. Significant differences (p < 0.05) are indicated in bold. If needed (Mauchly’s test), degrees of freedom (df) were corrected using Greenhouse-Geisser estimates of sphericity if epsilon <0.75 or the Huynh-Feldt correction if epsilon >0.75.
F. mumeS. miltiorrhiza
Tests of Within-Subjects Effects
SourcedfFPdfFP
Time3.7984.4<0.0014134.4<0.001
Time × concentration18.98.13<0.001204.52<0.001
Error53.1 60
Tests of between-Subjects Effects
SourcedfFPdfFP
Concentration59.91<0.00156.240.003
Error15 15
D-lysineL-lysine
Tests of Within-Subjects Effects
SourcedfFPdfFP
Time3.82193.6<0.0014183.1<0.001
Time × concentration19.12.290.0082026.2<0.001
Error57.3 60
Tests of between-Subjects Effects
SourcedfFPdfFP
Concentration51.060.422521.8<0.001
Error15 15
M. oleifera
Tests of Within-Subjects Effects
SourcedfFP
Time4123.7<0.001
Time × concentration203.48<0.001
Error60
Tests of between-Subjects Effects
SourcedfFP
Concentration52.660.065
Error15
The addition of d-lysine, l-lysine and M. oleifera seed extract had no effect on pH; pH values were between 7.4 and 7.7. The pH of the M. aeruginosa populations was slightly decreased with increasing concentrations of S. miltiorrhiza extract; pH dropped from 7.7 in controls to 7.2 in the highest dose of S. miltiorrhiza extract (640 mg L−1). Extract of F. mume caused a significant (H5 = 32.7; p < 0.001) decrease in pH with increasing extract concentrations of F. mume reaching a pH as low as 3.8 in the highest F. mume dose (Figure 3). The pH at the end of the six day incubation period was still significantly different (H5 = 26.3; p < 0.001) among F. mume treatments, but where controls reached as high as 10.3, pH in the highest dose had recovered to a pH of 7.4 (Figure 3).
Figure 3. Effect of different concentrations filtered extracts from Fructus mume on pH of Microcystis aeruginosa NIVA-CYA 43 populations just after addition (day 0) and after six days of growth (day 6). Error bars indicate 1SD (n = 5) and similar symbols above the bars indicate homogenous groups that are not different at the p = 0.05 level.
Water 06 01807 g003
Adding d-or l-lysine to the M. aeruginosa populations slightly increased the EC from 278 (±6) µS cm−1 in controls to 294 (±3) µS cm−1 in 38.9 mg L−1 d-lysine and 296 (±3) µS cm−1 in 38.9 mg L−1 l-lysine. Extract of M. oleifera seeds had no effect on EC that remained 279 (±6) µS cm−1 in all treatments. In contrast, S. miltiorrhiza extract significantly increased EC (H5 = 23.9; p < 0.001) from 278 (±6) µS cm−1 in controls to 315 (±3) µS cm−1 in 640 mg L−1, while F. mume extract significantly elevated (H5 = 18.4; p = 0.002) EC to 362 (±2) µS cm−1 in 480 mg L−1.

4. Discussion

We hypothesized that a sufficiently high concentration of each compound would reduce the growth of M. aeruginosa and diminish M. aeruginosa biomass. However, only F. mume extract at ≥240 mg L−1 and l-lysine at ≥4.3 mg L−1 caused a decline in M. aeruginosa biomass. Despite the low pH values measured (pH 4.4 and 3.8), M. aeruginosa recovered in the ≥240 mg L−1 F. mume treatments. The low pH is most probably caused by organic acids, such as citric acid and malic acid in F. mume extract [30]. The inhibiting effect of F. mume can be attributed these compounds [19] leading to the low pH as a major driving force for the lytic effects. Another member of the Microcystaceae, Anacystis nidulans, died at pH < 4.5 [31]. Likewise, a suspension of “Effective Microorganisms” (EM-A) containing a high concentration of organic acids only affected M. aeruginosa growth and reduced biomass when dosed at such high concentrations that the pH had dropped to a pH ~3.5 [32]. This organic acid rich EM formulation caused inhibition in several bacteria, but the growth inhibition disappeared after the pH was adjusted from 3.7 to 6.5 [33]. Hence, low pH as a result of the organic acids seems the most likely explanation for observed decline and growth inhibition in M. aeruginosa. The concentration of F. mume extract that completely inhibited growth in our study (240 mg L−1) was lower than the 780 mg L−1 reported previously [19], which might be caused by slightly different extract procedure (½ h vs. 1 h boiling). Also the organic acid content of the F. mume fruits depends on their ripeness [34]. A low pH (pH 4.4 and 3.8) as measured in the ≥240 mg L−1 F. mume treatments, however, is not compliant with the WFD standards for pH in different lake types (pH ≥ 5.5) [35]. The addition of relatively high amounts of organic matter through a field application of the compounds under study here, as well as their possible consequential lysis of the M. aeruginosa cells could imply an increase in nutrient concentrations. Inasmuch as the effects of F. mume or l-lysine are only temporary and no complete wipe-out of M. aeruginosa occurred, as was evident from the observed recovery in ΦPSII, the cyanobacterium is expected to quickly recover. Moreover, the increased nutrient concentrations may enhance bacterial growth, hence reduce oxygen concentrations, which may lead to an increased release of phosphates from the lake’s sediment, therefore aggravate the cyanobacterial nuisance rather than mitigate. Both low pH and relative high organic matter addition present major drawbacks that will not favor decisions by water authorities for applications.
In case of l-lysine, pH seems not to play a role as in the highest dose the pH of 7.4 was very close to those in the controls. Our study confirms results of several other studies that l-lysine can inhibit M. aeruginosa. We determined an EC50 of around 2 mg L−1 and a complete inhibition at 4.3 mg L−1, which is close to values reported in the literature. However, there is considerable among strain and species variability in sensitivity reported in the literature (Table 6). Hence, the generalization “l-lysine is one of most interesting natural antialgal compounds (...) it shows an inhibitory effect against cyanobacteria at 0.6 mg L−1” [18] finds no support in the literature. l-lysine seems to be effective against several nuisance species, but apparently not all, implying more experiments are needed, especially ones including field populations as growth forms of M. aeruginosa for example might differ substantially between the laboratory—mostly unicells—and the field—mainly as colonies, often embedded in mucous [36].
Table 6. Overview of effects or no effects of L-lysine on various Microcystis strains reported in the literature.
Species/StrainEffectConcentration L-lysineReference
M. aeruginosa N–87, N–98complete lysis1.2 mg L−1[38,39]
M. viridis N–102
M. aeruginosa N–88lysis2.4 mg L−1
M. wesenbergii N–604
M. aeruginosa N-905 mg L−1
M. viridiskilled1 mg L−1[22]
M. aeruginosa N-44, N-298inhibited, no complete lysis10 mg L−1[39]
M. aeruginosano effect/inhibition0.5/5 mg L−1[25]
M. aeruginosa 3 strainsdecline/stabilization5 mg L−1[40]
M. viridis NIES 102inhibited3.65 mg L−1[23]
M. novacekii7.3 mg L−1
M. aeruginosa TAC 71-1, M. ichthioblabesignificant growth7.3 mg L−1
M. wesenbergii N-104, N–111hardly affected/no effect10 mg L−1[38]
d-Lysine had no effect on M. aeruginosa in our study, which is in agreement to the findings of others [25]. However, considering the strong among strain/species variability observed in response to l-lysine, it is possible that d-lysine might inhibit growth of other species, such as M. viridis [22].
The effect of S. miltiorrhiza root extract in our study was less than reported in the literature, where extract of 800 mg L−1 caused an inhibition of 95% [20]. This difference could be due to different extracting procedures: methanolic extracts that were reconstituted in DSMO [20], whereas in our study a water extract was used. The EC50 of the water extract in our study was above 640 mg L−1, while others found EC50 values of 99 mg L−1 for ethyl-acetate, 111 mg L−1 for chloroform and 370 mg L−1 for methanol extracts [20]. An active compound in the ethyl-acetate extract has been identified as neo-przewaquinone A with a corresponding EC50 value of 4.7 mg L−1 [37]. It has been proposed that active ingredients with anti-algal activity should be extracted for formulation of a natural algicide [20]. Although the example of S. miltiorrhiza root extract shows purification can lower the EC50 value and thus application dose, this procedure results in a much higher price [16] and limited availability [18].
The highest dose of M. oleifera seed extract (64 mg L−1) reduced CHLa-based growth only by 45% compared to controls and biovolume-based growth only by 26%. However, in another study 20 mg L−1 of seed extract caused strong population decline (−0.25 d−1) [21]. A possible explanation might be the different initial cyanobacteria densities between the current study (94.4 μg L−1 CHLa) and [21] (13.4 μg L−1), as EC50 values increase, and thus sensitivity decreases, with higher initial algal densities [41]. This seems further supported by the experiments in [21] where a blooming density of M. aeruginosa (~270 μg L−1 CHLa) was less affected by M. oleifera seed extract than a lower M. aeruginosa density (13.4 μg L−1 CHLa). Alternatively, the storage time between the two experiments could have influenced the effectiveness as has been found for the coagulating effect of M. oleifera seed extract [42]. The coagulating effect of M. oleifera seed extract is another important feature that was not included in the current study as flasks were continuously shaken. Up to 97% of the algae present in raw Nile water could be removed by coagulation with M. oleifera seed extracts [43]. Effective coagulation dose (50–500 mg L−1) was reported comparable or higher than that of alum [44], but in general effective doses are rather high; the best removal efficiency of M. aeruginosa was achieved with concentration >200 mg L−1 [45], whereas for M. protocystis this was 50 or 175 mg L−1 depending on the turbidity [46]. Overall, it seems that under blooming conditions of cyanobacteria higher dose of seed extract is needed to reduce the bloom where coagulating properties could act in synergy with the cyanobactericidal effect. Such high dose might, however, come with some serious drawbacks of organic carbon and nutrient inputs that can cause odor, taste, and color problems and promote microorganisms growth [47,48].
Of the compounds examined in this study, l-lysine seemed the most promising fast acting curative intervention. It could decimate M. aeruginosa standing biomass at effective concentration of a few mg L−1 assuming field populations are equally sensitive as laboratory strains. Applying one ton in a dose of 5 mg L−1 could treat 2 × 10⁵ m3 M. aeruginosa infested water at a product cost of less than one cent per m3 lake water (bulk price l-lysine around € 1500 per ton [49]). Nonetheless, the effect might be short-lived as ΦPSII of M. aeruginosa recovered after six days in our study, while a pond treated with 7.3 mg L−1 l-lysine showed a strong effect on Microcystis during the first 4 days, slight recovery after 5 to 8 days, followed by growth reaching almost pretreatment Microcystis densities after 11 days [23]. Similarly, an enclosure of 100 m2 treated with l-lysine (6.7–7.7 mg L−1) showed a sharp decline in Microcystis, but recovery started after one week [50]. Therefore, if l-lysine would have to be applied every two—three weeks to control cyanobacteria, costs will rise substantially over the season. In addition, potential effects of organic carbon and nitrogen enrichment (adding l-lysine at 5 mg L−1 would imply a nitrogen enrichment of 0.96 mg N L−1) on ecosystem functioning should be studied first. This is further corroborated by [23], who observed in a repetition of their pond experiment an almost complete absence of Microcystis for almost two weeks, but after a short Euglena peak, another cyanobacterium, Phormidium tenue, had become dominant. Likewise, in enclosures treated with 20 mg L−1 l-lysine, Microcystis was strongly inhibited, but replaced by Euglena and Anabaena, while oxygen concentrations dropped to below 1 mg L−1 and ammonium went up to above 3 mg L−1 [39]. Treatment of a larger enclosure with l-lysine (6.7–7.7 mg L−1) led oxygen drop to about 70% of that in the control [50]. Also lysis of the M. aeruginosa cells could enhance decomposition and reduce oxygen concentrations. Moreover, cell lysis is considered the major mechanism of release of microcystins into the surrounding water [51]. Hence, it remains to be seen if treatment with l-lysine delivers immediate improve of the water quality. Repeated additions of l-lysine are expected to influence water quality, while the replacement with other cyanobacteria [23,39] illustrates that the earlier mentioned among strain and species variability in sensitivity to l-lysine might present a major drawback in its applicability in cyanobacterial control.
Resuming, the results of our study gave no support to any of the tested plant extracts and amino-acid as promising candidates for curative application in M. aeruginosa bloom control. It therefore seems that water authorities should focus more on alternative treatments of (often positively buoyant) Microcystis blooms, and cyanobacteria blooms in general. Combined coagulant/flocculants and ballast [52] that entrap cyanobacteria cells/colonies as intact cells and sink them to the sediment [53] are one of such promising alternatives.

5. Conclusions

From the results of our controlled experiments to test extracts from Fructus mume, Salvia miltiorrhiza and Moringa oleifera as well as l-lysine and d-Lysine as curative measures to rapidly suppress the cyanobacterium Microcystis aeruginosa NIVA-CYA 43 we conclude that:
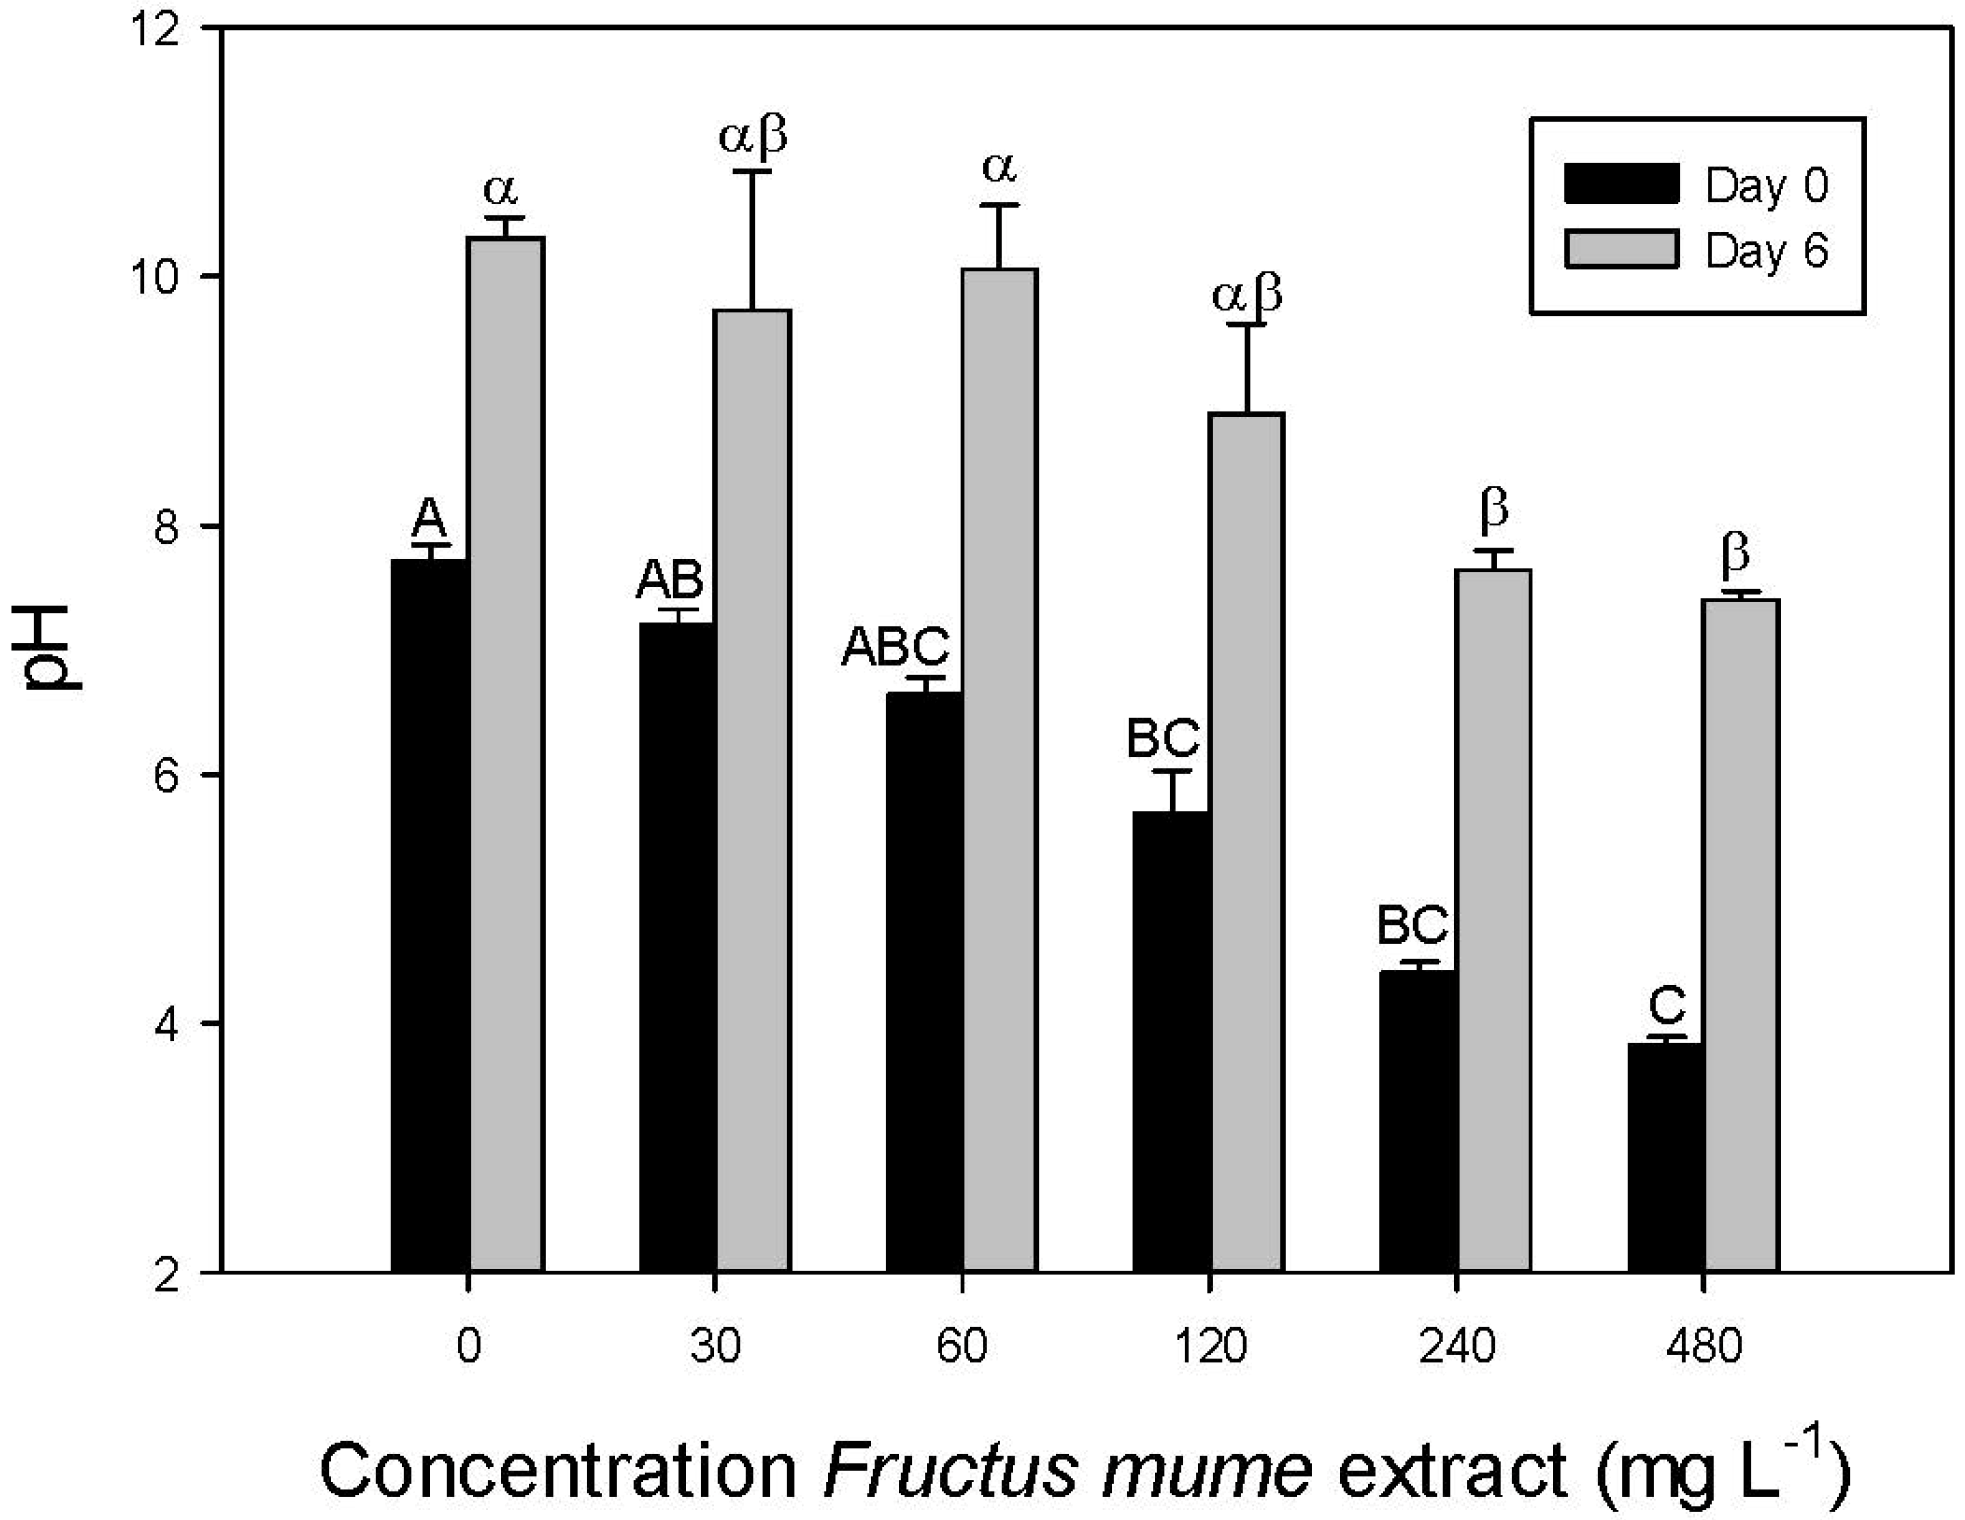
  • Fructus mume extract at ≥240 mg L−1 and l-lysine at ≥4.3 mg L−1 caused a decline in Microcystis aeruginosa NIVA-CYA 43 biomass.
  • The effect of F. mume extracts is most probably caused by low pH.
  • Salvia miltiorrhiza, Moringa oleifera and d-Lysine had no relevant effect on M. aeruginosa biomass.
  • All treatments had a short-lived effect only and did not cause a complete wipe-out of M. aeruginosa.
  • Our results do not favor the application of the compounds tested as method to mitigate blooms of cyanobacteria in the field.

Acknowledgments

We thank Wendy Beekman and Chiel van Brunschot for their help in performing the experiments and analyses. Frank van Oosterhout was sponsored by the Dutch Foundation for Underwater Parks (SNOP).

Author Contributions

Miquel Lürling and Frank van Oosterhout designed the experiment, analyzed the data and wrote the manuscript.

Appendix

Table A1. Overview of experimental conditions, such as medium type, volume of experimental units, inoculum densities, light regime (intensity–light dark regime), temperature, shaking and duration, of studies performed to investigate the effect of plant extracts or lysine on growth of cyanobacteria. Mv = Microcystis viridis, Ma = M. aeruginosa, Mw = M. wesenbergii, Mi = M. ichthioblabe, Mn = M. novacekii, Pa = Pseudanabaena articulata, Pp = Planktothrix perornata.
CyanobacteriaMediumVolumeInitial densityLight (µmol m−2 s−1)TempShakingTimeReference
MvMA5 mL105 cells mL−1????no48 hKaya and Sano 1996 [22]
Ma, Pa, PpBG11550 mL??53−12:12 L:D22 °Cyes96 hZimba et al., 2001 [25]
Ma, Mv, MwCB10 mL106 cells mL−150−12:12 L:D22 °Cno48 hHehmann et al., 2002 [38]
Ma, Mi, Mn, MvCT100 mL??2000 lx30 °Cno35 dTakamura et al., 2004 [23]
MaBG110.2 mL106 cells mL−13000 lx−16:8 L:D25 °Cno7 dYang et al., 2009 [19]
MaWC50 mL13.4, 269 µg CHLa L−1~57−18:6 L:D22 °C40 rpm11,14 dLürling and Beekman 2010 [21]
MaBG1120 mL106 cells mL−190−14:10 L:D (?)25 °C (?)3 × d−17 dYi et al., 2012 [20]
MaBG11??4.6 × 10⁶ cells mL−1 (?)20−12:1230 °C40 rpm??Liu et al., 2013 [24]

Conflicts of Interest

The authors declare no conflict of interest.

References

  1. Smith, V.H.; Tilman, G.D.; Nekola, J.C. Eutrophication: Impacts of excess nutrient inputs on freshwater, marine, and terrestrial ecosystems. Environ. Pollut. 1999, 100, 179–196. [Google Scholar] [CrossRef]
  2. Conley, D.J.; Paerl, H.W.; Howarth, R.W.; Boesch, D.F.; Seitzinger, S.P.; Havens, K.E.; Lancelot, C.; Likens, G.E. Controlling eutrophication by reducing both nitrogen and phosphorus. Science 2009, 323, 1014–1015. [Google Scholar] [CrossRef]
  3. Chorus, I.; Falconer, I.R.; Salas, H.J.; Bartram, J. Health risks caused by freshwater cyanobacteria in recreational waters. J. Toxicol. Environ. Health B 2000, 3, 323–347. [Google Scholar] [CrossRef]
  4. Codd, G.A. Cyanobacterial toxins, the perception of water quality, and the prioritization of eutrophication control. Ecol. Eng. 2000, 16, 51–60. [Google Scholar] [CrossRef]
  5. Dittmann, E.; Wiegand, C. Cyanobacterial toxins—Occurrence, biosynthesis and impact on human affairs. Mol. Nutr. Food Res. 2006, 50, 7–17. [Google Scholar] [CrossRef]
  6. Lürling, M.; van Oosterhout, F. Case study on the efficacy of a lanthanum-enriched clay (Phoslock®) in controlling eutrophication in Lake Het Groene Eiland (The Netherlands). Hydrobiologia 2013, 710, 253–263. [Google Scholar] [CrossRef] [Green Version]
  7. Yang, S.-Q.; Liu, P.-W. Strategy of water pollution prevention in Taihu Lake and its effects analysis. J. Great Lakes Res. 2010, 36, 150–158. [Google Scholar] [CrossRef]
  8. Sivonen, K.; Jones, G. Cyanobacterial toxins. In Toxic Cyanobacteria in Water A Guide to Their Public Health Consequences, Monitoring and Management; Chorus, I., Bartram, J., Eds.; E&FN Spon: London, UK, 1999; pp. 41–111. [Google Scholar]
  9. de Figueirdo, D.R.; Azeiteiro, U.M.; Esteves, S.M.; Gonçalves, F.J.M.; Pereira, M.J. Microcystin-producing blooms—A serious global public health issue. Ecotoxicol. Environ. Saf. 2004, 59, 151–163. [Google Scholar] [CrossRef]
  10. Ibelings, B.W.; Stroom, J.M.; Lürling, M.F.L.L.W.; Kardinaal, W.E.A. Netherlands: Risks of toxic cyanobacterial blooms in recreational waters and guidelines. In Current Approaches to Cyanotoxin Risk Management, Risk Management and Regulations in Different Countries; Chorus, I., Ed.; Federal Environment Agency: Dessau Roβlau, Germany, 2012; pp. 82–96. [Google Scholar]
  11. Faassen, E.J.; Lürling, M. Occurrence of the microcystins MC-LW and MC-LF in Dutch surface waters and their contribution to total microcystin toxicity. Mar. Drugs 2013, 11, 2643–2654. [Google Scholar] [CrossRef]
  12. European Union. Directive 2000/60/EG of the European Parliament and of the Council establishing a framework for the Community action in the field of water policy of 23 October. Off. J. Eur. Union 2000, L327, 1–72. [Google Scholar]
  13. European Union. Directive 2006/7/EC of the European Parliament and of the Council of 15 February 2006 concerning the management of bathing water quality and repealing Directive 76/160/EEC. Off. J. Eur. Union 2006, L64, 37–51. [Google Scholar]
  14. Schindler, D.W.; Hecky, R.E.; Findlay, D.L.; Stainton, M.P.; Parker, B.R.; Paterson, M.J.; Beaty, K.G.; Lyng, M.; Kasian, S.E.M. Eutrophication of lakes cannot be controlled by reducing nitrogen input: Results of a 37-year whole-ecosystem experiment. Proc. Nat. Acad. Sci. USA 2008, 105, 11254–11258. [Google Scholar] [CrossRef]
  15. Smith, V.H.; Schindler, D.W. Eutrophication science: Where do we go from here? Trends Ecol. Evol. 2009, 24, 201–207. [Google Scholar] [CrossRef]
  16. Jančula, D.; Maršálek, B. Critical review of actually available chemical compounds for prevention and management of cyanobacterial blooms. Chemosphere 2011, 85, 1415–1422. [Google Scholar] [CrossRef]
  17. Hu, H.; Hong, Y. Algal-bloom control by allelopathy of aquatic macrophytes—A review. Front Environ. Sci. Engin China 2008, 2, 421–438. [Google Scholar] [CrossRef]
  18. Shao, J.; Li, R.; Lepo, J.E.; Gu, J.-D. Potential for control of harmful cyanobacterial blooms using biologically derived substances: Problems and prospects. J. Environ. Manag. 2013, 125, 149–155. [Google Scholar] [CrossRef]
  19. Yang, J.-D.; Hu, L.-B.; Zhou, W.; Yin, Y.-F.; Chen, J.; Shi, Z.-Q. Lysis of Microcystis aeruginosa with extracts from Chinese medicinal herbs. Int. J. Mol. Sci. 2009, 10, 4157–4167. [Google Scholar] [CrossRef]
  20. Yi, Y.-L.; Lei, Y.; Yin, Y.-B.; Zhang, H.-Y.; Wang, G.-X. The antialgal activity of 40 medicinal plants against Microcystis aeruginosa. J. Appl. Phycol. 2012, 24, 847–856. [Google Scholar] [CrossRef]
  21. Lürling, M.; Beekman, W. Anti-cyanobacterial activity of Moringa oleifera seeds. J. Appl. Phycol. 2010, 22, 503–510. [Google Scholar] [CrossRef]
  22. Kaya, K.; Sano, T. Algicidal compounds in yeast extract as a component of microbial culture media. Phycologia 1996, 35, 117–119. [Google Scholar] [CrossRef]
  23. Takamura, Y.; Yamada, T.; Kimoto, A.; Kanehama, N.; Tanaka, T.; Nakadaira, S.; Yagi, O. Growth inhibition of Microcystis cyanobacteria by L-Lysine and disappearance of natural Microcystis blooms with spraying. Microb. Environ. 2004, 19, 31–39. [Google Scholar] [CrossRef]
  24. Liu, Y.-M.; Chen, M.-J.; Wang, M.-H.; Jia, R.-B.; Li, L. Inhibition of Microcystis aeruginosa by the extracellular substances from an Aeromonas sp. J. Microb. Biotechnol. 2013, 23, 1304–1307. [Google Scholar] [CrossRef]
  25. Zimba, P.V.; Dionigi, C.P.; Brashear, S.S. Selective toxicity of exogenous l-lysine to cyanobacteria, relative to a chlorophyte and a diatom. Phycologia 2001, 40, 483–486. [Google Scholar] [CrossRef]
  26. Qiang, H.; Richmond, A. Productivity and photosynthetic efficiency of Spirulina platensis as affected by light intensity, algal density and rate of mixing in a flat plate photobioreactor. J. Appl. Phycol. 1996, 8, 139–145. [Google Scholar] [CrossRef]
  27. Shao, J.; Peng, L.; Luo, S.; Yu, G.; Gu, J.-D.; Lin, S.; Li, R. First report on the allelopathic effect of Tychonema bourrellyi (Cyanobacteria) against Microcystis aeruginosa (Cyanobacteria). J. Appl. Phycol. 2013, 25, 1567–1573. [Google Scholar] [CrossRef]
  28. Lürling, M.; Beekman, W. Palmelloids formation in Chlamydomonas reinhardtii: Defence against rotifer predators? Ann. Limnol. 2006, 42, 65–72. [Google Scholar] [CrossRef]
  29. Lürling, M.; van der Grinten, E. Life-history characteristics of Daphnia exposed to dissolved microcystin-LR and to the cyanobacterium Microcystis aeruginosa with and without microcystins. Environ. Toxicol. Chem. 2003, 22, 1281–1287. [Google Scholar] [CrossRef]
  30. Chen, J.Y.; Zhang, H.; Matsunaga, R. Rapid determination of the main organic acid composition of raw Japanese apricot fruit juices using near-infrared spectroscopy. J. Agric. Food Chem. 2006, 54, 9652–9657. [Google Scholar] [CrossRef]
  31. Lee, L.; Lustigman, B.; Chu, I.-Y.; Jou, H.-L. Effect of aluminum and pH on the growth of Anacystis nidulans. Bull. Environ. Contam Toxicol. 1991, 46, 720–726. [Google Scholar] [CrossRef]
  32. Lürling, M.; Tolman, Y.; Euwe, M. Mitigating cyanobacterial blooms: How effective are “effective microorganisms”? Lakes Reserv. Res. Manag. 2009, 14, 353–363. [Google Scholar] [CrossRef]
  33. Van Egeraat, A.W.S.M. EM1 and the growth of microorganisms. In Microorganisms in EM; Wageningen University: Wageningen, The Netherlands, 1998. [Google Scholar]
  34. Na, J.-R.; Oh, K.-N.; Park, S.-U.; Bae, D.; Choi, E.J.; Jung, M.A.; Choi, C.Y.; Lee, D.-W.; Jun, W.; Lee, K.Y.; et al. The laxative effects of Maesil (Prunus mume Siebold & Zucc.) on constipation induced by a low-fibre diet in a rat model. Int. J. Food Sci. Nutr. 2013, 64, 333–345. [Google Scholar] [CrossRef]
  35. Evers, N. Getalswaarden bij de goede ecologische toestand voor oppervlaktewater voor de algemene fysisch-chemische kwaliteitselementen temperatuur, zuurgraad, doorzicht, zoutgehalte en zuurstof; STOWA: Utrecht, The Netherlands, 2007. (In Dutch) [Google Scholar]
  36. Geng, L.; Qin, B.; Yang, Z. Unicellular Microcystis aeruginosa cannot revert back to colonial form after short-term exposure to natural conditions. Biochem. Syst. Ecol. 2013, 51, 104–108. [Google Scholar] [CrossRef]
  37. Zhang, C.; Yi, Y.-L.; Hao, K.; Liu, G.-L.; Wang, G.-X. Algicidal activity of Salvia miltiorrhiza Bung on Microcystis aeruginosa—Towards identification of algicidal substance and determination of inhibition mechanism. Chemosphere 2013, 93, 997–1004. [Google Scholar] [CrossRef]
  38. Hehmann, A.; Kaya, K.; Watanabe, M.M. Selective control of Microcystis using an amino acid—A laboratory assay. J. Appl. Phycol. 2002, 14, 85–89. [Google Scholar] [CrossRef]
  39. Hehmann, A.; Watanabe, M.M.; Kaya, K. Killing of Microcystis by an amino acid: Results of laboratory and enclosure experiments. Verh. Int. Verein Limnol. 2002, 28, 1147–1150. [Google Scholar]
  40. Lin, B.-G.; Yang, L.-Y.; Xiao, L.; Ji, J.; Yuan, Y.; Yao, Y. Mechanism of lysine inhibiting Microcystis aeruginosa cells. J. Ecol. Rural Environ. 2008, 24, 68–72. [Google Scholar]
  41. Moreno-Garrido, I.; Lubian, L.M.; Soares, A.M.V.M. Influence of cellular density on determination of EC50 in microalgal growth inhibition tests. Ecotoxicol. Environ. Saf. 2000, 47, 112–116. [Google Scholar] [CrossRef]
  42. Katayon, S.; Megat Mohd Noor, M.J.; Asma, M.; Abdul Ghani, L.A.; Thamer, A.M.; Azni, I.; Ahmad, J.; Khor, B.C.; Suleyman, A.M. Effects of storage conditions of Moringa oleifera seeds on its performance in coagulation. Biores Technol. 2006, 97, 1455–1460. [Google Scholar] [CrossRef]
  43. Shehata, S.; Badr, S.; Wahba, S. Drinking water treatment options for eliminating freshwater algae. Int. J. Environ. Stud. 2002, 59, 679–688. [Google Scholar] [CrossRef]
  44. Ndabigengesere, A.; Subba Narasiah, K.; Talbot, B.G. Active agents and mechanism of coagulation of turbid waters using Moringa oleifera. Water Res. 1995, 29, 703–710. [Google Scholar] [CrossRef]
  45. Nishi, L.; Madrona, G.S.; Guilherme, A.L.F.; Vieira, A.M.S.; Araújo, A.A.; Ugri, M.C.B.A.; Bergamasco, R. Cyanobacteria removal by coagulation/flocculation with seeds of the natural coagulant Moringa oleifera Lam. Chem. Engin Trans. 2011, 24, 1129–1134. [Google Scholar]
  46. Camacho, F.P.; Bongiovani, M.C.; Arakawa, F.S.; Shimabuku, Q.L.; Vieira, A.M.S.; Bergamasco, R. Advanced processes of cyanobacteria and cyanotoxins removal in supply water treatment. Chem. Eng. Trans. 2013, 32, 421–426. [Google Scholar]
  47. Madsen, M.; Schlundt, J.; Omer, E.F.E. Effect of water coagulation by seeds of Moringa oleifera on bacterial concentrations. J. Trop. Med. Hyg. 1987, 90, 101–109. [Google Scholar]
  48. Ndabigengesere, A.; Narasiah, K.D. Quality of water treated by coagulation using Moringa oleifera seeds. Water Res. 1998, 32, 781–791. [Google Scholar] [CrossRef]
  49. Made-in-China.com. Available online: http://www.made-in-china.com/products-search/hot-china-products/L-Lysine.html (accessed on 25 April 2014).
  50. Kaya, K.; Liu, Y.-D.; Shen, Y.-W.; Xiao, B.-D.; Sano, T. Selective control of toxic Microcystis water blooms using lysine and malonic acid: An enclosure experiment. Environ. Toxicol. 2005, 20, 170–178. [Google Scholar] [CrossRef]
  51. Zhou, S.; Shao, Y.; Gao, N.; Deng, Y.; Qiao, J.; Ou, H.; Deng, J. Effects of different algaecides on the photosynthetic capacity, cell integrity and microcystin-LR release of Microcystis aeruginosa. Sci. Total Environ. 2013, 463–464, 111–119. [Google Scholar] [CrossRef]
  52. Li, L.; Pan, G. A universal method for flocculating harmful algal blooms in marine and fresh waters using modified sand. Environ. Sci. Technol. 2013, 47, 4555–4562. [Google Scholar] [CrossRef]
  53. Lürling, M.; van Oosterhout, F. Controlling eutrophication by combined bloom precipitation and sediment phosphorus inactivation. Water Res. 2013, 47, 6527–6537. [Google Scholar] [CrossRef]

