Article

Development of a Continuous Phytoplankton Culture System for Ocean Acidification Experiments

1
Institute for Marine and Antarctic Studies, University of Tasmania, Private Bag 129, Hobart, Tasmania 7001, Australia
2
Antarctic Climate & Ecosystems Cooperative Research Centre, University of Tasmania, Private Bag 80, Hobart, Tasmania 7001, Australia
3
CSIRO Wealth from Oceans Flagship, Division of Marine and Atmospheric Research, GPO Box 1538, Hobart, Tasmania 7000, Australia
4
Australian Antarctic Division, 203 Channel Hwy, Kingston, Tasmania 7050, Australia
*
Author to whom correspondence should be addressed.
Water 2014, 6(6), 1860-1872; https://doi.org/10.3390/w6061860
Submission received: 6 February 2014 / Revised: 23 May 2014 / Accepted: 4 June 2014 / Published: 17 June 2014

Abstract

:
Around one third of all anthropogenic CO2 emissions have been absorbed by the oceans, causing changes in seawater pH and carbonate chemistry. These changes have the potential to affect phytoplankton, which are critically important for marine food webs and the global carbon cycle. However, our current knowledge of how phytoplankton will respond to these changes is limited to a few laboratory and mesocosm experiments. Long-term experiments are needed to determine the vulnerability of phytoplankton to enhanced pCO2. Maintaining phytoplankton cultures in exponential growth for extended periods of time is logistically difficult and labour intensive. Here we describe a continuous culture system that greatly reduces the time required to maintain phytoplankton cultures, and minimises variation in experimental pCO2 treatments over time. This system is simple, relatively cheap, flexible, and allows long-term experiments to be performed to further our understanding of chronic responses and adaptation by phytoplankton species to future ocean acidification.

1. Introduction

A human-induced increase in atmospheric pCO2 is changing the carbonate chemistry of the oceans. Termed “ocean acidification”, these changes may threaten a range of marine organisms [1,2,3,4,5,6]. To better understand and predict the impact of ocean acidification on marine organisms, experimental research must simulate natural changes in ocean chemistry.
A range of methods have been applied to manipulate seawater pH and CO2 concentrations in ocean acidification experiments, with different effects on the carbonate chemistry [7,8]. This has made it difficult to compare results [2,9,10] and therefore this issue has been addressed by the publication of a number of best practice guides for ocean acidification research [11,12,13,14]. There is no consensus on the need or duration of acclimation periods prior to experiments [12], however, it is now common practice to acclimate cells for about 7–9 generations [2,15] before any measurements are taken. Furthermore, medium- to long-term ocean acidification experiments performed over many generations are recommended to assess natural plasticity [12].
In phytoplankton experiments on the effects of perturbations, such as altered seawater carbonate chemistry, algae are commonly maintained in exponential growth phase, so that changes among treatments are not masked by differences due to growth stage [16,17,18]. Maintaining constant cell physiology also translates into consistent rates of CO2 draw-down, which makes it easier to maintain stable carbonate chemistry for the duration of the experiment.
There are two ways to maintain phytoplankton in exponential growth, either semi-continuous or continuous cultures. Semi-continuous culturing requires dilution of the exponentially growing culture with fresh medium at regular intervals. The frequent culture dilutions can be time consuming and labour intensive, particularly for long-term experiments. Depending on how often the dilutions are performed, periodic variations in nutrient concentrations can also affect the physiological state of the cells [19,20]. For ocean acidification experiments with phytoplankton, reduction of culture medium pCO2 by photosynthesis is of particular concern and this is affected by cell density. Preliminary experiments by the authors showed that an exponentially growing semi-continuous diatom culture decreased the average pCO2 to around 159 µatm despite being continuously bubbled with 390 ppm ambient air (data not shown).
The problems commonly associated with semi-continuous culturing can be minimised by use of a continuous system, which provides constant dilution of cultures and supplies fresh nutrients, thereby avoiding episodic changes in the cell physiology. Through the continuous influx of pCO2-adjusted media, carbonate chemistry is stabilized even at higher cell densities. Furthermore, the portion of the culture that is replaced by fresh media can be collected for analysis, thereby circumventing the issues arising from episodic large removal of cells such as during semi-continuous culturing. The use of an automated system can also reduce the time and effort needed to maintain experimental conditions. Therefore our aim was to design a simple, flexible and comparatively cheap continuous culture system for use in ocean acidification experiments that automatically supplies fresh media at the target pCO2 with a pCO2 stability comparable to that of other long-term experiments. Our experiments used three Antarctic phytoplankton species namely, the prasinophyte Pyramimonas gelidicola, the haptophyte Phaeocystis antarctica and the diatom Fragilariopsis cylindrus.

2. Materials and Methods

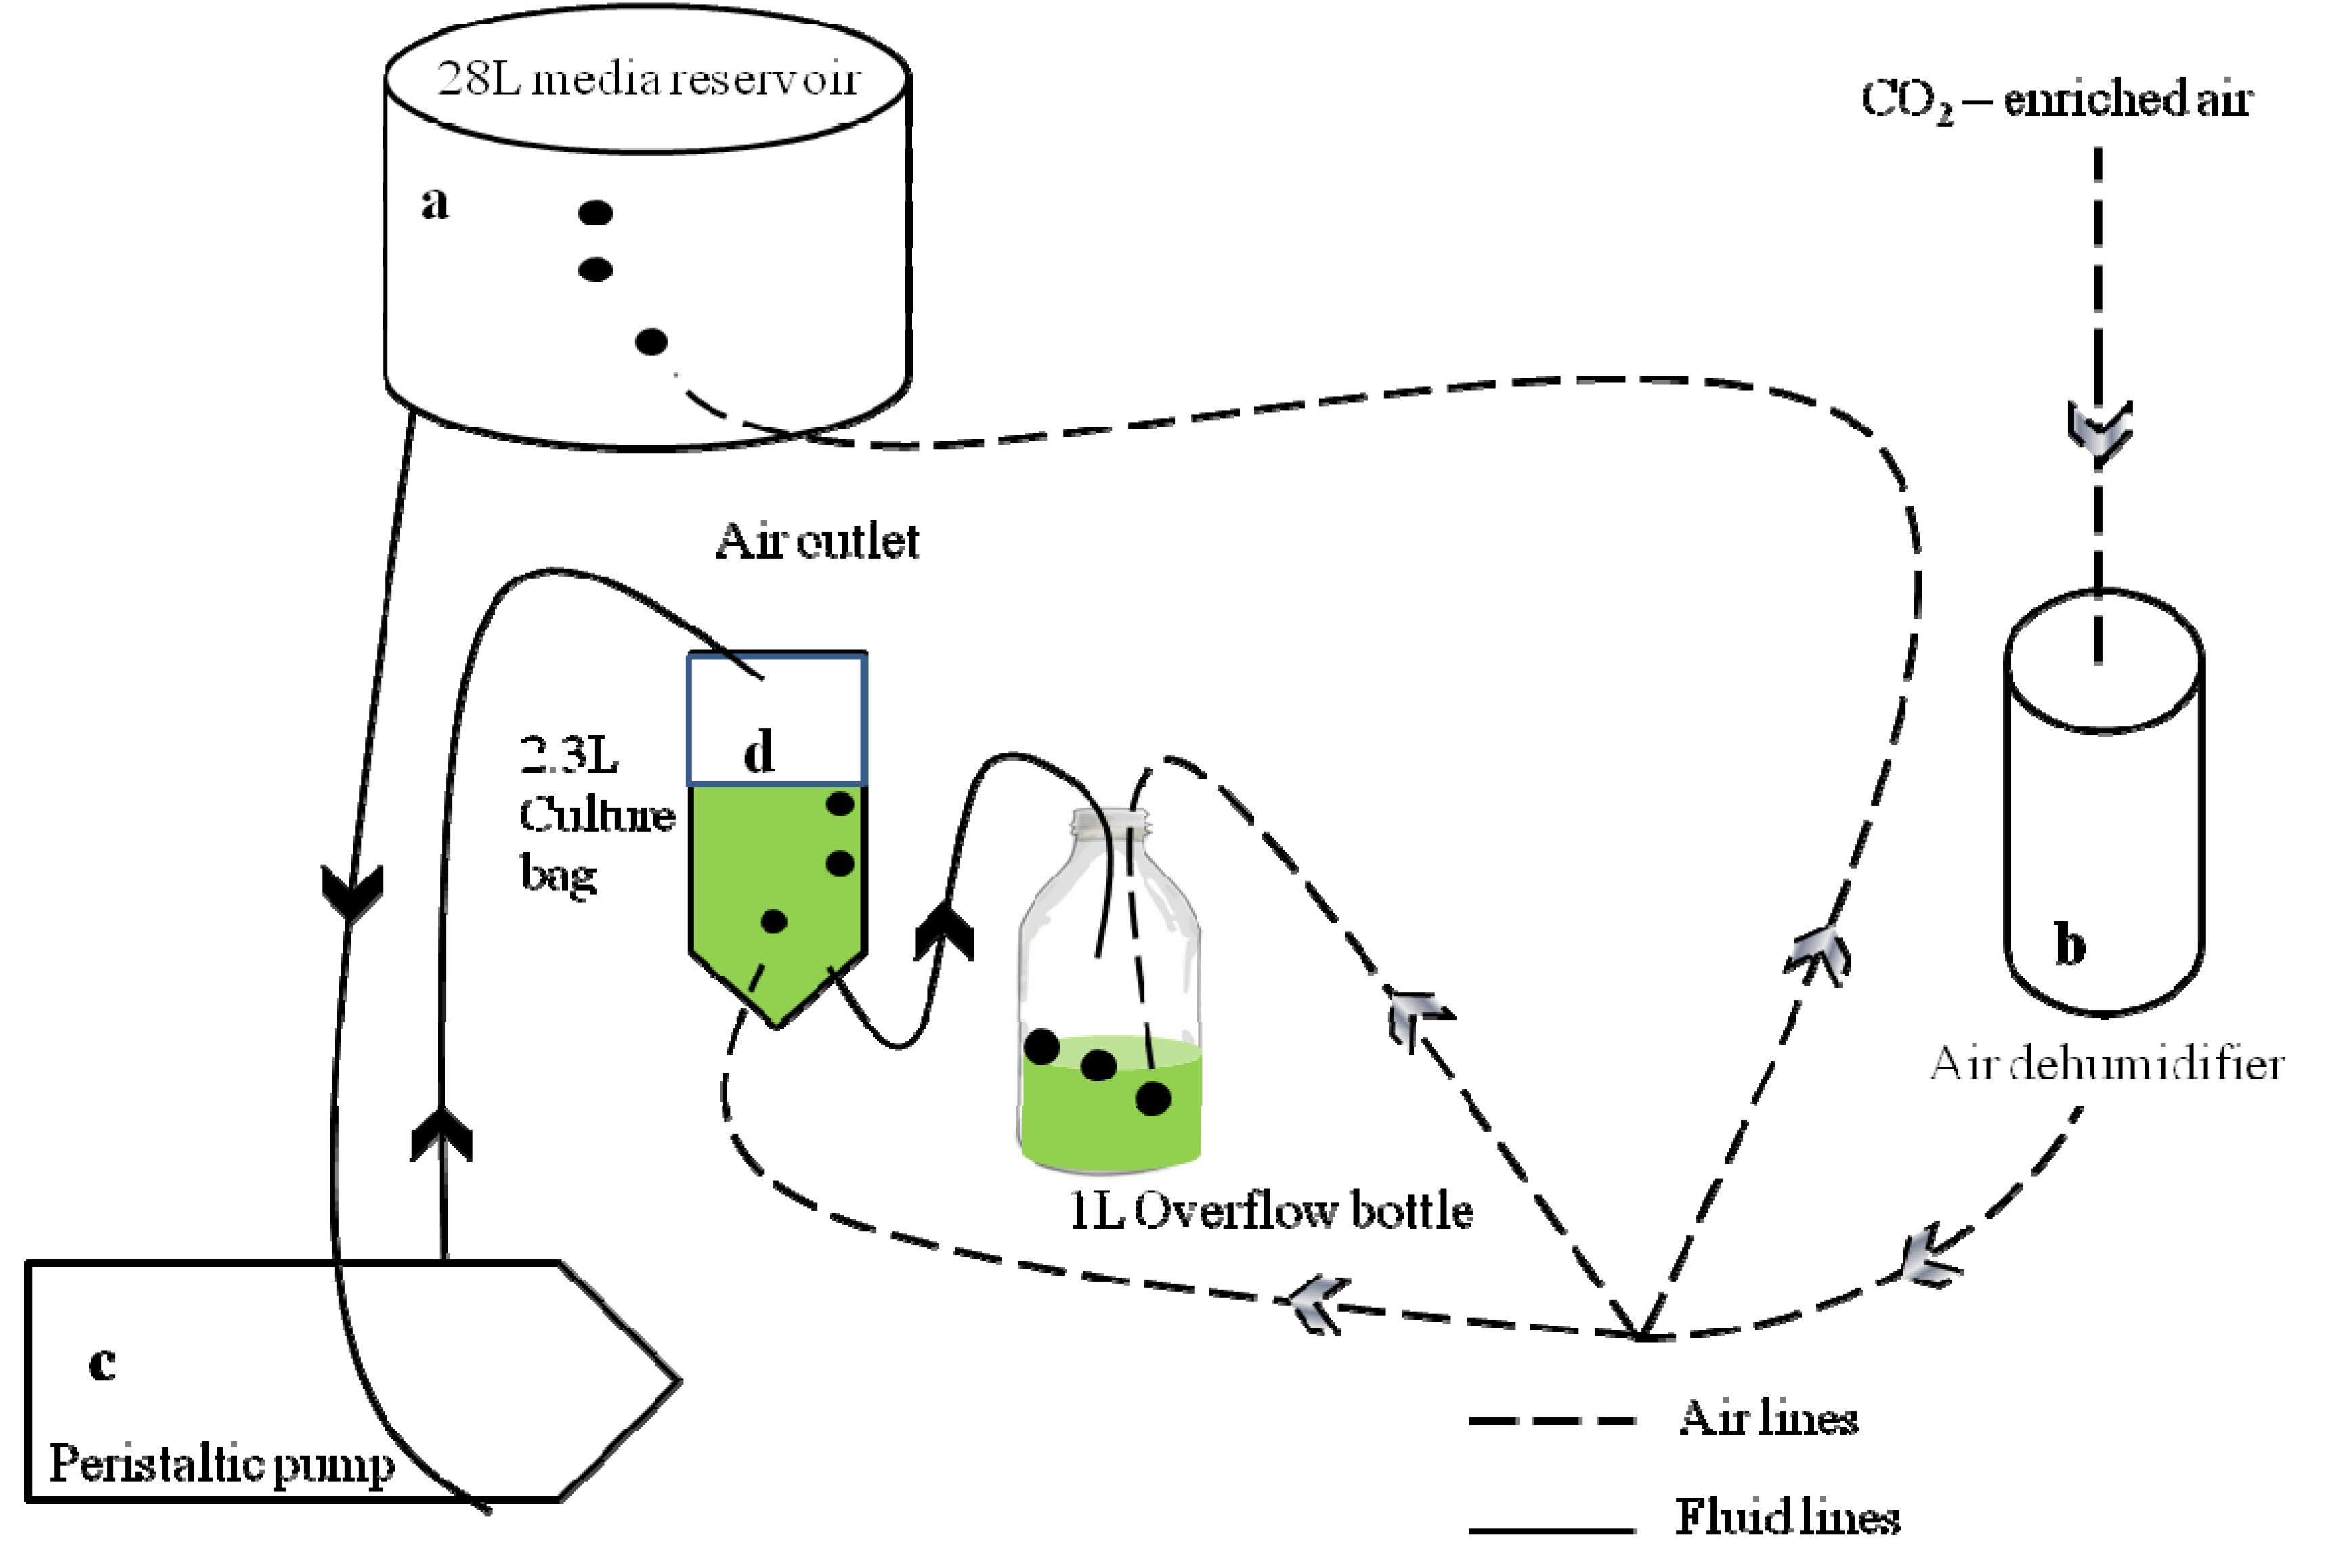
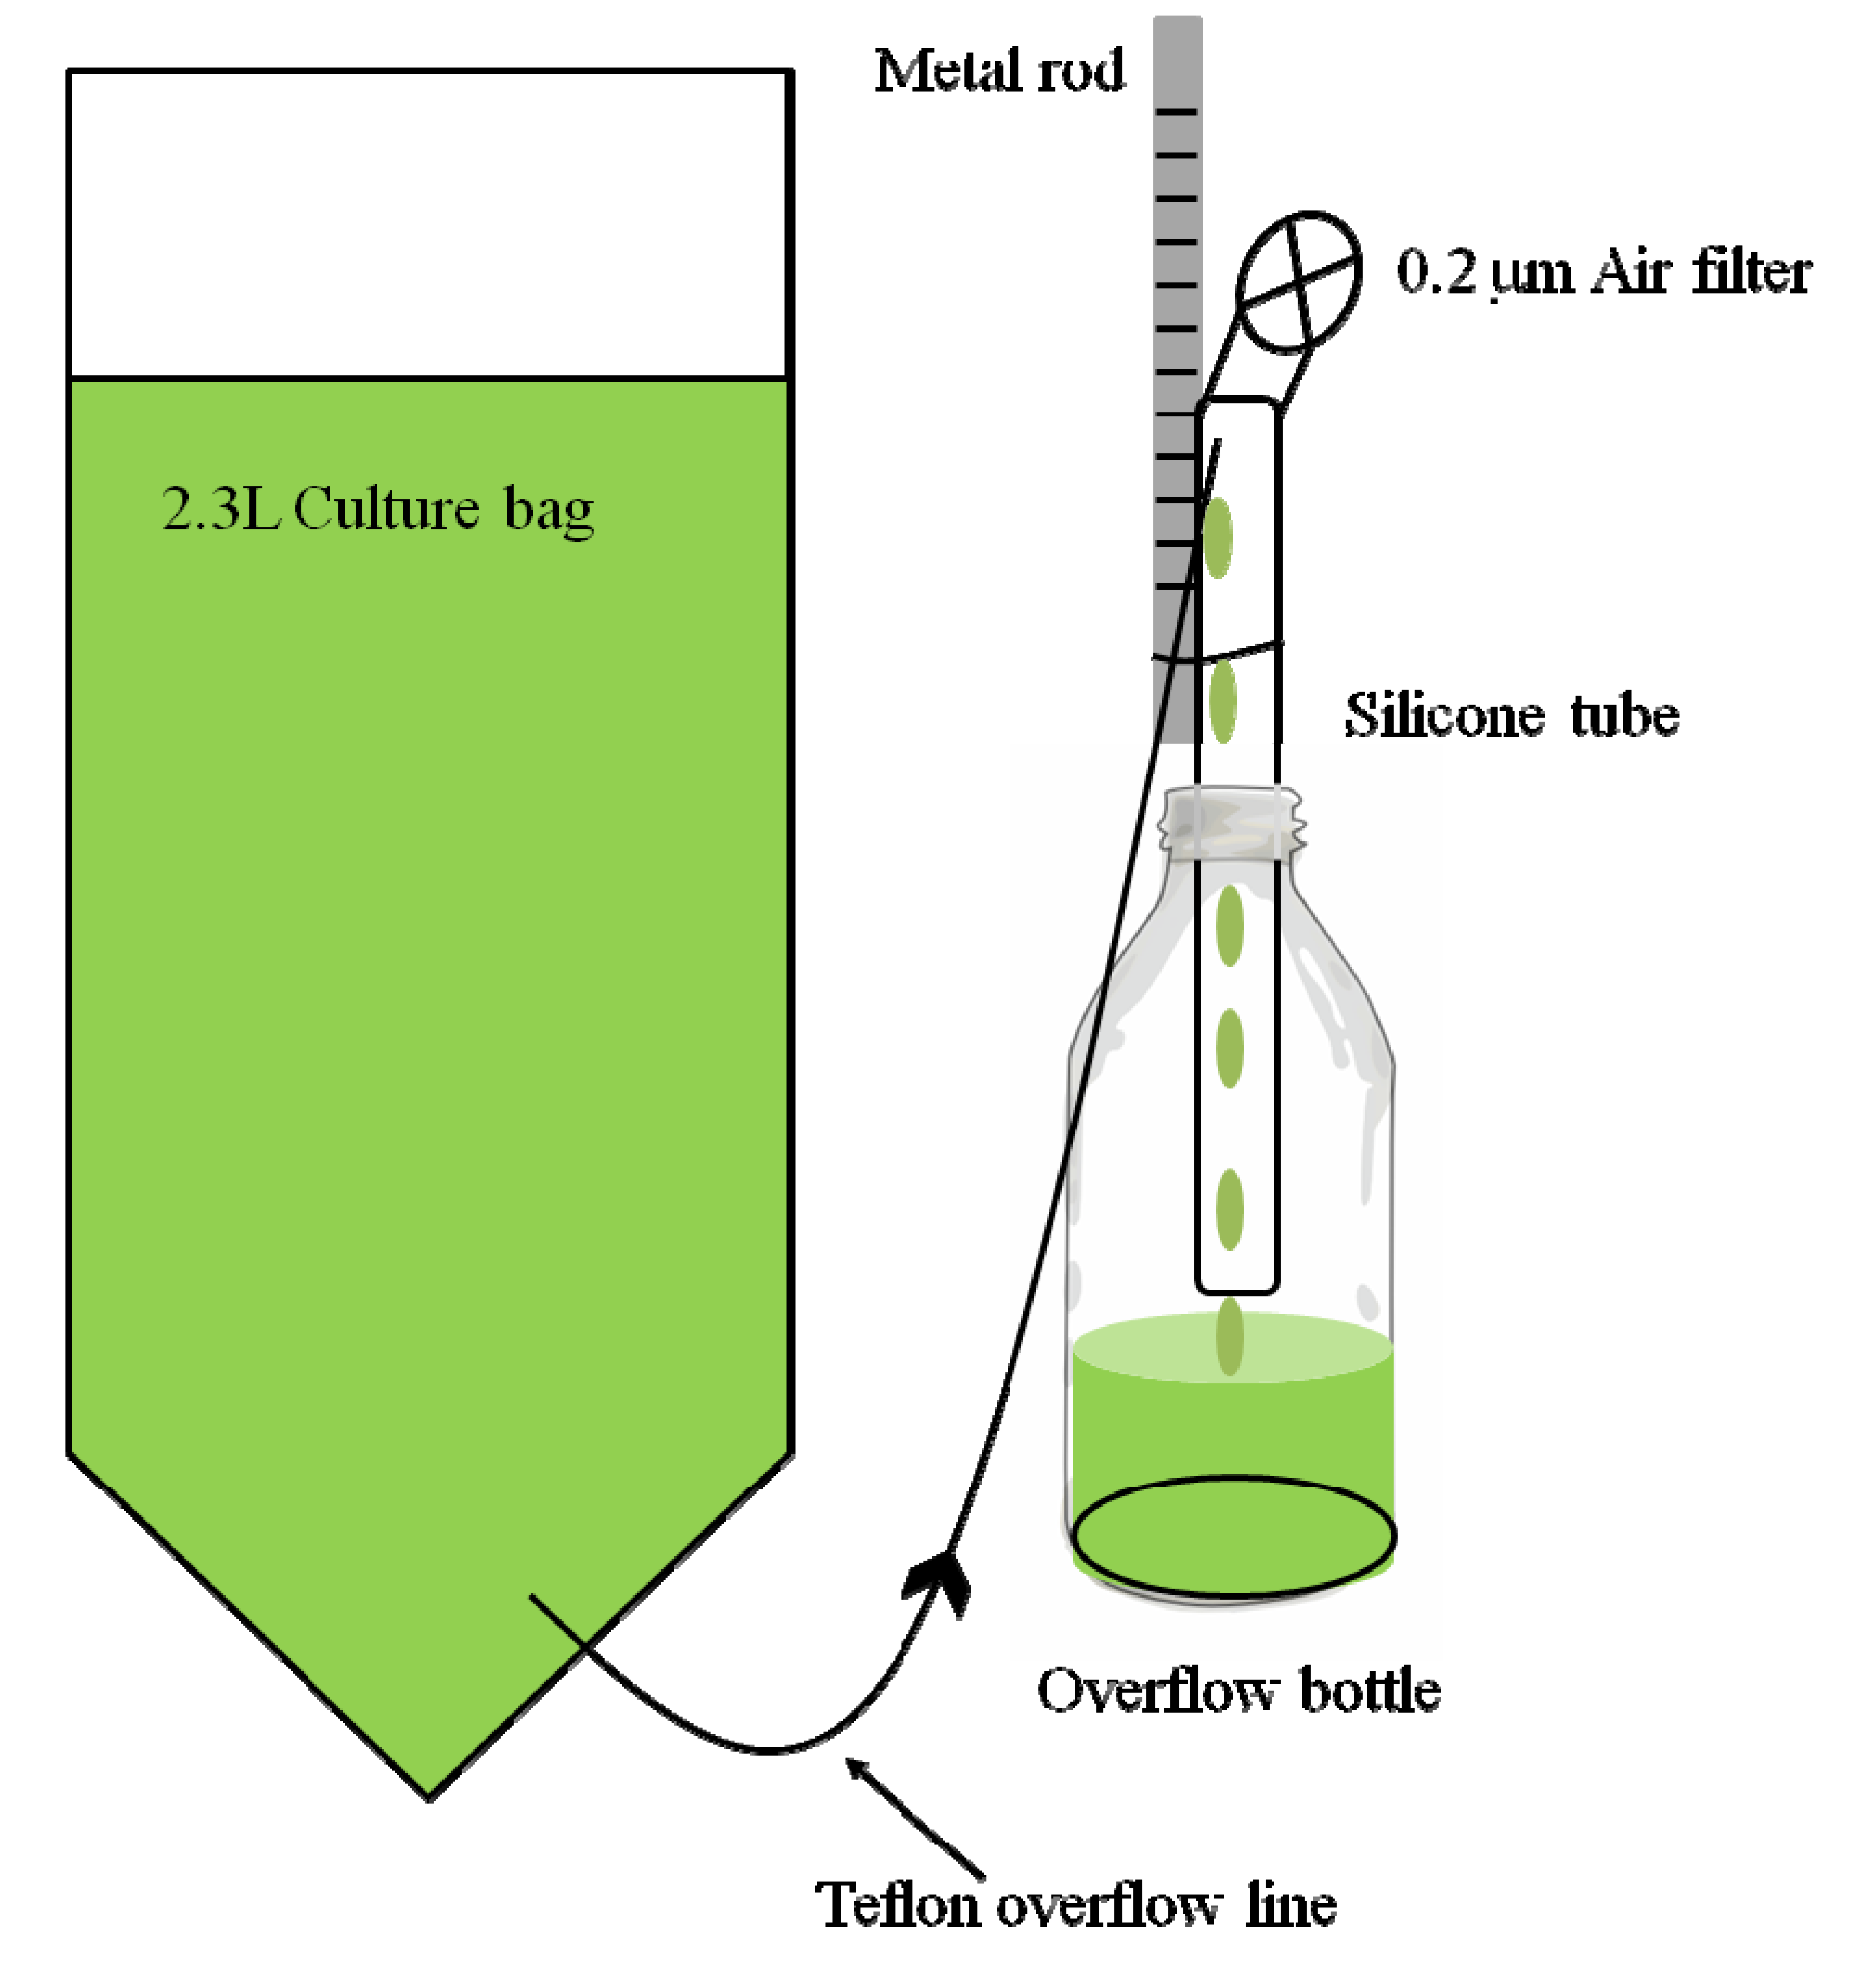
2.1. Experimental Design and Materials

Our continuous culture system was used to grow phytoplankton species with triplicate culture bags for each of three CO2-enriched treatments and one control treatment supplied with ambient air. Dilution rates of the bags were controlled by varying the effective culture volume within each bag, rather than the flow rate of nutrient addition to each bag. This allowed use of two 12-channel peristaltic pumps rather than 24 single-channel pumps that would otherwise be required. The two 12-channel pumps (Masterflex, John Morris Scientific Pty Ltd, Chatswood, NSW, Australia) supplied a constant flow of fresh culture medium to 24 phytoplankton cultures (in this case with two separate species, 12 bags per species, 3 bags per CO2 treatment) to maintain the cells in exponential growth (Figure 1). Each culture bag was inoculated with a clonal culture of phytoplankton and randomly attributed to the treatments and subsequently the peristaltic pumps delivered a total volume of 1.8 L of medium to the cultures. Initial cell densities for each species were: Fragilariopsis cylindrus ~2400 cells/mL, Pyramimonas gelidicola ~8000 cells/mL and Phaeocystis antarctica ~ 9500 cells/mL. We chose f/2 medium [21,22] as it lacks any buffer that could affect the carbonate chemistry and trace metal speciation in the growth medium, which would thereby affect medium pH and phytoplankton growth [7]. Nitrate and phosphate were adjusted to concentrations reported where these species were isolated from (near-shore coastal waters around O’Gorman Rocks, off Davis Station Antarctica [23,24]). Silicate concentrations were lower than around O’Gorman Rocks but not limiting [25,26]. Once the species had reached exponential growth, the peristaltic pumps were set to a rate that maintained exponential growth at a constant cell density.
For a constant supply of fresh medium there were eight media reservoirs, two for each CO2 treatment. The reservoirs were made out of transparent, sterile, polyethylene plastic culture growth bags (Entapack Pty Ltd, Dandenong, VIC, Australia). The peristaltic pumps were connected to the media reservoirs via manifolds that allowed the switch from one reservoir to the other once one was depleted. The empty reservoirs were filled with filter sterilized media and bubbled with CO2-enriched air of the respective pCO2. Culture bags were custom-made from the same material (Entapack Pty Ltd, Dandenong, VIC, Australia), heat-sealed to a prescribed pattern and held up to 2.3 L. The culture bags tapered towards the base where the CO2-air inlet was positioned (Figure 2). The conical shape of the culture bag and the position of the air inlet ensured mixing of the entire bag contents and minimized cells settling out of the water column. The bags were hung from a metal frame in three rows of eight.
We used 2.06 mm internal diameter (ID, silicone tubing (Masterflex, John Morris Scientific Pty Ltd, Chatswood, NSW, Australia)) for media transport and 5 cm long Teflon tips (2.13 mm ID) to puncture the culture bags for media supply. Dilution of each bag caused the culture to overflow via 2.13 mm ID Teflon tube connected to large silicone tubing (2.57 mm ID) into a sterile 1 L glass overflow bottle (Figure 2). Each overflow bottle was located next to the culture and flushed with CO2 mixture to ensure the same treatment conditions (light, temperature and CO2) as the experimental culture. The contents of the overflow bottle were then sampled for experimental analyses.
Figure 1. Overview schematic diagram of the ocean acidification continuous system. For simplicity only one CO2 treatment and culture bag is shown (a) Eight 28 L media reservoirs supplied the cultures with media of the respective pCO2. The reservoirs were continuously bubbled with CO2-enriched air of the respective concentration; (b) Air/CO2-mix bubbling through the reservoirs, all culture bags and overflow bottles was first dehumidified by passing through a silica-gel filled cylinder with an activated charcoal stage at the end to remove any organic contaminants; (c) Peristaltic pumps delivered the media from the reservoirs to each culture bag at a rate equivalent to the growth rate of the culture; (d) Culture bags and overflow bottles were continuously bubbled to maintain stable carbonate chemistry. Dilution of culture with fresh medium caused the culture to overflow into a sterile 1 L bottle, the content of which was used for subsequent analyses. Further details of the overflow bottle arrangements are depicted in Figure 2 [27].
Water 06 01860 g001
Teflon tubing was used for the overflow line as it is chemically inert, can be autoclaved and is very smooth, thereby avoiding settlement and/or adhesion of cells to the tube wall. The overflow silicone tubing was open to outside pressure by means of a 0.2 µm air-filter on top. This ensured excess culture gently overflowed into the bottles rather than establishing a siphon.
The dilution rate of each culture was adjusted by changing the culture volume of each bag rather than the flow rate, since the multichannel pumps delivered the same inflow of media to each bag. The position of the Teflon overflow line in relation to the culture bag controlled the rate of culture flowing out of the bag gravimetrically. The lower the tip of the Teflon line compared to the culture bag the more culture overflowed. The rate of culture overflowing determined the overall volume of each culture bag. Adjustment of the culture volume in this way, while influx of media was constant, was a flexible method to adjust dilution rates individually for each culture bag. Thus cell abundance could be maintained in each bag, despite any differences in growth rate among species and CO2 treatments. The position of the Teflon overflow line was adjusted by moving it up and down a metal rod, fastened next to each overflow bottle.
Figure 2. Schematic diagram of a culture bag and its attached overflow bottle. As the peristaltic pump added media to the bag, excess culture flowed through the 1 mm Teflon overflow line into a silicone tube and dripped from there into the overflow bottle. The height of the top of the Teflon overflow line relative to the culture bag controlled the flow rate of culture out of the bag: the lower the tip of the Teflon line compared to the culture bag, the greater the flow rate. The position of the Teflon overflow line was adjusted by moving it up and down a metal rod, fastened next to each overflow bottle. Individual adjustment of the outflow relative to the constant rate of influx from the peristaltic pump (Figure 1) could be used to determine the overall volume of each culture bag. The silicone tube was open to the outside pressure via a 0.2 µm air filter to prevent the culture from siphoning out of the culture bag. For simplicity air lines and air outlets are not included in this diagram.
Water 06 01860 g002

2.2. Experimental Conditions

The cultures, overflow bottles and media reservoirs were kept in a temperature controlled refrigerator, maintained at an average 2.9 °C. The culture bags were positioned in front of fluorescent lights with irradiance of 267 ± 6.9 µmol·m−2·s−1, approximating the light intensities at 5 m water depth around Davis Station, East Antarctica [28]. Each culture and overflow bottle was continuously bubbled with ~270 mL/min CO2–regulated air to achieve the target pCO2 concentrations for the experimental treatments. On the basis of an average atmospheric pCO2 of 390 ppm and constant air flow rates, the required addition of food grade CO2 gas (BOC, Hobart, TAS, Australia) was calculated and added with mass flow controllers (Horiba STEC SEC-E-40). CO2 could also be added to control cultures to compensate for photosynthetically-driven CO2 draw-down in dense cultures. The CO2-enriched air passed through silica gel to absorb moisture and reduce condensation in air lines once it entered the refrigerator. Activated charcoal removed any organic contaminants, and 0.2 µm filters at the entry to each culture, overflow bottle and media reservoir assured sterility. To maintain constant pCO2, the medium supplied to each culture was continuously bubbled with CO2-enriched air of the respective concentration.

2.3. Carbonate Chemistry

To monitor carbonate chemistry daily in the culture bags, pH was measured with a Mettler Toledo Multi Seven pH meter (Mettler-Toledo Ltd., Port Melbourne, VIC, Australia), calibrated to fresh Tris- and Aminopyridine artificial seawater buffer, made according to the SOP 6a in “Guide to best practices for ocean CO2 measurements” [11]. Alkalinity samples (50 mL) were taken at regular intervals, poisoned with 25 µL saturated mercuric chloride solution and stored refrigerated in the dark until analysis in a closed cell on a Total Alkalinity Titrator ATT-05 (Kimoto, Osaka, Japan). A temperature probe logged the air temperature inside the refrigerator every 30 min. CO2 concentrations were calculated with the CO2SYS.BAS Excel programme [29] based on total alkalinity, pH (seawater scale), temperature (average of 2.9 ± 0.5 °C) and nutrient concentrations using the constants after Mehrbach et al. [30] as refitted after Dickson and Millero [31].

3. Results and Discussion

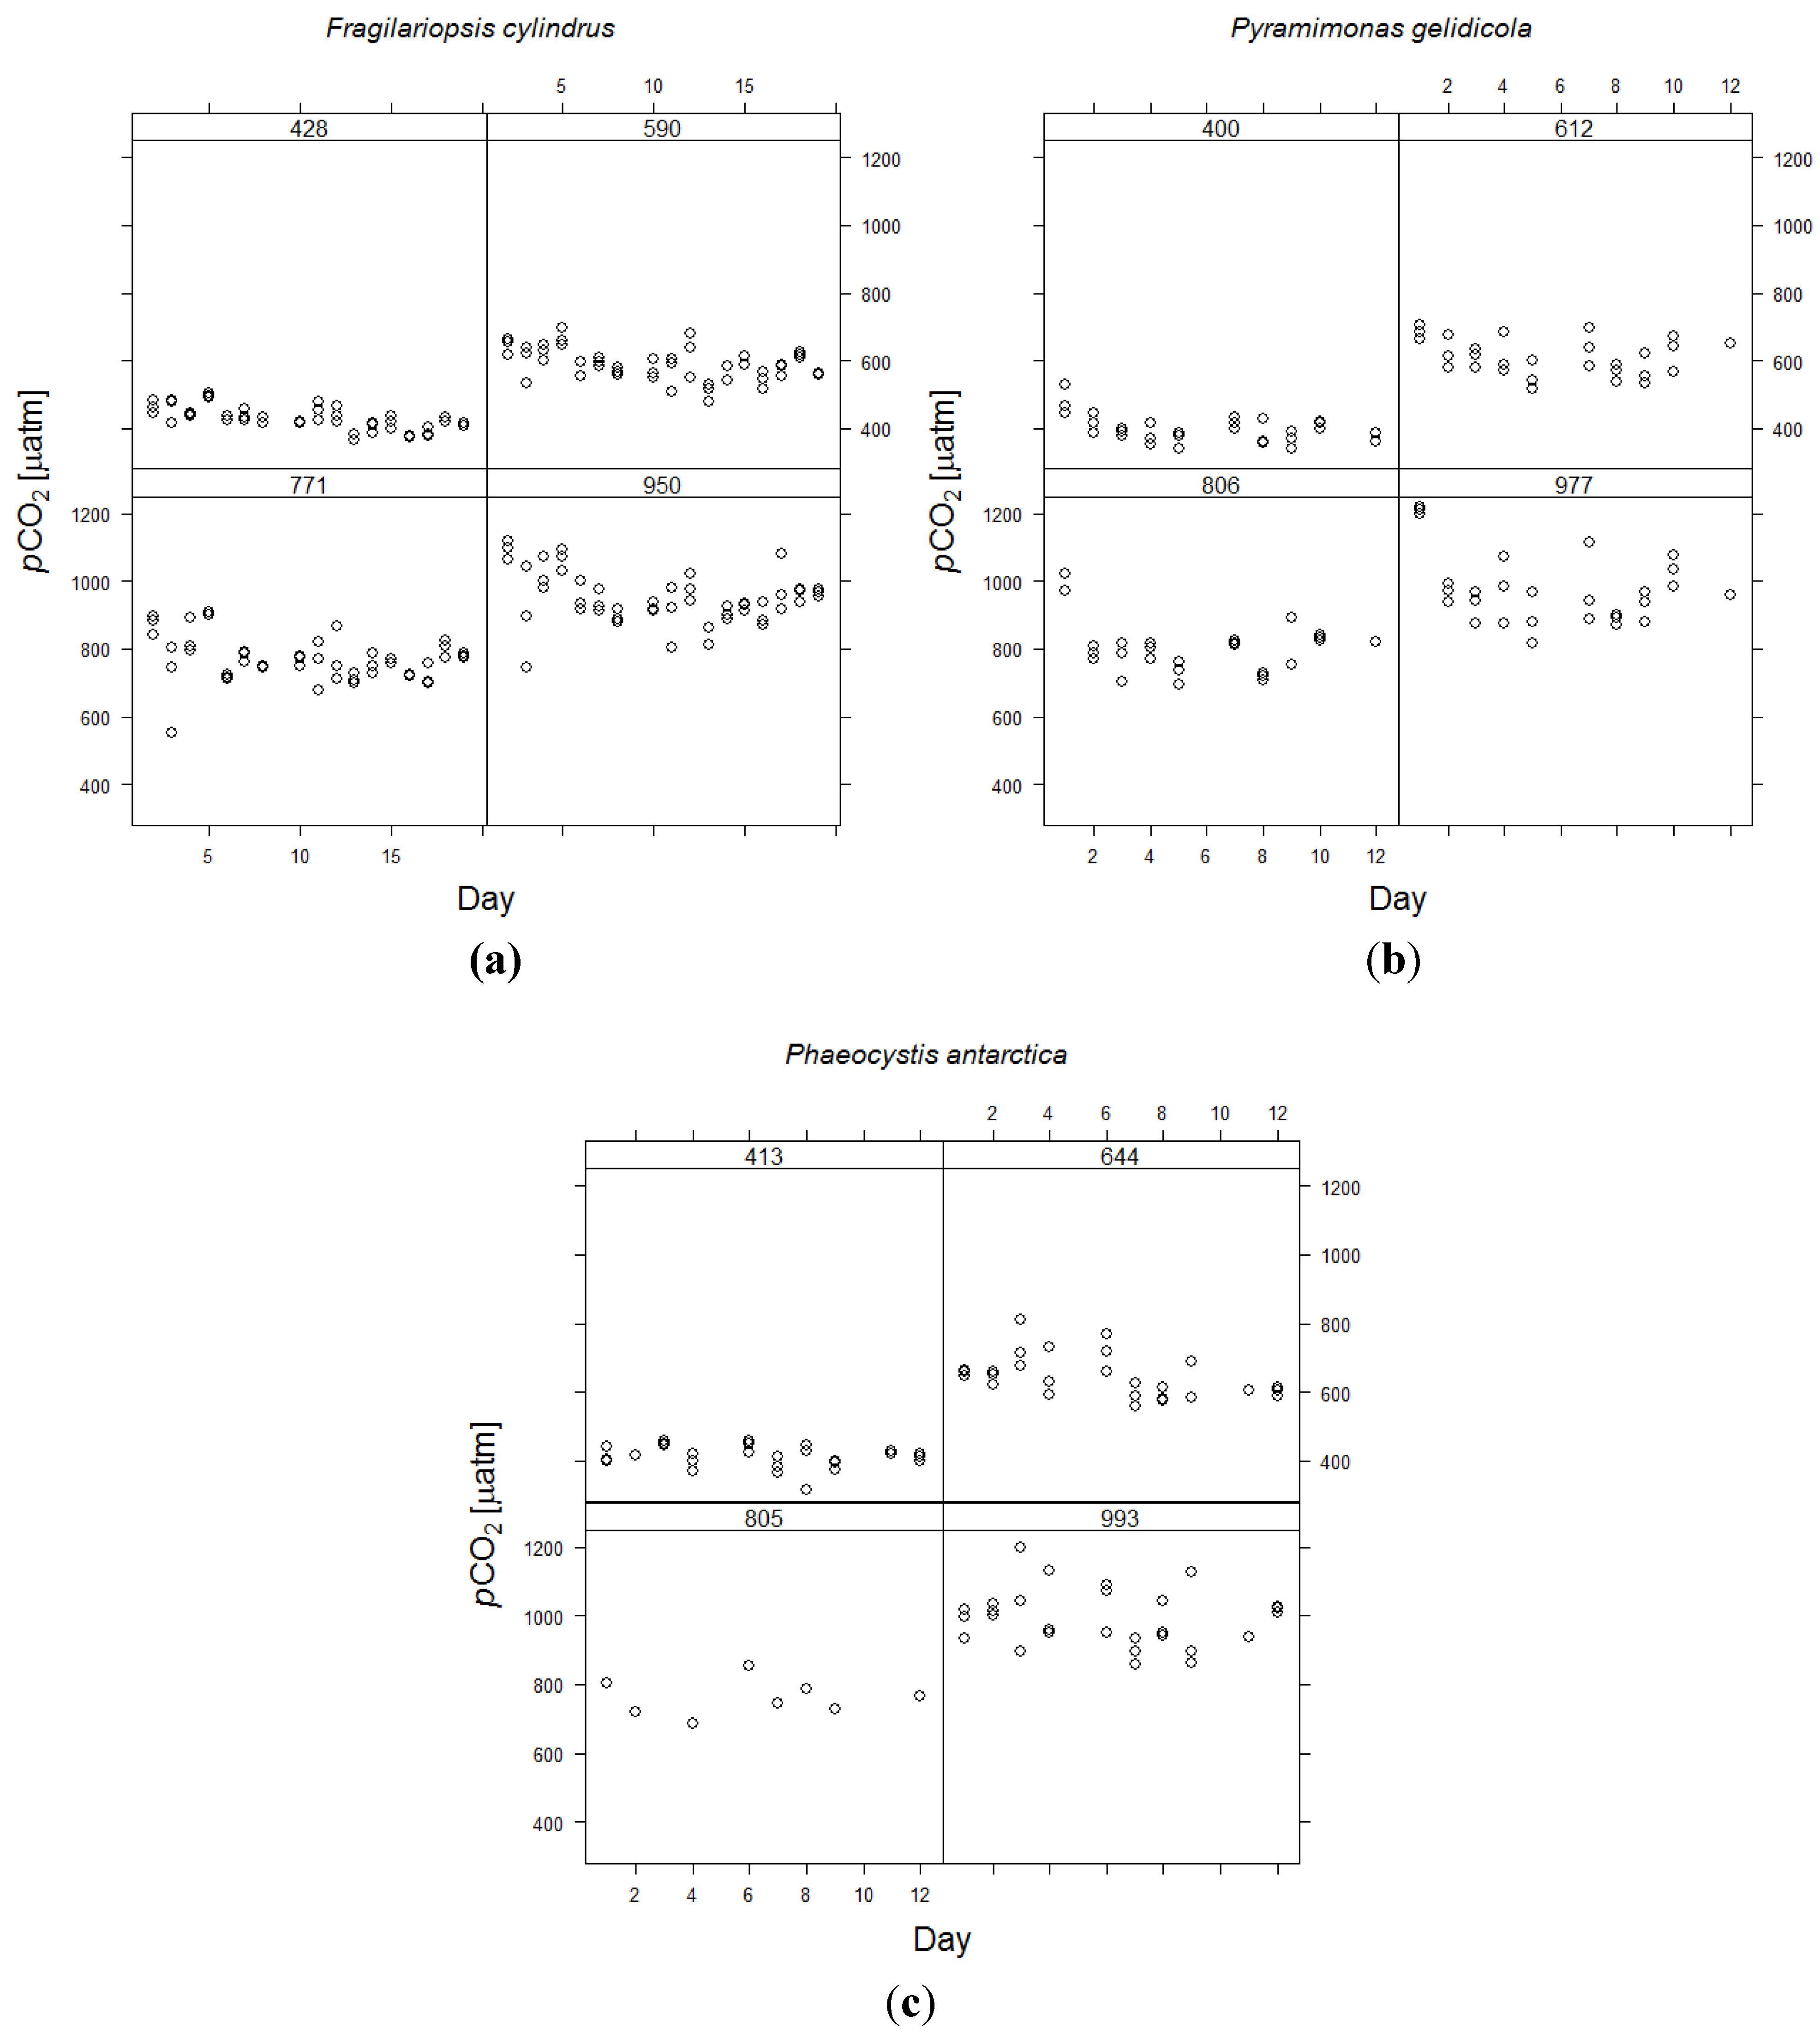
3.1. Stability of the Carbonate Chemistry and Cell Densities

The performance of the continuous system can be measured by how close the actual culture pCO2 was to the target pCO2. Deviations from the target CO2 concentration are mainly due to photosynthetic CO2 draw-down, which is a function of the culture cell density and metabolic activity, and/or the accuracy of the CO2-air mixture concentration.
Minimising the deviation of the experimental CO2 concentration from the target concentration for each CO2 treatment is vital for ocean acidification experiments. More critical for the detection of changes in biochemistry and physiology among CO2 treatments, however, is the stability of CO2 concentrations within each treatment and whether or not they overlapped. Standard deviations in pH and calculated pCO2 for each treatment were relatively small using a continuous system (Table 1). The scatter in pCO2 was larger in higher CO2 treatments than in the control treatments (Figure 3) and this is likely due to small variations in air flow rates to which constant volumes of CO2 gas were added. Variations in air flow rates will lead to larger variations in final pCO2 in the high CO2 treatments, where more CO2 is added.
Table 1. Measured pH and calculated pCO2 during the continuous culture experiments. Headings are target pCO2 (µatm). SD = standard deviation, range = difference between highest and lowest recorded pH, measured pCO2 values were calculated using CO2SYS from alkalinity and pH, positive (negative) values mean the actual CO2 concentration was higher (lower) than the target value.
Fragilariopsis cylindrus390570750950
Average pH ± SD8.02 ± 0.037.88 ± 0.037.77 ± 0.047.69 ± 0.03
pH range0.130.150.200.17
Calculated pCO2 ± SD428 ± 34590 ± 46771 ± 67950 ± 78
Difference from target+38+20+21±0
Pyramimonas gelidicola390570750950
Average pH ± SD8.04 ± 0.047.87 ± 0.037.75 ± 0.047.67 ± 0.04
pH range0.170.130.160.17
Calculated pCO2 ± SD400 ± 41612 ± 54806 ± 80977 ± 106
Difference from target+10+42+56+27
Phaeocystis antarctica390570750950
Average pH ± SD8.02 ± 0.037.86 ± 0.047.76 ± 0.047.67 ± 0.03
pH range0.140.150.190.14
Calculated pCO2 ± SD413 ± 31644 ± 62805 ± 76993 ± 83
Difference from target+23+74+55+43
Cell densities reached approximately 265,000 cells/mL for Fragilariopsis cylindrus cultures, with an average growth rate of 0.47 d−1, SE ± 0.02 and 14 generations through the course of the experiment. Pyramimonas gelidicola cultures reached approximately 45,300 cells/mL, had an average growth rate of 0.38 d−1, SE ± 0.03 and went through 6 generations and Phaeocystis antarctica reached approximately 105,800 cells/mL with an average growth rate of 0.53 d−1, SE ± 0.03 and went through 6 generations.

3.2. Discussion

Our aim was to develop a phytoplankton culturing system that could facilitate fully replicated, long-term ocean acidification experiments with stable carbonate chemistry. Natural phytoplankton assemblages in the Southern Ocean experience large variations in seawater pH and pCO2 (~300 µatm seasonally), in seasonal and diurnal cycles, particularly during intense blooms [32,33]. Photosynthesis by prolific phytoplankton blooms in summer can reduce pCO2 to approximately 100 µatm, while in autumn and winter the absence of light and upwelling of CO2 rich deep water can increase pCO2 to about 450 µatm [32,33]. Phytoplankton species exposed to such naturally variable CO2 environments are likely to tolerate a broad range of pH and pCO2. Indeed Berge et al. [15] reported that diurnal changes in pH of 1 unit did not affect growth rates of a range of species in the laboratory, but sustained changes of such magnitude may elicit more significant responses as cells are not able to capitalise on intermittent favourable periods. Alternatively, cells may acclimate to the new pCO2 environment and increase their tolerance. Arguably reasonably small changes in experimental pCO2 due to natural processes like photosynthesis may be acceptable when trying to mimic natural surface ocean conditions [7]. Yet, the aim of controlled laboratory experiments is to accurately maintain experimental conditions to detect biochemical and physiological changes among pCO2 treatments.
Figure 3. Calculated pCO2 over time in the four CO2 treatments of the three phytoplankton species. Average pCO2 levels in µatm are indicated above each panel. Individual circles represent the three replicate culture vessels per treatment. (a) Fragilariopsis cylindrus; (b) Pyramimonas gelidicola; (c) Phaeocystis antarctica.
Water 06 01860 g003
Our continuous culture system was found to be a less labour intensive approach and provided stable carbonate chemistry conditions that compared well with other systems. The continuous culture experiment by Crawfurd et al. [34], run over 12 weeks, was subject to a pH range of ~0.4 units. Crawfurd et al. [34] controlled the carbonate chemistry by bubbling with CO2-enriched air and by automated addition of pre-equilibrated media when the pH deviated by 0.01 units. Lefebvre et al. [35] maintained cultures of the coccolithophore Emiliania huxleyi for close to 6 months in a cyclostat, where culture pH was maintained by continuously bubbling with CO2-enriched air. Due to the labour intensity of their system they could not incorporate replication. Furthermore the actual pCO2 levels of the cultures deviated greatly from their target values. The average pCO2 of cultures with a target pCO2 of 400 µatm averaged between 166 and 194 µatm and cultures aimed at 1000 µatm averaged between 308 and 367 µatm. The pH standard errors were between ±0.02 and ±0.04. Li and Campbell [36] reported pH standard deviations of up to 0.07 using a turbidostat system. The continuous culture system we describe here maintained pCO2 levels equally well, with little deviation from our target values and the ease of maintenance allowed full replication of up to four treatments (Table 1).
The Antarctic phytoplankton species used in our experiments at low temperatures had relatively low growth rates (0.4–0.5 d−1) compared to the species used by Crawfurd et al. [34] (~0.9 d−1) and Lefebvre et al. [35] (~0.9–1.3 d−1). The lower metabolic rates in phytoplankton in our study reduced biologically-induced variations to carbonate chemistry. Furthermore, macronutrient concentrations mimicked the abiotic environment from which the phytoplankton were isolated. This kept cell densities at lower concentrations than would be supported by traditional, nutrient rich, culture media, and this also helped minimize changes in pCO2 due to biological activity. To accommodate faster growing species, at potentially higher cell densities, either the pump rate of fresh CO2-enriched media to the cultures and/or the volume of CO2 gas added to the inflowing air would need to be increased. Both options can be easily facilitated in the above described system. A higher pump speed of inflowing media would also improve the accuracy with which media is delivered to each culture bag, as we were operating at the lowest limits of pump speed on our peristaltic pumps.
We did not test the robustness of our setup to the regular perturbations caused by day-night cycles in photosynthesis and respiration since we used continuous light throughout the experiments. Diurnal light cycles, though potentially more representative of the natural environment, induce diurnal cycles in the physiology and biochemistry of the algae [37]. Laboratory studies have shown that diurnal variations in C:N:P were of similar magnitude to CO2-induced differences [38] and may mask the effects of experimental pCO2 treatment. Furthermore, light dark cycles can cause large variations in the culture pCO2 due to the changes in the ratio of photosynthesis to respiration. Lefebvre et al. [35] measured significant daily variations between dark (580 µatm ± 40 µatm) and light phase (340 µatm ± 20 µatm) in cultures that were bubbled with CO2-enriched air of 1000 ppm.
In order to simulate natural changes in carbonate chemistry, the culture medium can either be altered by addition of CO2 as gas, as equimolar volumes of HCl and Na2CO3 [12] or in doses of pre-equilibrated seawater [39]. McGraw et al. [39] developed a very stable (pH deviation of 0.02 units), individually adjustable and automated system for ocean acidification experiments with coralline algae. However, the system described by Mc Graw et al. [39] requires a self-developed software and sophisticated electronics. Furthermore, since their culture vessels are flushed numerous times per hour to maintain stable pH in the presence of photosynthesis and calcification, this flow-through setup is not suitable for slow growing phytoplankton cultures. Therefore, we chose to bubble our cultures with CO2-enriched air as recommended by Gatusso and Lavigne [14], despite some reports of adverse effects of small-scale turbulence on the growth rates of delicate taxa [40,41,42]. To avoid damage by bubbling of fragile species, the CO2-enriched air can be continuously pumped into the headspace and will equilibrate from there into the underlying culture medium, especially when some form of agitation is provided. This works well for small culture vessels and low cell densities. For larger culture vessels, such as those used in this study, the surface to volume ratio is insufficient and rates of gas diffusion into the culture are too slow. Thus flushing the headspace with CO2-enriched air is often insufficient to attain elevated pCO2 in cultures. Bubbling CO2-enriched air directly into the culture is an easy and simple alternative that also provides the culture with continuous agitation to reduce settling of cells on the bottom of the vessel [27].
Fluctuations in CO2 concentrations of the local ambient air can be a possible source of pCO2 variation in experiments. While we did not find this to be an issue in our setup, CO2 can be removed from the air source before adding the required volume of CO2 to achieve the target concentration. For smaller volumes of air this can be done by passing the ambient air through a soda lime-packed column.
The peristaltic pumps in our system allowed two different species (housed in 12 separate cultures) to be studied simultaneously. If a precise estimate of growth rate is required, however, we recommend the use of individual pumps for each culture vessel. That way flush rates can be adjusted individually for each culture and influx of media and outflux of culture can be accurately monitored to calculate growth rates. However, this would greatly increase the cost of the system.

4. Conclusions

Phytoplankton form the basis of marine food webs and understanding the effects of enhanced CO2 on their physiology, biochemical composition and abundance is vital to predict the effects of ocean acidification on marine ecosystems. Long-term laboratory based ocean acidification experiments are an important tool in answering these questions. A continuous culture system reduced the amount of work required to maintain the algae in exponential growth and, by continuous addition of media at the desired pH and pCO2, stabilized the carbonate chemistry. Automatic continuous dilution and addition of nutrients eliminated the requirement for manual dilutions, reduced disturbances to the culture by removal of large volumes of culture, and eliminated periodic changes in cell physiology with changing nutrient availability. The system described here provides several advantages over batch cultures, such as ease of maintenance, stable nutrient concentrations and carbonate chemistry at higher cell densities. However, its suitability depends on the experimental design and/or resources available. While automated dilution facilitates greater replication, the number of replicates is limited by the number of channels of the peristaltic pumps and the constant supply of sterile culture medium can become resource intensive. In summary, the continuous system we describe here is relatively inexpensive, and easy-to-use compared to other systems. It has proven effective for slow growing cultures at low temperatures and continuous light intensities, can easily be adjusted for faster growing species and represents an effective alternative to the use of batch experimental cultures.

Acknowledgments

We thank Tasha Waller for technical support and guidance, Rick van den Enden for technical support in preparation and imaging of microalgal samples with FESEM and Dan Holdsworth for managing the CSIRO GC and GC-MS facility. We thank the staff at the Australian Antarctic Division Workshop for constructing integral parts of the continuous culture system. C Wynn-Edwards was supported by an Endeavour International Postgraduate Research scholarship at UTAS and a CSIRO Wealth from Oceans top-up scholarship. This work was supported by Holsworth Wildlife Research Endowment [V0018333] and the Australian Antarctic Science Program Project No. 4037 and 4026. We thank two anonymous journal referees for their comments on the manuscript.

Authors Contribution

The first author was responsible for all experimental work. The first and second authors were responsible for the concept and design of the experimental facilities. The third, fourth and fifth authors provided guidance during the experimental work and together with the sixth and seventh authors helped with the writing and presentation of the manuscript.

Conflicts of Interest

The authors declare no conflict of interest.

References

  1. Bijma, J.; Spero, H.J.; Lea, D.W. Reassessing foraminiferal stable isotope geochemistry: Impact of the oceanic carbonate systems (experimental results). In Use of Proxies in Paleoceanography: Examples from the South Atlantic; Fisher, G., Wefer, G., Eds.; Springer Verlag: New York, NY, USA, 1999. [Google Scholar]
  2. Riebesell, U.; Zondervan, I.; Rost, B.; Tortell, P.D.; Zeebe, R.E.; Morel, F.M.M. Reduced calcification of marine plankton in response to increased atmospheric CO2. Nature 2000, 407, 364–367. [Google Scholar] [CrossRef]
  3. Marubini, F.; Atkinson, M.J. Effects of lowered pH and elevated nitrate on coral calcification. Mar. Ecol. Prog. Ser. 1999, 188, 117–121. [Google Scholar] [CrossRef]
  4. Kleypas, J.A.; Buddemeier, R.W.; Archer, D.; Gattuso, J.P.; Langdon, C.; Opdyke, B.N. Geochemical consequences of increased atmospheric carbon dioxide on coral reefs. Science 1999, 284, 118–120. [Google Scholar] [CrossRef]
  5. Spero, H.J.; Bijma, J.; Lea, D.W.; Bemis, B.E. Effect of seawater carbonate concentration on foraminiferal carbon and oxygen isotopes. Nature 1997, 390, 497–500. [Google Scholar]
  6. Paulino, A.I.; Egge, J.K.; Larsen, A. Effects of increased atmospheric CO2 on small and intermediate sized osmotrophs during a nutrient induced phytoplankton bloom. Biogeosciences 2008, 5, 739–748. [Google Scholar] [CrossRef]
  7. Shi, D.; Xu, Y.; Morel, F.M.M. Effects of the pH/pCO2 control method on medium chemistry and phytoplankton growth. Biogeosciences 2009, 6, 1199–1207. [Google Scholar] [CrossRef]
  8. Hurd, C.L.; Hepburn, C.D. Testing the effects of ocean acidification on algal metabolism: Considerations for experimental designs. J. Phycol. 2009, 45, 1236–1251. [Google Scholar] [CrossRef]
  9. Iglesias-Rodriguez, M.D.; Halloran, P.R.; Rickaby, R.E.M.; Hall, I.R.; Colmenero-Hidalgo, E.; Gittins, J.R.; Green, D.R.H.; Tyrrell, T.; Gibbs, S.J.; von Dassow, P.; et al. Phytoplankton calcification in a high-CO2 world. Science 2008, 320, 336–340. [Google Scholar] [CrossRef]
  10. Rost, B.; Zondervan, I.; Wolf-Gladrow, D. Sensitivity of phytoplankton to future changes in ocean carbonate chemistry: Current knowledge, contradictions and research directions. Mar. Ecol. Prog. Ser. 2008, 373, 227–237. [Google Scholar] [CrossRef]
  11. Dickson, A.G.; Sabine, C.L.; Christian, J.R. (Eds.) Guide to best practices for ocean CO2 measurements; PICES Special Publication: Luxembourg, 2007; Volumn 3; p. 191.
  12. Riebesell, U.; Fabry, V.J.; Hansson, L.; Gattuso, J.-P. (Eds.) Guide to Best Practices for Ocean Acidification Research and Data Reporting; Publications Office of the European Union: Luxembourg, 2010; p. 260.
  13. Kleypas, J.A.; Feely, R.A.; Fabry, V.J.; Langdon, C.; Sabine, C.L.; Robbins, L.L. Impacts of Ocean Acidification on Coral Reefs and Other Marine Calcifiers: A Guide for Future Research; Report for the workshop Sponsored by the National Science Foundation, the National Oceanic and Atmospheric Administration, and the U.S. Geological Survey. St. Petersburg, FL, USA, 18–20 April 2005; pp. 1–88. Available online: http://www.ucar.edu/communications/Final_acidification.pdf (accessed on 12 June 2014).
  14. Gattuso, J.-P.; Lavigne, H. Technical note: Approaches and software tools to investigate the impact of ocean acidification. Biogeosciences 2009, 6, 2121–2133. [Google Scholar] [CrossRef]
  15. Berge, T.; Daugbjerg, N.; Andersen, B.B.; Hansen, P.J. Effect of lowered pH on marine phytoplankton growth rates. Mar. Ecol. Prog. Ser. 2010, 416, 79–91. [Google Scholar] [CrossRef]
  16. Boelen, P.; van de Poll, W.H.; van der Strate, H.J.; Neven, I.A.; Beardall, J.; Buma, A.G.J. Neither elevated nor reduced CO2 affects the photophysiological performance of the marine Antarctic diatom. Chaetoceros brevis. J. Exp. Mar. Biol. Ecol. 2011, 406, 38–45. [Google Scholar] [CrossRef]
  17. Arnold, H.E.; Kerrison, P.; Steinke, M. Interacting effects of ocean acidification and warming on growth and DMS-production in the haptophyte coccolithophore. Emiliania huxleyi. Glob. Chang. Biol. 2013, 19, 1007–1016. [Google Scholar] [CrossRef]
  18. Thornton, D.C.O. Effect of low pH on carbohydrate production by a marine planktonic diatom (Chaetoceros muelleri). Res. Lett. Ecol. 2009, 2009, 105901. [Google Scholar]
  19. Holland, D.; Roberts, S.; Beardall, J. Assessment of the nutrient status of phytoplankton: A comparison between conventional bioassays and nutrient-induced fluorescence transients (NIFTs). Ecol. Indic. 2004, 4, 149–159. [Google Scholar] [CrossRef]
  20. Bonachela, J.A.; Raghib, M.; Leving, S.A. Dynamic model of flexible phytoplankton nutrient uptake. Proc. Natl. Acad. Sci. USA 2011, 108, 20633–20638. [Google Scholar] [CrossRef]
  21. Guillard, R.R.L.; Ryther, J.H. Studies of marine planktonic diatoms. I. Cyclotella nana Hustedt and Detonula confervacae Cleve. Can. J. Microbiol. 1962, 8, 229–239. [Google Scholar] [CrossRef]
  22. Guillard, R.R.L. Culture of phyoplankton for feeding marine invertebrates. In Culture of Marine Invertebrate Animals; Smith, W.L., Chanley, M.H., Eds.; Plenum Press: New York, NY, USA, 1975; pp. 26–60. [Google Scholar]
  23. Gibson, J.A. Carbon Flow through Marine Environments of the Vestfold Hills, East Antarctica; ANARE Reports 139; Australian Antarctic Division, Hobart: Kingston, Australia, 1998; pp. 174–178. [Google Scholar]
  24. Roden, N.P.; Shadwick, E.H.; Tilbrook, B.; Trull, T.W. Annual cycle of carbonate chemistry and decadal change in coastal Prydz Bay, East Antarctica. Mar. Chem. 2013, 155, 135–147. [Google Scholar] [CrossRef]
  25. Egge, J.K.; Aksnes, D.L. Silicate as regulating nutrient in phytoplankton competition. Mar. Ecol. Prog. Ser. 1992, 83, 281–289. [Google Scholar] [CrossRef]
  26. Harrison, P.J.; Conway, H.L.; Holmes, R.W.; Davis, C.O. Marine diatoms grown in chemostats under silicate or ammonium limitation. III. Cellular composition and morphology of Chaetoceros debilis, Skeletonema costatum, and Thalassiosira gravida. Mar. Biol. 1977, 43, 19–31. [Google Scholar] [CrossRef]
  27. Wynn-Edwards, C.; King, R.; Davidson, A.; Wright, S.; Nichols, D.P.; Wotherspoon, S.; Kawaguchi, S.; Virtue, P. Species-specific variations in the nutritional quality of Southern Ocean phytoplankton in response to elevated pCO2. Water 2014, 6, 1840–1859. [Google Scholar]
  28. Thomson, P.G.; Davidson, A.T.; Cadman, N. Seasonal changes in effects of ambient UVR on natural communities of Antarctic marine protists. Aquat. Microb. Ecol. 2008, 52, 131–147. [Google Scholar] [CrossRef]
  29. Lewis, E.; Wallace, D.W.R. Program Developed for CO2 System Calculations; Oak Ridge National Laboratory, U.S. Department of Energy: Oak Ridge, TN, USA, 1998. [Google Scholar]
  30. Mehrbach, C.; Culberson, C.; Hawley, J.; Pytkowicz, R. Measurement of the apparent dissociation constants of carbonic acid in seawater at atmospheric pressure. Limnol. Oceanogr. 1973, 18, 897–907. [Google Scholar] [CrossRef]
  31. Dickson, A.G.; Millero, F.J. A comparison of the equilibrium constants for the dissociation of carbonic acid in seawater media. Deep Sea Res. Part A: Oceanogr. Res. Pap. 1987, 34, 1733–1743. [Google Scholar] [CrossRef]
  32. McNeil, B.I.; Matear, R.J. Southern Ocean acidification: A tipping point at 450-ppm atmospheric CO2. Proc. Natl. Acad. Sci. USA 2008, 104, 18860–18864. [Google Scholar] [CrossRef]
  33. McNeil, B.I.; Sweeney, C.; Gibson, J.A.E. Short Note: Natural seasonal variability of aragonite saturation state within two Antarctic coastal ocean sites. Antarct. Sci. 2011, 23, 411–412. [Google Scholar] [CrossRef]
  34. Crawfurd, K.; Raven, J.A.; Wheeler, G.L.; Baxter, E.J.; Joint, I. The response of Thalassiosira pseudonana to long-term exposure to increased CO2 and decreased pH. PLoS ONE 2011, 6, e26695. [Google Scholar]
  35. Lefebvre, S.C.; Benner, I.; Stillman, J.H.; Parker, A.E.; Drake, M.K.; Rossignol, P.E.; Okimura, K.M.; Komada, T.; Carpenter, E.J. Nitrogen source and pCO2 synergistically affect carbon allocation, growth and morphology of the coccolithophore Emiliania huxleyi: Potential implications of ocean acidification for the carbon cycle. Glob. Chang. Biol. 2012, 18, 493–503. [Google Scholar] [CrossRef]
  36. Li, G.; Campbell, D.A. Rising CO2 interacts with growth light and growth rate to alter photosystem II photoinactivation of the coastal diatom Thalassiosira pseudonana. PLoS One 2013, 8, e55562. [Google Scholar]
  37. Hitchcock, G.L. Diel variation in chlorophyll a, carbohydrate and protein content of the marine diatom Skeletonema costatum. Mar. Biol. 1980, 57, 271–278. [Google Scholar] [CrossRef]
  38. Burkhardt, S.; Zondervan, I.; Riebesell, U. Effect of CO2 concentration on C:N:P ratio in marine phytoplankton: A species comparison. Limnol. Oceanogr. 1999, 44, 683–690. [Google Scholar] [CrossRef]
  39. McGraw, C.M.; Cornwall, C.E.; Reid, M.R.; Currie, K.I.; Hepburn, C.D.; Boyd, P.; Hurd, C.L.; Hunter, K.A. An automated pH-controlled culture system for laboratory-based ocean acidification experiments. Limnol. Oceanogr. Methods 2010, 8, 686–694. [Google Scholar] [CrossRef]
  40. Schapira, M.; Seuront, L.; Gentilhomme, V. Effects of small-scale turbulence on Phaeocystis globosa (Prymnesiophyceae) growth and life cycle. J. Exp. Mar. Biol. Ecol. 2006, 335, 27–38. [Google Scholar] [CrossRef]
  41. Berdalet, E.; Peters, F. Species-specific physiological response of dinoflagellates to quantified small-scale turbulence. J. Phycol. 2007, 43, 965–977. [Google Scholar] [CrossRef]
  42. Peters, F.; Arin, L.; Marrase, C.; Berdalet, E.; Sala, M.M. Effects of small-scale turbulence on the growth of two diatoms of different size in a phosphorus-limited medium. J. Mar. Syst. 2006, 61, 134–148. [Google Scholar] [CrossRef]

