1. Introduction
Grassed swales are increasingly being used in a variety of engineering applications to transport polluted stormwater runoff to downstream catchments in an efficient, economic and aesthetically pleasing way. In addition, swales reduce runoff pollutants, require little maintenance, and can be easily incorporated in projects that require a cost-effective stormwater conveyance system. This can often make swales a better choice than traditional curb-and-gutter systems [
1]. It has been demonstrated that grassed swales minimise stormwater runoff pollution levels [
2] by reducing stormwater flow velocities, which decreases peak outlet discharges and allows filtering and sedimentation processes to occur within the swale.
Research has shown swales can be used as stormwater runoff pre-treatment systems which reduce the need for downstream treatment facilities [
3]. Water Sensitive Urban Design (WSUD) guidelines recommend cost-effective and sustainable non-point-source stormwater pollution treatment options. These can include incorporating swales into urban catchments for treating polluted stormwater runoff prior to discharge into receiving waters [
4]. WSUD is about integrating water cycle management into urban planning and design. The principles of WSUD are similar to those of Sustainable Urban Drainage System (SUDS) design in Europe and Low Impact Development (LID) in America [
5].
Despite significant literature sources reporting the benefits of grassed swales to treat urban stormwater runoff, a fully comprehensive understanding of the design and performance characteristics of swales is still not apparent [
6]. This investigation builds on previous swale research with a particular focus on swale length, and how it influences the stormwater attenuation and pollution removal capabilities of grassed swales.
2. Previous Research
Numerous researchers have reported that swales substantially reduce runoff volumes. Ackerman and Stein [
7] demonstrated that grassed swales reduce mean runoff volume by approximately 52.5%. Barrett [
8] reported that swales may have the potential to infiltrate up to 50% of the runoff volume, provided the soil is permeable and the initial moisture content of that soil is low. Fassman and Liao [
3] monitored field swales in New Zealand under natural storm conditions and concluded that, on average, 73.6% of the peak flow discharge was dampened by swales, while 63.7% of the total volume was captured. Bäckström
et al. [
9], and Fassman and Liao [
3] noted complete capture of runoff by swales when rainfall events of less than 2 mm occurred. Yousef
et al. [
10] and Deletic [
11] also reported significant runoff reduction by swales. Barrett [
8] concluded that the reduction in runoff volume also meant that the total pollutant constituent load was reduced, including nutrient loads, which generally exhibit little change in concentration due to treatment by swales. Increased stormwater retention time, and reduced peak flow rates by swales has the potential to significantly improve the quality of stormwater runoff [
7,
8].
Previous research agrees that swales remove pollutants through the processes of sedimentation, filtration by grass blades, infiltration into the subsurface zone and bio-chemical processes [
2,
6,
12]. Previous research also reports that swale length, slope, vegetation cover and soil type, all factor into pollution removal performance. Pollutant properties, such as the sediment particle size distributions (PSD) and concentrations, and the amount of particulate bound pollutants also directly affects the pollutant treatment efficiency of swales [
1,
13,
14].
Due to their ability to trap sediments, and consequently pollutant constituents attached to particulate matter, many researchers have measured the pollution reducing efficiency of swales based on total suspended solids (TSS) removal. A summary of previous studies on the TSS removal performance of grassed swales is listed in
Table 1.
Table 1.
Previous studies on the Total Suspended Solids (TSS) removal performance of swales.
Table 1.
Previous studies on the Total Suspended Solids (TSS) removal performance of swales.
| Literature Source | TSS Removal Performance of Grassed Swales (%) | Remarks |
|---|
| Range | Mean (Median) |
|---|
| Ackerman and Stein (2008) [7] | 41–84 | 70.6 (72) | * Review of ten different swales studies |
| 80–99 | 89 (87) | * Review from five different peer reviewed swale study sources; ** TSS load reduction |
| Barrett et al. (1998) [2] | 85–87 | 86 | * Studied two field swales of 1055 m and 356 m long tested under real runoff events (n = 34); ** TSS concentration (EMC) reduction |
| Deletic and Fletcher (2006) [15] (review section) | | 72 (76) | * Review of 18 swale study sources |
| Deletic and Fletcher (2006) [15] | 61–86 | | * A 6.2 m field grass channel studied with runoff simulation; ** TSS concentration (EMC) reduction |
| | 69 | * A 65 m long field swale with runoff simulation; ** TSS load reduction |
| Bäckström (2002) [13] | 79–98 | | * Simulation study on nine different swales of 5–10 m long; ** TSS concentration (EMC) reduction |
| Yu et al. (2001) [12] | 67.2–94 | | * From two field swale studies, one with a 30 m long swale using runoff simulation and other swale of 274.5 m with real time events (n = 4); ** mass sediment removal |
| Lloyd et al. (2001) [16] | | 74 | * A 35 m long swale tested with runoff simulation; ** TSS load removal |
| Bäckström et al. (2006) [9] | | 15 | * Field swale of 110 m long under real storm events (n = 7); ** TSS EMC removal; *** few negative TSS removals were also observed in the study |
| Kaighn and Yu (1996) [1] | 29.7–49 | | * Results from two 30 m long field swales studied under real storm events (n = 8); ** TSS EMC removal |
| Scheuler (1994) [17] | 65–98 | | * Results from three 61 m long field swales tested under real storm events; *** one swale showed negative TSS removal due to erosion, which was not given in the range). This finding was verified by Winston et al. (2012) [18] who also found that erosion within a swale caused negative percent reductions for TSS. |
| Stagge et al. (2012) [6] | 44.1–82.7 | | * Two field swales of 198 m and 138 m long tested with different configurations under real events (n = 45); ** mass TSS removal |
| Mean | 61.3–86.4 | 67.9 (78.3) | Arithmetic mean of the listed literature performance data |
Bäckström [
13] found sedimentation of the coarse particles (>25 µm) within the first few metres of the swale length was the most significant factor in removing TSS from runoff, followed by filtration by grass blades predominantly in shallower flow regimes that often correspond to low to moderate intensity rainfall events. Bäckström [
13] also reported that laboratory tests on swales generally performed better than field swale tests in sediment trapping. Five metre long field swales showed efficient removal of particles coarser than 25 µm. However, when the lengths of the swales were doubled, particles smaller than 25 µm were also trapped. Bäckström
et al. [
9] confirmed his earlier findings of sediment trapping using a 110 m long roadside grassed swale in Södra Hamnleden, Sweden, under different real rainfall and runoff events. This study revealed that particles larger than 25 µm were effectively trapped by the swale. However, this study found that sediments finer than 25 µm were not retained, and were transported out of the swale, which was in contrast to the earlier study results [
13]. Bäckström
et al. [
9] attributed the export of finer sediment to higher flow rates that occurred under real runoff conditions. They concluded [
9] that further studies are needed to improve the understanding of the capacity of swales to trap finer particles. Deletic’s [
14] experimental study on swales concluded that a substantial proportion of sediment particles larger than 57 µm in size were trapped by grassed swales. She also found that the removal efficiency of grassed swales was very low for particles smaller than 5.8 µm.
Previous studies have also looked into the nutrient removal performance by swales. Nutrients such as nitrogen and phosphorous were mostly considered in those studies due to their impact on urban waterways. Removal of total nitrogen (TN) in swales was found to be variable [
15,
16,
17]. Other researchers reported that the removal of TSS particles finer than 150 µm would increase removal of total phosphorous (TP), because approximately 70% of the TP present in urban runoff is bound to particulates [
6]. It has been suggested that relevant chemical or biological processes need to take place to significantly remove these nutrients, particularly the dissolved components [
12]. However, it is unclear whether swale systems provide adequate Hydraulic Retention Time for these processes to occur [
18].
Table 2 and
Table 3 list previous research results on the TN and TP removal performance by swales respectively.
It appears from the literature reviewed above that there are significant knowledge gaps relating to the ability of swales to remove pollutants from stormwater runoff. This study investigated the pollutant removal performances of field swales under simulated runoff conditions. As swales convey runoff to downstream water bodies, the main focus of the study was to investigate the level of pollution removal performance that can be expected from grass swales used to treat stormwater runoff before it reaches receiving waters. The study focussed on the three most common pollutants of concern to WSUD practitioners, namely: TSS, TN and TP. The particle size distributions (PSD) of the sediment trapped by the swales, runoff volume reduction, and peak discharge attenuation were also investigated in the study.
Table 2.
Previous studies on the Total Nitrogen (TN) removal performance of swales.
Table 2.
Previous studies on the Total Nitrogen (TN) removal performance of swales.
| Literature Source | TN removal performance of grassed swales (%) | Remarks |
|---|
| Range | Mean (Median) |
|---|
| Deletic and Fletcher’s [15] review (2006) | | 45 (50) | * Review of 13 swale study sources |
| Deletic and Fletcher (2006) [15] | | 56 | * A 65 m long field swale with runoff simulation; ** TN load reduction |
| Yu et al. (2001) [12] | 13.8–23.1 | | * From two field swale studies, one with a 30 m long swale with runoff simulation and other swale of 274.5 m with real time events (n = 4); ** mass TN removal |
| Lloyd et al. (2001) [16] | | Nil | * A 35 m long swale tested with runoff simulation; ** TN load removal |
| Scheuler (1994) [17] | (−X)–46.5 | | *Results from three 61 m long field swales tested under real storm events; (*** one swale showed TN export of a certain negative percentage) |
| Stagge et al. (2012) [6] | (−25.6)–85.6 | | * Two field swales of 198 m and 138 m long tested with different configurations under real events (n = 45); ** mass TN removal |
| Yousef et al. (1987) [10] | (−7)–11 | | * From two field swales of 53 m and 170 m long under simulated runoff events; ** EMC reduction |
| Mean | −6.3–41.2 | 33.7 (50) | Arithmetic mean of the listed literature performance data |
Table 3.
Previous studies on the Total Phosphorous (TP) removal performance of swales.
Table 3.
Previous studies on the Total Phosphorous (TP) removal performance of swales.
| Literature Source | TP removal performance of grassed swales (%) | Remarks |
|---|
| Range | Mean (Median) |
|---|
| Barrett et al. (1998) [2] | 34–44 | 39 | * In two field swales of 1,055 m and 356 m long + tested under real runoff events (n = 34); ** TP concentration (EMC) reduction |
| Deletic and Fletcher’s [15] review (2006) | | 52 (55) | * Review of 20 swale study sources |
| Deletic and Fletcher (2006) [15] | | 46 | * A 65 m long field swale with runoff simulation; ** TP load reduction |
| Yu et al. (2001) [12] | 28.8–98.6 | | * From two field swale studies, one with a 30 m long swale with runoff simulation and other swale of 274.5 m with real time events (n = 4); ** mass TP removal |
| Lloyd et al. (2001) [16] | | 55 | * A 35 m long swale tested with runoff simulation; ** TP load removal |
| Kaighn and Yu (1996) [1] | (-0.4)–33 | | * Results from two 30 m long field swales tested under real storm events (n = 8); ** EMC removal |
| Scheuler (1994) [17] | 18–41 | | * Results from three 61 m long field swales tested under real storm events |
| Stagge et al. (2012) [6] | (-49.6)–68.7 | | * Two field swales of 198 m and 138 m long tested with different configurations under real events (n = 45); ** mass TP removal |
| Yousef et al. (1987) [10] | 3–25 | | * From two field swales of 53 m and 170 m long under simulated runoff events; ** EMC reduction |
| Mean | 5.6–51.7 | 48 (55) | Arithmetic mean of the listed literature performance data |
4. Experimental Methodology
The stormwater pollutant removal performance of four different field swale installations was monitored during 24 controlled field runoff simulation experiments. Controlled field runoff simulations were selected for the study because of their reliability and the difficulties in sampling real time precipitation runoff events. The experiments were designed to compare selected water quality parameters in the influent and effluent runoff. Three different pollutants were tested, namely: TSS, TN and TP. TSS was sampled every 5 m along the swale length and the nutrients TN and TP were tested every 10 m. Four different pollutant concentrations were used in the experiments as shown in
Table 4. The reduction in flow rates due to infiltration along the swales was also measured. It must be noted that the pollution loads for the C and D tests are much higher than typical nutrient and sediment concentrations in stormwater runoff in Australia and these were included to ensure that differences in results could be measured.
Table 4.
Synthetic runoff pollutant constituents and test types used in simulation experiments.
Table 4.
Synthetic runoff pollutant constituents and test types used in simulation experiments.
| Pollutant constituents | Test types and design pollutant mix concentrations (mg/L) | Concentrations observed at swale inlets (mg/L) |
|---|
| Test A | Test B | Test C | Test D | Test A | Test B | Test C | Test D |
|---|
| (TA) | (TB) | (TC) | (TD) | (TA) | (TB) | (TC) | (TD) |
|---|
| Total suspended solid (TSS)–Silica | 0 | 150 | 750 | 1500 | 0–19 | 67–96 | 283–451 | 511–1211 |
| Total nitrogen (TN)–KNO3 | 0 | 1.000 | 5.000 | 10.000 | 0.115–0.209 | 1.120–1.270 | 4.926–5.384 | 9.495–10.520 |
| Total phosphorous (TP)–KH2PO4 | 0 | 1.000 | 5.000 | 10.000 | 0.088–0.261 | 0.947–1.245 | 3.868–5.145 | 8.570–11.650 |
Three of the swales tested were located on the campus of the University of the Sunshine Coast (identified as USC, IC, and CPB in
Table 5). The fourth swale was located in Caloundra, Sunshine Coast (identified as SC in
Table 5). The swale size, shape, length and slope are also given in
Table 5. The four swales were between 30 and 35 m in length.
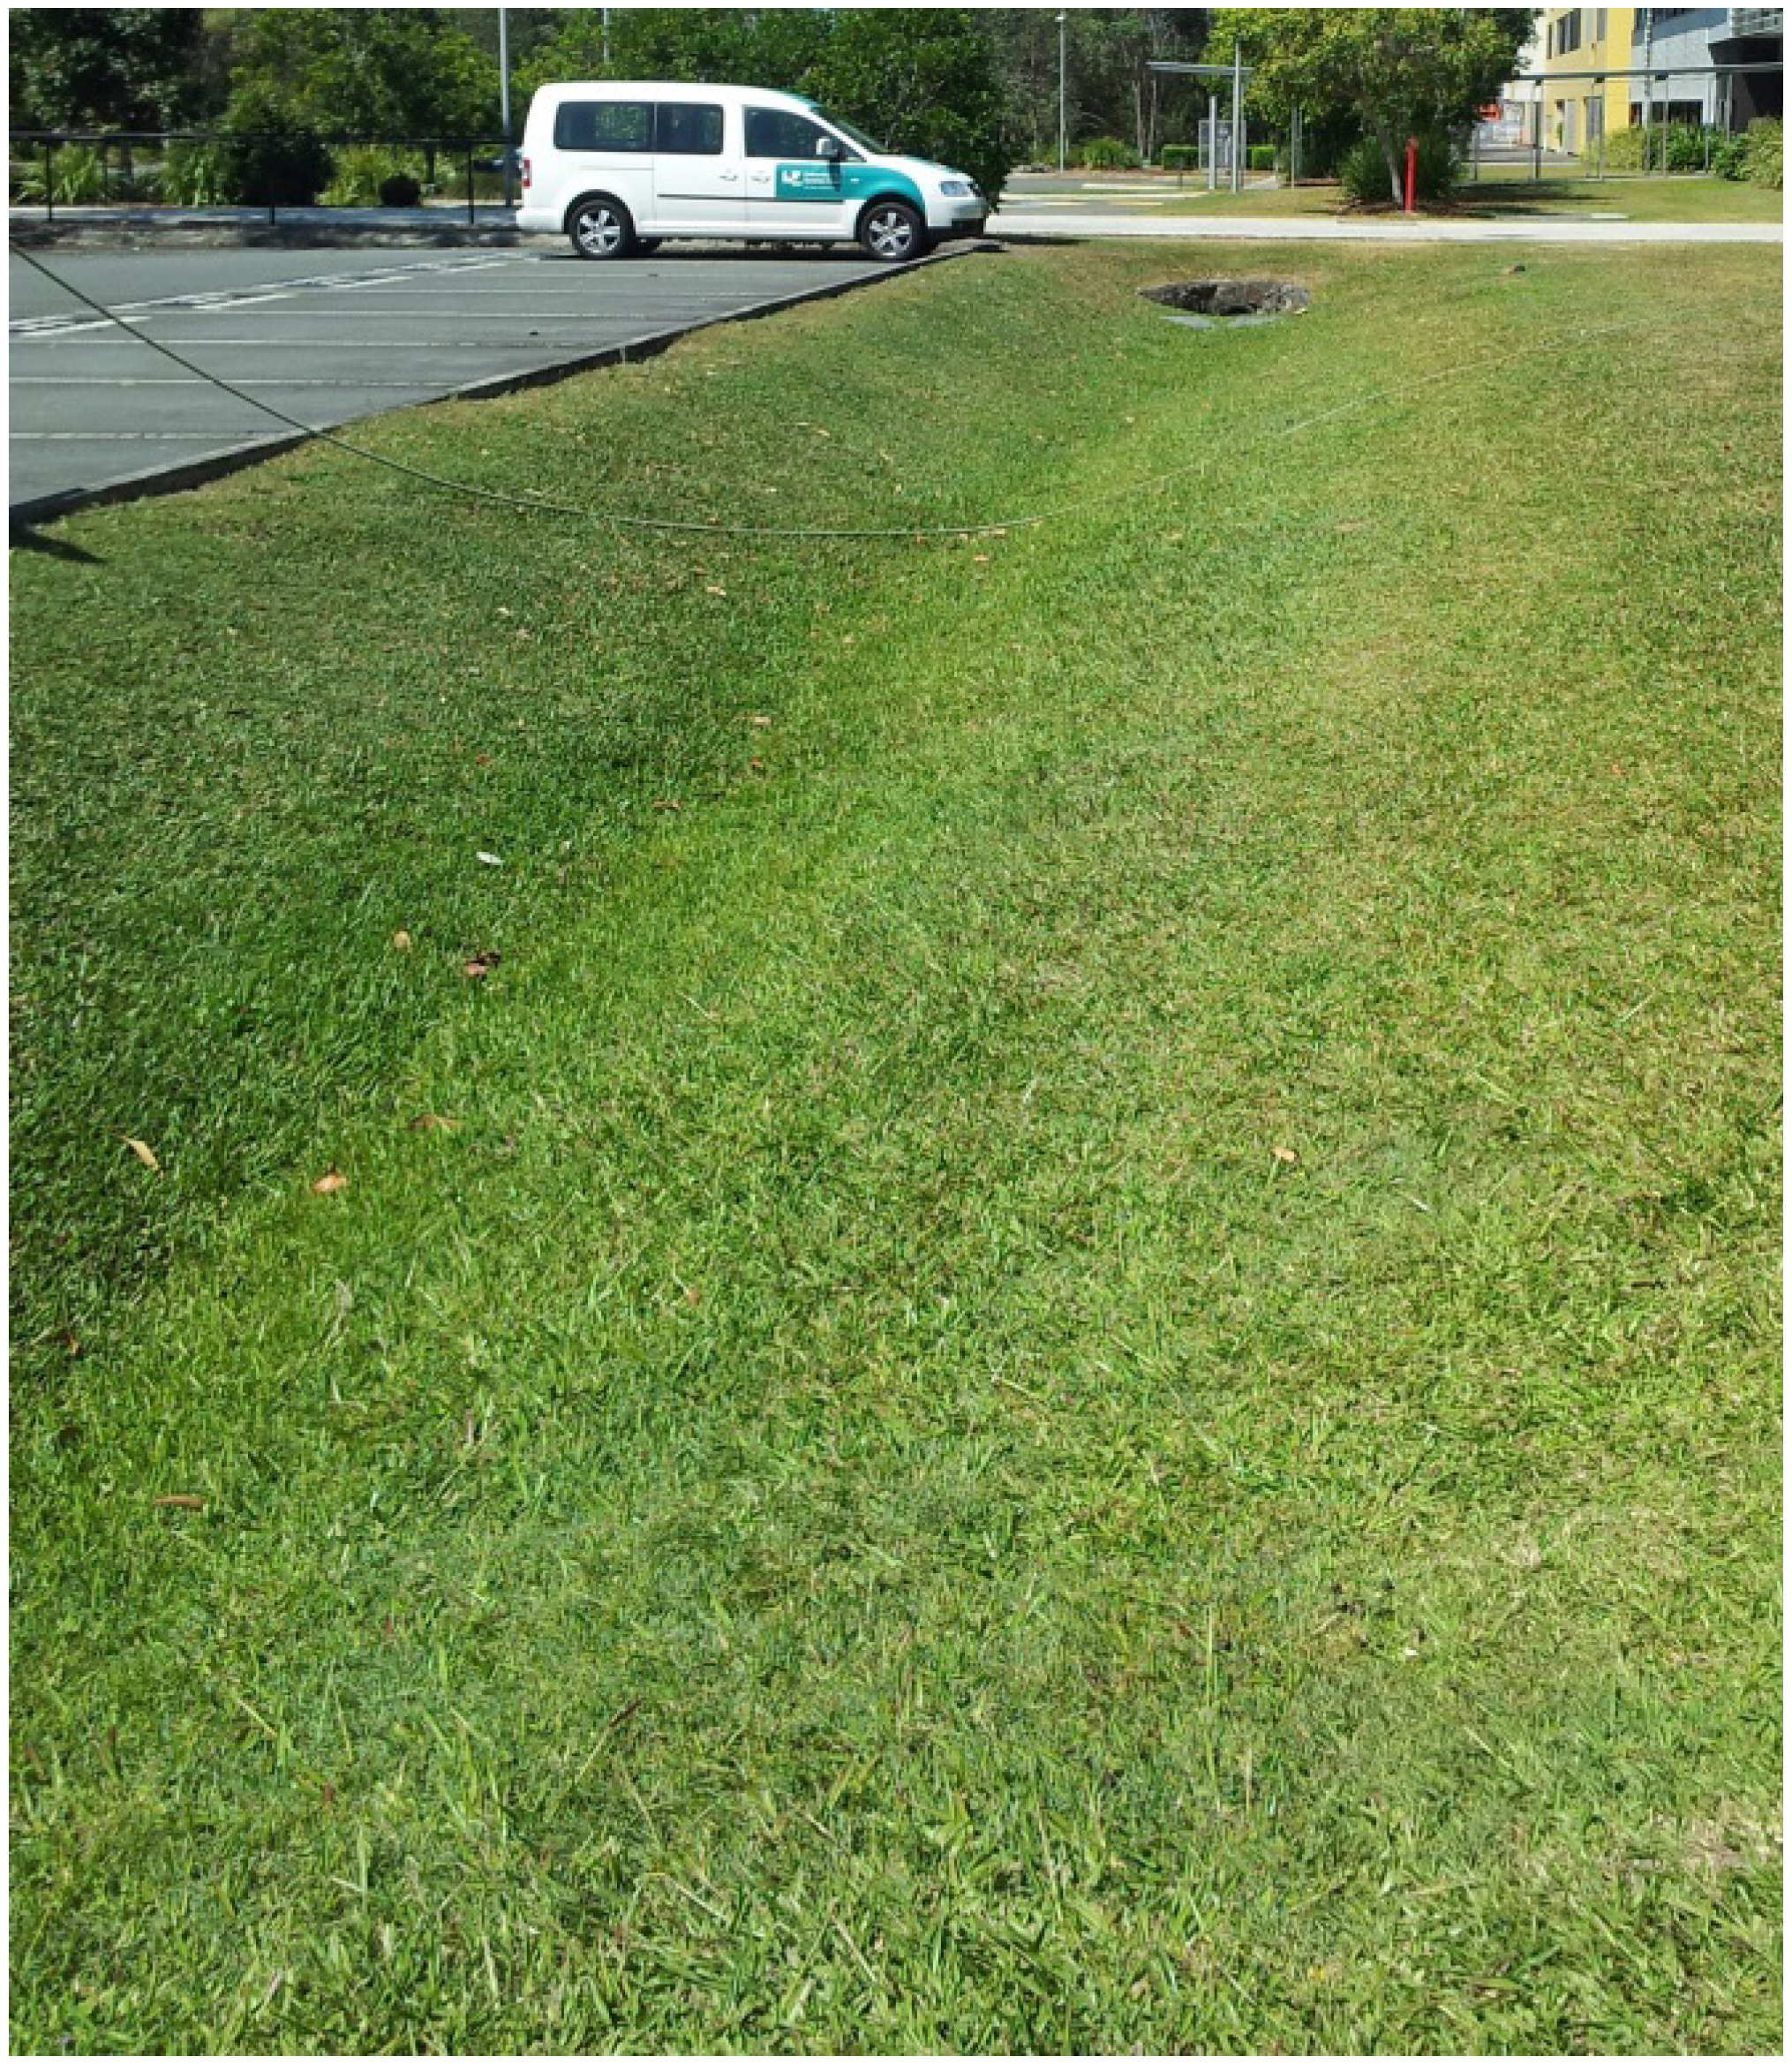
Figure 1 shows the CPB swale that was used in simulation experiments. All four study swales had similar characteristics with the grass type of kikuyu (
Pennisetum clandestinum). Experiments were performed in swales within seven days of mowing, and the grass heights were varied between 10 and 60 mm.
Table 5.
Study swale characteristics.
Table 5.
Study swale characteristics.
| Swale Name | Swale characteristics |
|---|
| Length (m) | Shape | Dimensions (m) | Slope (%) | Grass type and grass height (mm) |
|---|
| USC Engineering (USC) | 35 | Triangular | b = 4.0, h = 0.16 | <1 | Kikuyu, 10–60 |
| Sports Complex (SC) | 35 | Triangular | b = 6.1, h = 0.44 | <1 | Kikuyu, 10–60 |
| Innovation Centre (IC) | 35 | Triangular | b = 3.0, h = 0.35 | 1 | Kikuyu, 10–60 |
| Car Park–B (CPB) | 30 | Triangular | b = 4.3, h = 0.49 | 1 | Kikuyu, 10–60 |
Figure 1.
Car Park-B (CPB) swale used in simulation experiments.
Figure 1.
Car Park-B (CPB) swale used in simulation experiments.
Experiments were conducted in 2012 and 2013, identified as R1 (Round 1) and R2 (Round 2) in
Table 6. The experiments were conducted at least one day apart in order to allow the soil moisture to stabilise between tests. A runoff simulation approach similar to that used by Deletic and Fletcher [
15] was employed in this field study. Each round (R1 and R2) had 12 individual experimental runs. To simulate the rainfall events, a 2000 L tank filled with clean water was used. The first set of experiments in 2012 (R1) were conducted using an average inflow rate of approximately 1.6 L/s for 21 min. The selected flow rate and the duration were limited by the capacity of the tank. However, this flow rate was considered to be appropriate to simulate a one year, 21 min, average recurrence interval (ARI), naturally occurring storm event (rainfall intensity = 29.3 mm/h) typically experienced on the Sunshine Coast.
Table 6.
Experimental arrangements and tested parameters.
Table 6.
Experimental arrangements and tested parameters.
| Test Name | Swale Name | Experiment | Inflow | IVMC (%) | Outflow (%) | WQ Tests |
|---|
| Round—R1 (Experiments performed in 2012) | USC Engineering (USC) | R1-USC-TA | 2000 L of runoff delivered into the swales at an approximate average flow rate of 1.6 L/s (simulating 21 min runoff events) | NM | NM | TSS, TN & TP (Samples collected at every 5 m along swales and analysed for these WQ parameters) |
| R1-USC-TB |
| R1-USC-TC |
| R1-USC-TD |
| Sports Complex (SC) | R1-SC-TA |
| R1-SC-TB |
| R1-SC-TC |
| R1-SC-TD |
| Innovation Centre (IC) | R1-IC-TA |
| R1-IC-TB |
| R1-IC-TC |
| R1-IC-TD |
| Round—R2 (Experiments performed in 2013) | USC Engineering (USC) | R2-USC-TA | 2000 L of runoff delivered into the swales under varying flow rates of 0.5–2.0 L/s (simulating 30 min runoff events) | 39.5 | NM | TSS, TN, TP & PSD (TSS and PSD analysis performed on samples collected at every 5 m along swales and nutrient tests were performed with every 10 m samples) |
| R2-USC-TB | 45.6 | NM |
| R2-USC-TC | 10.2 | 46.5 |
| R2-USC-TD | 34.3 | 53.5 |
| Sports Complex (SC) | R2-SC-TA | 47.2 | NM |
| R2-SC-TB | 27.6 | NM |
| R2-SC-TC | 11.3 | 0 |
| R2-SC-TD | 19.5 | 0 |
| Car Park–B (CPB) | R2-CPB-TA | 35.0 | 42.1 |
| R2-CPB-TB | 52.0 | 68.1 |
| R2-CPB-TC | 48.5 | 75.0 |
| R2-CPB-TD | 52.3 | 88.3 |
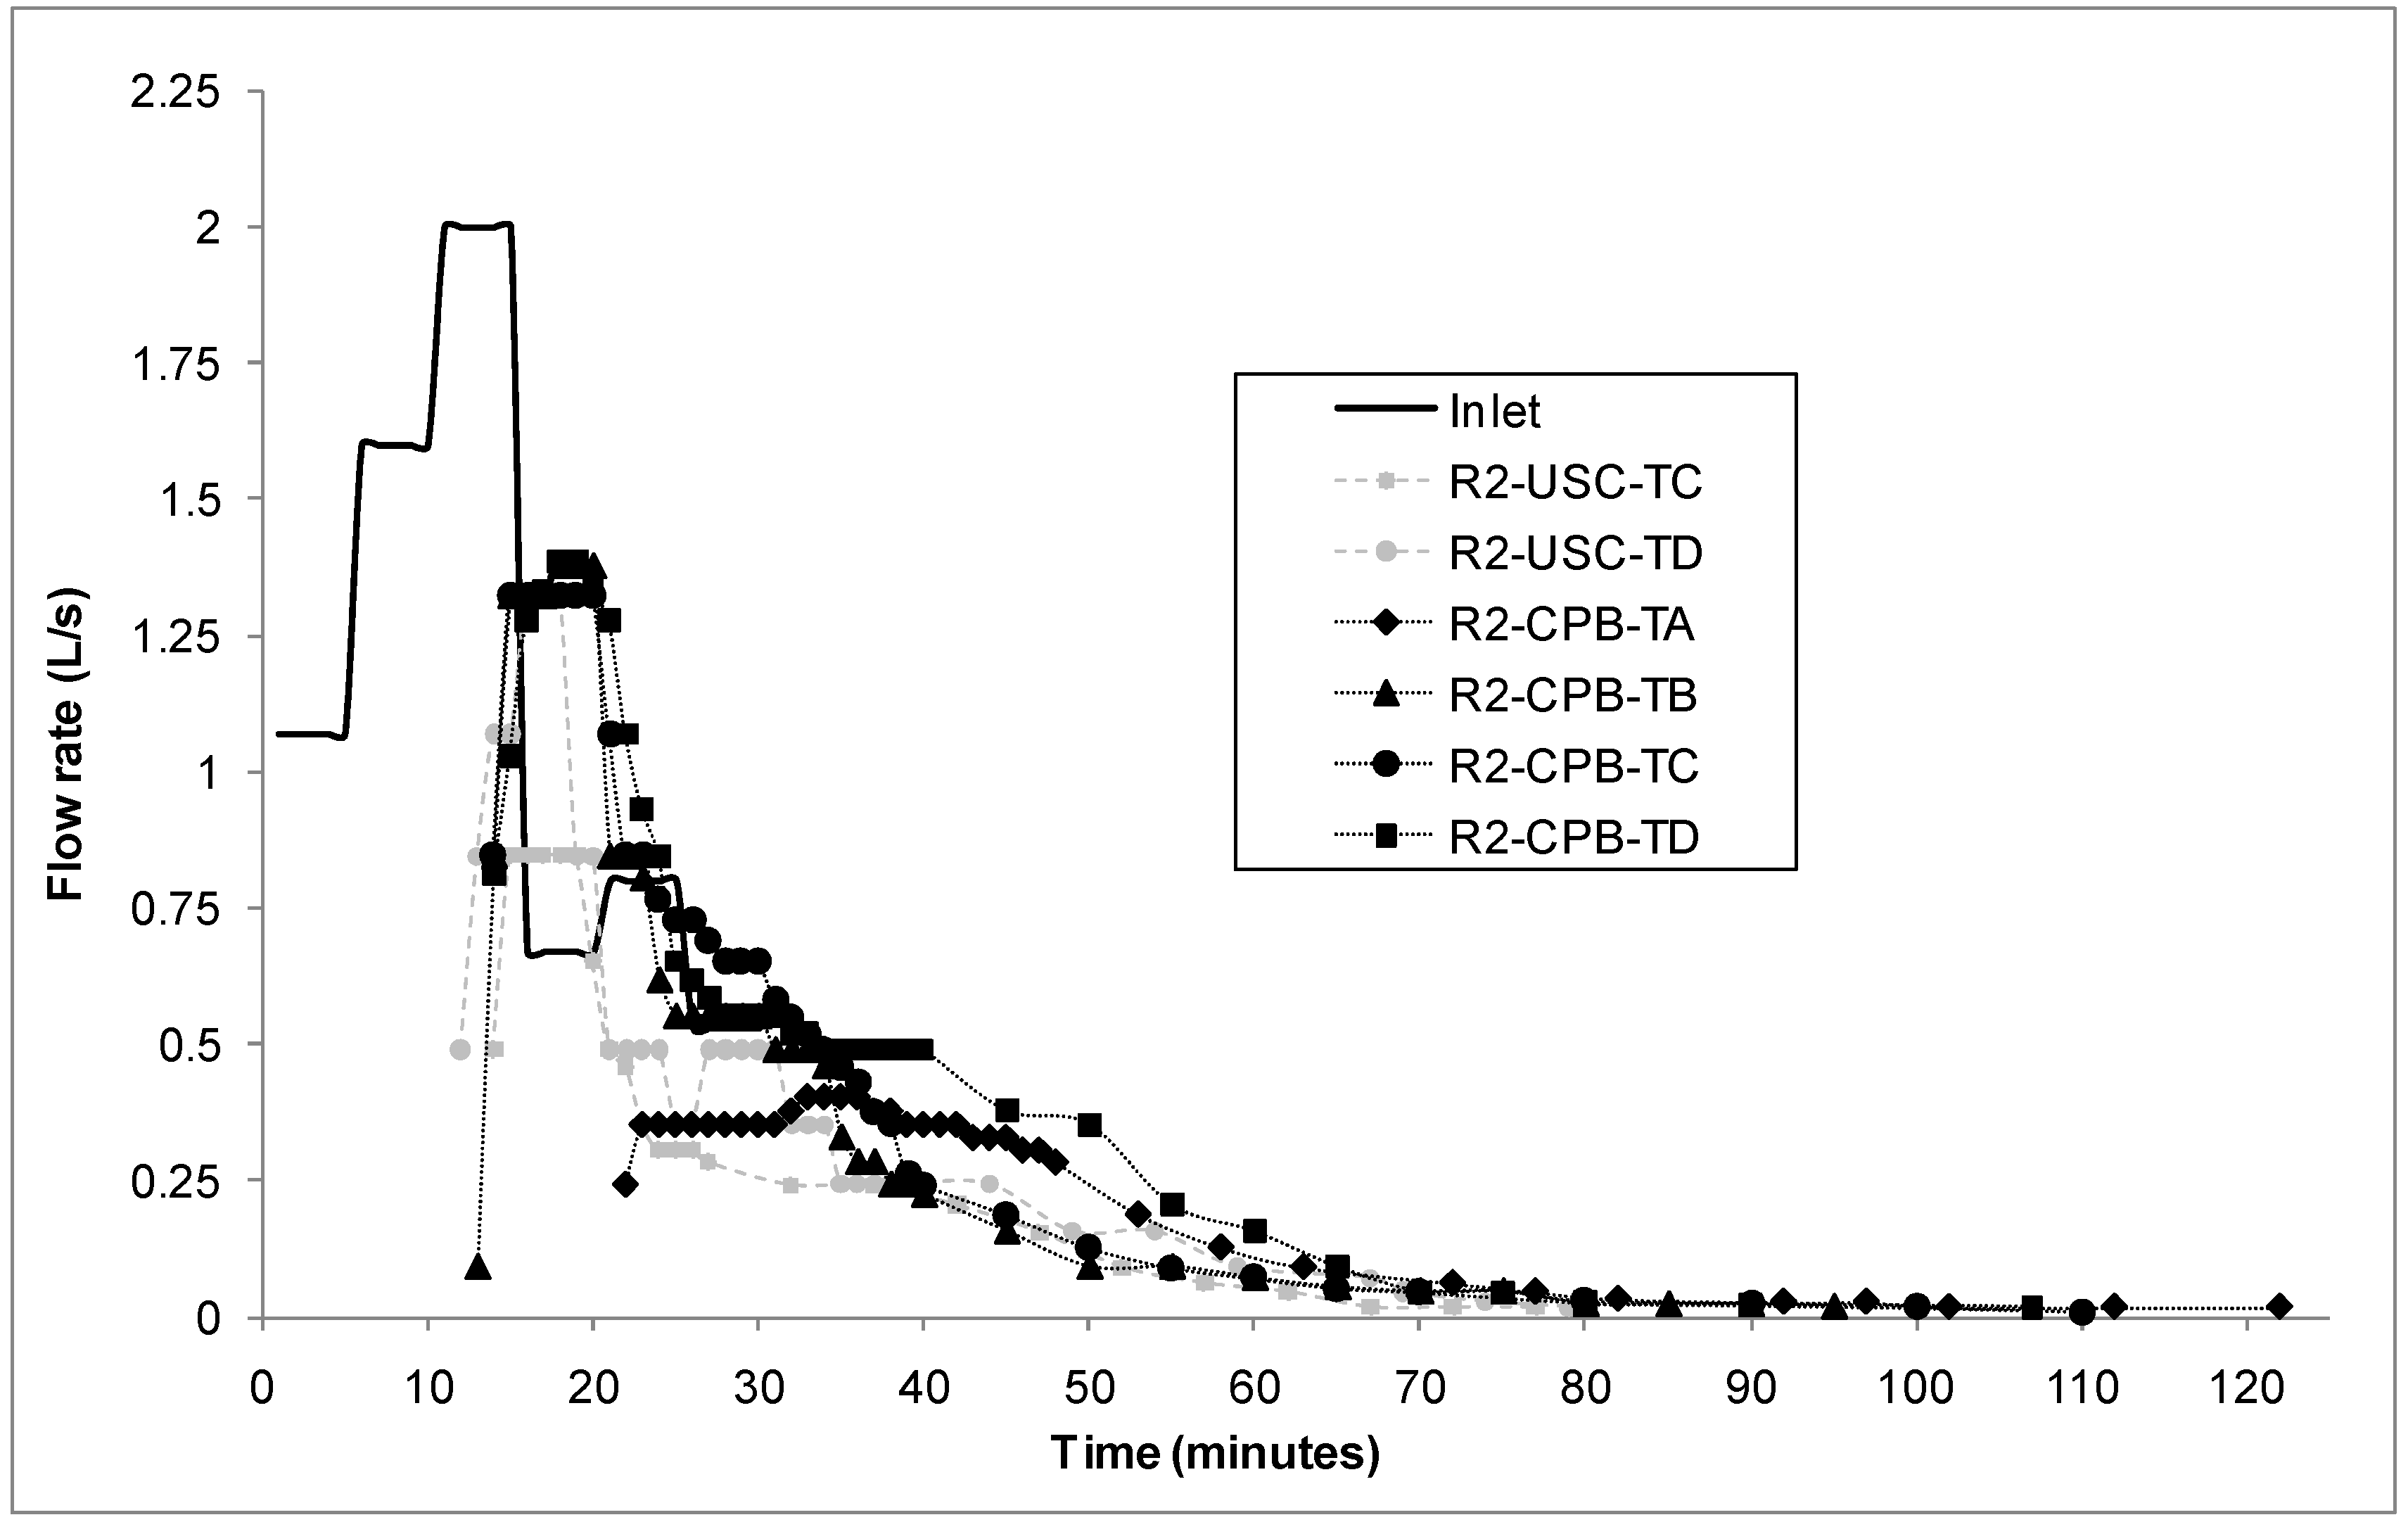
In 2013 (R2), the Innovation Centre (IC) swale was replaced by Car Park-B (CPB) swale for field simulation experiments due to non-accessibility to the IC swale. For the second set of experiments (R2) conducted in 2013, the swale inflow rates were varied from between 0.5 and 2.0 L/s based on the hydrograph from a one year, 30 min ARI rainfall event. Inflow rates were regulated using an electromagnetic flow meter to measure and a valve at the 2000 L tank outlet. The PSD of the water sample sediment was also analysed. In R2, initial swale moisture contents of swales were measured, and swale outflow measurements were also performed (
Table 6). The moisture content of the swale soil profile was measured at different locations using a moisture probe that records volumetric moisture content of the soil matrix. The average measured moisture value can be seen in
Table 6 in the IVMC column. The flow rate at the outlet was measured continuously throughout the event using a sharp edged V-notch weir during R2 experiments.
Synthetic pollutant constituents were used in the experiments to simulate runoff pollutant levels, which allowed finer control of their concentration levels. Both R1 and R2 experiments were designed with different pollutant concentrations in order to help understand the performance of swales under varying pollutant discharges. This can be related to conditions occurring during the “first flush” phenomenon events, as well as typical pollutant loads. Each swale was tested under four different inlet pollutant loading conditions referred to as TA, TB, TC and TD as in
Table 4.
Test-A (TA) was a control experiment, with no added pollutants, to determine the background concentration of the pollutant constituents in each swale tested. All other test runs were carried out with the addition of pollutants as shown in
Table 4. Test-B (TB) was designed to simulate urban runoff pollutant concentrations typically found in Australian urban catchments [
15,
19]. Commercially available silica powder, which closely resembled the PSD of sediment found in urban runoff, was used as the synthetic TSS constituent in the simulated stormwater inside the tank. Chemical reagents KNO
3 and KH
2PO
4 were used to simulate the TN and TP loads respectively. Test-C (TC) and Test-D (TD) were comprised of pollutant concentrations five times and ten times higher than typical Australian urban stormwater pollutant concentrations.
To ensure a relatively homogeneous water column inside the tank, and to maintain constant concentrations of influent pollutant concentrations at the swale inlet, a stirring system using a submersible pump was used inside the 2000 L tank. Synthetic runoff water inside the tank was mixed for 30 min before each experiment, and during each runoff simulation.
Marginal variations in the swale inlet TN and TP concentrations could be attributed to the compound effect of nutrients attached to settled sediments within the tank, and from residual nutrients inside the tank or water (
Table 4). Swale inlet pollutant concentrations found during Test-A experiments represent the background pollutants present in the clean water. Samples from the tank outlet every five minutes revealed that outflow concentrations of TSS could vary by up to ±10% during simulations, possibly due to settling of larger particles in the tank.
The release of runoff into the swale was adjusted to different inflow hydrographs and took place for 21 min in R1 experiments and for 30 min in R2 experiments.
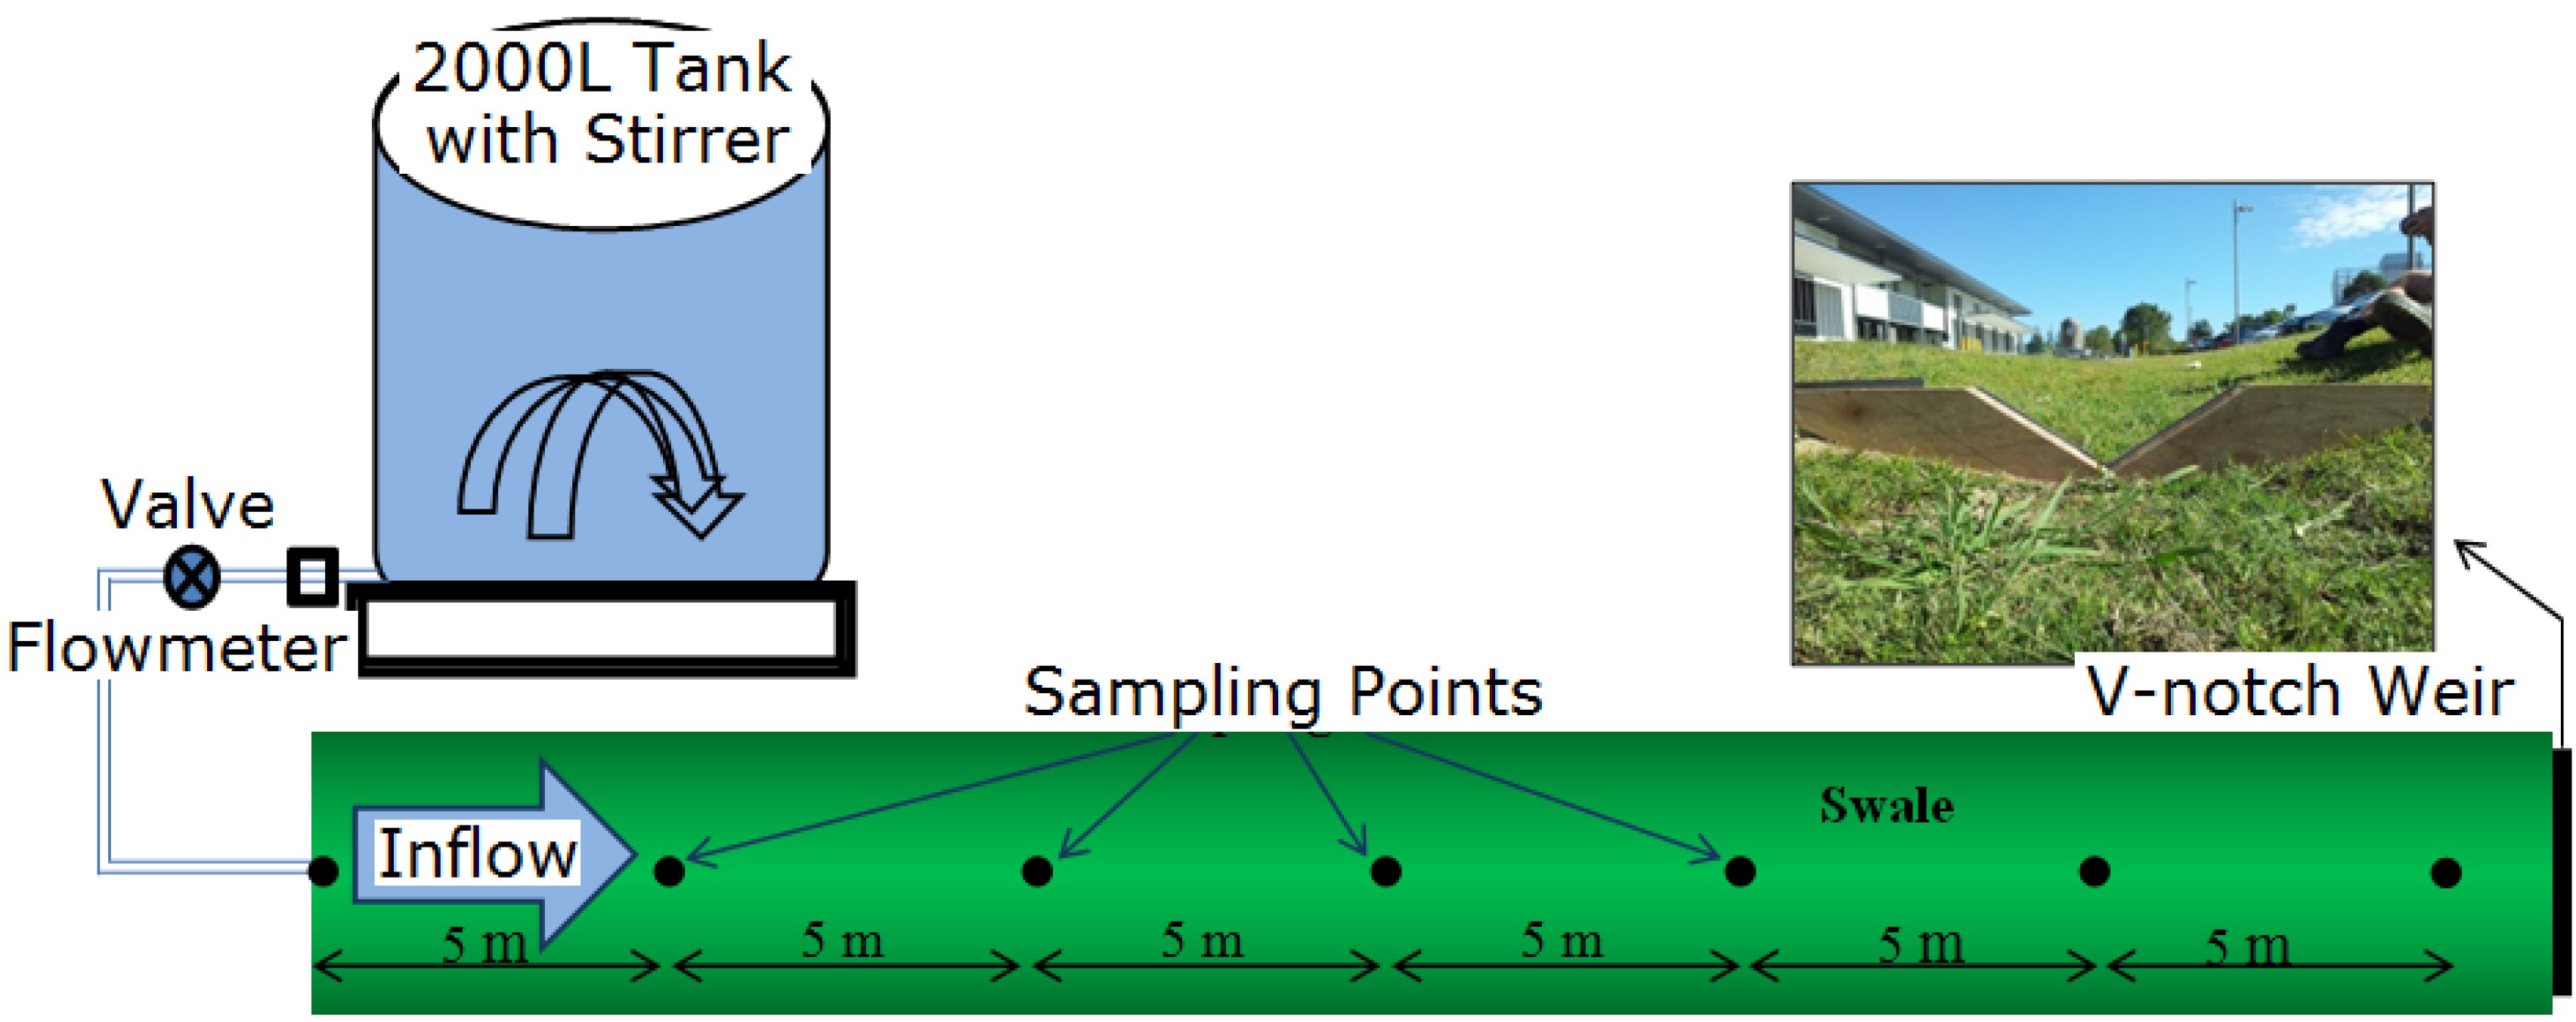
Manual grab samples were collected at selected sampling points located along the length of the swales.
Figure 2 shows the conceptual swale testing setup and typical swale testing locations. Water samples were collected at the inlet, the outlet and at every either 5 m (for TSS, TN & TP in R1 and for TSS in R2) or 10 m (for TN & TP in R2) along the length of the swale (
Table 5,
Figure 2). Three individual samples of 300 mL were collected at each of the sampling locations at between 10 and 15 min intervals during the experiments. The three samples were later mixed together to form composite samples for each sampling point. Sampling was undertaken carefully to avoid disturbing the swale bed.
Collected samples were taken to the USC analytical lab within three hours of the field collection. Each water sample was preserved in accordance with the Standard Methods for the Examination of Water and Wastewater and then analysed for TSS, TN and TP according to APHA/AWWA/WEF [
20]. Each sample was analysed for PSD of the suspended solid contents using a laser particle sizer—Malvern Mastersizer 3000 [
21].
Figure 2.
Conceptual swale testing setup.
Figure 2.
Conceptual swale testing setup.
6. Conclusions
Four different field swales were tested during 24 standardised synthetic runoff simulation experiments under varying pollutant loading conditions to evaluate their performance in removing TSS, TN and TP from stormwater runoff. Hydraulic reduction capability of the swales was also assessed by flow measurements carried out at the outlet of the swale during some of the experiments.
Flow measurements demonstrated a mean total flow reduction of 52% in the 30 m long swales studied, with a peak flow reduction of 61%. The initial soil moisture content of a swale was shown to affect infiltration rates, total flow volumes and peak discharges. The study results have demonstrated that swales can be used successfully to attenuate peak stormwater flow rates and to substantially reduce runoff volumes to downstream water courses which can significantly improve the quality of stormwater runoff.
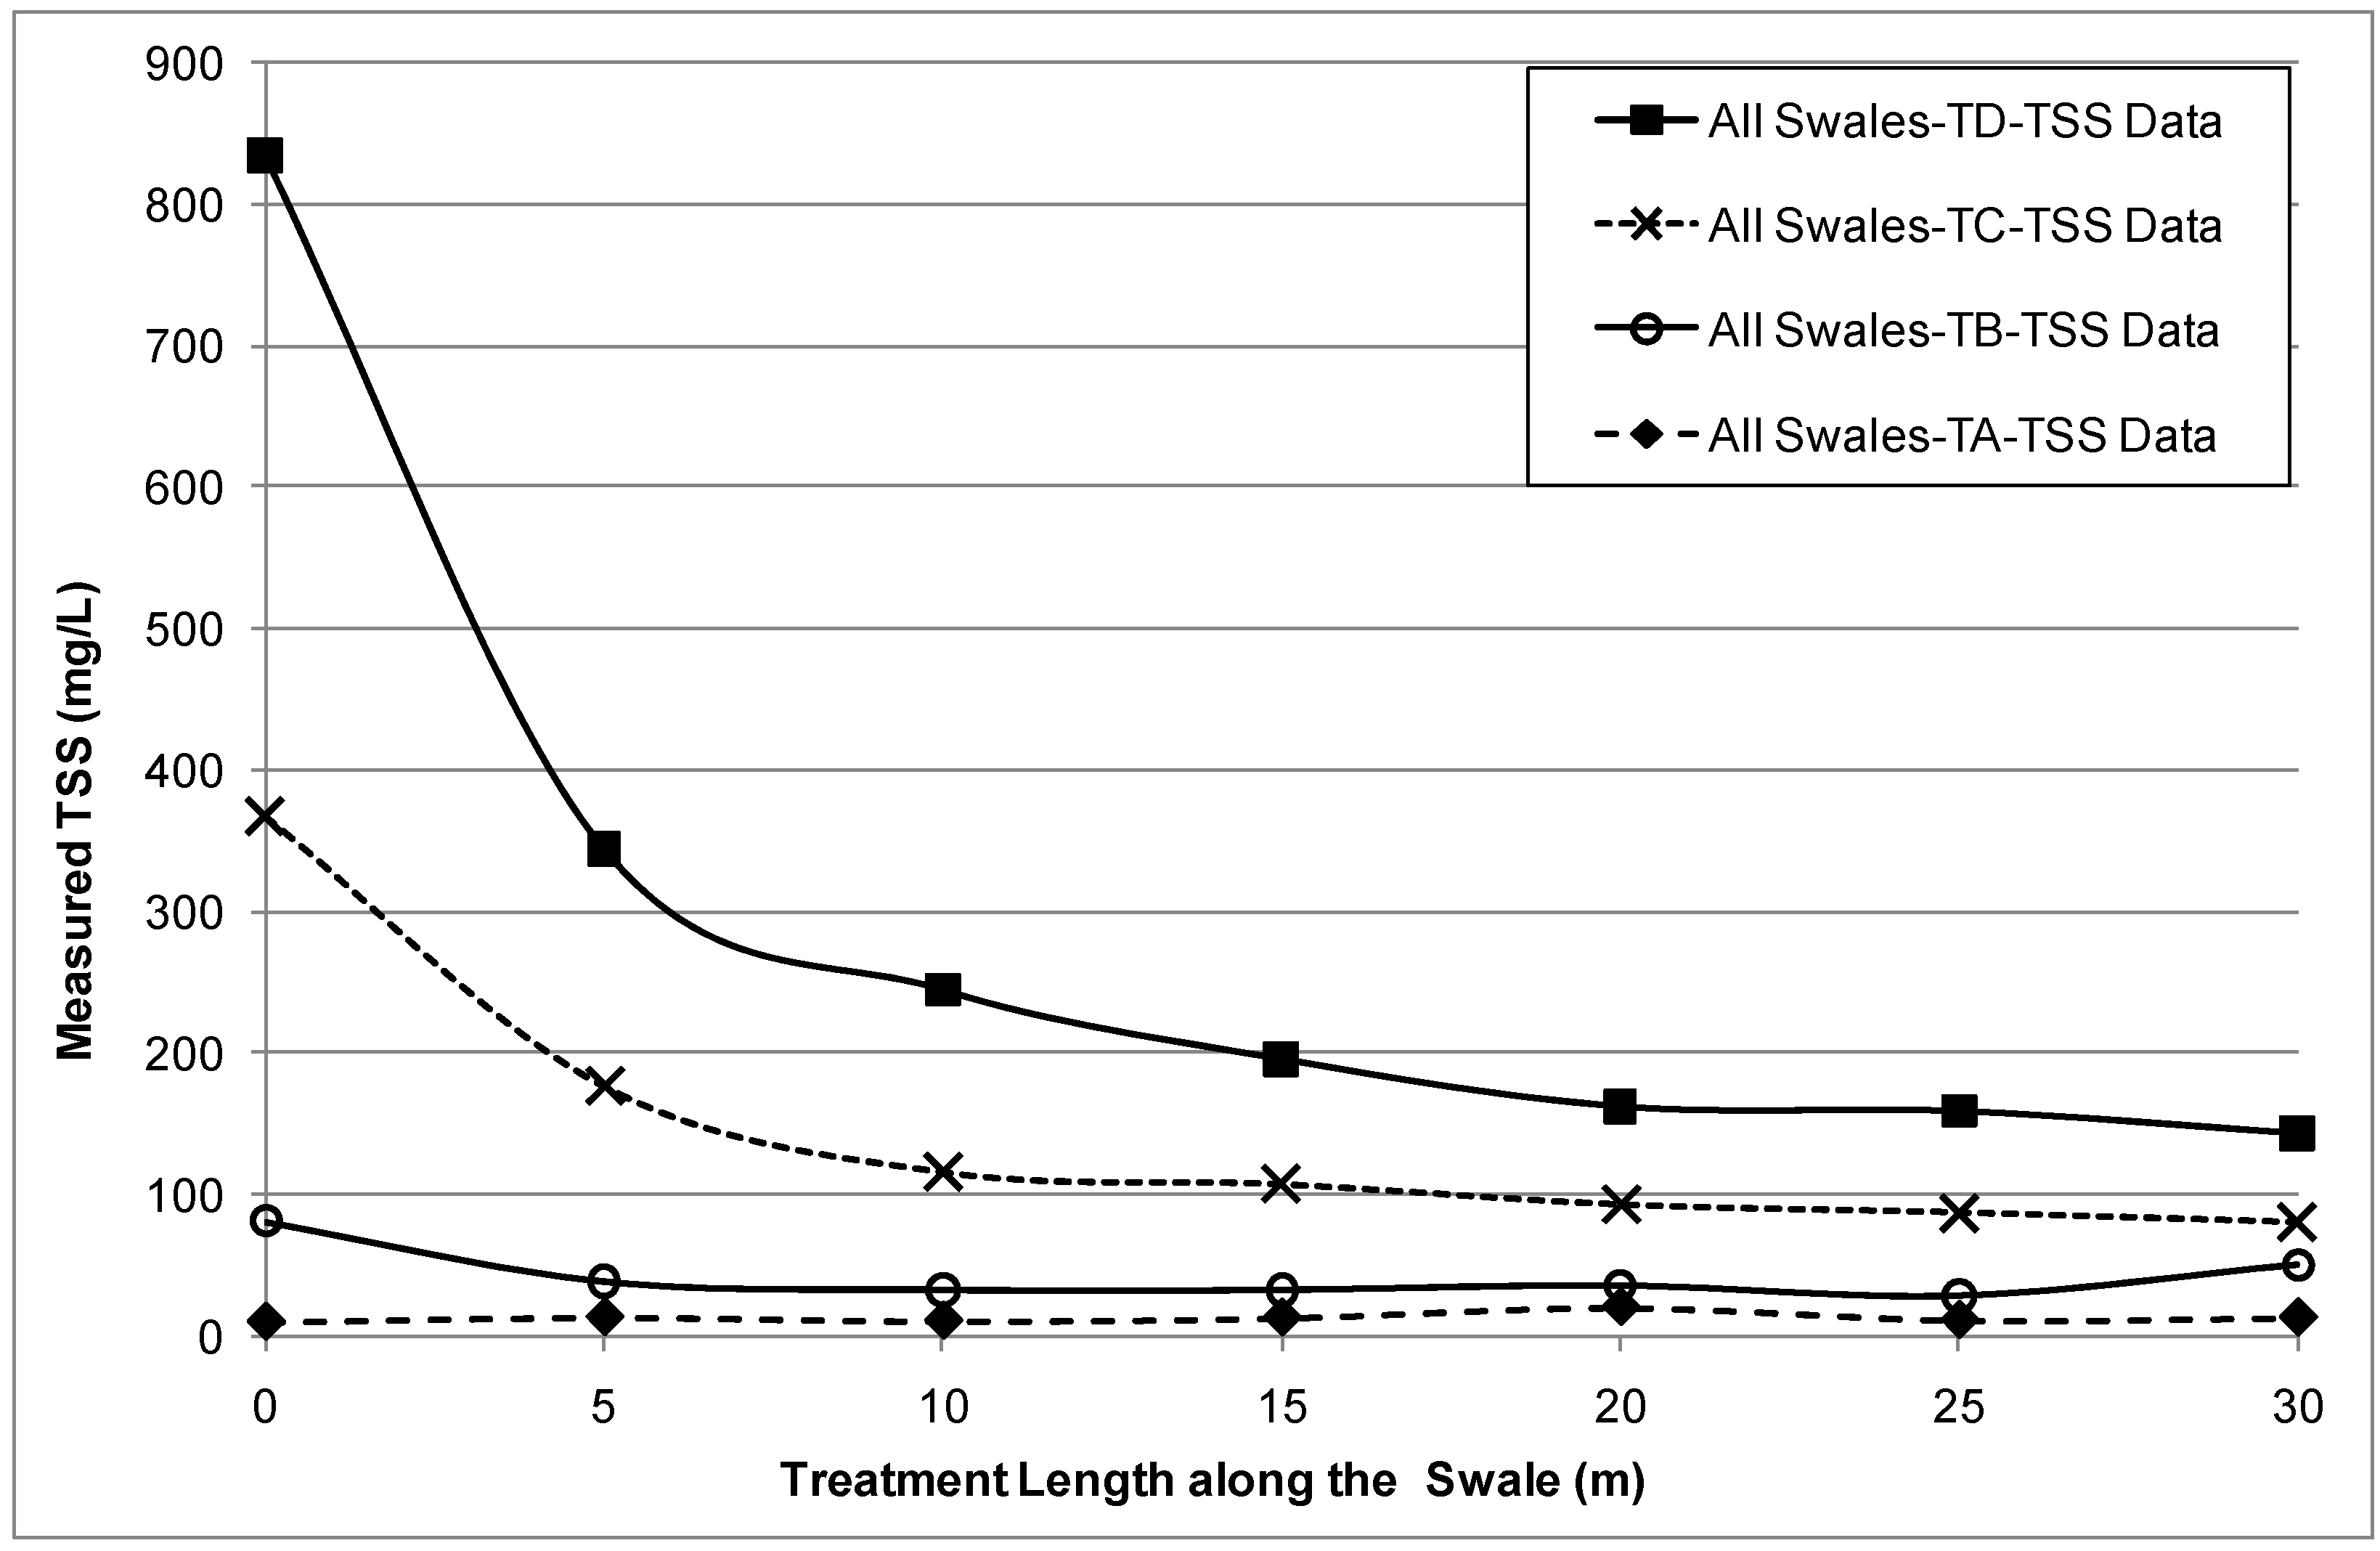
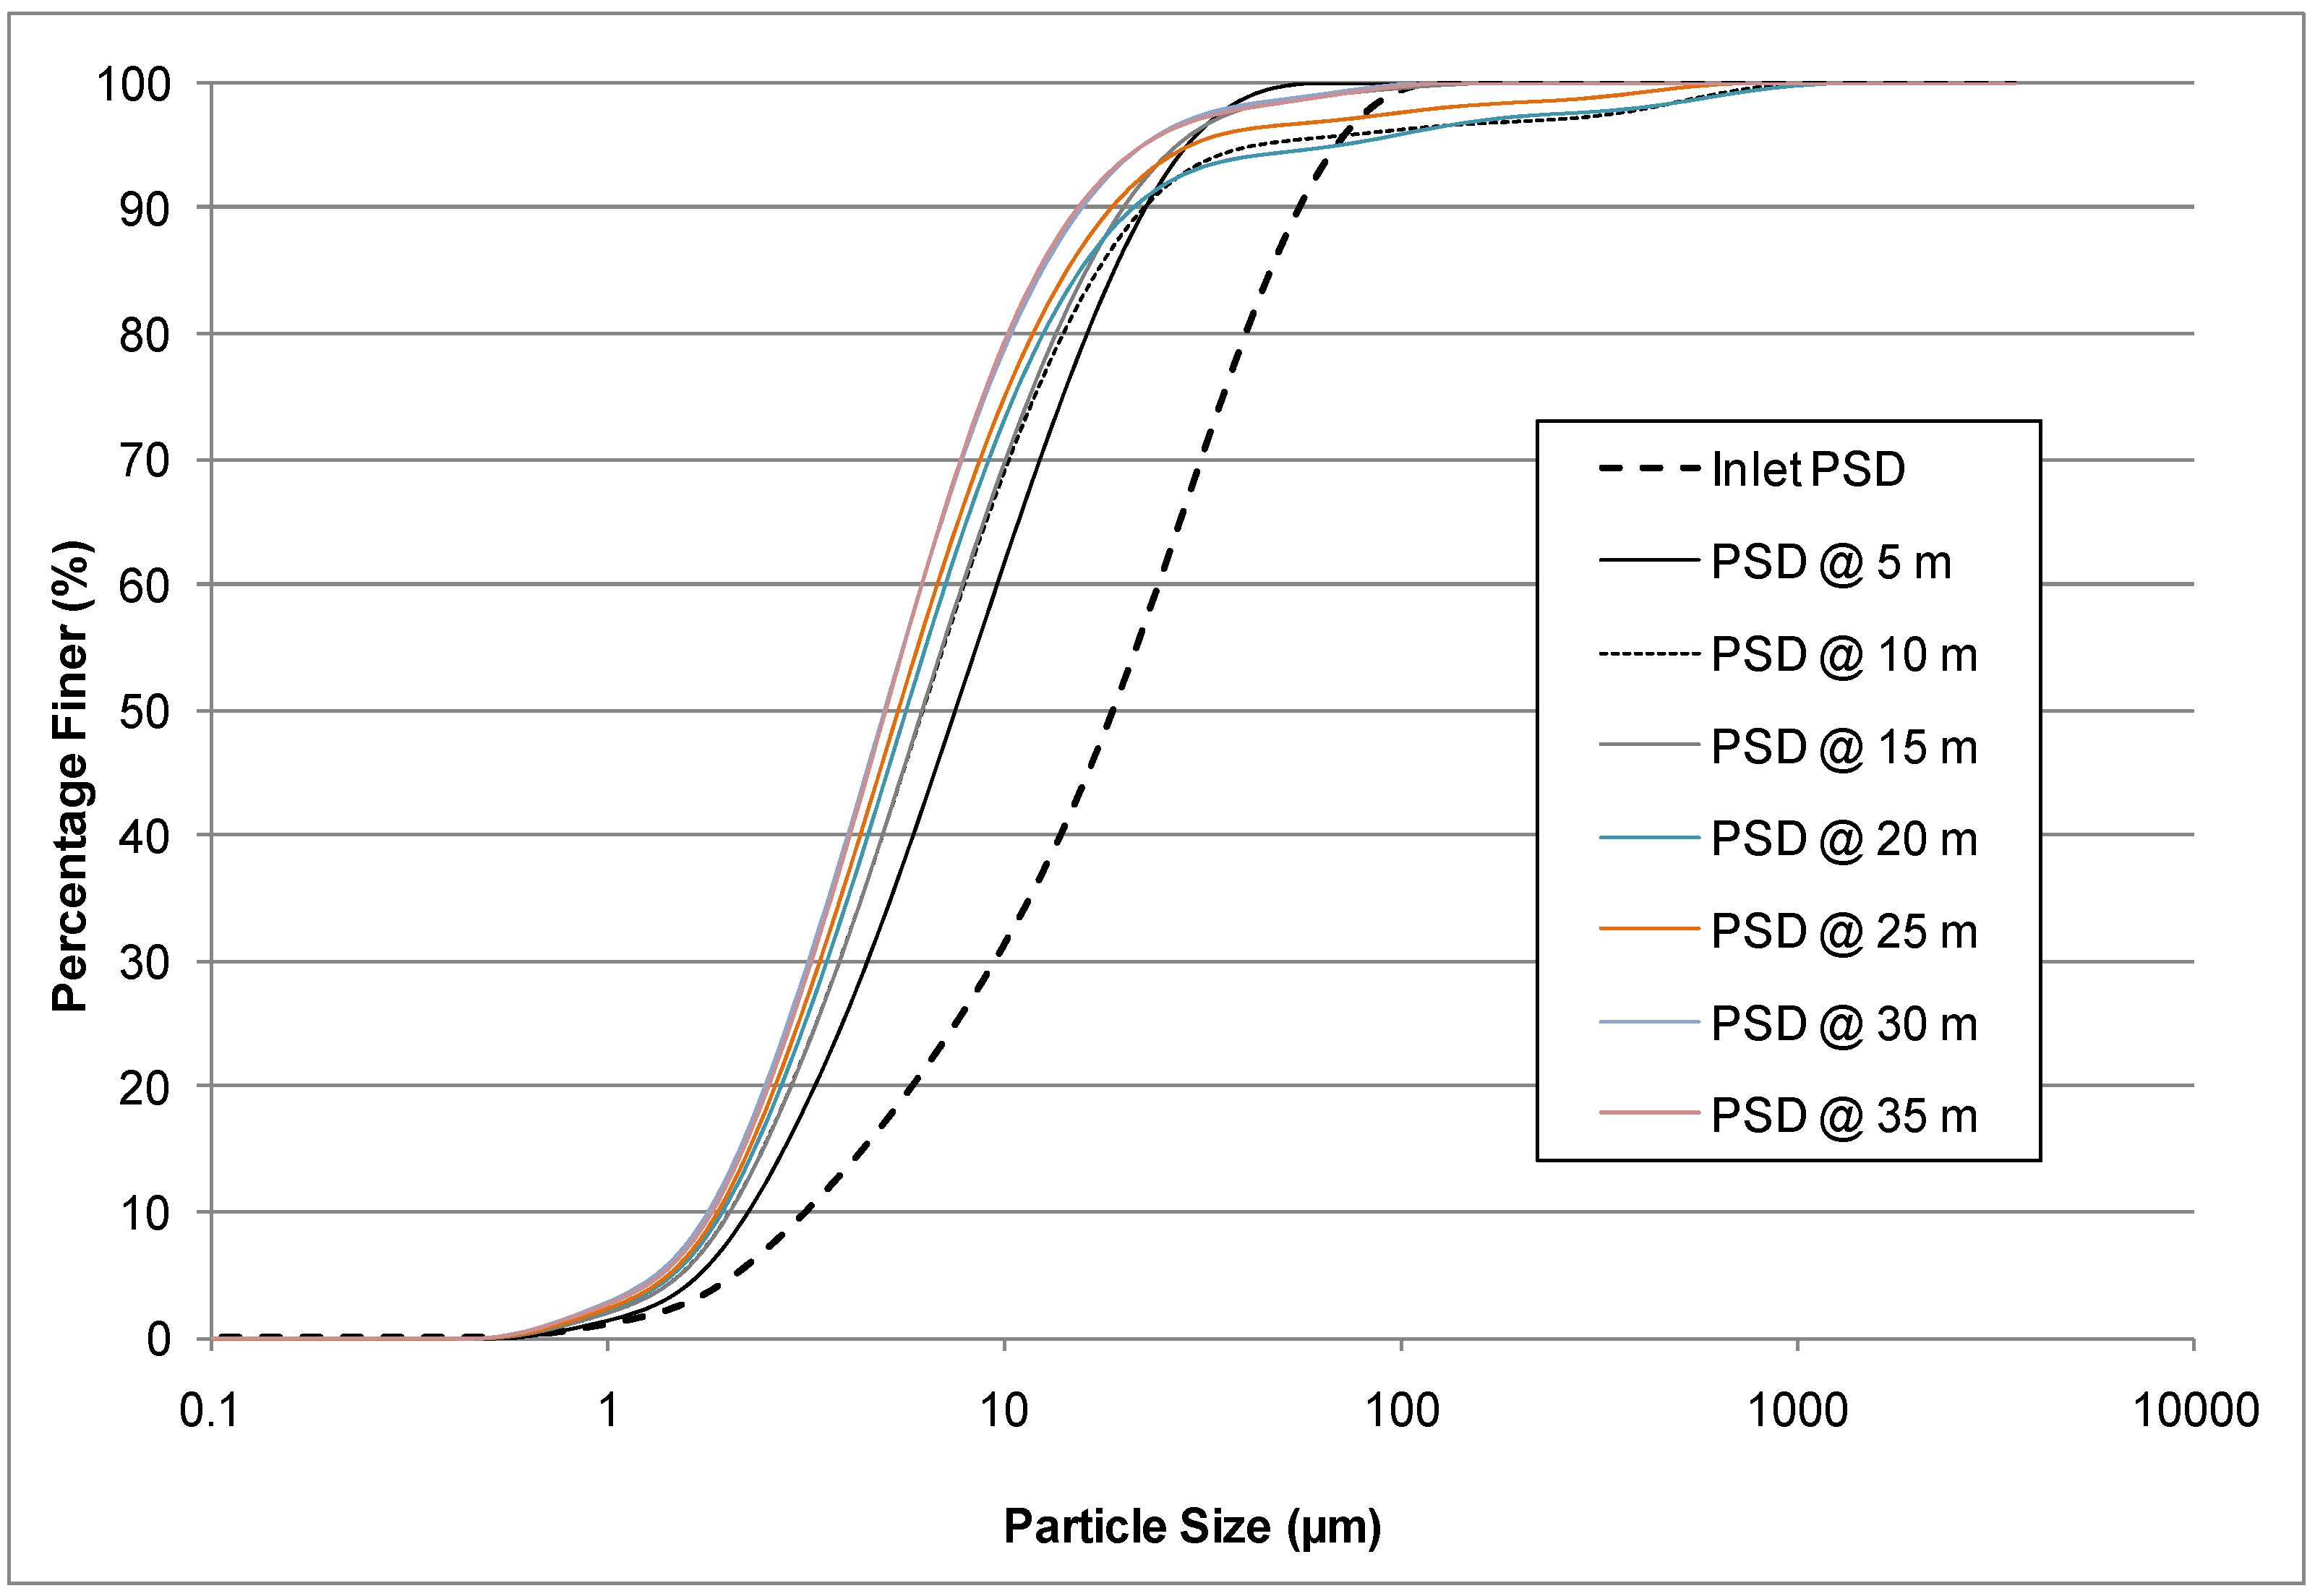
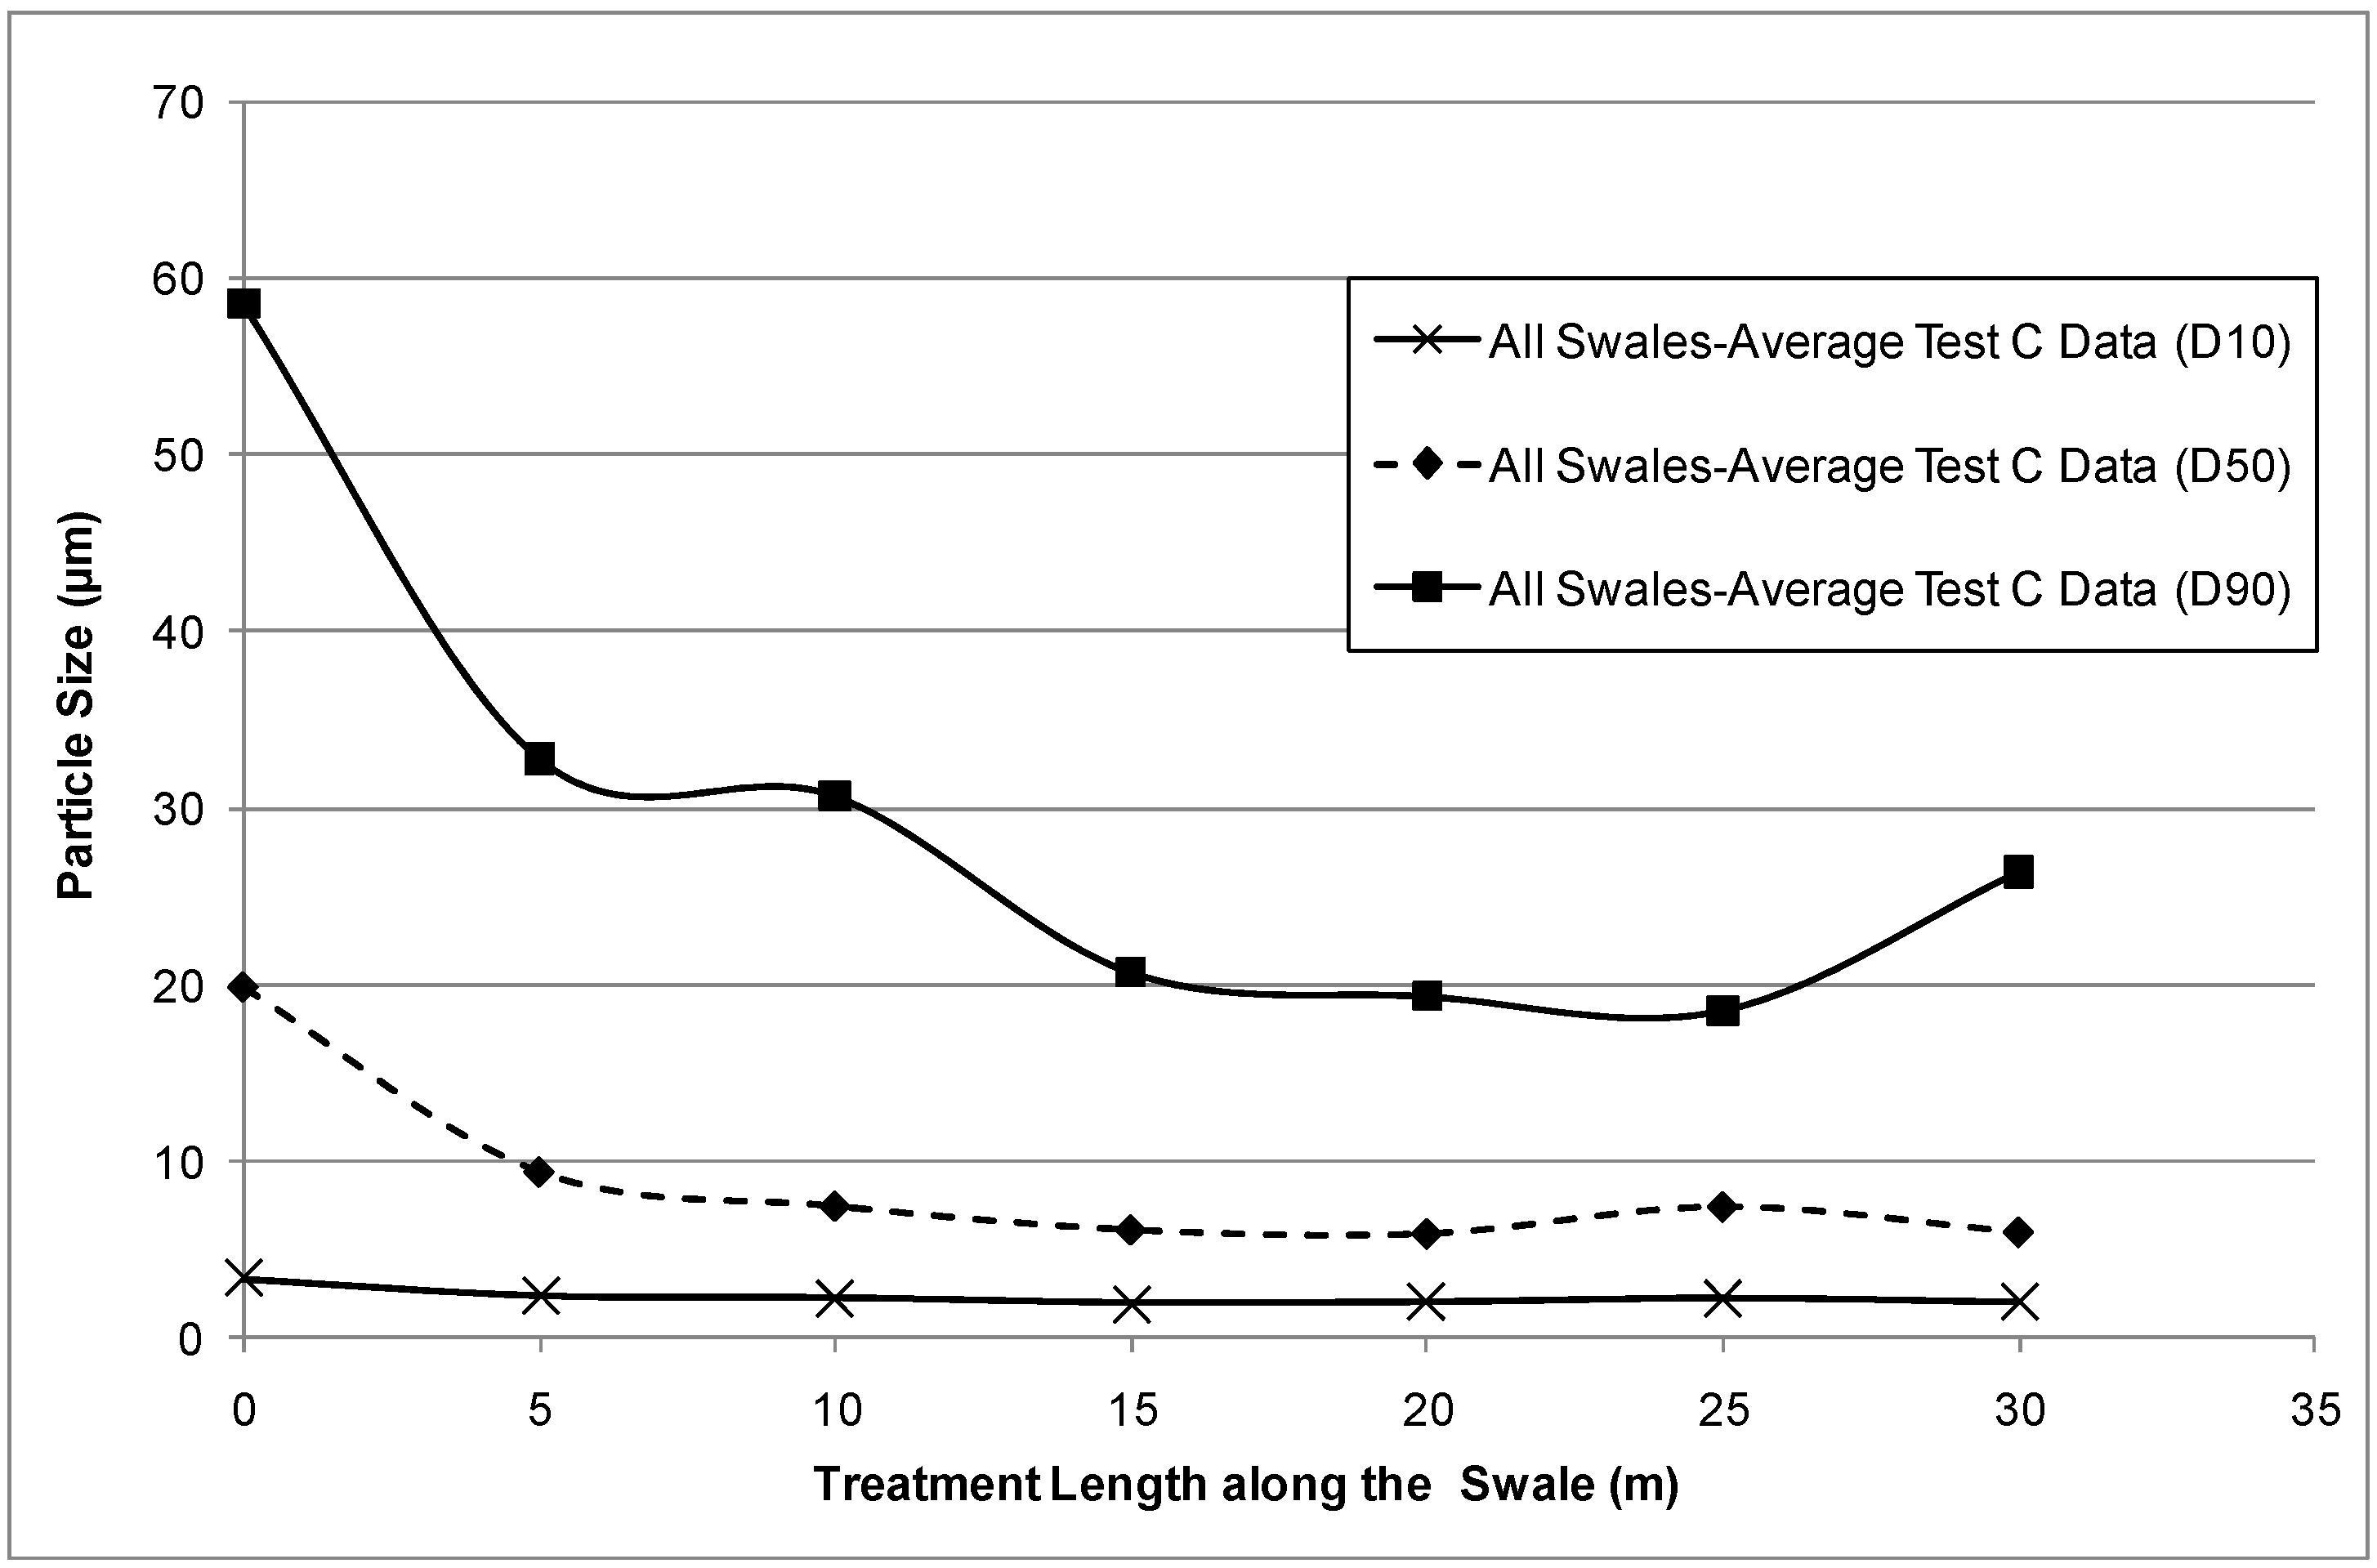
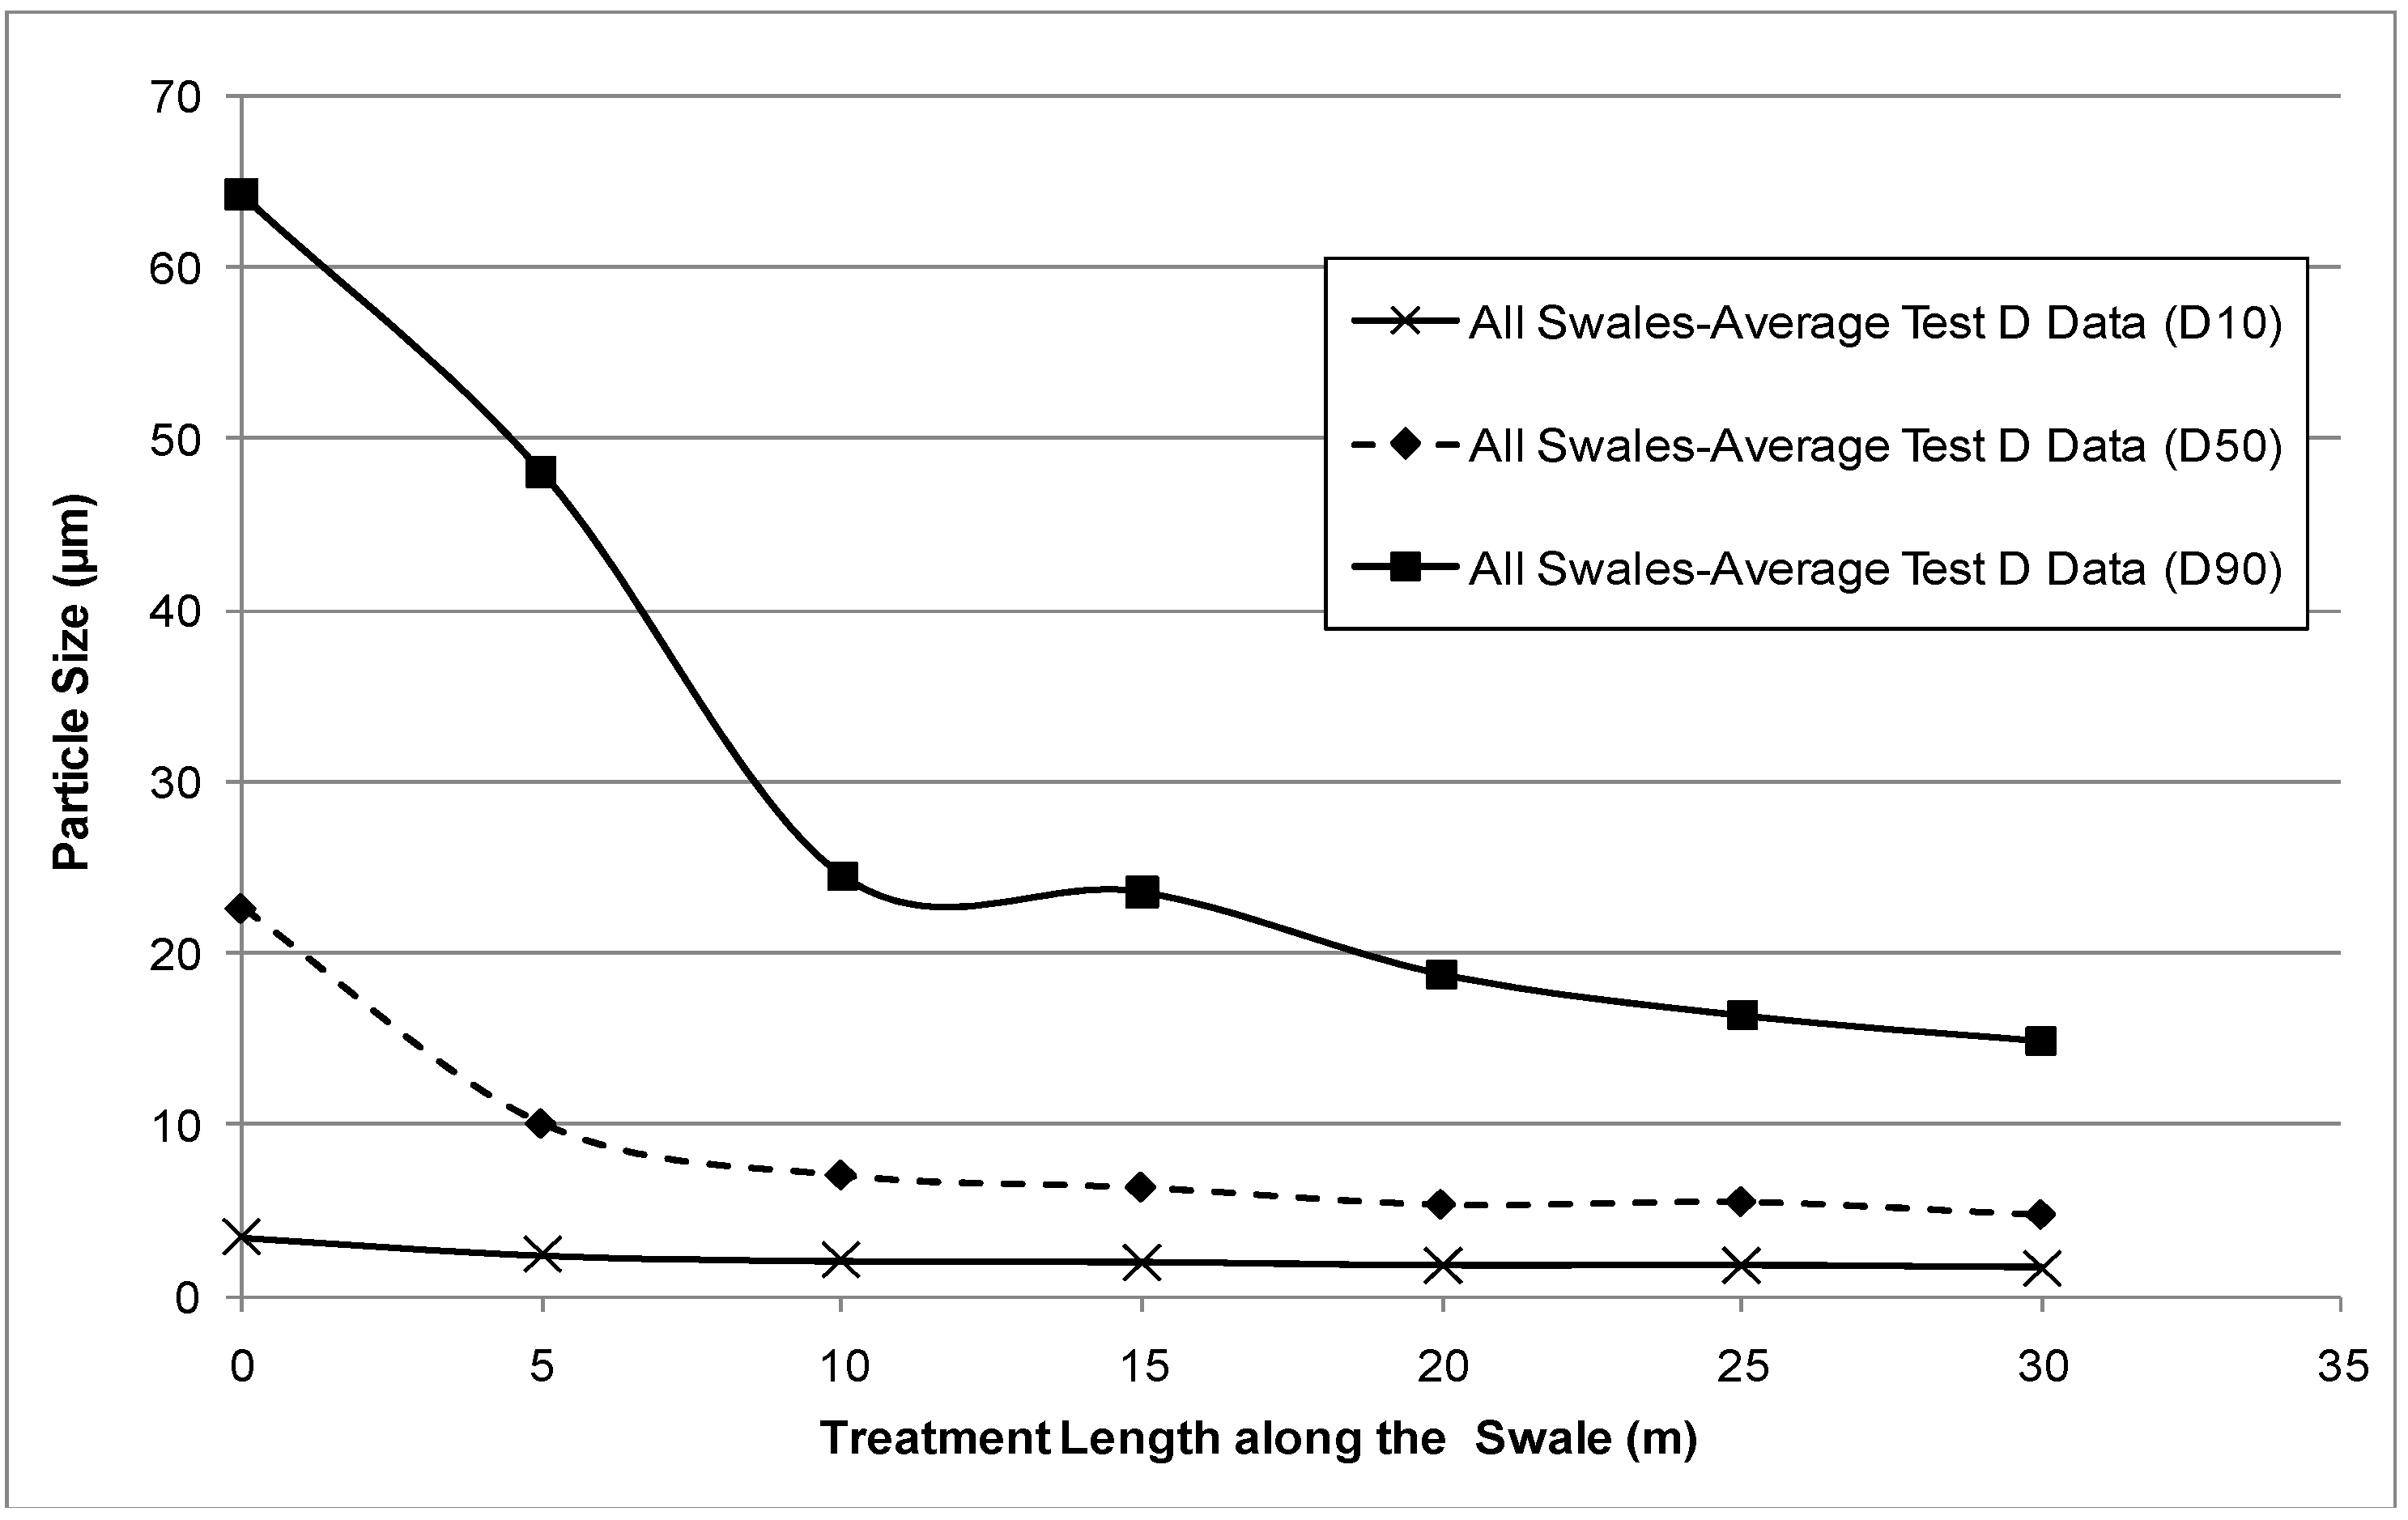
The study has shown that swales were effective in reducing the higher TSS concentrations used in the tests. However, the results demonstrate that a swale’s TSS removal performance is highly dependent on the inlet concentrations. Results showed that between 50% and 80% of the TSS was generally removed within the first 10 m of the swales. A further 10% to 20% reduction in TSS concentrations can be expected in swales up to 30 m long. The study also demonstrated that swales can be used to treat higher pollution loads typically associated with the “first flush” phenomenon.
The study has found that swales can be used effectively as a primary treatment measure to remove larger sediment from stormwater runoff. The results showed that the first 15 m of the swale length is the most effective in treating the bulk of the TSS. This suggests that the installation of unnecessarily long swales to treat TSS pollutants may not be the optimal solution. The results suggest that swales could be used in a stormwater treatment train as a pre-treatment to prevent clogging in downstream treatment systems.
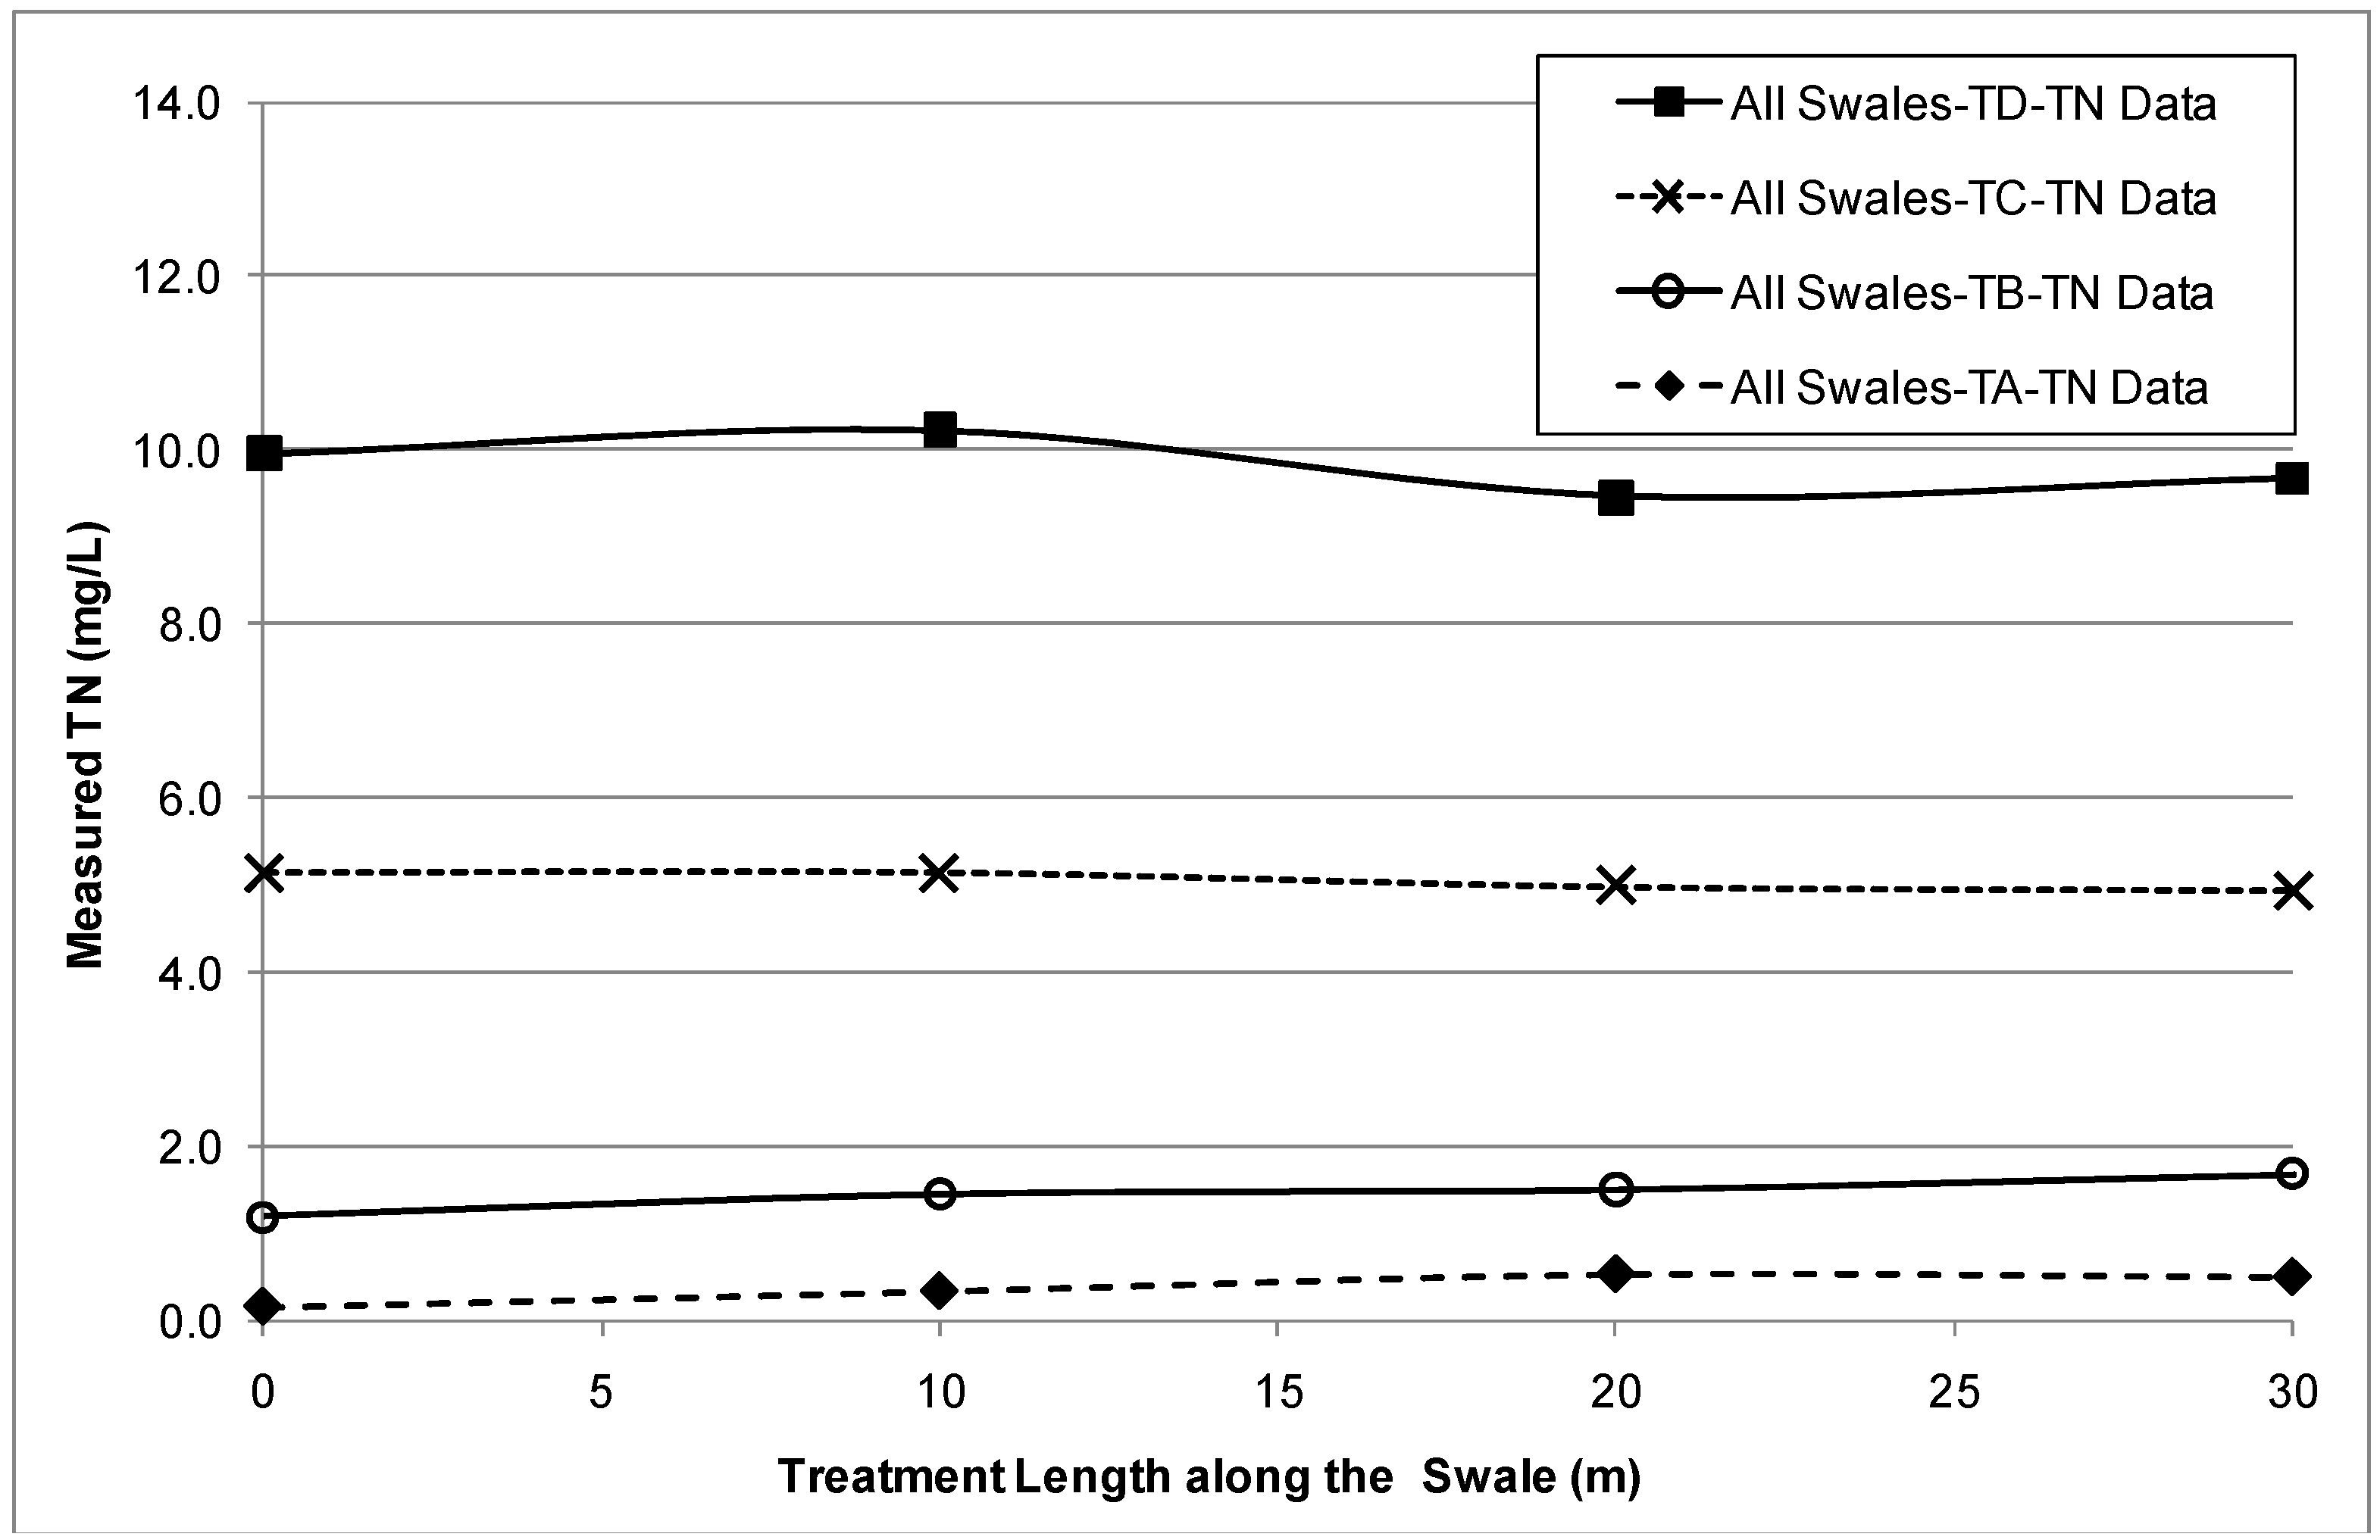
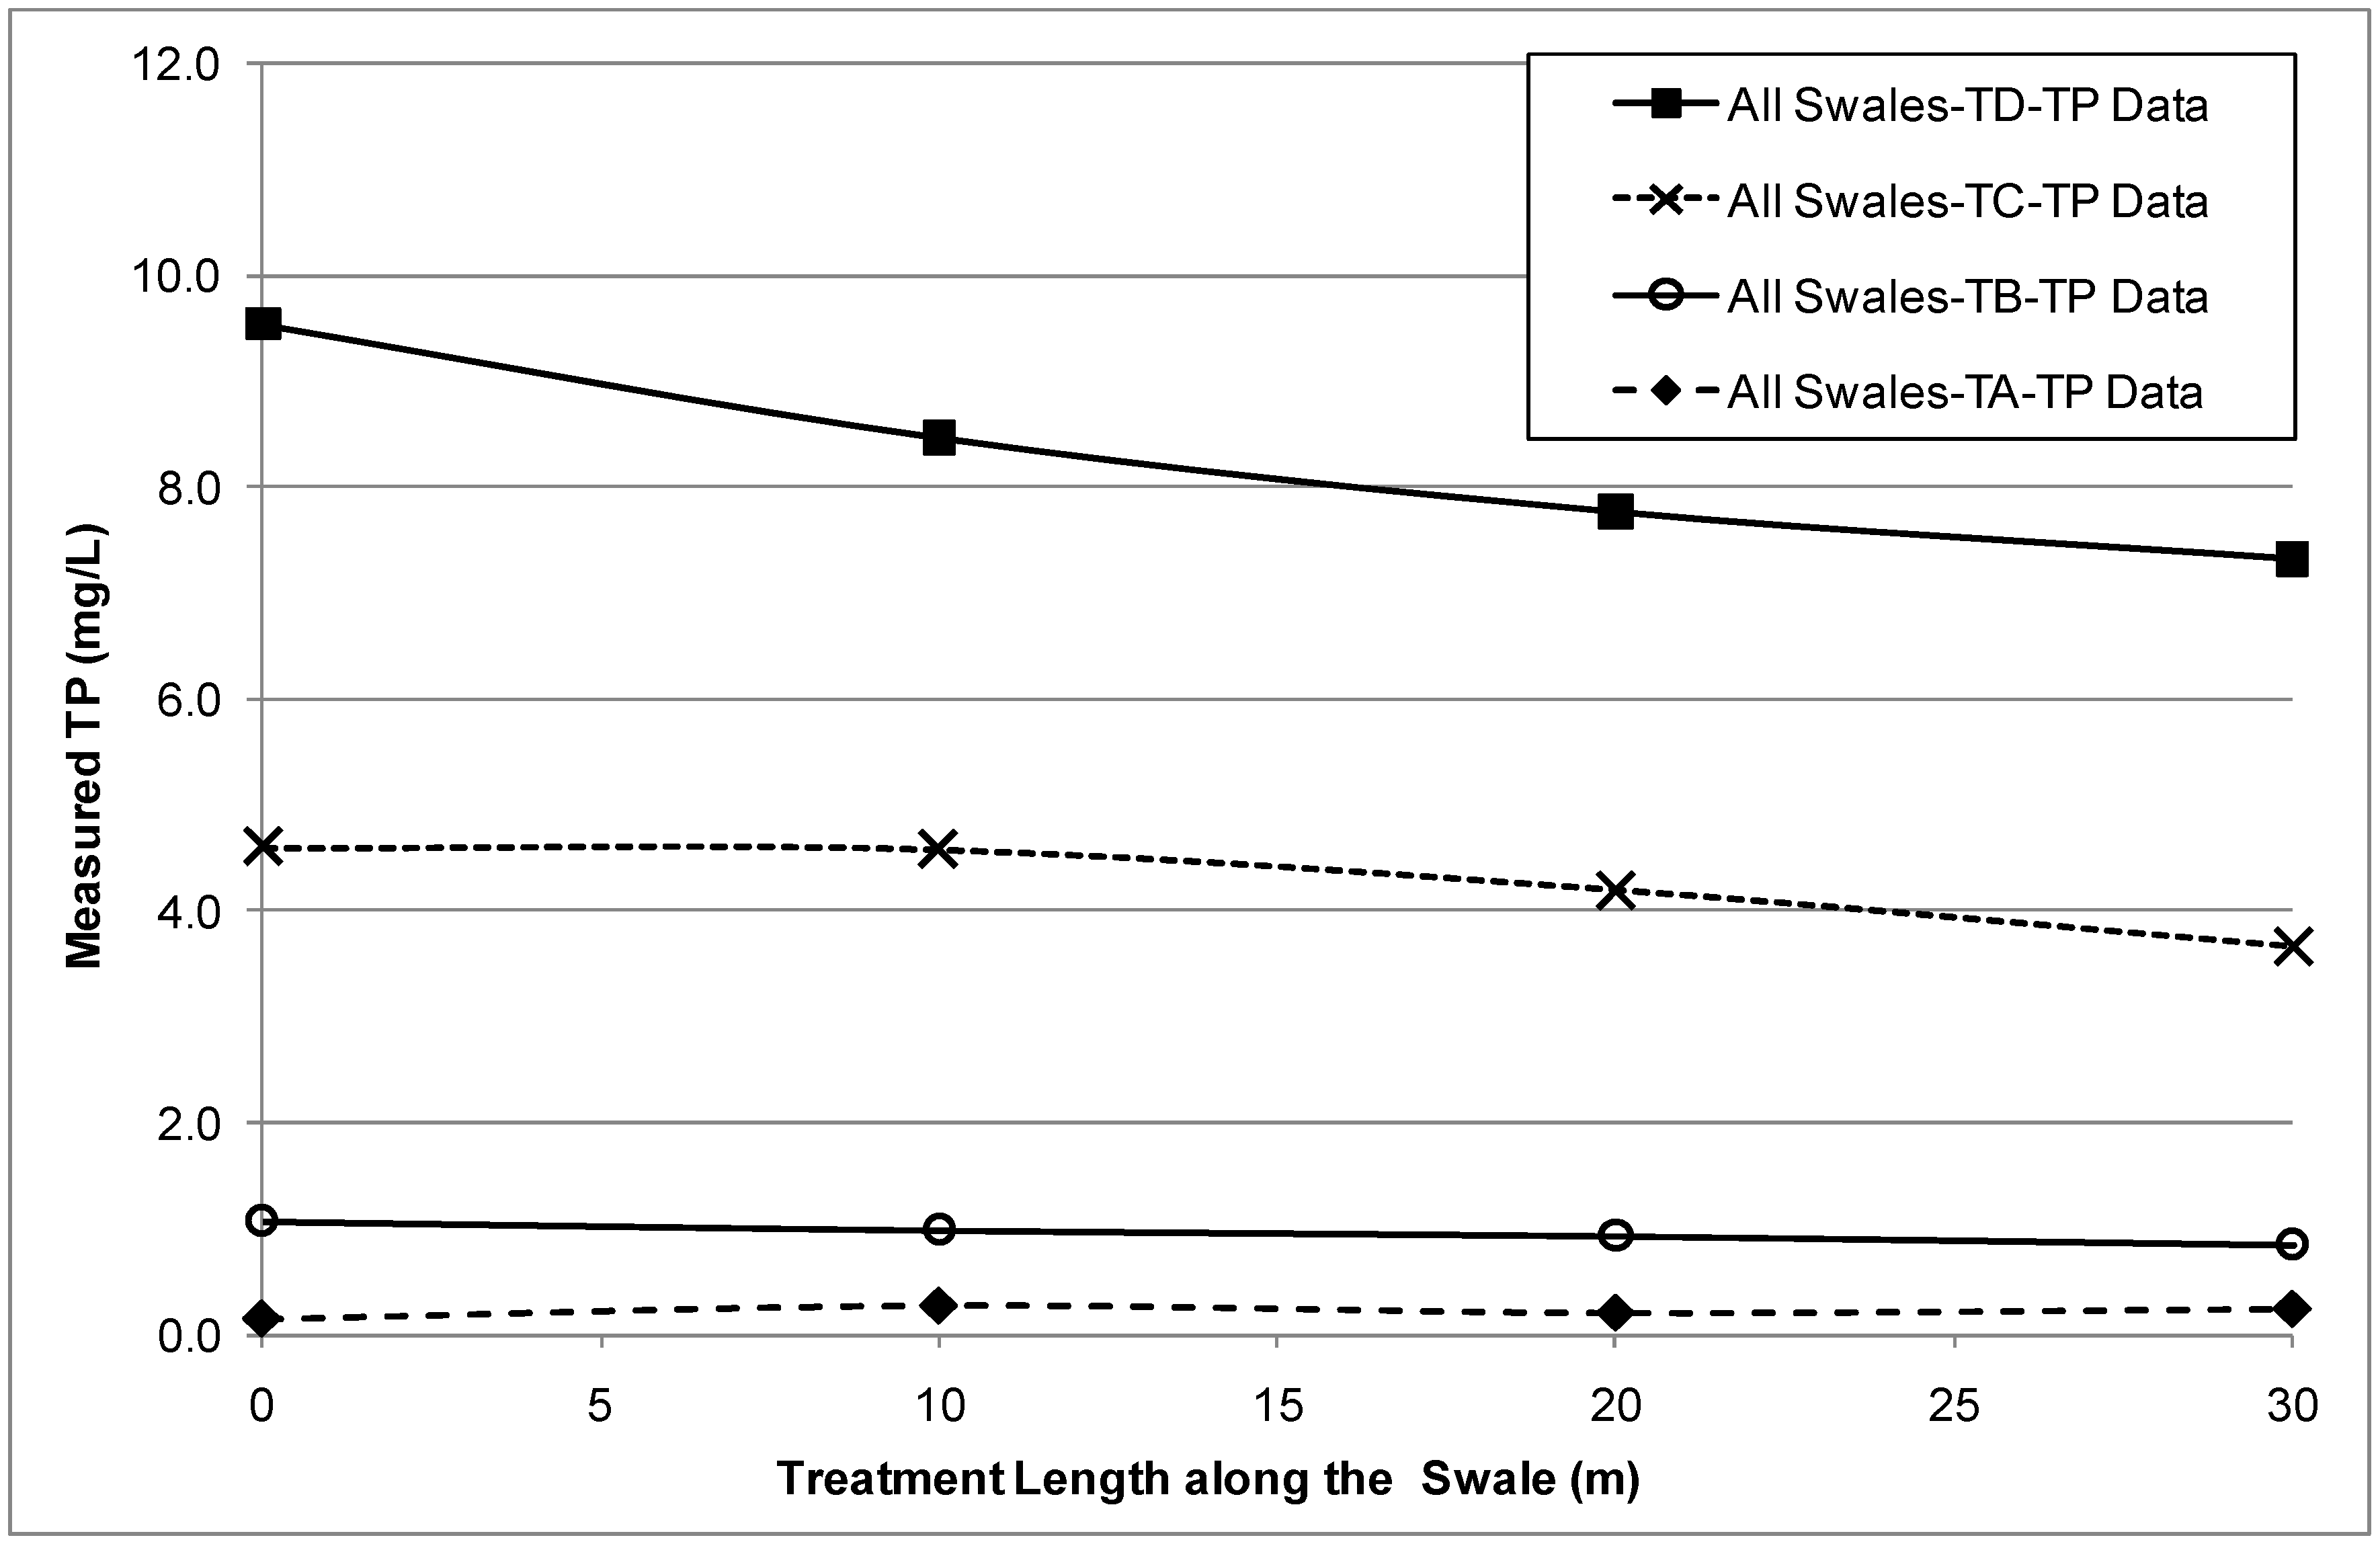
The study found no reduction in TN levels in any of the four tests that could be attributed to treatment by the swales. This was in contrast to previous study results. However, the study demonstrated a reduction in measured TP levels of between 20% and 23% between the inlet and the outlet for the TB, TC and TD tests. This reduction is within the range of TP removal reported in previous studies. Differences in nutrient removal performance by swales from this study and other studies may be attributed to the differences in testing conditions and pollutant constituents.
The overall study findings suggest that swales can be used effectively to reduce stormwater runoff pollution, particularly runoff with high concentrations of TSS and TP. Selection of swales as a primary stormwater treatment measure could significantly affect the design requirements of downstream treatment systems. The results from this study will assist designers to estimate the appropriate length of swale required to achieve specific TSS and TP pollution reductions in urban stormwater runoff.


