Rainfall Enhances Vegetation Growth but Does the Reverse Hold?


Centre for Industrial and Applied Mathematics, University of South Australia, Mawson Lakes Boulevard, Mawson Lakes, SA 5095, Australia
Water 2014, 6(7), 2127-2143; https://doi.org/10.3390/w6072127
Submission received: 7 March 2014
/
Revised: 9 July 2014
/
Accepted: 14 July 2014
/
Published: 23 July 2014
(This article belongs to the Special Issue Water Resources in a Variable and Changing Climate)
Abstract
:In the literature, there is substantial evidence presented of enhancement of vegetation growth and regrowth with rainfall. There is also much research presented on the decline in rainfall with land clearance. This article deals with the well documented decline in rainfall in southwest Western Australia and discusses the literature that has been presented as to the rationale for the decline. The original view was that it was the result of climate change. More recent research points to the compounding effect of land use change. In particular, one study estimated, through simulation work with atmospheric models, that up to 50% of the decline could be attributed to land use change. For South Australia, there is an examination the pattern of rainfall decline in one particular region, using Cummins on the Eyre Peninsula as an example location. There is a statistically significant decrease in annual rainfall over time in that location. This is mirrored for the vast majority of locations studied in South Australia, most probably having the dual drivers of climate and land use change. Conversely, it is found that for two locations, Murray Bridge and Callington, southeast of Adelaide, there is marginal evidence for an increase in annual rainfall over the last two decades, during which, incidentally, Australia experienced the most severe drought in recorded history. The one feature common to these two locations is the proximity to the Monarto plateau, which lies between them. It was the site of extensive revegetation in the 1970s. It is conjectured that there could be a connection between the increase in rainfall and the revegetation, and there is evidence presented from a number of studies for such a connection, though not specifically relating to this location.
1. Introduction
There have been numerous studies detailing the deleterious effects of vegetation clearance on rainfall totals. Junkermann et al. [1] report on trends in rainfall in Western Australia. They state that the western tip of the continent has experienced a reduction of precipitation by about 30% (from an average of 325 mm/a) since the 1970s, attributed to a change in the large scale surface pressure patterns of the southern ocean ([2,3]) with a concurrent reduction in surface water fluxes [4].
This article discusses this reduction and focusses also on two areas in South Australia, starting first with details of an investigation of rainfall trends in Cummins, on Eyre Peninsula, 34.26°S, 135.73°E. Despite some perceptions of increased rainfall in the region, a significant decrease in rainfall is found if you compared before and after 1975, roughly mirroring the Western Australian experience, even if not as extreme. Noteworthy is the fact that the land clearance in this area took place principally from the 1950s [5], substantially later than in some other parts of South Australia.
The perception is that extensive plantings on the Monarto plateau in the 1970s has led to increased rainfall on the plateau and close by. Unfortunately, the only official weather station on the plateau is at the Monarto Zoo, and has only been in operation in recent times and even then only sporadically. However there are official stations at Murray Bridge (35.12° S, 139.27° E) and Callington (35.12° S, 139.04° E) adjacent. Gallant et al. [6] studied rainfall trends from 1910–2005 in six regions of Australia. In their Southeast region, which includes this study area, their conclusion was that there has been a significant decrease in annual total rainfall of 20 mm per decade since 1950 (that) stems mainly from decreases during autumn. It is in this context that results from rainfall trend analysis are presented for these stations and two further from the Monarto plateau. It would appear that these two locations at the edge of the plateau are going against the trend, with increasing rainfall if one compares the period pre 1989 with that after, though not at a significant level. The year 1989 was chosen as this is one decade after the end of the Monarto plantings. On the other hand, the trends at Mt Barker and Tailem Bend are consistent with the findings of Gallant et al. [6] of diminishing rainfall in this area of the country, though not at as great a rate as they report.
Thus, there appears to be some evidence in Australia of the influence of introducing vegetation on rainfall as well as the more easily supported evidence of lowering of rainfall with land clearance. One must be guarded in this conclusion as there are always confounding factors, for instance changing weather patterns with climate change being one. But it does influence us to conduct more research into the topic.
2. Rainfall Trends in Southwest Western Australia
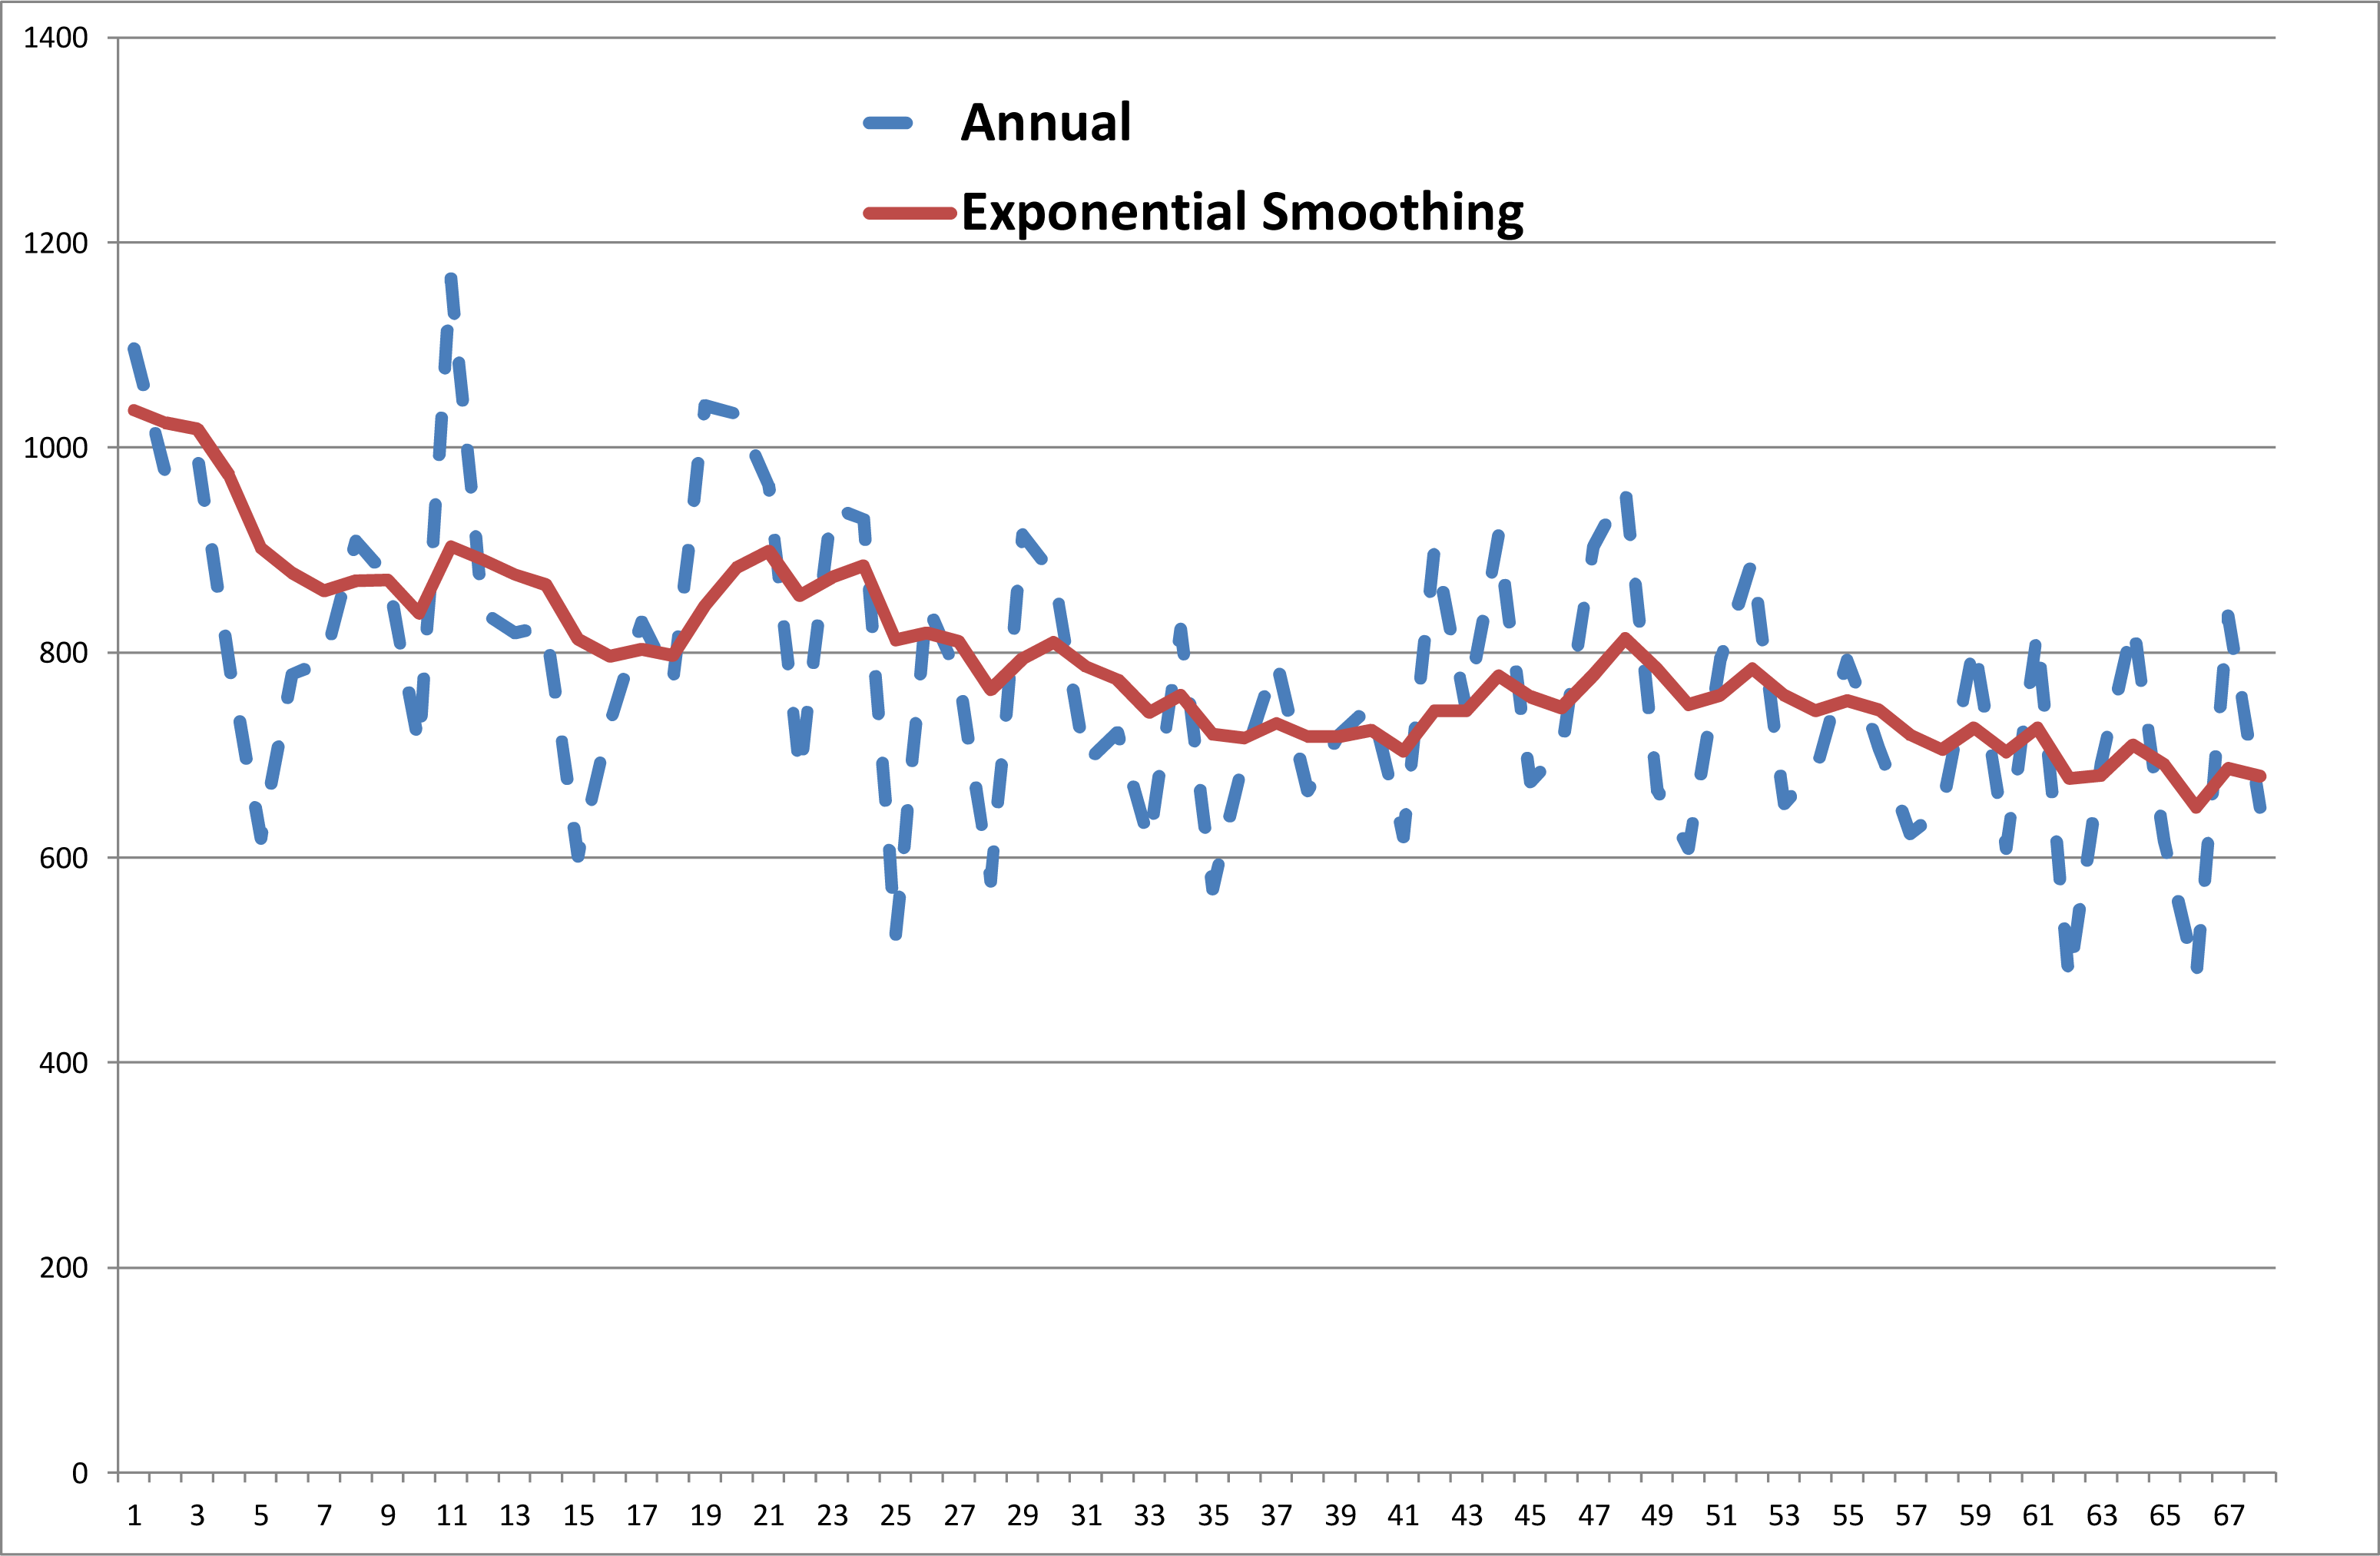
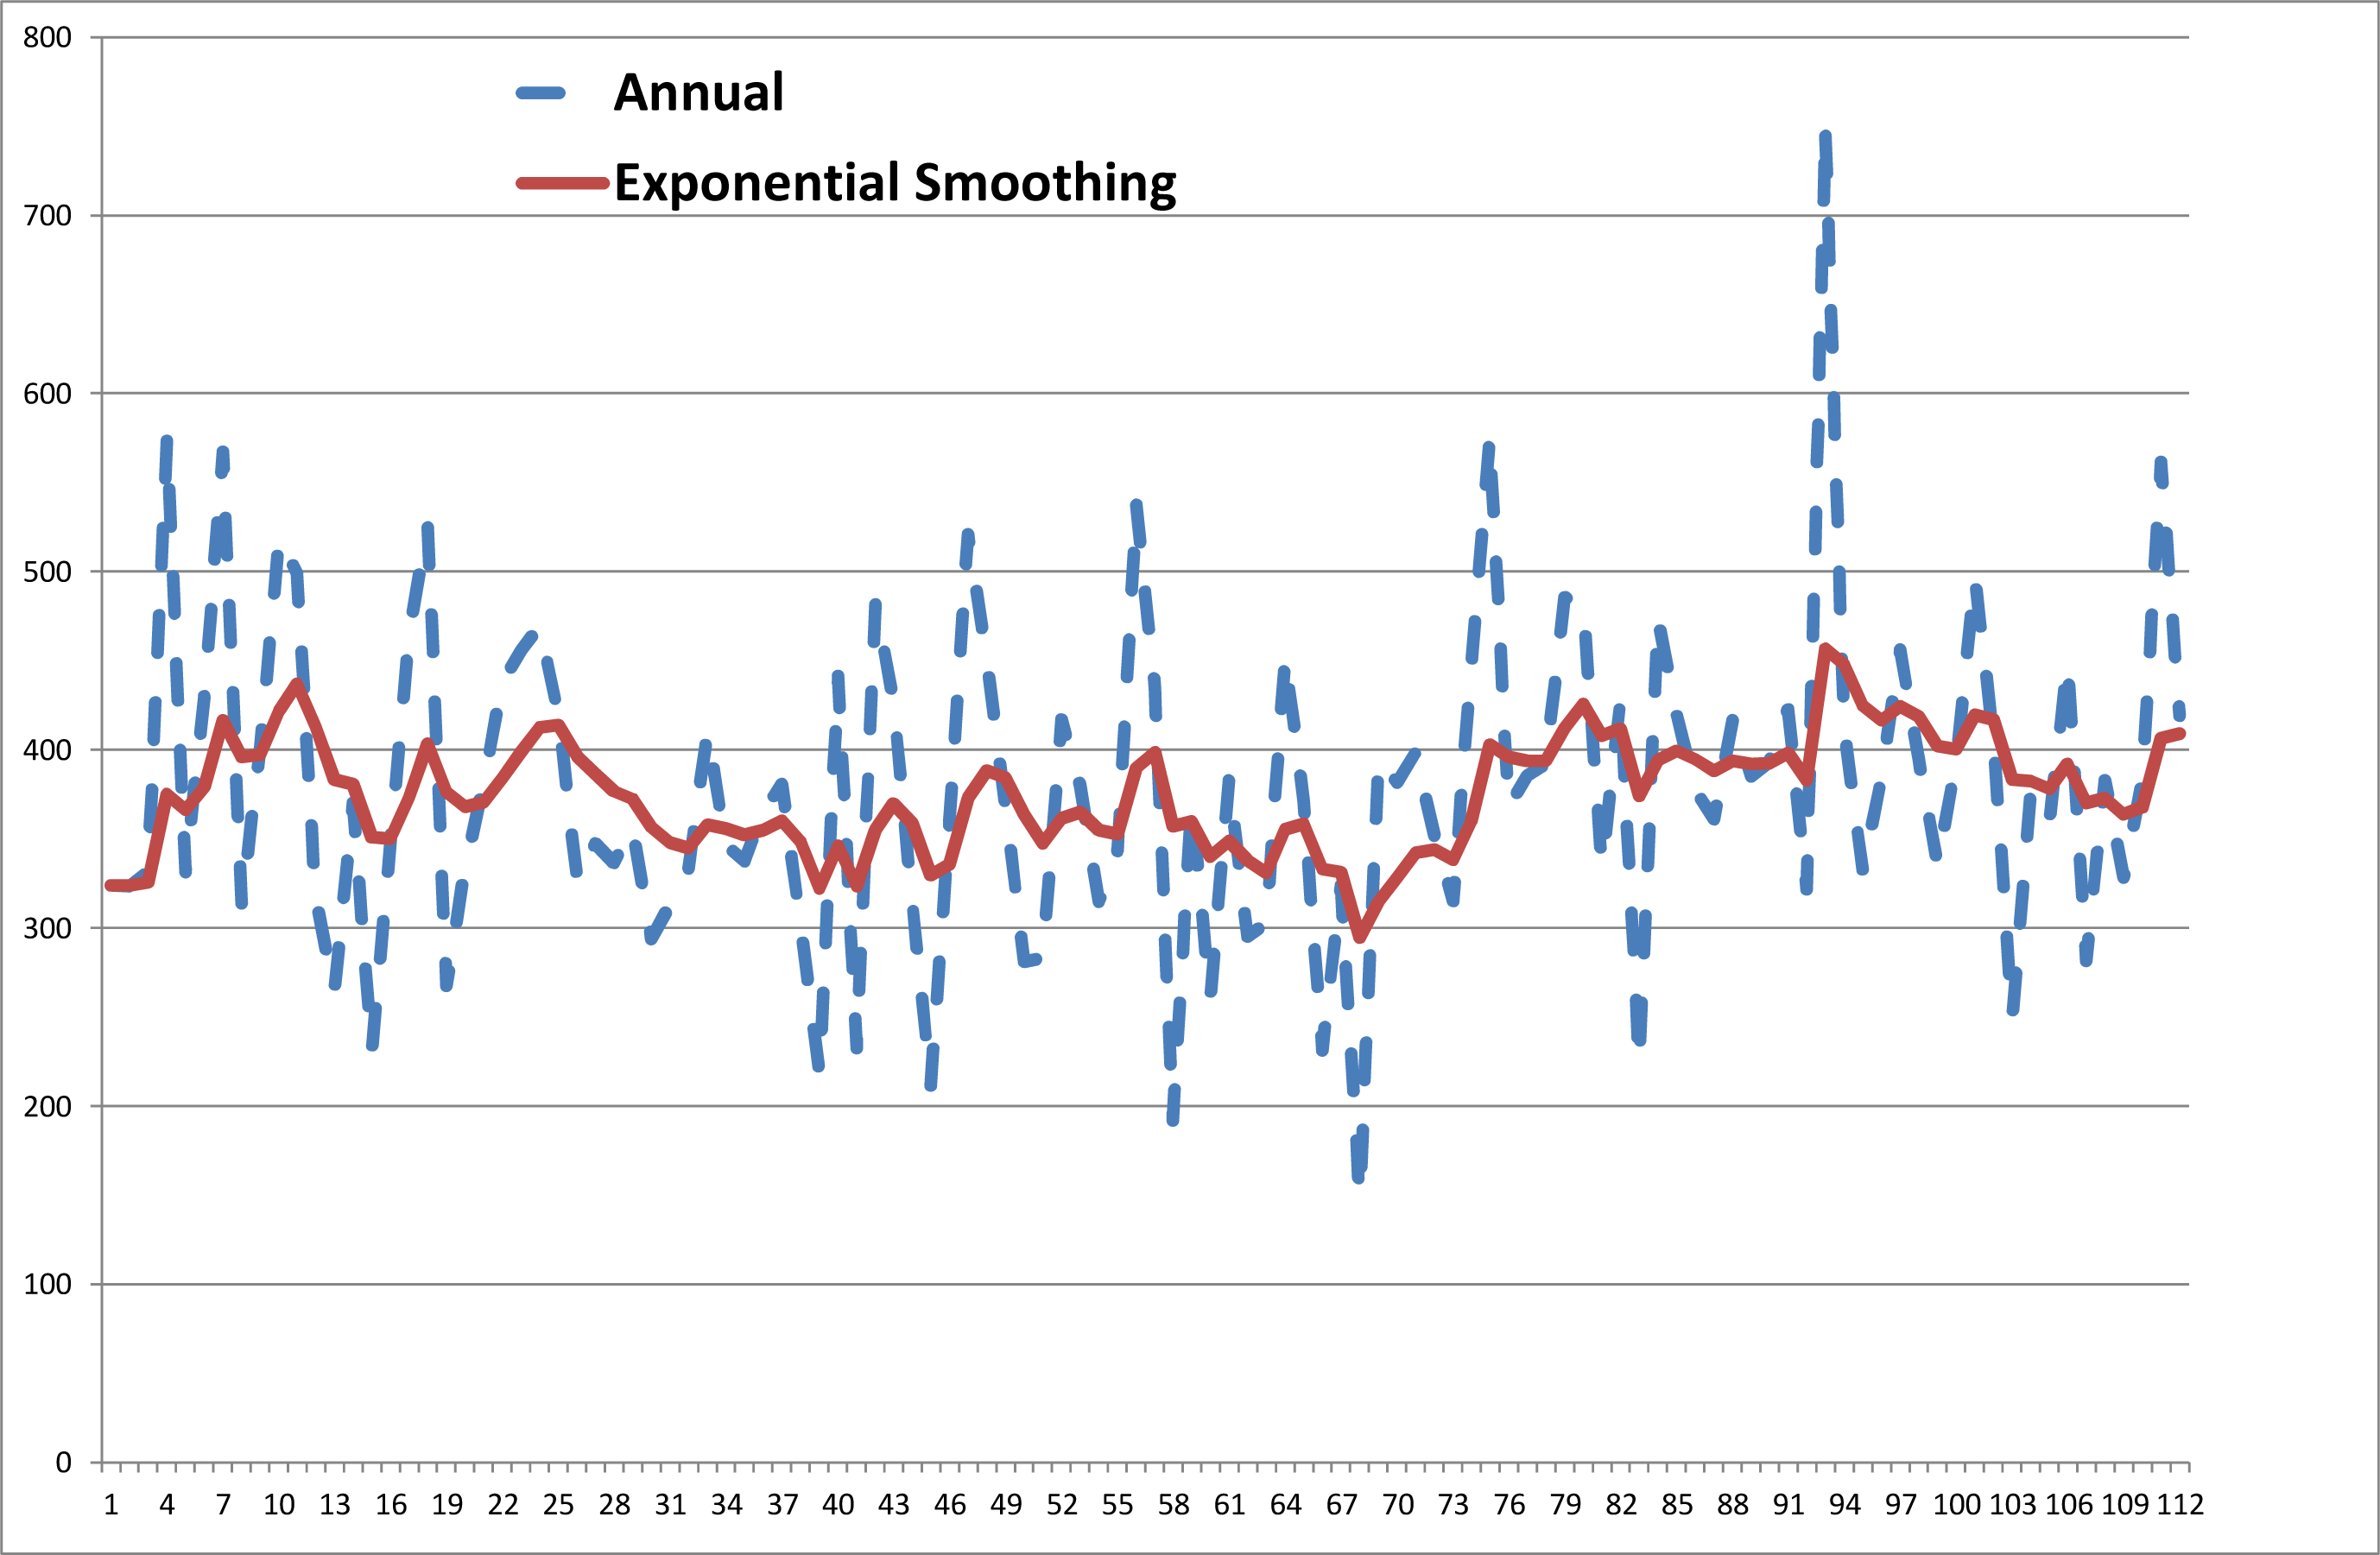
To illustrate the change in rainfall over time in Western Australia, see Figure 1. The mean annual rainfall for Perth Airport up to 1975 was 836 mm. and from 1975 on was 721 mm. A two sample t-test was run to see if the mean before 1975 was significantly higher than after. To perform such a test, the null hypothesis, H0, is the one that is tested, since it is an exact statement-that the means before and after are equal. The alternative hypothesis, Ha is that the mean before is greater than the mean after 1975. One selects a level of significance, normally α = 0.05. One calculates what is called the p-value. This is essentially the probability of the test data being consistent with the null hypothesis. If the p-value is less than α, then the probability of the test data being consistent with the H0 is low and H0 is rejected. The test was performed and it was found to be significant at a p-value of <0.01. Thus, one rejects the H0, and concludes that the mean rainfall before 1975 was significantly higher than after.
While this large scale phenomenon has been going on, there would seem to have been more local changes as well. It is necessary to give some background on land use changes in the region. Note that early research [7] concluded that the demonstrable rainfall decline was most likely due to a combination of climate change and climate variability. Increasingly, though, the more the phenomenon was investigated, the greater the case for the influence of land use change as well. Pitman et al. [8] found that up to 50% of the reduction in rainfall can be explained through land use change. One pertinent piece of evidence from their atmospheric circulation model simulations is that the reduction of rainfall on the coast and the increase inland (matching different land use patterns as shall be seen below) match the observations.
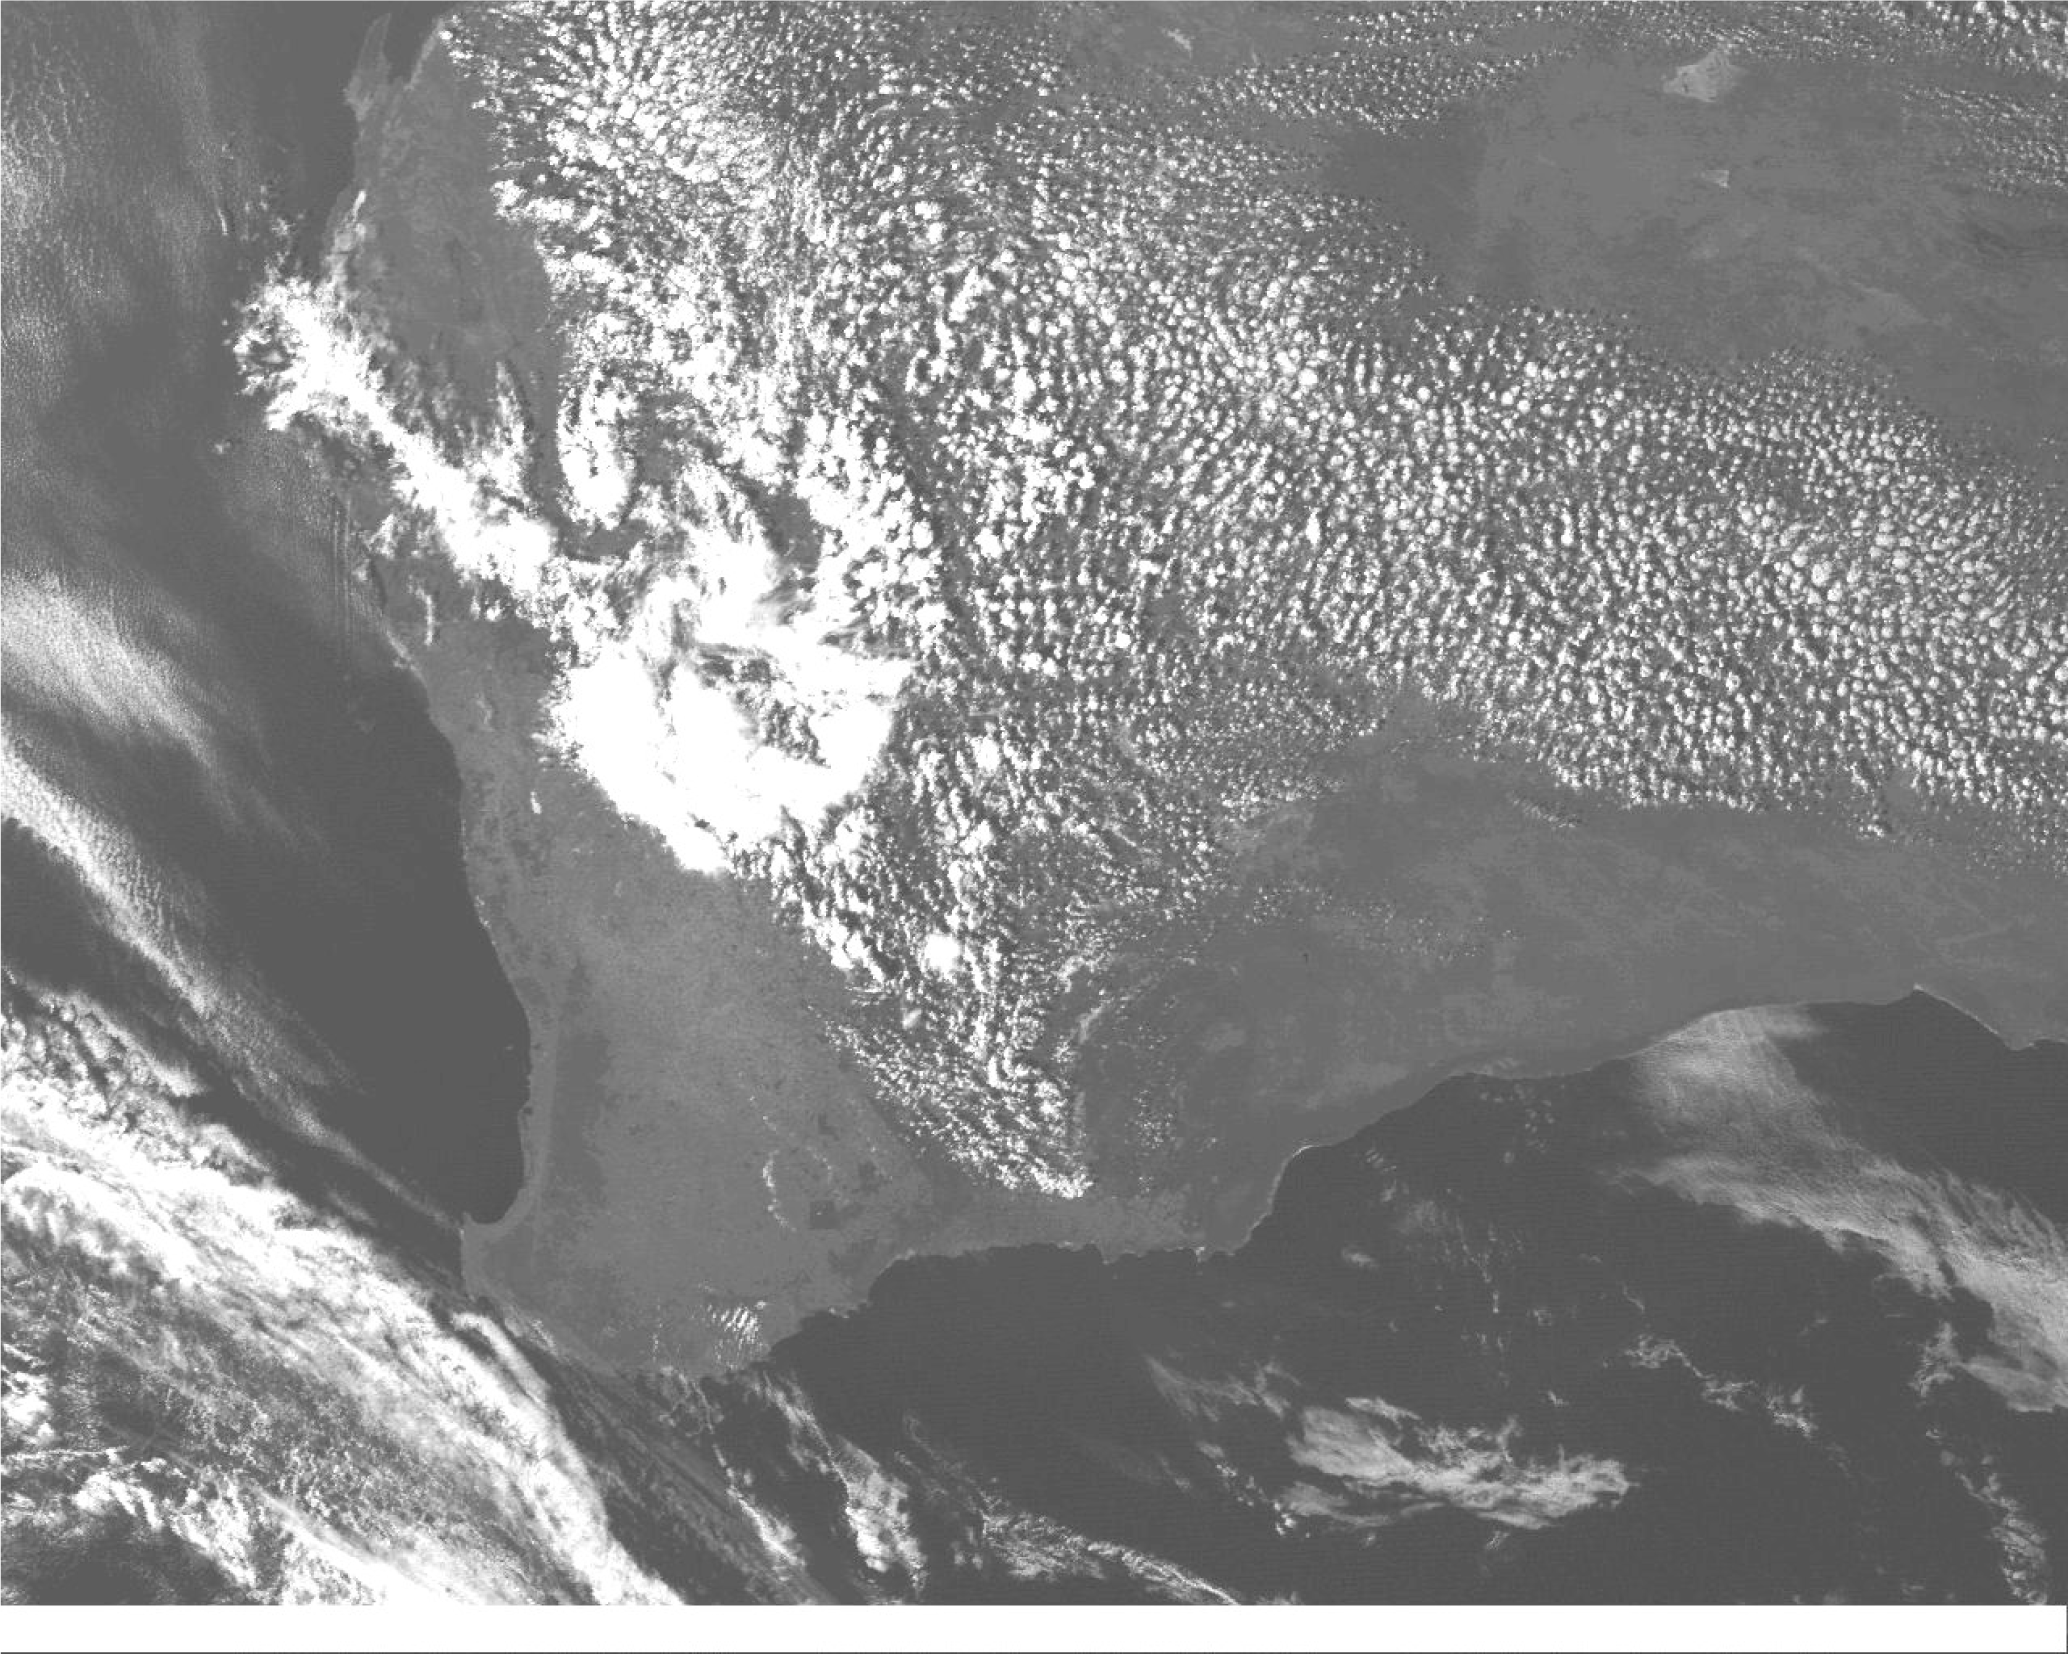
At essentially the state boundary between Western Australia and South Australia, there is the approximately 1500 km Vermin Proof Fence (formerly referred to as the Rabbit Proof Fence) erected in the early part of the 20th century. On the western side the land was predominantly cleared for agriculture, whereas the eastern side is natural vegetation. Sadler [7] found that there has been a shift in precipitation from the agricultural regions to the regions of natural vegetation with an increase of about 20%. Junkermann et al. [1] conducted atmospheric experiments above both the agricultural regions and the area of natural vegetation, attempting to understand the mechanisms behind the differential changes in rainfall. They concluded that extra cloud condensation nuclei (CCN) were generated over the agricultural areas due to salt lake geochemistry. The extra aerosols mean that there is an increase in cloud droplets competing for condensable water, thus depressing precipitation. This phenomenon does not occur over the areas of natural vegetation, resulting in a decoupling of the water cycle on a regional basis. Similarly, Pielke et al. [9] discussed the possible mechanisms for such a phenomenon. They give results from the Bunny Fence Experiments of 2005–2007 where they compare the latent heat fluxes (low and not very variable for the forested areas and for the agricultural areas low after harvest but high during the growing season) and also that the sensible heat flux is higher over the native vegetation during August to December. This, they say, results in vigorous boundary layer development and higher planetary boundary layer over the vegetated area. Figure 2 gives an illustration of the effects of this in a satellite photograph in which there is substantial cloud formation over the native vegetation and none over the agricultural land. The edge of the cloud formation appears to coincide very well with the western edge of the native vegetation. The deforestation is thus linked to a reduction in rainfall. This significant result gives credence to the premise that land use change in the form of clearance reduces rainfall, but can afforestation enhance rainfall?
Chikoore and Jury [10] present an interesting discussion of this topic. They focus on understanding the role of vegetation in the African climate system. They quote studies that show that vegetation growth and distribution are largely determined by climate [11,12]. They also refer to vegetation and land use feedbacks on climate [11,13]. Their specific tasks were twofold. One was to determine if greening caused by one rainfall event produced evapotranspiration that affects the next wet spell. The second was to understand if vegetation could help, in their terms, “anchor” cloud bands regardless of external forcing by large scale circulation and heating anomalies. They found positive answers using means such as principal component analysis to support their conjectures in both cases. Sprack et al. [14] observed that there is an enhancement of rainfall in tropical regions when the rain bearing clouds passed over forested areas.
Other recent research supports the conjecture that there is a connection between vegetation and maintenance or even enhancement of precipitation. Makarieva et al. [15] provides interesting evidence to support this theory. They state that the dependence of annual precipitation on distance from the ocean differs markedly between the world’s forested and non-forested continent-scale regions. In the non-forested regions, precipitation declines exponentially with distance from the ocean. In contrast, in the forest-covered regions precipitation does not decrease or even grows along several thousand kilometers inland.
The implication is that there may even be an increase in rainfall in forested areas as one progresses inland. Beltran-Przekurat et al. [16] performed some interesting simulations based on South America with their scenarios of land use, agriculture, grasslands and afforested areas. They were performed for three separate sets of El Nino - Southern Oscillation conditions. The general result vis-a-vis rainfall was that while there was insignificant difference between the grassland and agricultural settings, there was an increase in rainfall with afforestation.
Thus, both observational evidence and also simulations using atmospheric models lends support to the concept that there can be enhancement of rainfall because of afforestation. Our task is to examine the interplay between vegetation and rainfall in South Australia, evidence will be given to support the depletion of rainfall through land use change, and also that increased vegetation can enhance rainfall, if placed advantageously.
3. Rainfall Trends on Eyre Peninsula
In this section, details are given of an investigation of rainfall trends in a particular region of South Australia, Cummins, on Eyre Peninsula, 34.26° S, 135.73° E. A subsequent section will deal with trends in and around the Monarto region, 35.08° S, 139.13° E, of South Australia. Note that in all the analysis in this paper, annual rainfall totals are used. Seasonal analysis was also performed and the results by season did not show any significant difference from the annual analysis. Also, in this study, no account was taken of any extraneous variables such as temperature trends or ENSO for example and their possible connection with rainfall. This will be examined in future work.
There is a history of land clearance on Eyre Peninsula, primarily for agricultural activities. In the Cummins-Wanilla Basin Catchment Management Plan [5], the authors point out that native vegetation covers only 6% or 50 km2 of the Basin with the majority of the land utilised for various agricultural purposes. The Cummins-Wanilla Basin, as is the Eyre Peninsula as a whole, is of high botanical significance. There occur a number of species and associations of species of high conservation significance. South of Cummins was once dominated by Low Open Forest, including Eucalyptus cladocalyx (sugar gum) with an understorey of Xanthorrhoea sp. (yacca), and various Acacia sp. (wattle). Closer to Cummins the community was predominantly Open Scrub with various Mallee type Eucalyptus sp. as well as Melaleuca lanceolata (dryland tea tree) [5].
As part of an Australian Research Council Discovery Indigenous Researcher Development grant, one of the prime areas of activity has been to identify specific locations where revegetation projects may be able to enhance rainfall, particularly where there is evidence of rainfall decline. Interestingly, two members of the project team interviewed some people in the Cummins region as to their views on the project and what they would think about attempting to increase the rainfall in the region. The reaction of two of the people interviewed are described below:
One chap said, “We have lots of water lying on the ground so we don’t need any more rain.” Another woman said, “We don’t need any more rain, we have enough now”
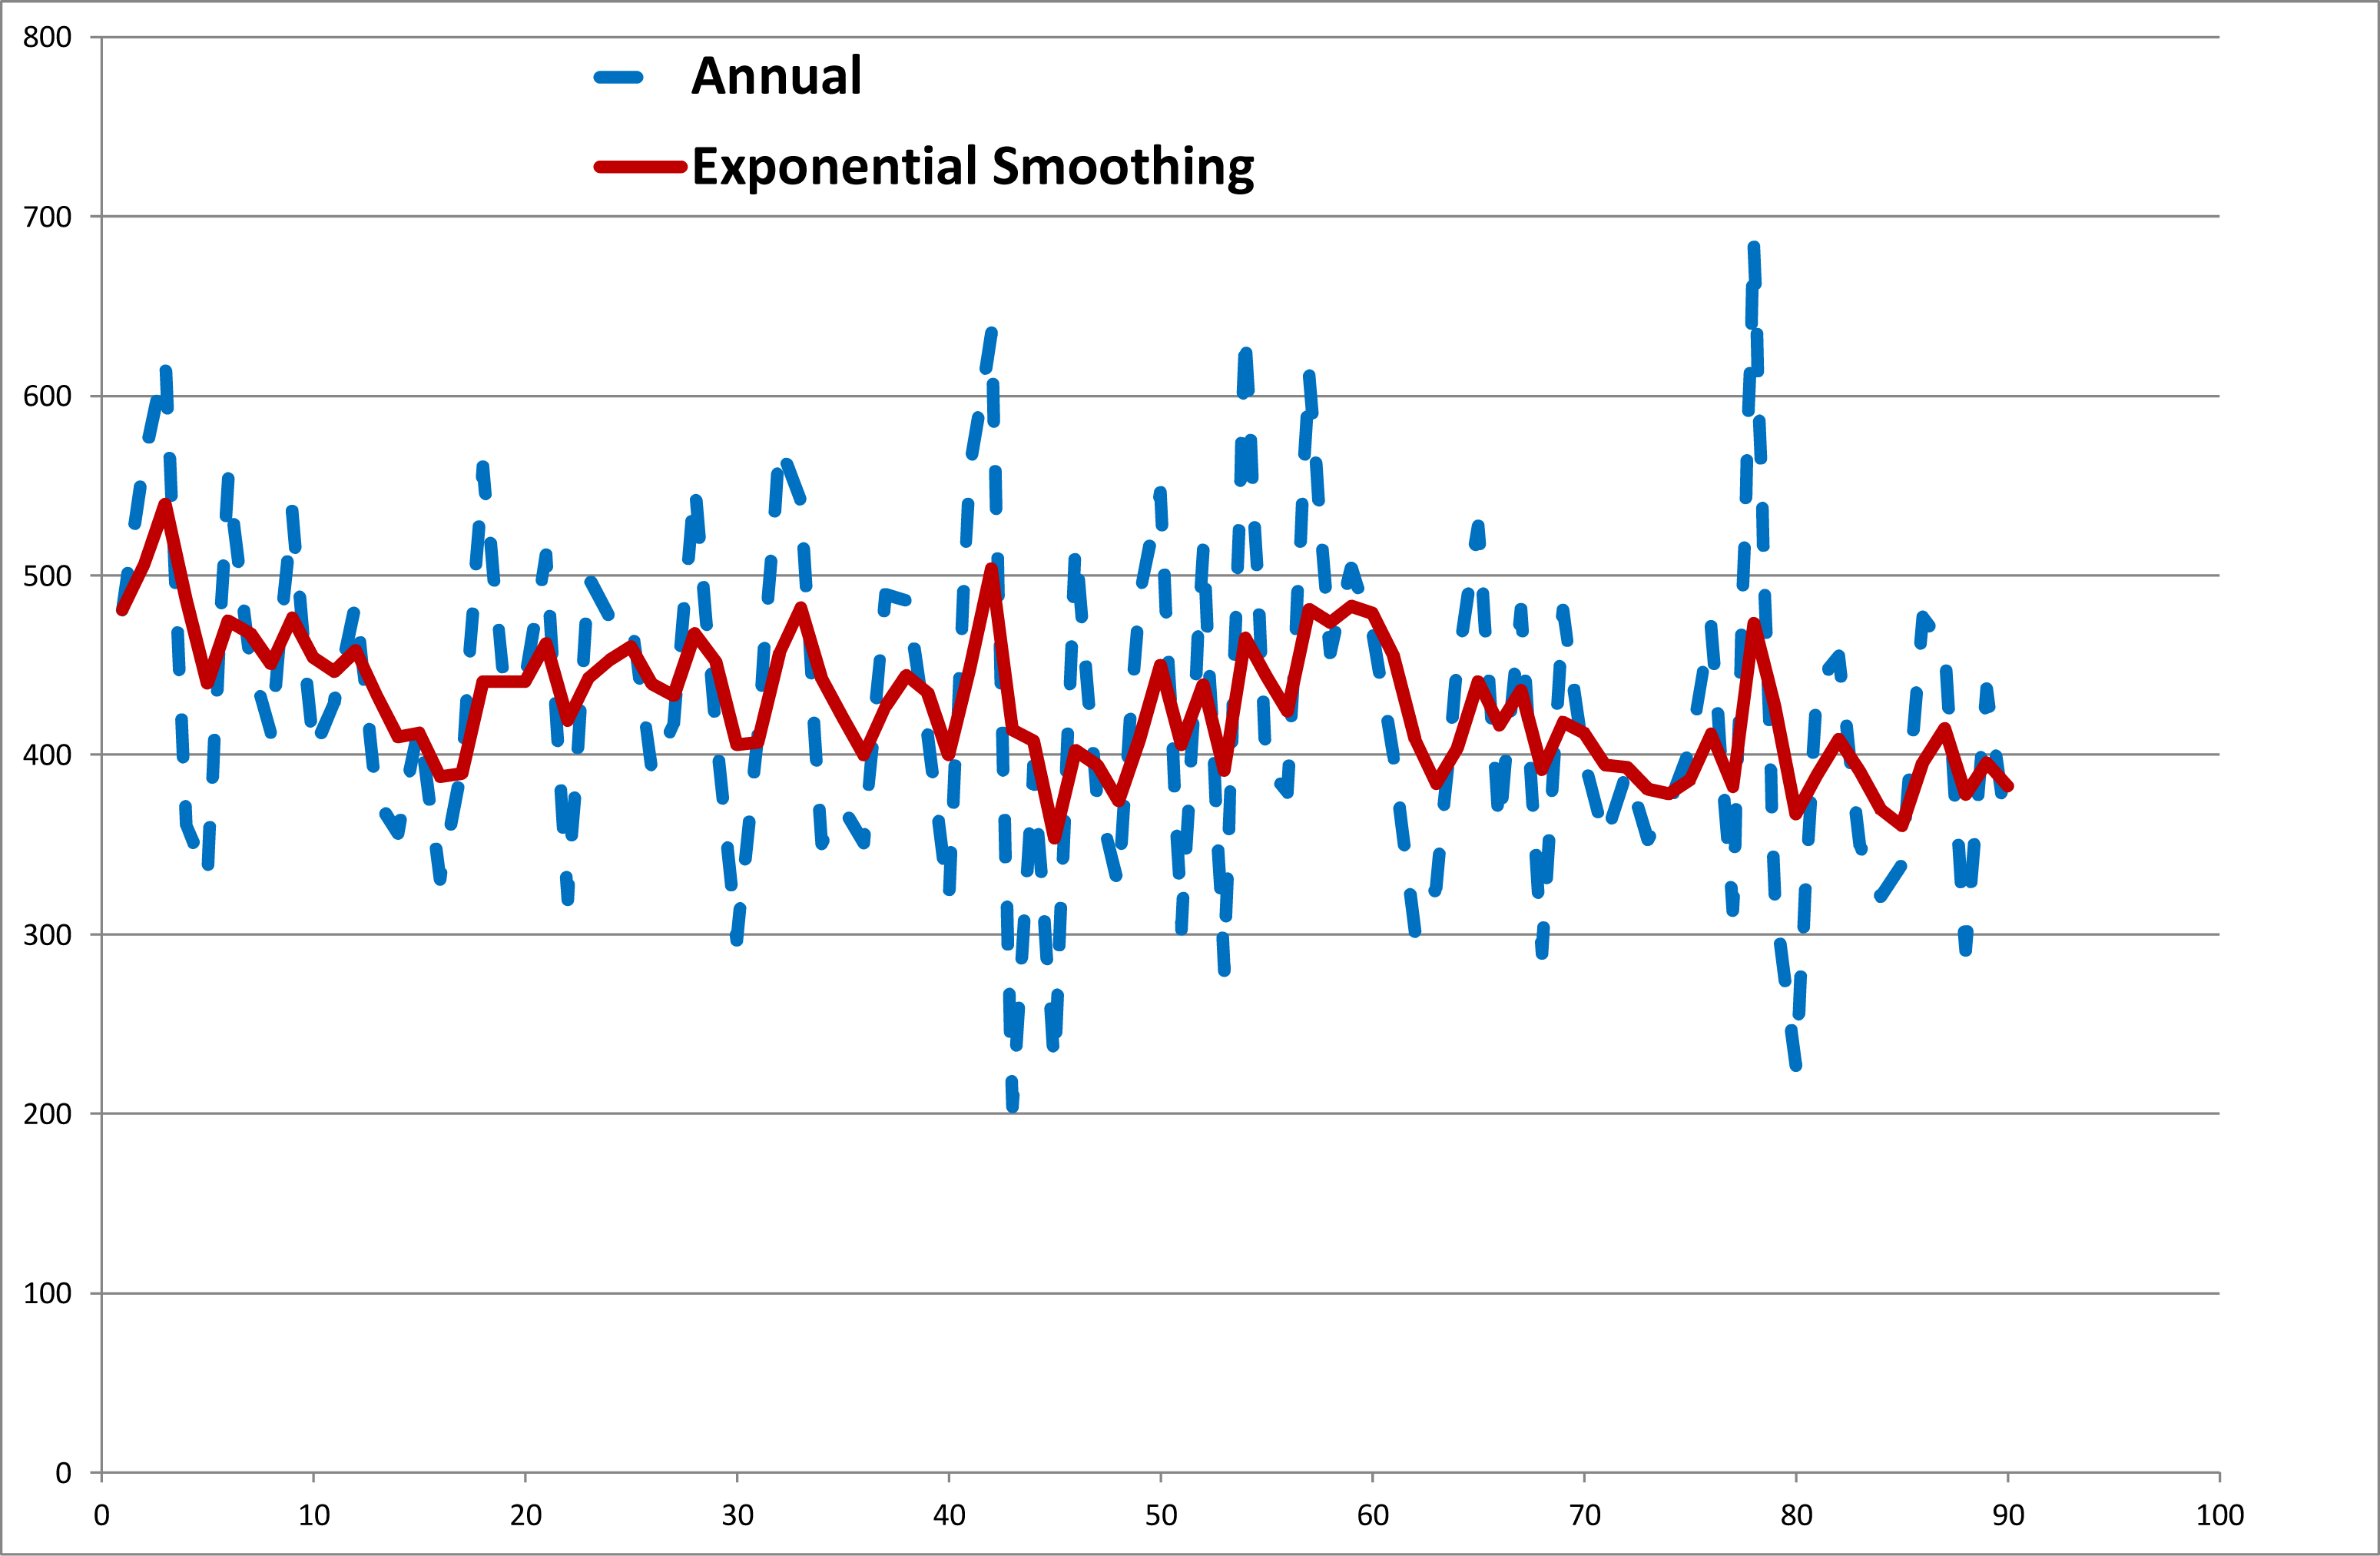
The question arises then as to whether, as these statements seem to imply, the rainfall has actually increased in the Cummins region over time. To begin the analysis, Figure 3 shows the annual rainfall totals for Cummins from 1915 to 2004. Later years were excluded because of missing months of data. Coincidentally, many of the latter years coincided with a severe drought and they may have only increased the idea of decline. Superimposed on the figure is the exponentially smoothed version of the rainfall totals constructed using
Xt is the original data series and if α = 1 we get the original series. So, higher values of α decrease the level of smoothing. From the figure it appears that there may be a downward trend to the totals. To determine whether there is, comparison of the annual totals before and after 1975 is performed, consistent with the analysis for Western Australia, with the mean rainfall before being 440 mm. and after being 395 mm. This does not seem as dramatic a shift as in Western Australia, but still may be a significant change. A two sample t-test was performed with the following hypotheses:
In this case, H0 was rejected with a p-value of 0.014. Thus, evidence of a statistically significant reduction in rainfall exists. This appears at odds with the views expressed above by the two people interviewed. How can we have such a contradiction-an appearance of too much, or at least sufficient, rain and scientific evidence of depletion in rainfall? One can hypothesize that, as in the Western Australian example given in the Introduction, there is a link between the rainfall decline and land clearance. Even more significantly, conjectures can be formed as to the disjunction between the reality of depletion of rainfall and the perception of waterlogging.
It is easy to imagine that with the clearance of land there will be less interception of the rain that falls, that is more runoff [17]. This runoff can tend to pool in regions where the soil structure is such that there is little soakage, that is where you have clay soils or indeed, silting up over time because of runoff of material as well as the rainfall. What is happening is that the people who believe there is sufficient or even an increase in rainfall may be seeing only the superficial markers, the pooling. They are not seeing the decline in rainfall as it is happening at longer time scales than their levels of perception allow for. If they were truly perceptive, they would notice the decline in rainfall and then ask the truly pertinent question, why is there more pooling with less rain! Common sense perceptions that are couched within cultural understandings don’t necessarily include an analysis of environmental change. Noteworthy is the fact that the land clearance in this area took place principally from the 1950s [5], substantially later than in some other parts of South Australia.
3.1. Evidence of Beneficial Effects of Upland Plantings
When driving around the countryside near Cummins in springtime, the pooling of water on the ground was noticed, but there was also the lack of vegetation on nearby hilltops, invoking the question of is it sensible to draw some conclusions about connections. Recently, George Monbiot wrote an article in The Guardian [17] about the vagaries of agricultural subsidies in England and how they are geared to promote flooding because they promote the clearing of upland vegetation. He referred to an opposite approach taken by a group of farmers in Wales, by the Pontbren River. The Pontbren Project [18] is an innovative approach to using woodland management and tree planting to improve the efficiency of upland livestock farming, led by a group of neighbouring farmers in mid-Wales. They found that not only had they been able to develop markets for some of the wooden products derived from their new plantings, but also they noticed less runoff into lowland areas in regions where they were revegetating. They then invited scientists to investigate. Supported by government funding, this internationally important research has revealed why strategically located belts of trees are so effective at reducing the amount of water running off improved upland grasslands [18]. This research team [19] set up three experimentation sites where surface runoff was measured, supplemented by measurements of soil infiltration rates and soil and vegetation physical properties. On one site they excluded sheep, at another they both excluded sheep and planted native broadleaf tree species, and the third was used as a control. Five years after planting, they found that median soil infiltration rates were 67 times greater in plots planted with trees compared to grazed pasture.
As well as the general results of greatly aiding retention of the rain that falls in the places where it is needed rather than having it run off and cause flooding elsewhere, there is a key point they emphasize. They stress that it is the strategic location of belts of vegetation that is important, not just the random plantings that tend to happen with some revegetation schemes. In [20], there is a comprehensive discussion of the many benefits of integrating bands of native vegetation in agricultural practice. They give specific details on the mechanisms whereby a cleared landscape creates a hotter and drier landscape and how the integrated bands of native vegetation restore water recycling into the landscape, through making it cooler and returning more water to the lower atmosphere through turbulent exchanges with wind and centres of forced convection. Additionally, they describe, referring to [21], how vegetation bands increase the retention of overland flow and leak this water to hillslopes and adjacent streams slowly over time, therefore, helping to buffer streams from large peak runoff rates. One can see from this latter point how the strategic planting of hilltops can be beneficial in minimising flooding and waterlogging. Let’s now pass on to another potentially good result not from strategic placement but from happenstance.
4. Rainfall Trends at Monarto and Surrounding Areas
In the 1970s, the then government of South Australia decided to build a satellite city at Monarto, 70 km to the south east of Adelaide. They were concerned that the burgeoning urban sprawl of the city of Adelaide would be at the expense of highly productive agricultural land. To circumvent this, it was decided that a new development on marginal land at Monarto, linked to Adelaide by high speed rail, would prove a better option. As part of beautifying this site, heavily cleared previously for grazing and cropping, millions of seedlings of Australian native plant species were planted from 1973 to 1979. Many years on, local anecdotal “evidence” infers an increase in rainfall on the plateau on which Monarto lies. This conjecture is tested.
The perception is that the extensive plantings on the Monarto plateau in the 1970s has led to increased rainfall on the plateau and close by. The only official weather station on the plateau is at the Monarto Zoo, and has only been in operation in recent times and even then only sporadically. However there are official stations at Murray Bridge (35.12° S, 139.27° E) and Callington (35.12° S, 139.04° E) adjacent to the plateau. The structure of the analysis in this section will be to examine the annual trend in rainfall before and after the intervention, that is the planting of the vegetation. This is not precisely what will be done, since some time after the plantings is allowed for establishment. Since the last of the organised plantings was in 1979, the analysis uses 1989 as the change year, the year it is assumed that there has been sufficient establishment. A comparison is made of what is happening at these two stations with two others, one further away to the East (Tailem Bend 35.26° S, 139.46° E) and one to the West (Mt. Barker 35.07° S, 138.86° E). These are in areas where there wasn’t the same level of interference during this time. It should be noted that all of the area in which these four stations are located underwent substantial clearing in the century prior to the 1970s.
Gallant et al. [6] studied rainfall trends from 1910–2005 in six regions of Australia. In their Southeast region, which includes this study area, their conclusion was that there has been a significant decrease in annual total rainfall of 20 mm per decade since 1950 (that) stems mainly from decreases during autumn. It is in this context that results are presented from rainfall trend analysis for these four stations.
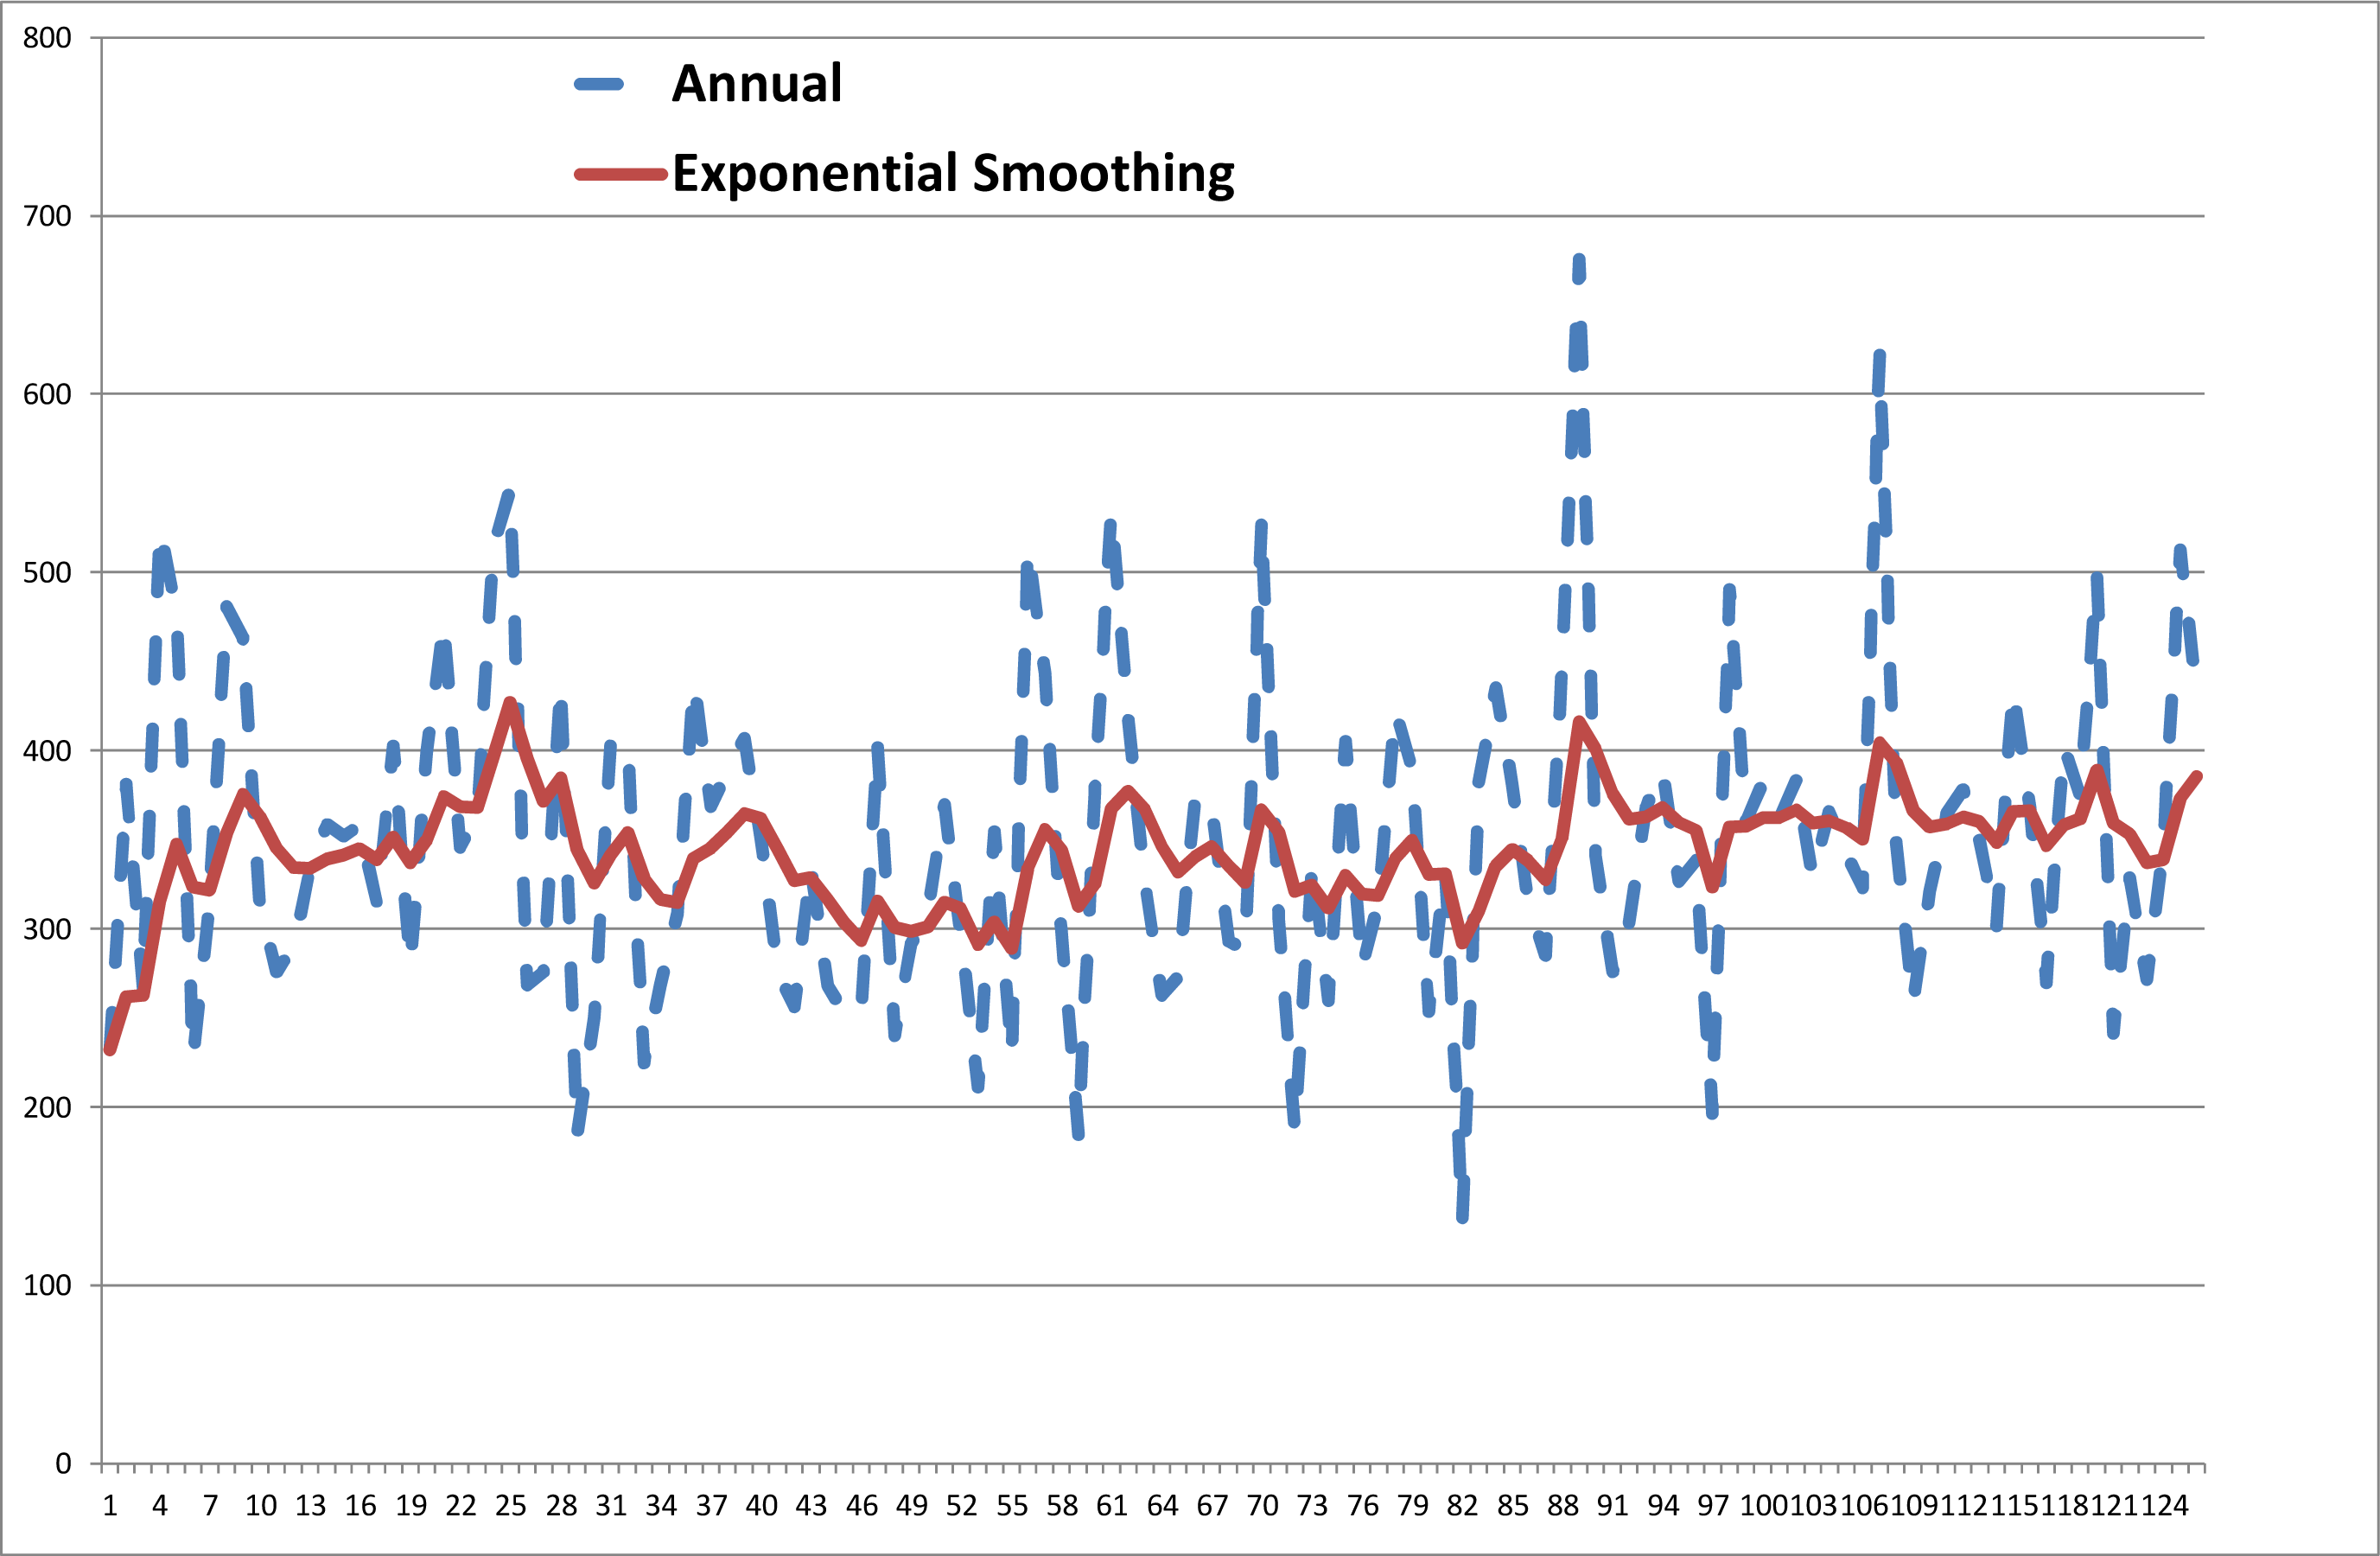
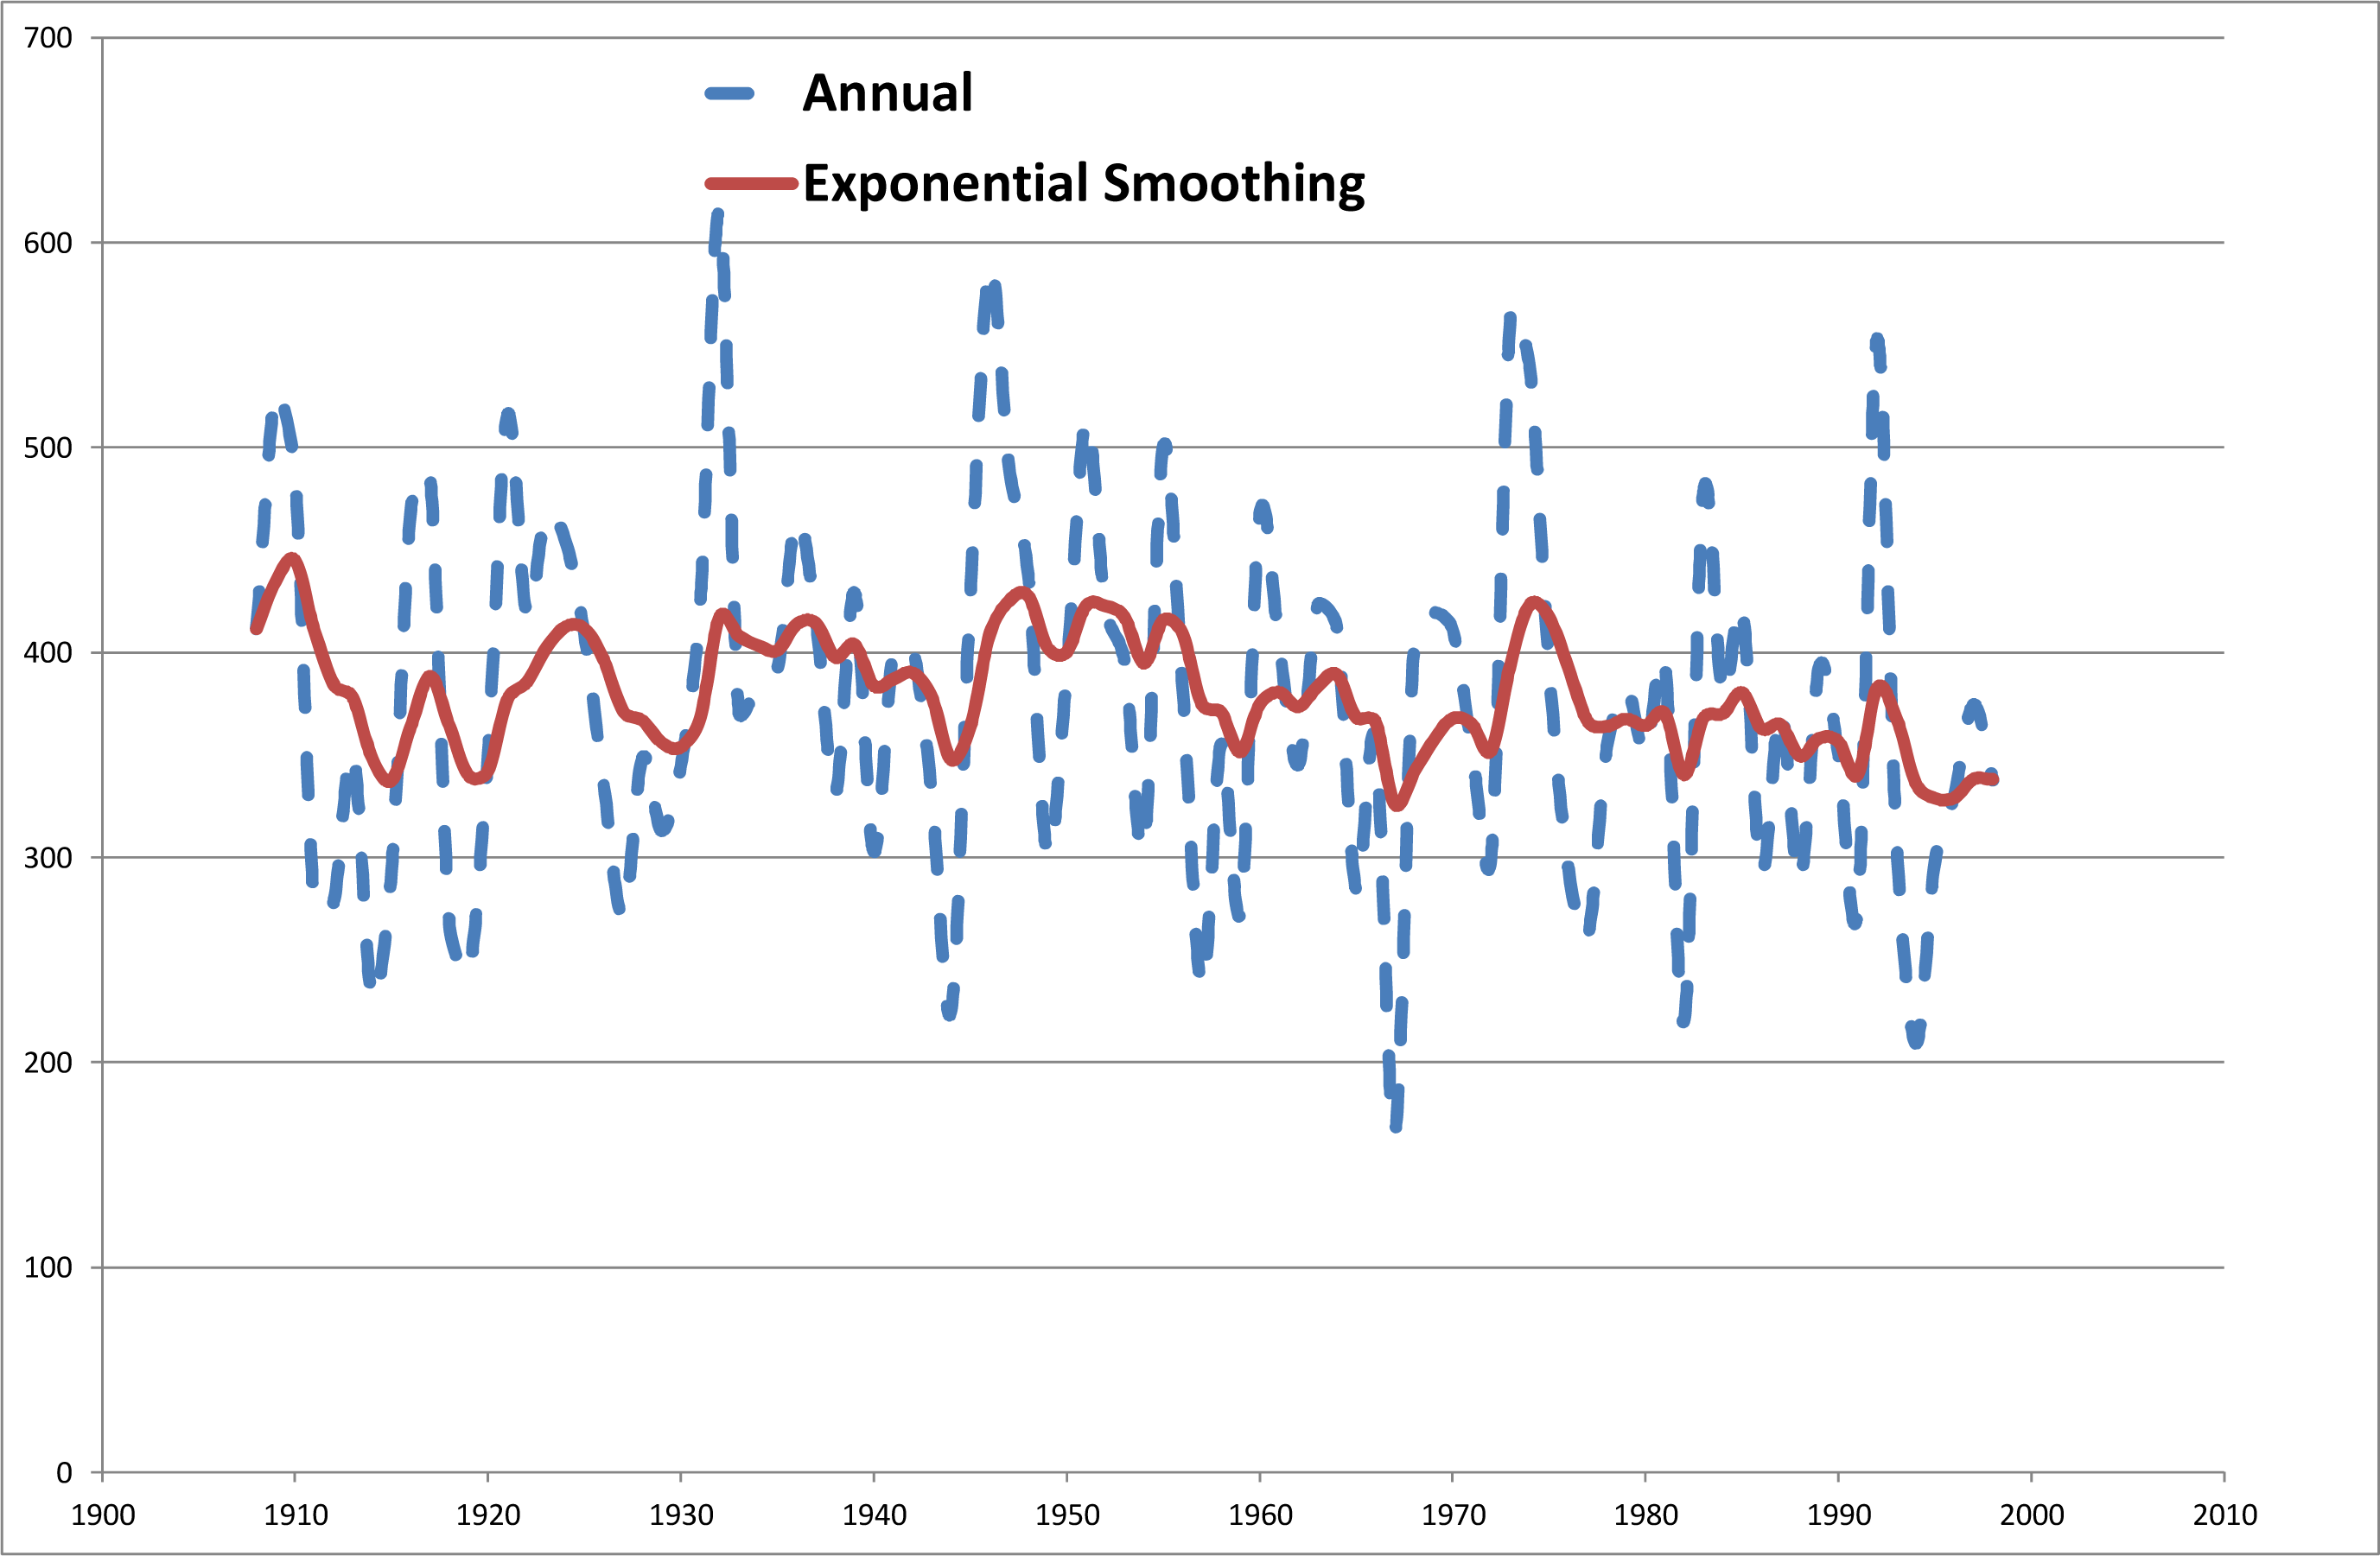
Let’s examine Murray Bridge rainfall over the whole period of record first. This is displayed in Figure 4. From this diagram, it appears that contrary to the conclusions in [6], the rainfall in latter years at Murray Bridge has either maintained the same level or indeed slightly risen. To test this premise divide the data into two sets, pre 1989 and from 1989 onwards. The mean rainfall before 1989 was 341 mm and 373 after. Then test the hypotheses.
For this test, the p-value = 0.073. In essence the null hypothesis of equal rainfall before and after 1989 cannot be rejected, but the p-value is quite close to the level of significance, and so the conclusion can be regarded as tentative. Indeed, if one changed the hypothesis test where one were evaluating the conjecture from [6], that the annual rainfall was 20 mm greater before 1989 versus the rainfall difference was less than that, the p-value for that test is 0.01. In any case, one can conclude that the rainfall is either similar before and after 1989 or greater after, rather than the expectation of diminishing rainfall.
Let’s now turn to the other station in close proximity to the Monarto plateau, that of Callington. A similar set of tests shows not disparate results, with there being little statistical likelihood that the rainfall could have decreased after 1989 and a not significant but indicative chance of an increase, at least when compared to the previous few decades. See Figure 5 for an illustration of this. One might surmise that after land clearance the rainfall decreased and that it is now being restored to historical levels. The mean rainfall before 1989 was 369 mm and 400 after.
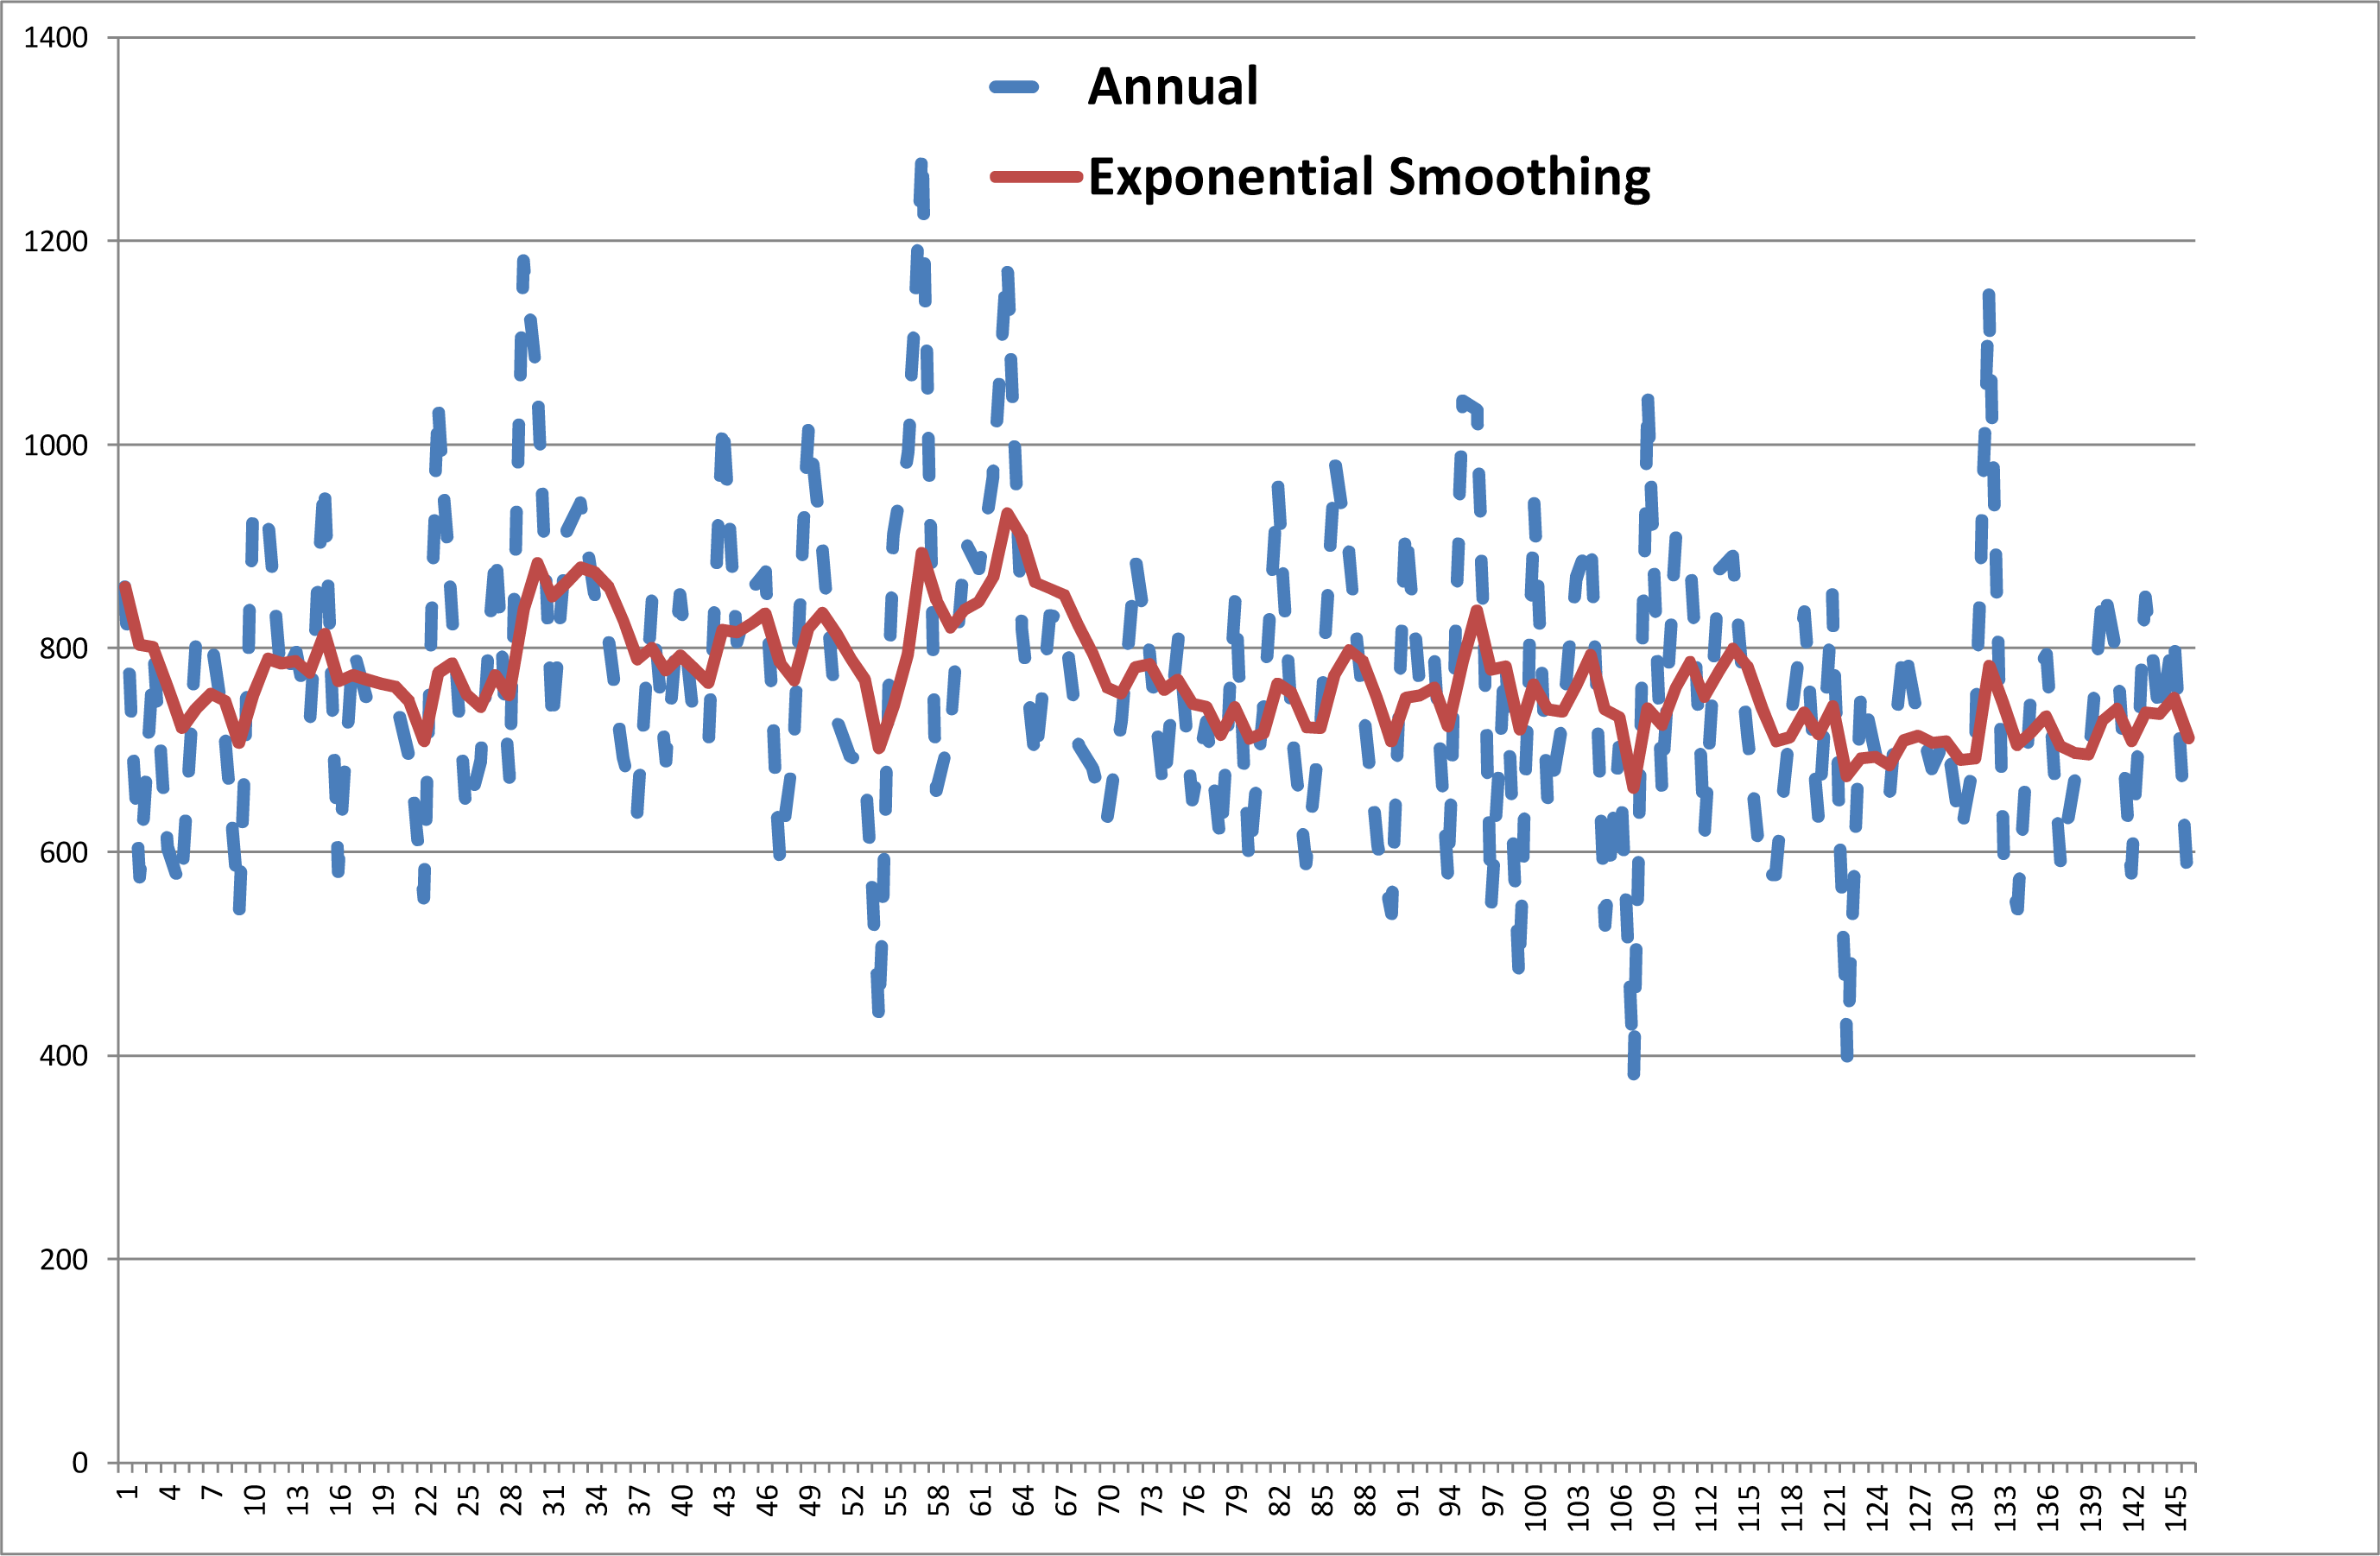
It would appear that these two locations at the edge of the plateau are going against the trend identified by [6]. It still could be that the entire region is following the same trend over time. In this case, there would be no argument for the conjecture that the increase in vegetation has aided the total rainfall. To check on this, examine the trends over time for the two locations more removed from the plateau. First, let’s look at the time series of annual rainfall at Mt Barker, as shown in Figure 6. An hypothesis test for equal rainfall before 1989 versus less after has a p-value of 0.103. So there is a lower average rainfall after of 727 mm versus 775 before but it is not significantly lower.
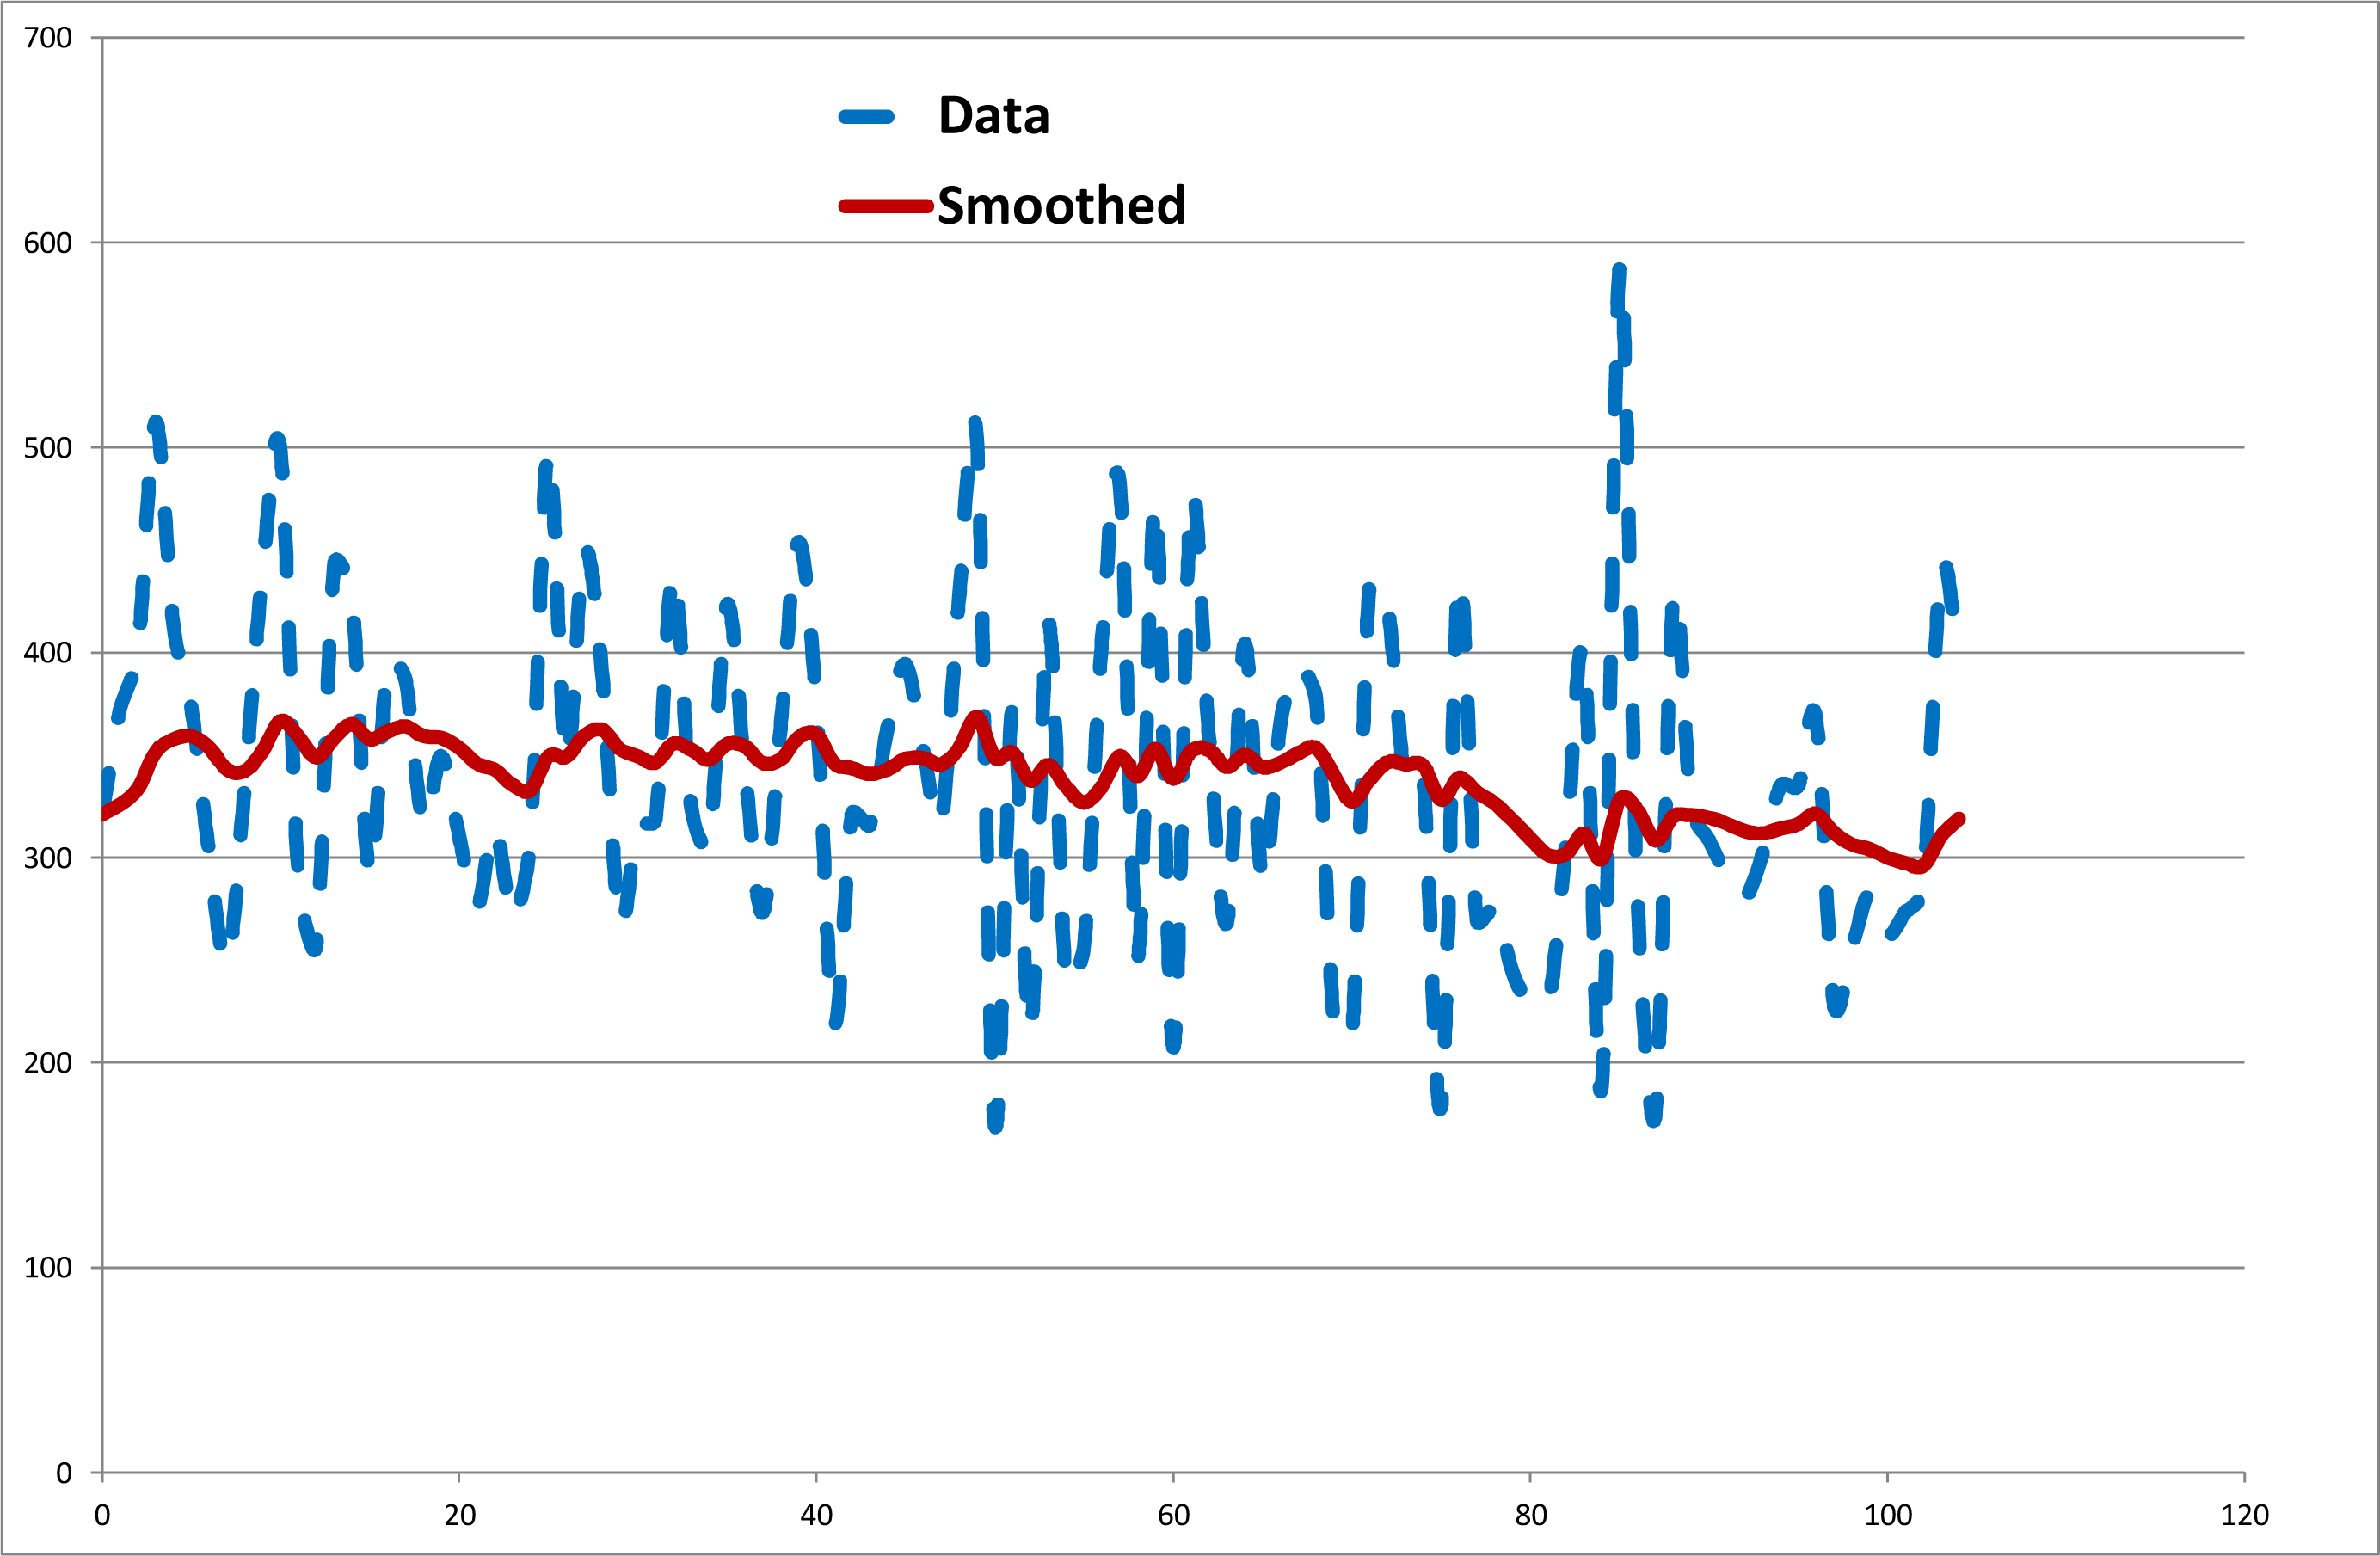
Now move to examining a town east of the plateau, Tailem Bend, for rainfall trends. The mean rainfall before 1989 was 380 mm and after was 348, as illustrated in Figure 7. An hypothesis test of the mean rainfall being the same before and after 1989 versus being less after was not rejected with a p-value of 0.069. This was in a way similar to the test for Murray Bridge but with opposite alternate hypothesis, being greater after 1989 at Murray Bridge and less after 1989 at Tailem Bend, even though the two locations are only 20 km apart.
To summarise the rainfall analysis at the four locations, there is insufficient statistical evidence to conclude any difference in the mean rainfall before and after 1989 at any station. There is however, a definite pattern in the results. The trends at Mt Barker and Tailem Bend are consistent with the findings of Gallant et al. [6] of a diminishing rainfall in this area of the country, though not at as great a rate. Estimates of the change per decade in rainfall at the four stations are Murray Bridge (+9.5), Callington (+9.6), Mt Barker (−6.8) and Tailem Bend (−8.2). Note that, as expected, the slopes are not statistically significant, but are on the other hand actual estimates of change. Also, the changes are positive near the plateau and negative further away, consistent with an influence there. And, as has been emphasized, if one tests that the changes are consistent with the findings of Gallant et al. [6] for the stations near the plateau, this hypothesis is rejected.
5. Cross Checking with Other Locations in South Australia
It is important to make sure that the analysis has not been selective. Thus, yearly rainfall totals were accessed from a number of other sites across southern South Australia and examined whether one could reasonably infer that there was any trend upwards or downwards in any of them. From Figures 8 and 13, it can be reliably concluded that in none of these locations is there any evidence of any long term increase in rainfall. Nor can one conclude that there is any evidence of recent increases as in Murray Bridge and Callington. It appears to be some evidence of recent decrease in four cases (Tumby Bay, Minlaton, Glen Osmond and Keith) and essentially level over time in Port Wakefield and Loxton. These inferences will have to be monitored as more data comes to hand. It will be part of a future exercise to use satellite images, aerial maps and so on to try an understand the land use and land cover changes over time in these areas and see how they may relate to the rainfall trends.
6. Possible Complicating Factors
There are some issues that must be considered in this study that may affect the conclusions:
- It may be surmised by some that when one sees rainfall trending down in any of the locations, it is due to the impacts of climate change on rainfall - see cf. Gallant et al. [6]. That may well be, but in fact if that were the case, then to actually have rainfall trending up, it is even easier to accredit land use change as a factor.
- Similarly, if one can attribute changes in rainfall to climate change plus land use change, the conclusion can still be made that what is happening at Murray Bridge and Callington is most probably due to positive land use change.
- What if one has differing things happening in different seasons, and it must be noted that often this type of analysis is performed season by season? Any investigations done on seasonal totals mirror in general what has been reported on an annual basis. This has not been checked for every location, but where it is, this has been the result.
7. Conclusions
This has been an investigation to add some knowledge to the interplay between vegetation and rainfall. As was stated, there has been a significant amount of work on how rainfall can diminish after clearance of large areas of vegetation. This continues to be substantiated. In a recent comprehensive analysis of the depletion of rainfall in Western Australia, Andrich and Imberger [22] state that the reduction of native vegetation from 60% to 30% of the land area in the wheatbelt, between 1950 and 1970, coincided with an average 21% reduction in inland rainfall relative to coastal rainfall. The coastal part did not experience land-use change and the rainfall remained stationary over the same period. It was found that for the forested coastal strip region south of Perth, land clearing that removed 50% of the native forests between 1960 and 1980 coincided with a 16% reduction in rainfall relative to stationary coastal rainfall.
There has been less work reported on how rainfall might be enhanced by strategic planting schemes. What is meant by strategic is selection of sites that will aid in interference with weather patterns in order to add to the rainfall totals where they are needed. Interestingly, Andrich and Imberger [22] go on in their conclusions to state that there is a pressing need to undertake large scale reforestation with native trees to mitigate the long term changes in climate. They even coin the phrase reforestation for water production, which should be taken up as a catchcry.
Fortuitously, the plantings that were made in the Monarto area in the 1970s seem to have been by chance of great enough extent and in a sensible area to be able to enhance the rainfall in the surrounding towns of Murray Bridge and Callington. In August, 2013 strategic planting schemes near Cummins on Eyre Peninsula have begun. It is hoped that benefits of this will accrue in the future.
Acknowledgments
This work is supported by an Australian Research Council (ARC) Discovery Indigenous Researcher Development Grant DI110100028-Indigenous knowledge: water sustainability and wild fire mitigation, and the Goyder Institute for Water Research.
Conflicts of Interest
The author declares no conflict of interest.
References
- Junkermann, W.; Hacker, J.; Lyons, T.; Nair, U. Land use change suppresses precipitation. Atmos. Chem. Phys 2009, 9, 6531–6539. [Google Scholar]
- Allan, R.J.; Haylock, M.R. Circulation features associated with the winter rainfall decrease in Southwestern Australia. J. Clim 1993, 6, 1356–1367. [Google Scholar]
- Smith, I.N.; McIntosh, P.; Ansell, T.J.; Reason, C.J.C.; McInnes, K. Southwest Western Australian winter rainfall and its association with Indian Ocean climate variability. Int. J. Climatol 2000, 20, 1913–1930. [Google Scholar]
- Climate Change and Water. In Technical Paper of the Intergovernmental Panel on Climate Change; Bates, B.C.; Kundzewicz, Z.W.; Wu, S.; Palutikof, J.P. (Eds.) IPCC Secretariat: Geneva, Switzerland, 2008; p. 210.
- Sindicic, M.; STREAMCARE Working Group. Cummins-Wanilla Basin Catchment Management Plan; Department of Environment, Water and Natural Resources: Port Lincoln, Australia, 2002. [Google Scholar]
- Gallant, A.; Hennessy, K.; Risbey, J. Trends in rainfall indices for six Australian regions: 1910–2005. Aust. Met. Mag 2007, 56, 223–239. [Google Scholar]
- Sadler, B. Climate variability and change in south west Western Australia, Indian Ocean Climate Initiative Panel, c/-Department of Environment, Water and Catchment Protection, WA. Available online: http://www.waterandclimateinformationcentre.org/resources/8012007IOCI2002.pdf (accessed on 25 February 2014).
- Pitman, A.J.; Narisma, G.T.; Pielke, R.A.; Holbrook, N.J. Impact of land cover change on the climate of southwest Western Australia. J. Geophys. Res 2004, 109. doi: 10.10292003JD004347. [Google Scholar]
- Pielke, R.A.; Pitman, A.; Niyogi, D.; Mahmood, R.; Mcalpine, C.; Hossain, F.; Goldewijk, K.K.; Nair, U.; Betts, R.; Souleymane, F.; et al. Land use/land cover changes and climate: Modeling analysis and observational evidence. Wiley Interdiscip. Rev. Climate Change 2011, 2, 828–850. [Google Scholar]
- Chikoore, H.; Jury, M.R. Intraseasonal variability of satellite-derived rainfall and vegetation over Southern Africa. Earth Interact 2010, 14, 1–26. [Google Scholar]
- Wang, G. A conceptual modeling study on biosphere-atmosphere interactions and its implications for physically based climate modeling. J. Clim 2004, 17, 2572–2583. [Google Scholar]
- Woodward, F.I. Climate and Plant Distribution; Cambridge University Press: Cambridge, UK, 1987. [Google Scholar]
- Zeng, N.; Neelin, J.D.; Lau, K.-M.; Tucker, C.J. Enhancement of interdecadal climate variability in the Sahel by vegetation interaction. Science 1999, 286, 1537–1540. [Google Scholar]
- Spracken, D.V.; Arnold, S.R.; Taylor, C.M. Observations of increased tropical rainfall preceded by air passge over forests. Nature 2012, 49, 282–285. [Google Scholar]
- Makarieva, A.M.; Gorshkov, V.G.; Li, B.-L. Precipitation on land versus distance from the ocean: Evidence for a forest pump of atmospheric moisture. Ecol. Complex 2009, 6, 302–307. [Google Scholar]
- Beltran-Przekurat, A.; Pielke, R.A., Sr.; Eastman, J.L.; Coughenour, M.B. Modelling the effects of land-use and land-cover changes on the near-surface atmosphere in southern South America. Int. J. Climatol 2012, 32, 1206–1225. [Google Scholar]
- Monbiot, G. Drowning in Money. The Guardian 2014. [Google Scholar]
- The Pontbren Project. Available online: http://www.pontbrenfarmers.co.uk/ (accessed on 25 February 2014).
- Marshall, M.R.; Ballard, C.E.; Frogbrook, Z.L.; Solloway, I.; McIntyre, N.; Reynolds, B.; Wheater, H.S. The impact of rural land management changes on soil hydraulic properties and runoff processes: Results from experimental plots in upland UK. Hydrol. Process 2014, 28, 2617–2629. [Google Scholar]
- Ryan, J.G.; McAlpine, C.A.; Ludwig, J.A. Integrated vegetation designs for enhancing water retention and recycling in agroecosystems. Landsc. Ecol 2010, 25, 1277–1288. [Google Scholar]
- O’Loughlin, E.M.; Nambiar, E.K.S. Plantations, Farm Forestry and Water–A Discussion Paper; Rural Industries Research and Development Corporation: Canberra, Australia, 2001. [Google Scholar]
- Andrich, M.A.; Imberger, J. The effect of land clearing on rainfall and freshwater resources in Western Australia: A multifunctional sustainability analysis. Int. J. Sustain. Dev. World Ecol 2013, 20, 549–563. [Google Scholar]
Figure 1.
Annual rainfall totals for Perth Airport from 1944 to 2011 with smoothed trend.

Figure 2.
Cloud formation over Western Australia-Satellite image originally processed by the Bureau of Meteorology from the geostationary meteorological satellite MTSAT-1R operated by the Japan Meteorological Agency.
Figure 2.
Cloud formation over Western Australia-Satellite image originally processed by the Bureau of Meteorology from the geostationary meteorological satellite MTSAT-1R operated by the Japan Meteorological Agency.

Figure 3.
Annual rainfall totals for Cummins for 1945–2004 with smoothed trend.

Figure 4.
Annual rainfall totals for Murray Bridge from 1886 to 2011.

Figure 5.
Annual rainfall totals for Callington from 1900 to 2011.

Figure 6.
Annual rainfall totals for Mt Barker from 1861 to 2006.

Figure 7.
Annual rainfall totals for Tailem Bend from 1908 to 1998.

Figure 8.
Annual rainfall totals for Tumby Bay, 34.38° S, 136.10° E, for 1906–2011.

Figure 9.
Annual rainfall totals for Minlaton, 34.77° S, 137.60° E, for 1880–2013. Note that exponential smoothing was not done for this location as there are some missing data.
Figure 9.
Annual rainfall totals for Minlaton, 34.77° S, 137.60° E, for 1880–2013. Note that exponential smoothing was not done for this location as there are some missing data.

Figure 10.
Annual rainfall totals for Port Wakefield, 34.18° S, 138.15° E, 1874–2013.

Figure 11.
Annual rainfall totals for Glen Osmond, 34.95° S, 138.65° E, for 1884–2013. Note that exponential smoothing was not done for this location as there are some missing data.
Figure 11.
Annual rainfall totals for Glen Osmond, 34.95° S, 138.65° E, for 1884–2013. Note that exponential smoothing was not done for this location as there are some missing data.

Figure 12.
Annual rainfall totals for Loxton, 34.44° S, 140.50° E, for 1897–2002.

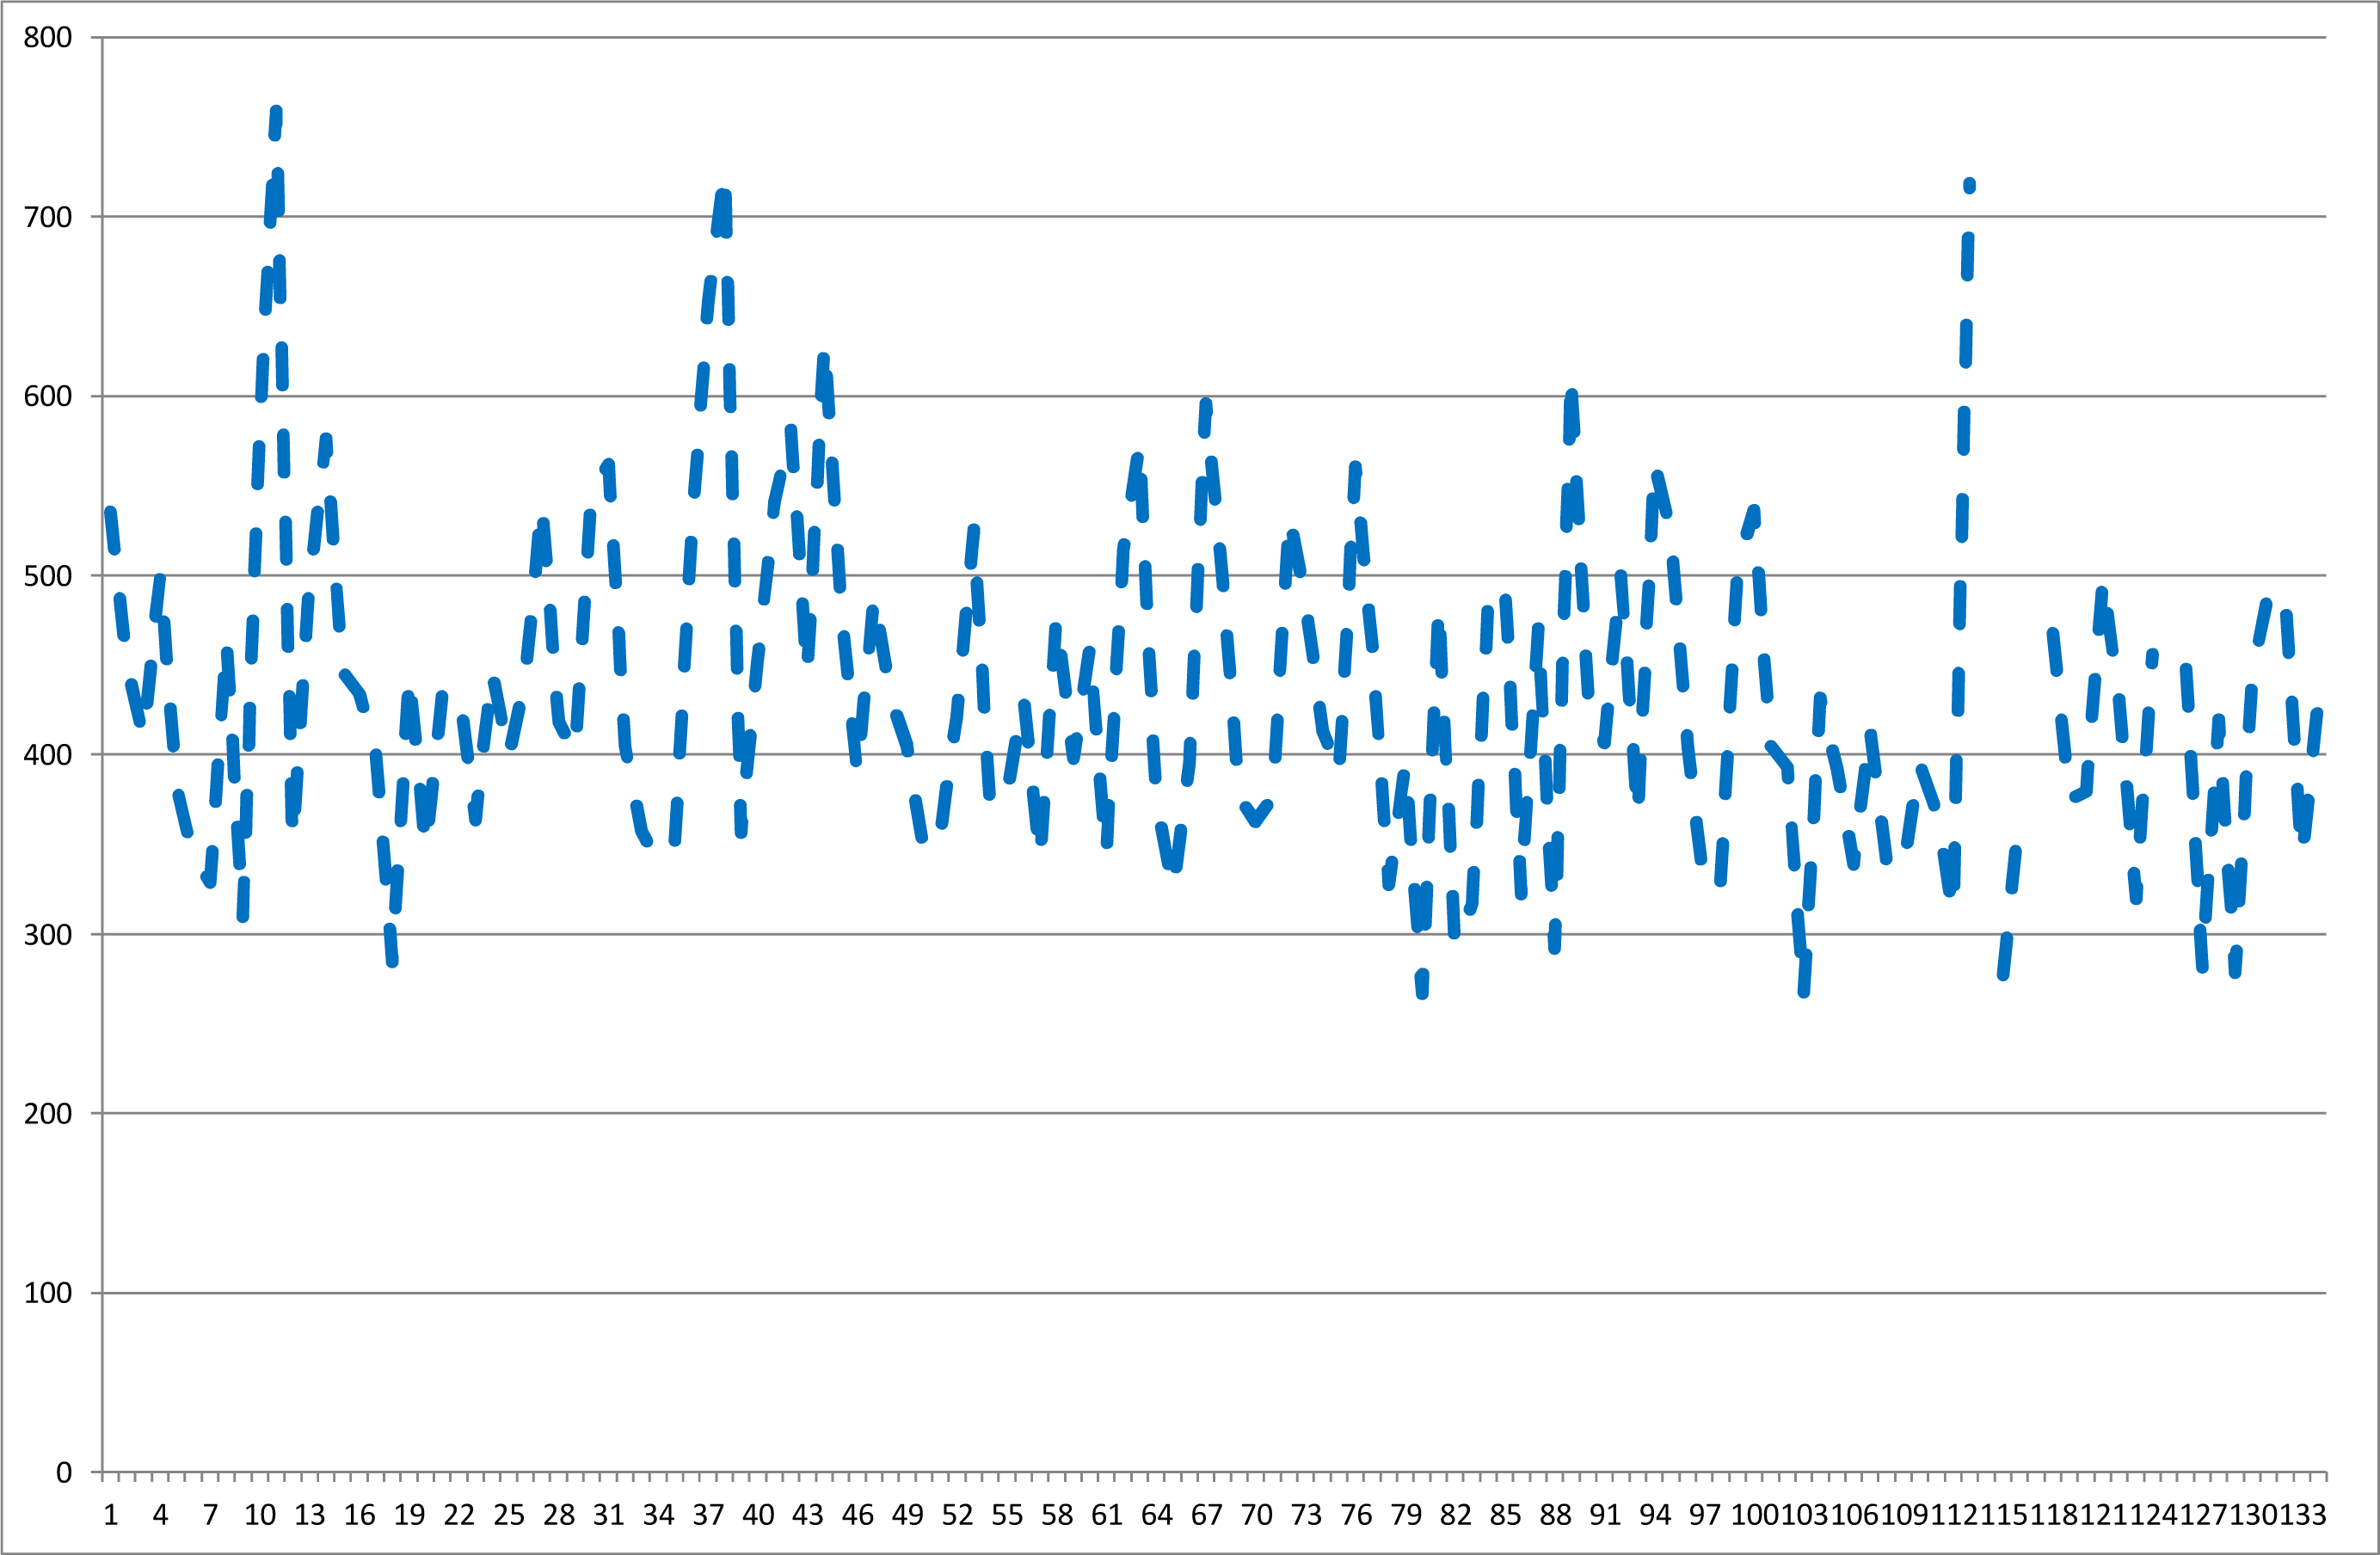
Figure 13.
Annual rainfall totals for Keith, 36.10° S, 140.36° E, for 1907–2013.

© 2014 by the authors; licensee MDPI, Basel, Switzerland This article is an open access article distributed under the terms and conditions of the Creative Commons Attribution license (http://creativecommons.org/licenses/by/3.0/).
Share and Cite
MDPI and ACS Style
Boland, J. Rainfall Enhances Vegetation Growth but Does the Reverse Hold? Water 2014, 6, 2127-2143. https://doi.org/10.3390/w6072127
AMA Style
Boland J. Rainfall Enhances Vegetation Growth but Does the Reverse Hold? Water. 2014; 6(7):2127-2143. https://doi.org/10.3390/w6072127
Chicago/Turabian StyleBoland, John. 2014. "Rainfall Enhances Vegetation Growth but Does the Reverse Hold?" Water 6, no. 7: 2127-2143. https://doi.org/10.3390/w6072127