Article

Tracking Inflows in Lake Wivenhoe during a Major Flood Using Optical Spectroscopy

1
Centre for Water Management and Reuse, School of Natural and Built Environments, University of South Australia, Mawson Lakes, SA 5095, Australia
2
School of Civil Engineering, The University of Queensland, St Lucia, QLD 4072, Australia
*
Author to whom correspondence should be addressed.
Water 2014, 6(8), 2339-2352; https://doi.org/10.3390/w6082339
Submission received: 29 May 2014 / Revised: 23 July 2014 / Accepted: 25 July 2014 / Published: 7 August 2014
(This article belongs to the Special Issue Water Resources in a Variable and Changing Climate)

Abstract

:
Lake Wivenhoe is the largest water storage reservoir in South-East Queensland and is the primary drinking water supply storage for over 600,000 people. The dam is dual purpose and was also designed to minimize flooding downstream in the city of Brisbane. In early January, 2011, record inflows were experienced, and during this period, a large number of catchment pollutants entered the lake and rapidly changed the water quality, both spatially and vertically. Due to the dendritic nature of the storage, as well as multiple inflow points, it was likely that pollutant loads differed greatly depending on the water depth and location within the storage. The aim of this study was to better understand this variability in catchment loading, as well as water quality changes during the flood event. Water samples were collected at five locations during the flood period at three different depths (surface, mid-depth and bottom), and the samples were analysed using UV and fluorescence spectroscopy. Primary inflows were identified to persist into the mid-storage zone; however, a strong lateral inflow signature was identified from the mid-storage zone, which persisted to the dam wall outflow. These results illustrate the heterogeneity of inflows in water storages of this type, and this paper discusses the implication this has for the modelling and management of such events.

1. Introduction

Lake Wivenhoe, situated 80 km west of Brisbane, is one of the largest dams in Australia. The lake has a capacity to store 1.15 million megalitres (ML) of water and is the major water supply to Brisbane, which is the fourth largest city in Australia. Being situated on the banks of the Brisbane River, the city frequently experiences flooding. Wivenhoe Dam lies on this river, approximately 80 km upstream of the city of Brisbane. It was specifically designed to minimize the flood risk to Brisbane. During flood periods, the lake is capable of holding back a total of 1.45 million ML. After a long decade of drought, Brisbane experienced extreme rainfall between the end of December, 2010, and the first week of January, 2011. The resultant runoff rapidly filled Lake Wivenhoe to 190% of its designed storage capacity. The surrounding catchment is heavily modified with only 40% remnant vegetation, and this, combined with the record inflows, resulted in a significant pollutant loading, including sediment, dissolved organic matter and nutrients, over a very short period of time [1].
Dissolved organic matter (DOM) is of great concern, due to its role in the binding of nutrients, heavy meals and other pollutants from surrounding terrestrial environments. DOM influences the physical and chemical environment in lakes through light attenuation and metal complexion [2,3,4]. DOM is also important in trophic dynamics [5,6], which promote the growth of heterotrophic microorganisms [7,8]. Furthermore, the incorporation of nitrogen and phosphorus into the DOM pool can influence nutrient cycling in lakes and reservoirs [9,10,11,12]. DOM can negatively impact water treatment directly through taste, odour and colour issues and during chlorination through the production of disinfection by-products. Finally, DOM can lead to bacterial proliferation within water distribution systems.
DOM comprises a large number of organic molecules of varied composition, and their characterization can be both complicated and labour intensive. However, monitoring the spatial and vertical variation of DOM is useful for gaining a better understanding of aquatic environmental significance, particularly during periods of major catchment inflows. During major inflows, water quality can change significantly in short periods of time, and simple and sensitive tools are required to rapidly provide qualitative information regarding DOM changes. Optical spectroscopy techniques, such as UV and fluorescence spectroscopy, are both rapid and capable of providing useful characterization of a wide range of DOM.
Optical spectroscopies, such as UV and fluorescence spectroscopy, have been extensively used to characterize organic matter that undergoes changes due to chemical, biological and physical processes in water and wastewater. Optical spectroscopies are popular, because they are reasonably sensitive, simple, rapid and economic. The UV technique can be used with absorption on single- or dual-wavelength procedures and can provide information on individual or representative organic chemical species. The specific wavelength can provide information on numerous chemicals present in the environmental samples [13,14,15,16,17]. The fluorescence spectroscopy method, commonly known as the excitation emission matrix (EEM), is a technique that can be used to obtain an optical fingerprint of dissolved organic matter in water and wastewater, and this can provide information on the nature of microbial, humic and fulvic organics and other pollutants, such as hydrocarbons. Its high sensitivity and its specificity to specific chemicals or groups of chemicals, such as amino acids, aromatic amino acids, mycosporine-like amino acids, humics, proteins and fulvic type substances, have made the application of fluorescence widely popular in the last few years in environmental monitoring [18,19,20]. Although UV and EEM have been used to monitor water and wastewater in the past, their application in tracking DOM and specific chemical constituents both spatially and vertically has not been reported so far.
The main aim of this paper is to demonstrate how simple optical techniques can be used to track DOM inflows in a lake during flood periods where rapid mixing of water both spatially and vertically takes place.

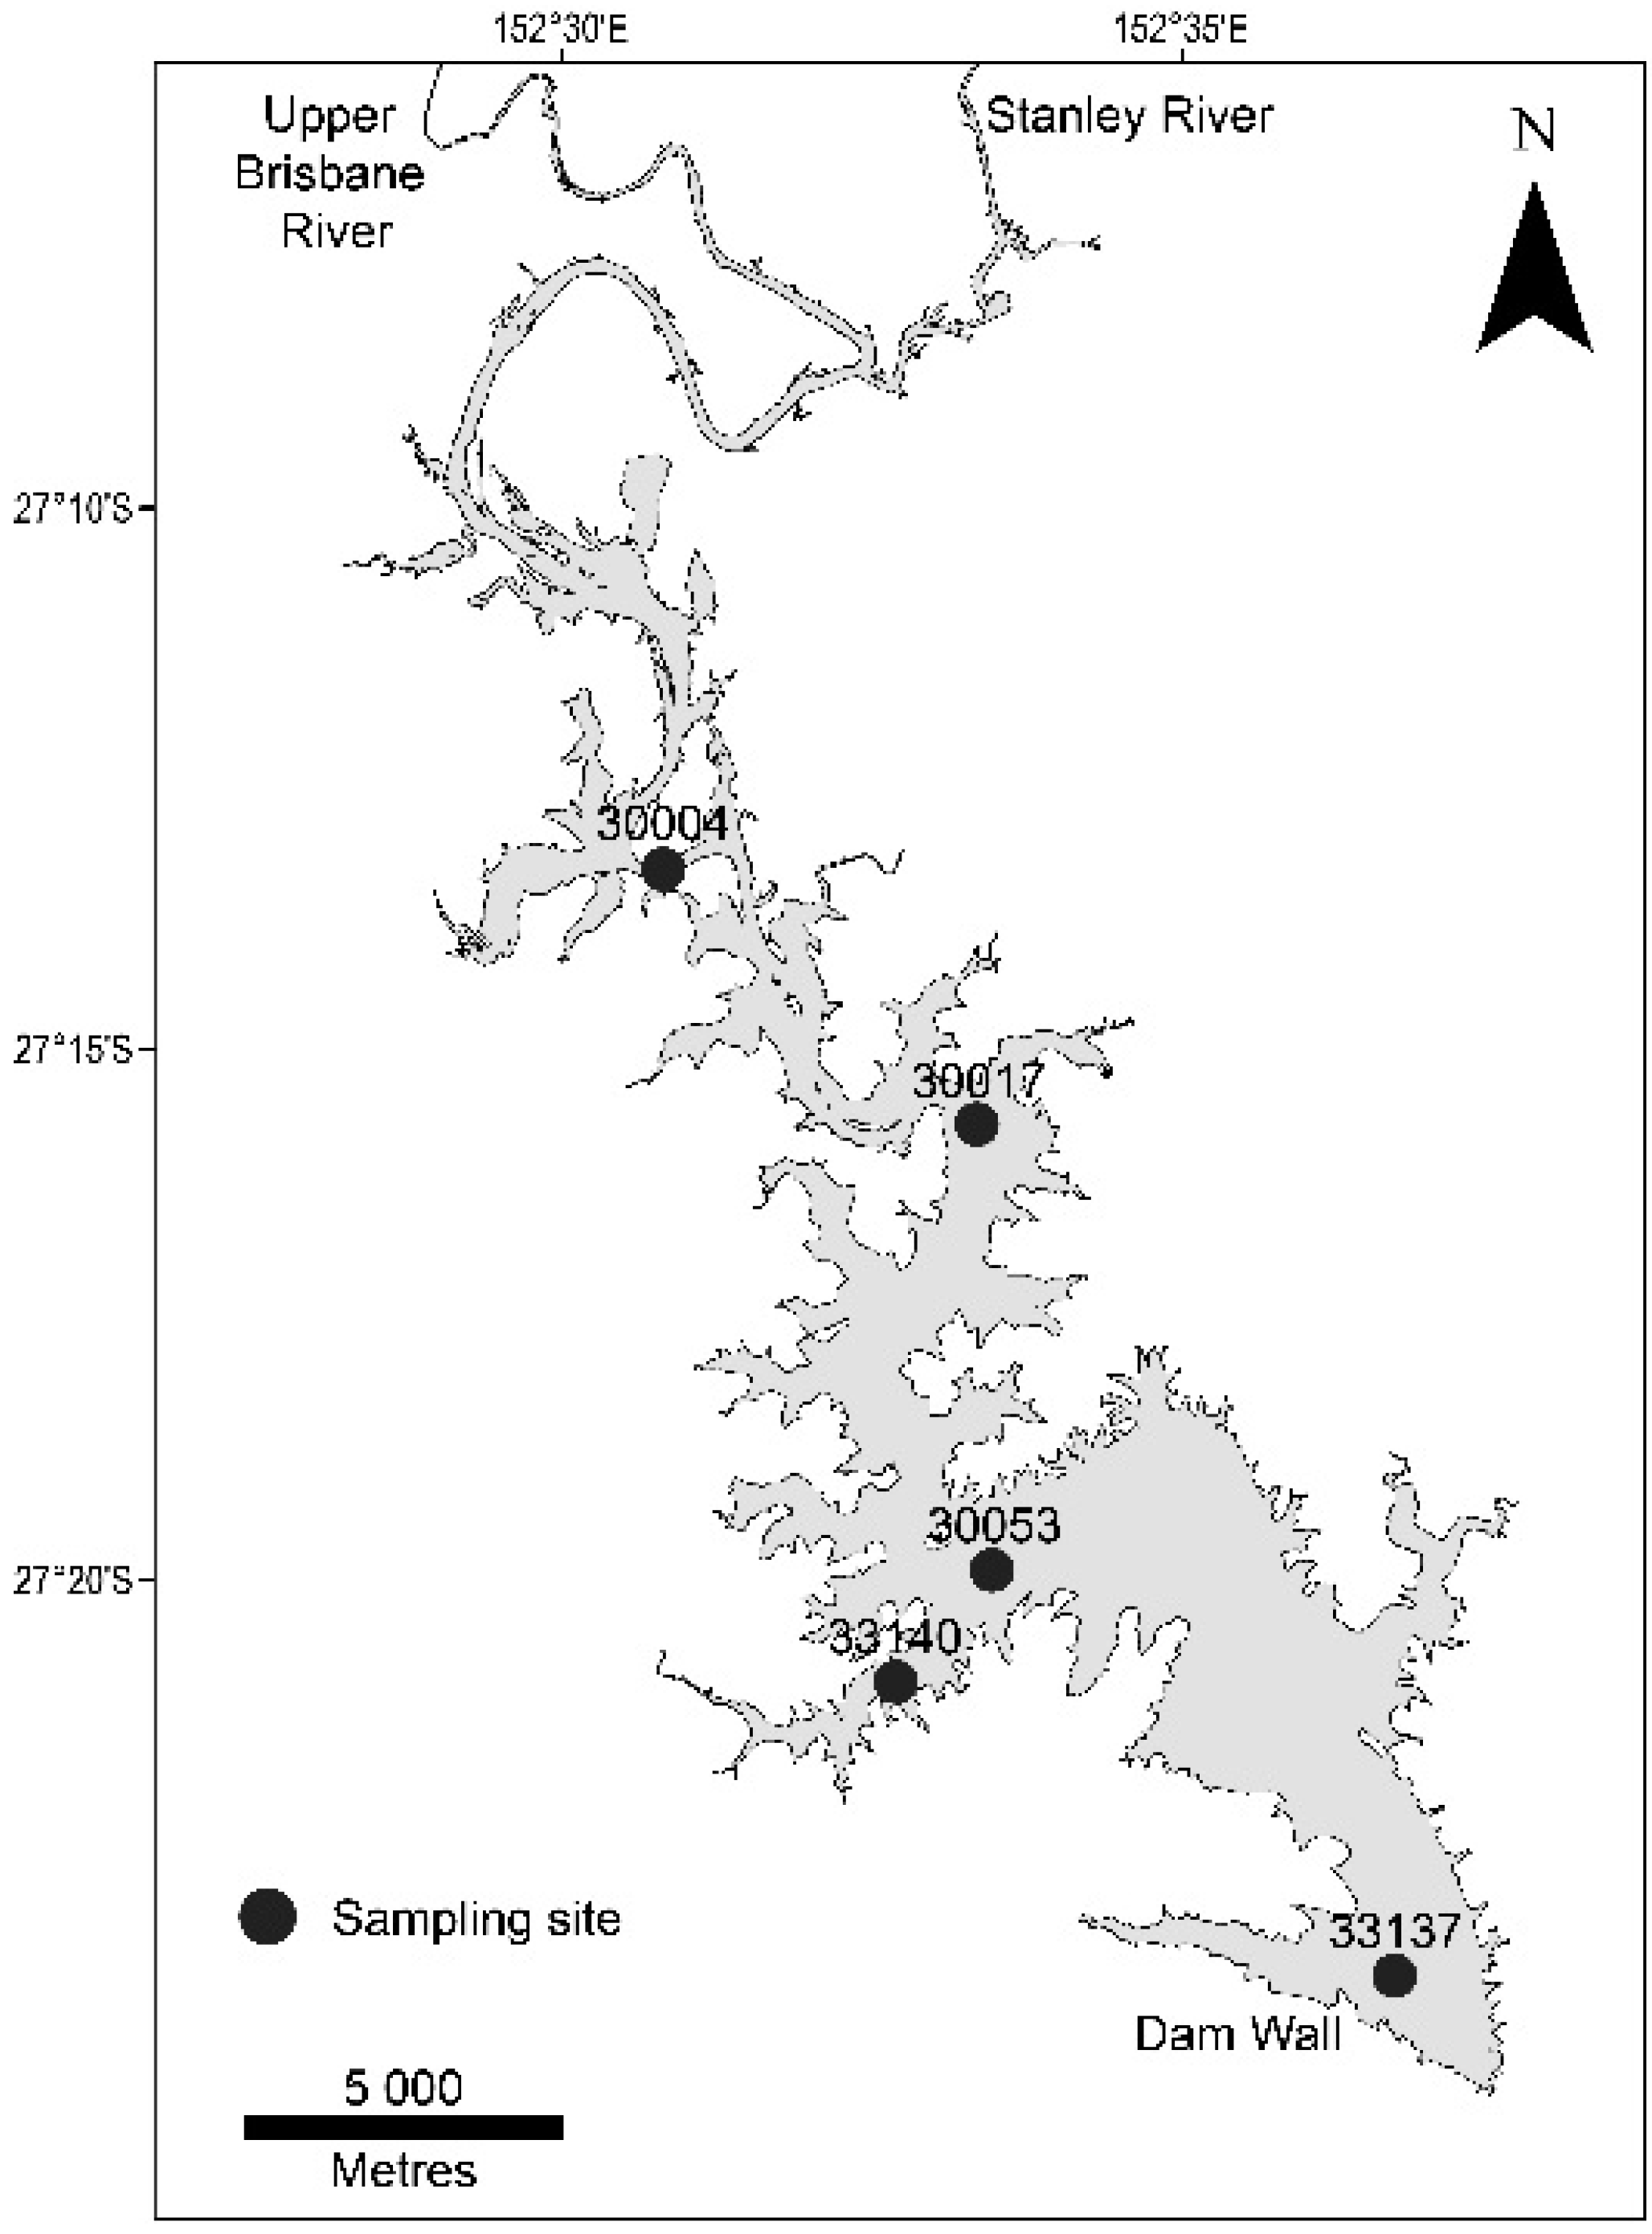
2. Materials and Methods

Sampling was conducted on 21 January 2011, 10 days after the peak inflows occurred. In order to maximize the spatial representation of the lake, sites were selected from the dam wall, through the main body of the lake and at adjacent major inflow points (Figure 1). Water samples were taken from both the surface (20 cm below the water surface), mid (8 m water depth) and bottom (>15 m, 1 m above the sediment surface) with a vertical, 4.2-L Niskin water sampler (Wildco, Wildlife Supply Company, Yulee, FL, USA). Water depth at each site was recorded from an on-board depth sounder (Lowrance Elite-7 HDI, Navico Inc., Ensenada, MX, USA). Prior to sample collection, the Niskin and sampling bottles (glass) were cleaned with diluted nitric acid followed by Milli-Q water and twice flushed with water from the same sample depth to minimise contamination. Field personnel took care to not handle the inside of the Niskin or sample containers during sampling, and samples were placed on ice after collection for transport to the laboratory.
Figure 1. Lake Wivenhoe and sampling stations.
Water 06 02339 g001
The laboratory samples were filtered through a 1.2-µm filter (Whatman GF/C, GE Healthcare, Little Chalfont, UK) to avoid the influence of turbidity due to suspended solids that cause light scattering, shading and, thus, influence the absorption over the entire spectrum. The filtrate was analysed for dissolved organic carbon (DOC), UV and fluorescence spectra. Details are described below.

2.1. Dissolved Organic Carbon Analysis

Dissolved organic carbon was measured by liquid chromatography with online organic carbon detection (LCOCD, Karlsruhe, Germany) [21]. No replicates were performed in this study.

2.2. UV Analysis

The water samples were analysed using a UV spectrometer (Varian 50 Bio, Victoria, Australia). The instrument was operated at a bandwidth of 1 nm, with a quartz cell of a 10-mm path length, a wavelength of 190 to 400 nm and at a scanning speed of 190 nm/min (slow) at room temperature, 22 ± 2 °C. Milli-Q water was recorded as blank at every set of experiments and subtracted from each sample’s UV record.

2.3. Fluorescence Analysis
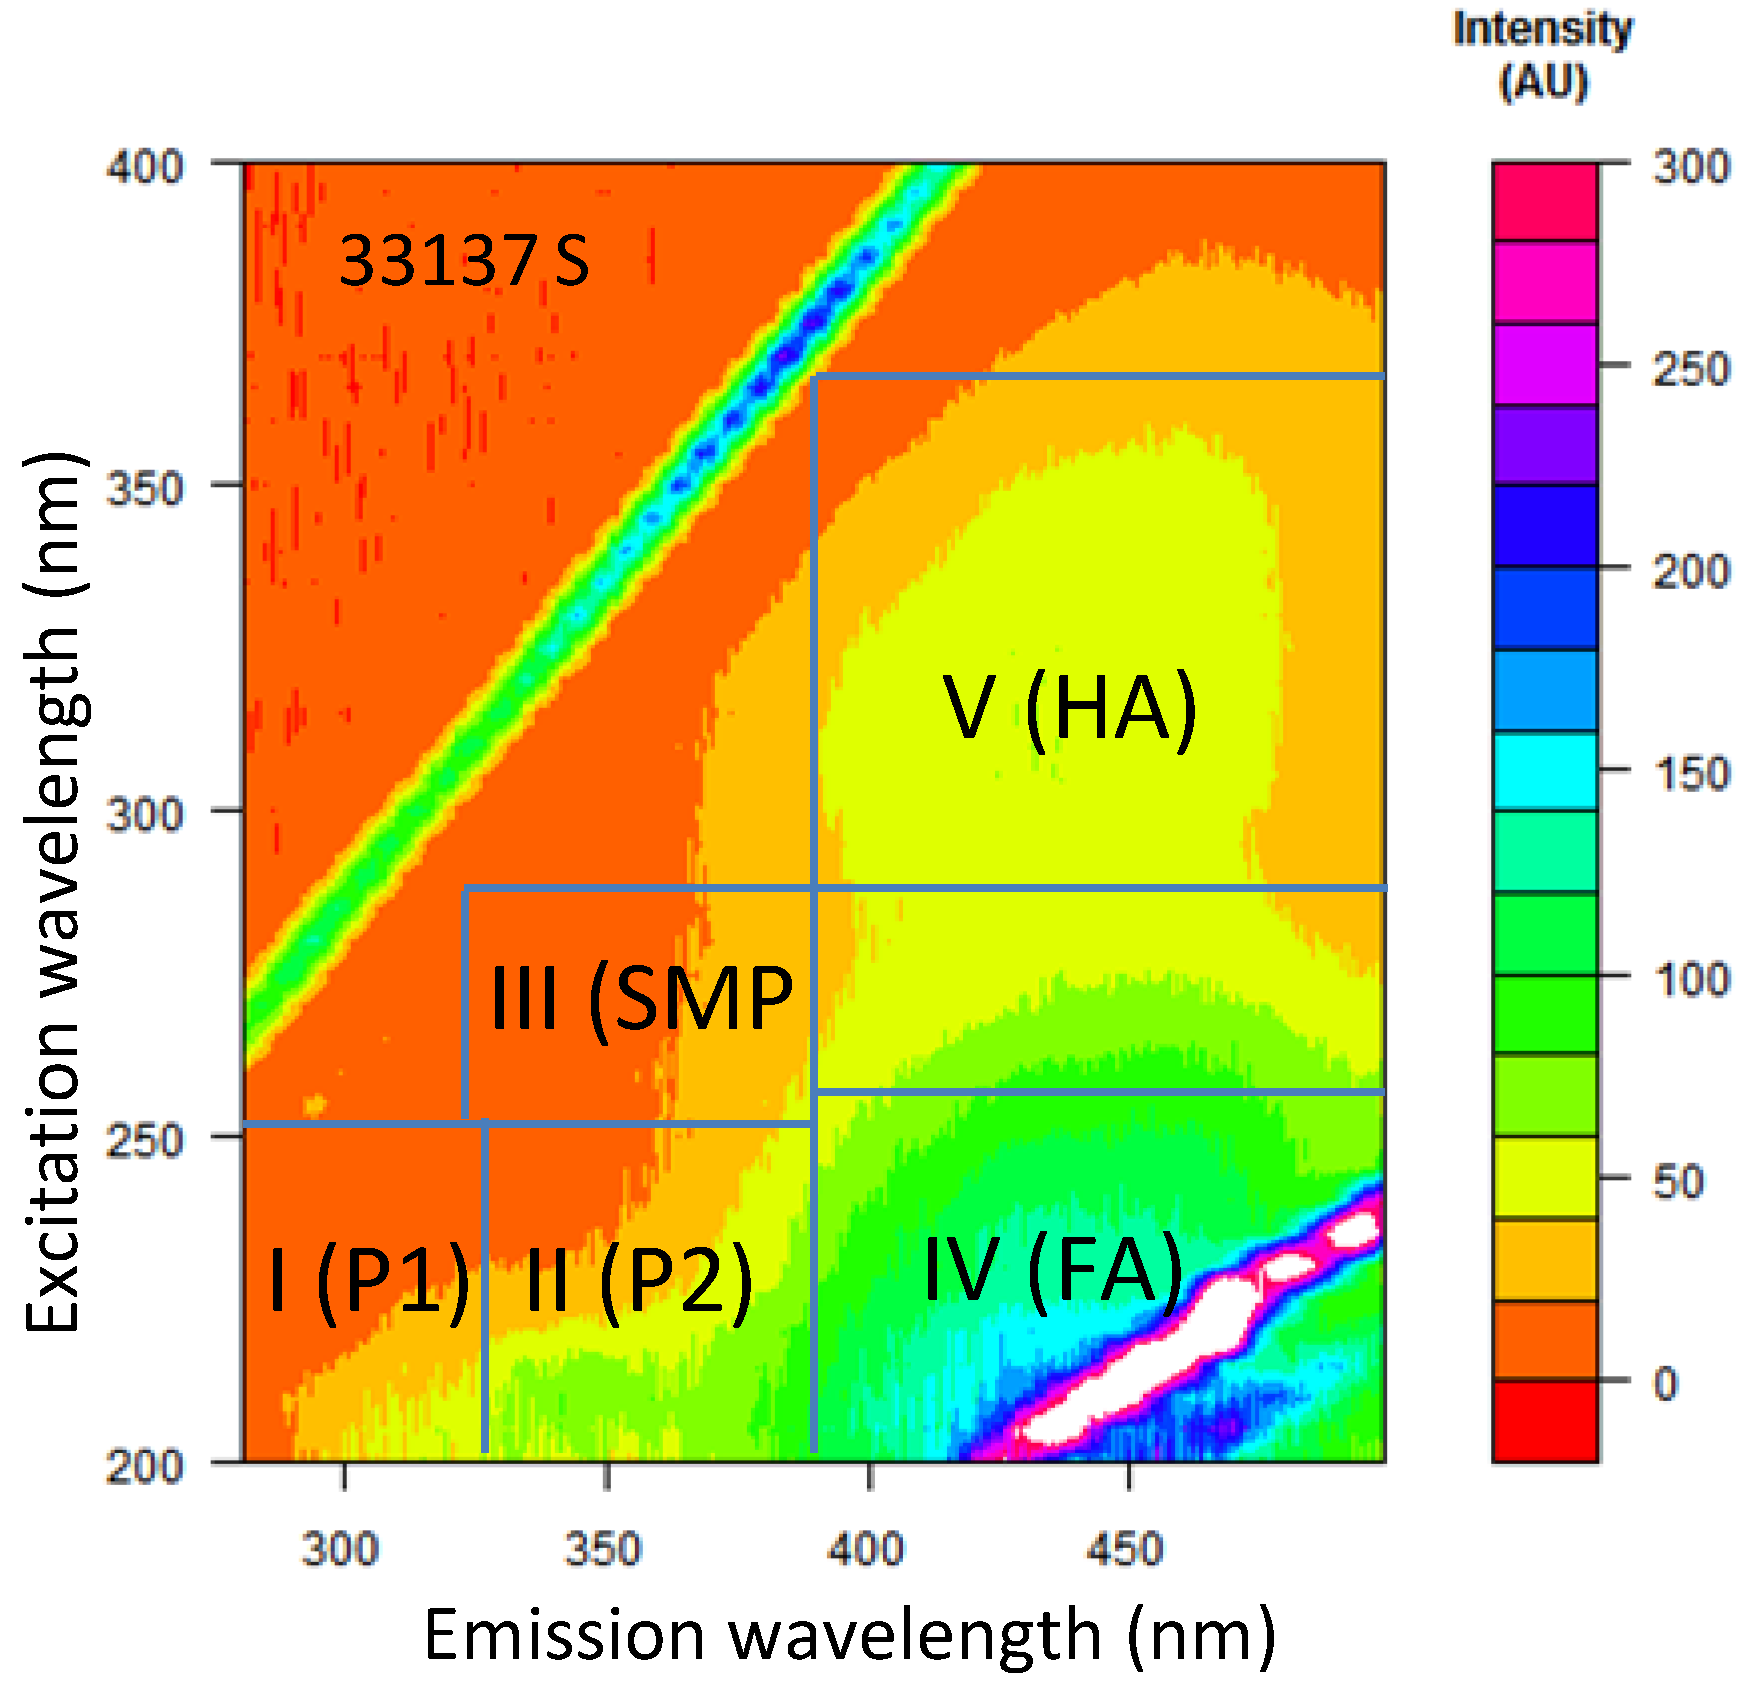
Three-dimensional fluorescence spectra, also known as excitation emission matrix (EEM) spectra, were obtained using a spectrofluorometer (Perkin Elmer LS 55, Victoria, Australia) with a wavelength range of 200 nm to 500 nm (for excitation); and 280 nm to 500 nm (for emission). The spectra were taken at an incremental wavelength of 5 nm in excitation (Ex); and 2 nm in emission (Em). The EEM value of blank (MQ water) data was subtracted from the analysed samples for blank correction. The fluorescence intensity was corrected by blank subtraction and was expressed in quinine sulphate units (QSU) [22].
A 290-nm emission cut-off filter was used to eliminate the second order Rayleigh light scattering. To eliminate water Raman scatter peaks, Milli-Q water was recorded as the blank and subtracted from each sample. The inner filter effect of EEMs caused by possible higher concentrations of dissolved organic matter (DOM) in the samples was corrected for absorbance by the multiplication of each value in the EEM with a correction factor based on the idea that the average path length of the absorption of the excitation and emission light is 1/2 the cuvette length. For this purpose, the expression was used:
Fcorr = Fobs × 10(λex + λem)/2
where Fcorr and Fobs are the corrected and observed fluorescence intensities and λex and λem are the absorbances at the current excitation and emission wavelengths.
The data obtained from EEM were analysed using an “R” program according to Chen et al. (2003) [23] and described below.
Water 06 02339 i001
where ∅i is the volume beneath region i; (λexλem) is the fluorescence intensity at each excitation-emission wavelength pair and Δλex and Δλem are the excitation and emission wavelength intervals, respectively.
T = ∑ ∅i
where ∅T is the cumulative volume.
The EEM spectra was divided into five major regions (shown in Table 1 and Figure 2). The program could calculate area, as well as the contribution percentage of each area.
Table 1. Five major regions in excitation emission matrix (EEM) spectra according to Chen et al. (2003) [23]. SMP, soluble microbial by-product; FA, fulvic acid; HA, humic acid. (P1 and P2 = proteins, Ex = excitation, Em = emission, and BOD = biological oxygen demand.)
RegionChemical composition of organic matter
I (P1): Ex:Em 200–250:280–330lower molecular weight tyrosine-like aromatic amino acids
II (P2): Ex:Em 200–250:330–380low molecular weight aromatic proteins and BOD-type substances
III (SMP): Ex:Em 250–340:280–380large molecular weight peptides and proteins (microorganism related by-products)
IV (FA): Ex:Em 200–250:380–500fulvic acid type substances
V (HA): Ex:Em 250–500:380–500humic acid type substances
Figure 2. Five EEM regions selected for this study from the surface water of Site 33137 (regions plotted according to Chen et al., 2003) [23].
Water 06 02339 g002

3. Results and Discussion

3.1. Spatial and Vertical Variation in DOM Concentration

Table 2 shows dissolved organic carbon (DOC) across sampling sites and vertically within each site. The DOC concentration was 3–4-times lower than at stratified conditions (9.6–12.8 mg/L recorded almost one year after this study). The lower DOC concentrations indicate dilution by flooding waters. The DOC decreased from inflow sites in the upper lake downstream to the lower lake. Surface waters of upstream sites had relatively elevated DOC levels compared to deeper waters. However, at the middle and downstream sites, the bottom waters had elevated DOC relative to mid-depth and surface waters. Higher DOC concentrations adjacent to a major inflow point (Site 30004) was assumed to be due to catchment inflows having relatively less dilution with lake water compared with sites further into the lake. Decreases in the surface DOC at sites further into the lake were possibly due to settling, microbial/photochemical decomposition and/or subsurface catchment inflows tracking through the lake at deeper depths compared with shallower inflow points [24]. A higher rate of degradation of humic substances at the surface when exposed to UV is reported by Salonen and Vahatalo in a lake in Findland [25].
Table 2. Distribution of dissolved organic carbon (mg·L−1) and turbidity (nephelometric turbidity units—NTU) (in brackets) distribution spatially and vertically in Lake Wivenhoe post flood period.
Site (location)SurfaceMid-depthBottom
30004 (upstream)2.782 (29.8)2.498 (40.7)2.622 (191.2)
30017 (upstream)2.624 (68.9)2.312 (67.7)2.248 (212.8)
30053 (middle)2.129 (77.4)3.433 (128.2)2.843 (229)
33140 (middle)2.244 (90.6)1.748 (107.8)2.218 (175.1)
33137 (downstream)2.373 (111.3)2.188 (116.5)2.929 (210.6)

3.2. Optical Analysis

In both UV and fluorescence spectroscopy, incident radiation causes the loosely bound electron present in double or triple bonds and/or in electronegative elements to excite. The absorption of incident radiation is recorded in UV spectroscopy against the wavelength according to the Beer–Lambert Law Water 06 02339 i002, where Io is the incident radiation and I is the radiation after passing through the length of solution. In fluorescence spectroscopy, the energy released by excited species to come to the ground state is also recorded. The specific excitation and emission wavelengths are unique for particular species. Two molecules may have similar excitation energies, but different emission energies.
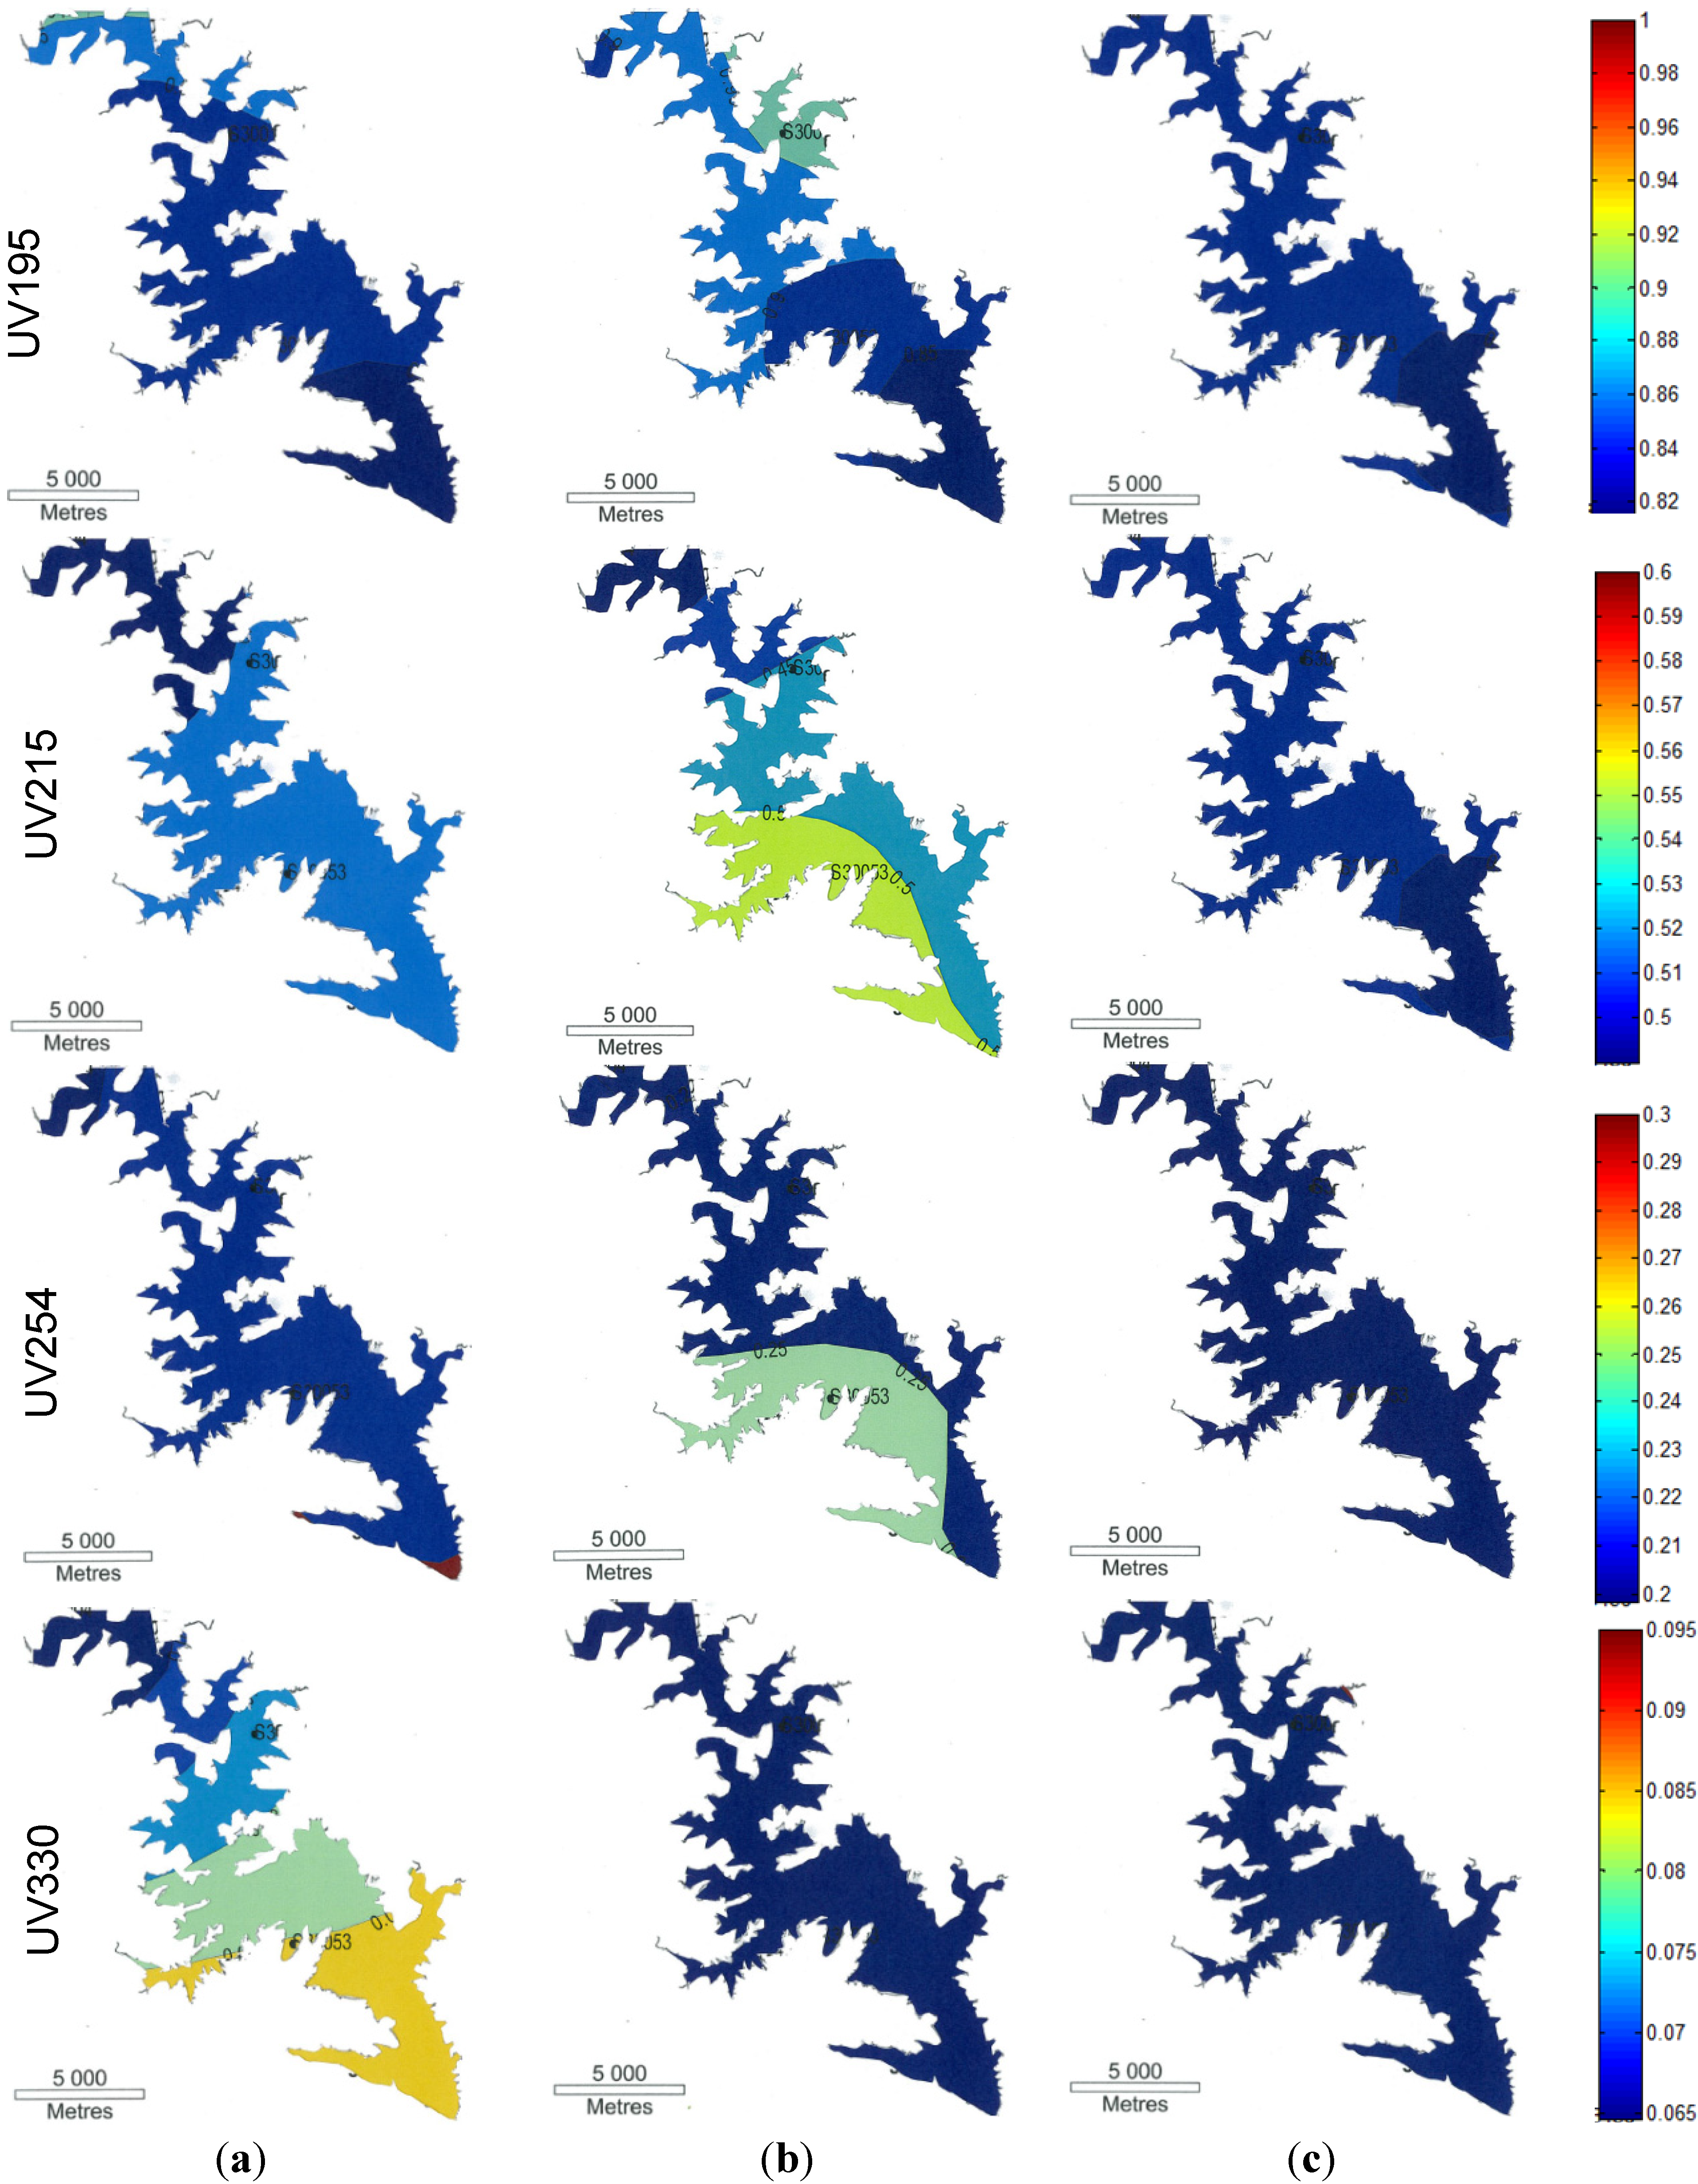
3.2.1. UV Spectra

UV spectroscopy is rapid, simple and requires little sample preparation and small volume samples. Within the absorbance range between 190 and 400 nm, many specific absorbance values are related to a variety of properties, such as aromaticity, hydrophobic content, apparent molecular weight and size and biodegradability [26,27,28]. Table 3 summarises popular wavelengths widely used to measure chemical species in water and wastewater.
Figure 3 shows a contour diagram of the UV spectral intensity of water recorded at various wavelengths (195, 215, 254 and 330 nm) in Lake Wivenhoe samples collected at the surface (Figure 3a), mid-depth (Figure 3b) and bottom (Figure 3c) during the flood period in January, 2011. Colour patterns in the contour diagram reflect the absorbance intensity at particular wavelengths.
Table 3. UV absorbance recorded at various wavelengths used to measure chemical species in water and wastewater. COD = chemical oxygen demand.
Wavelength (nm)PropertyReference
195Proteins[29]
210Amino acids[14,30]
215Peptides[30,31]
230Proteins[32]
254Aromaticity[33]
260Hydrophobic content/COD[16,34]
265Relative abundance of functional group[35]
272Aromaticity[36]
280Hydrophobic carbon index[37]
285Humification index[27]
300Characterisation of humic substances[38]
310–360Mycosporine-like amino acids[39,40,41]
350Apparent molecular size[15]
365Aromaticity, apparent molecular weight[42]
For wavelengths of 195 nm (proteins), 215 nm (amino acids) and 254 nm (aromaticity), similar colour patterns in the contour diagram indicated that the DOM in the surface and bottom waters showed more homogeneity than in the mid-depth water. In the mid-depth region, UV 215 nm and UV 254 nm showed two distinct colour patterns separating the middle regions from the upstream inflows (surface) and downstream outflows (bottom). The middle region of the lake, where the inflows align, has similar organic characteristics, but at the edge of the lake, different organics are evident. Two possible reasons are proposed: turbid flood runoff being stored in the middle of the reservoir and preferential pathways of stormwater passing through the lake when flowing from upstream to downstream. This is supported by higher DOC and higher turbidity in the middle of the lake at Site 30053. Similar results (higher DOC and turbidity) have been observed by Kim et al. (2000) in a deep reservoir at Lake Soyang, Korea [43] when stormwater flooded into the reservoir.
The UV 330 nm wavelength represents mycosporine-like amino acids (MAAs) [39,40]. MAAs are small colourless water soluble compounds composed of cyclohexane or cyclohexenimine chromophore conjugated with nitrogen substituents of amino acids or imino alcohol [44,45] and are very susceptible to photodegradation [41,46]. On the surface, various colour bands were observed in the contour diagram from the upstream inflows to the downstream outflows, but these were not evident in the mid-depth and bottom regions. The results indicate that for the inflows, photodegradation occurred over time in the surface region.
Figure 3. Contour diagram of the UV spectral intensity of flood water recorded at wavelengths 195, 215, 254 and 330 nm collected at the surface (a), mid-depth (b) and bottom (c) of Lake Wivenhoe (colours indicate the absorbance intensity).
Water 06 02339 g003

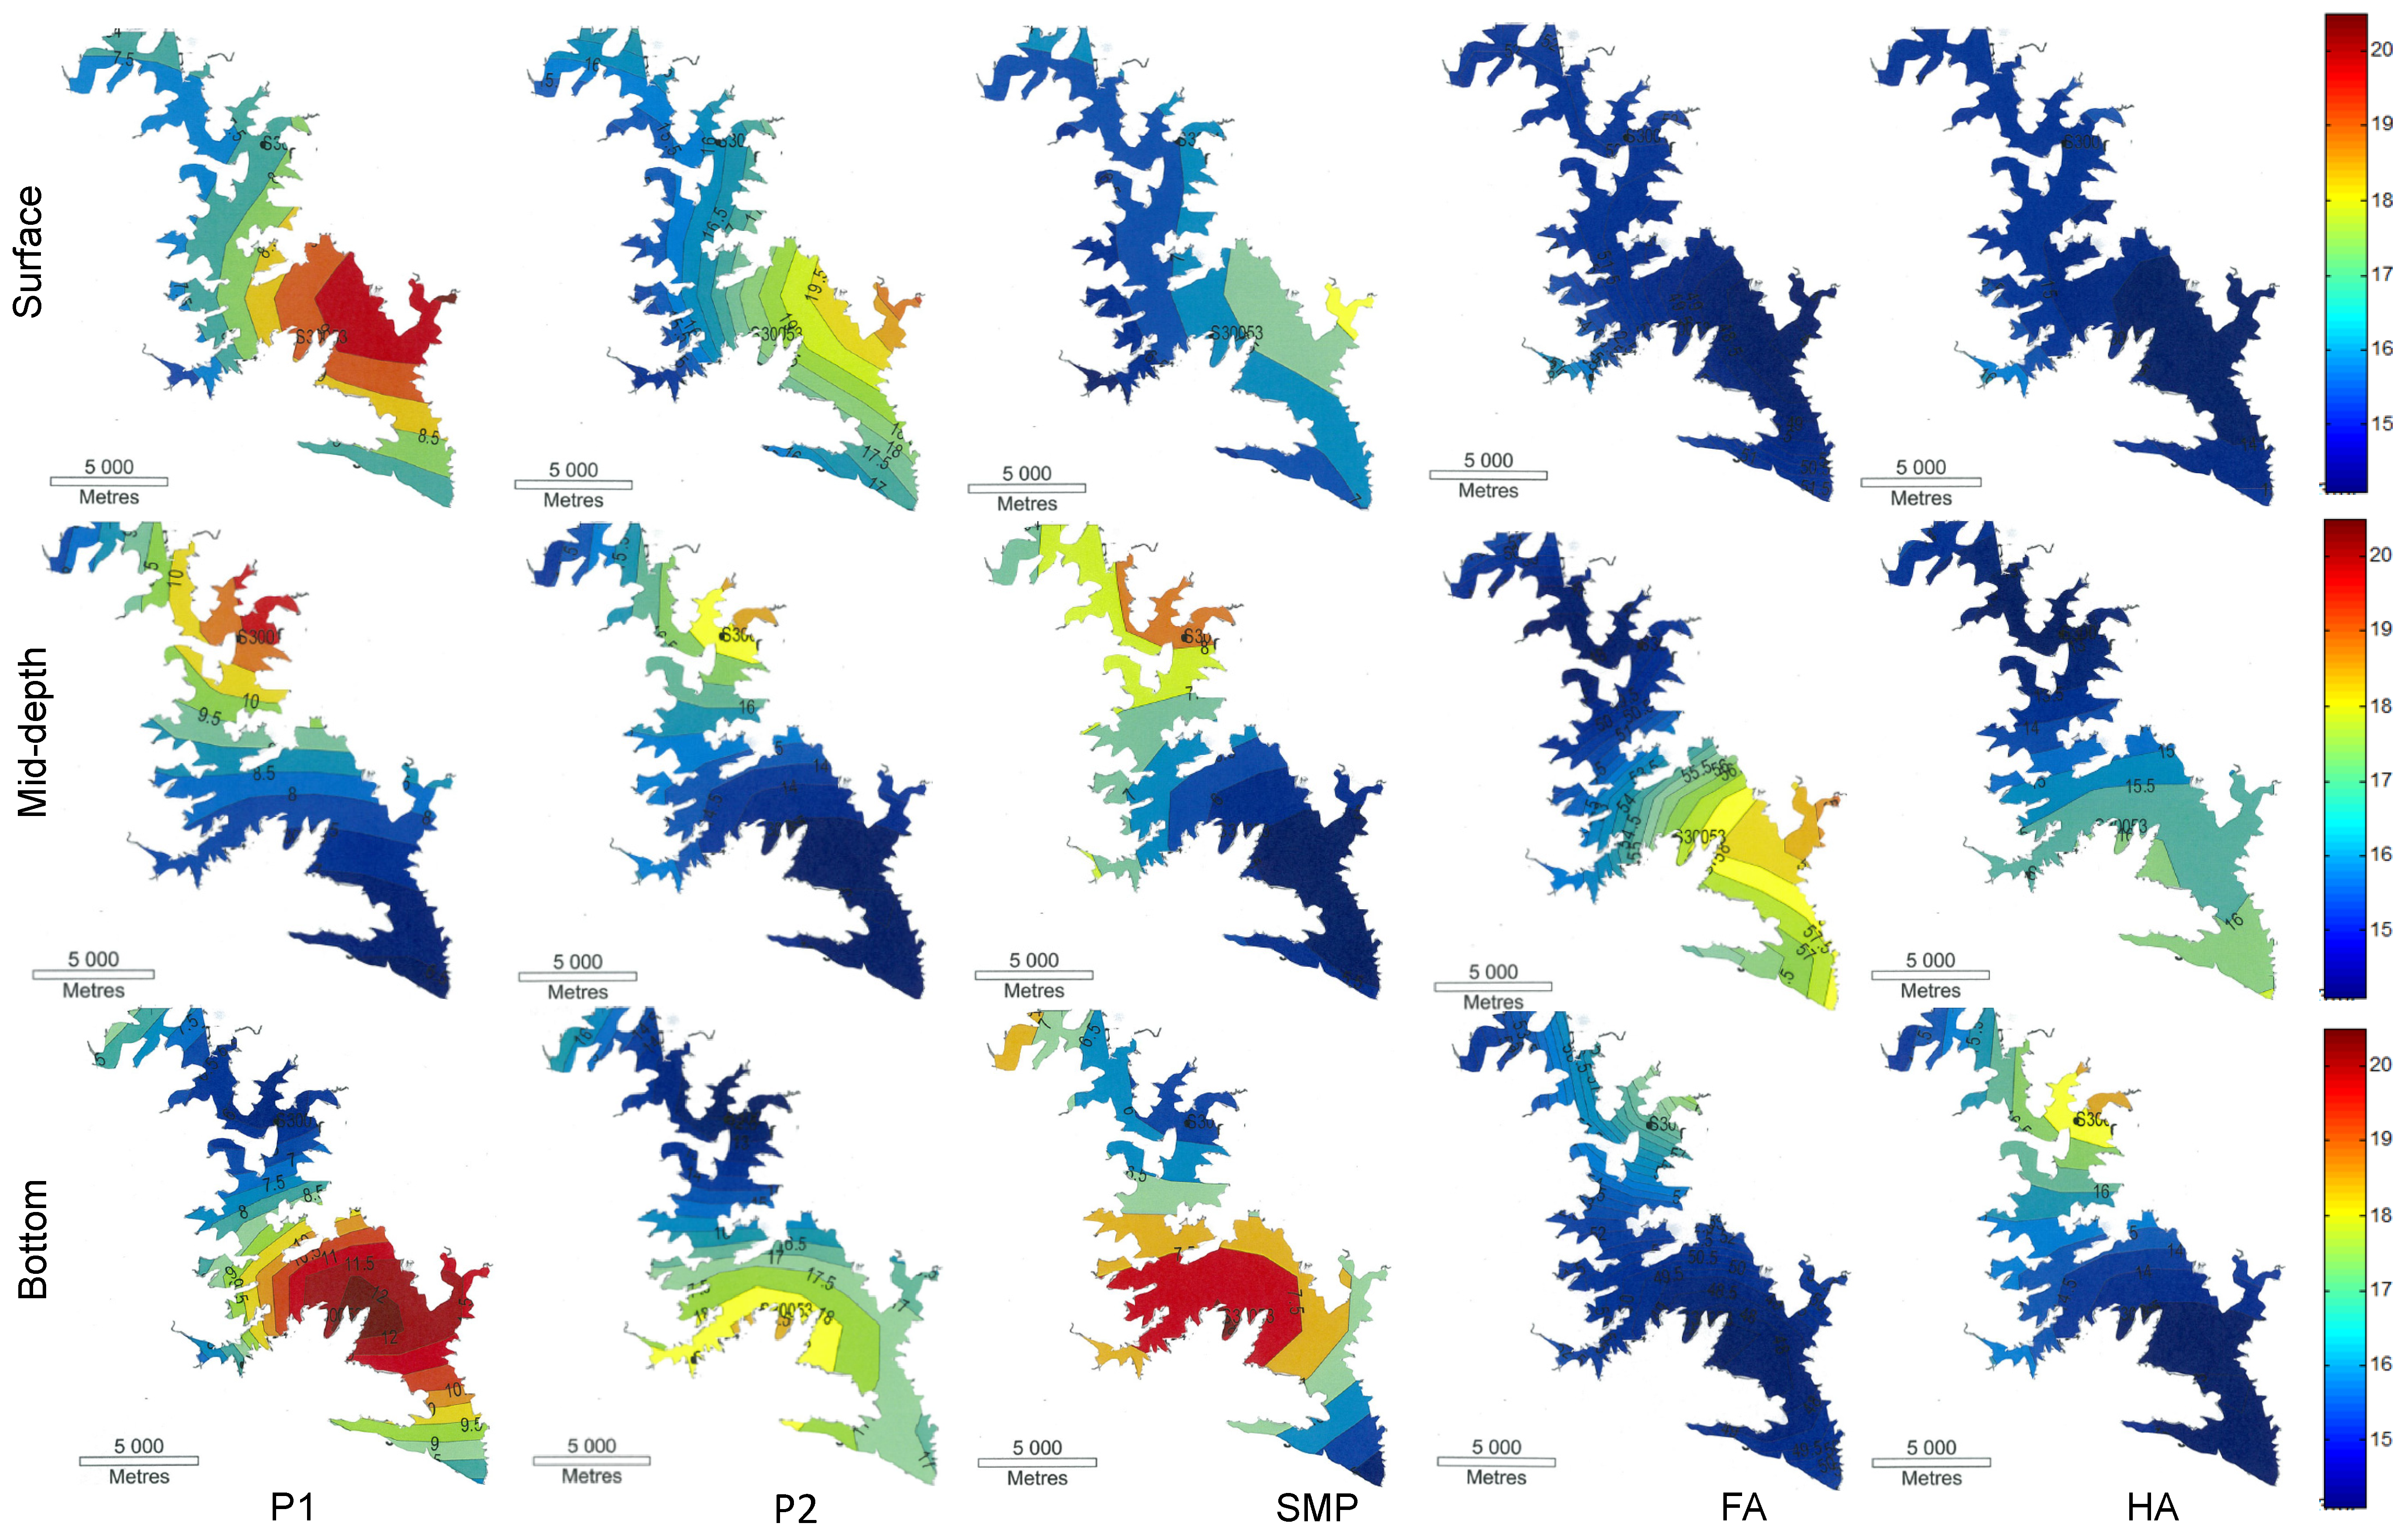
3.2.2. Fluorescence Spectra

Unlike UV, fluorescence spectra provide both excitation and emission information simultaneously, which can distinguish two chemical species from each other that have similar excitation energies. The fluorescence spectra provide information on different types of organics [47]. There are a number of different methods for interpreting fluorescence data, from selective peak picking [48,49] to complex modelling, such as parallel factor analysis [50,51]. One of the commonly adopted methods is to calculate the area of peak of specific region of the spectrum proposed by (Chen et al., 2003) [23]. In this paper, the EEM spectrum was divided into five regions, and the area of the peak was calculated using “R” software, following the equations described previously [23]. According to Chen et al.(2003) [23], Regions I (P1) and II (P2) represent aromatic proteins, Region III represents soluble microbial by-product-like (SMP) substances, Region IV represents fulvic acid-like (FA) substances and Region V represents humic acid-like (HA) substances. Table 1 summarises the representative chemicals in the EEM spectra in the five excitation:emission regions selected for this study.
Figure 4 shows a contour diagram of the five chemical species P1 to HA at three depths. The colour patterns represent fluorescence intensity (or relative concentration) of specific groups of chemicals in the lake, as shown in the legend (far right). Among the five groups of chemicals measured on the surface, P1, P2 and SMP seem to be influenced by the flow pattern, as shown by a preferential flow route for these species. In contrast, the spillover of FA and HA were not affected by the flow. At the mid-depth, we observed a relative decrease in the concentration of P1, P2 and SMP with flow from upstream, but this is not the case with FA and HA. This result indicates the removal of P1, P2 and SMP by sedimentation (binding with particles) and/or by chemical conversion to other organics. We also observed higher fluorescence intensities for P1, P2 and SMP substances in the middle region of the bottom of the lake. The increased microbial activity observed in the middle region of the surface of the water shows possible stagnation of the flow in this region. At the bottom of the lake, sediment particle settling provides increased surface area for microbial colonization, thus allowing increased rates of activity in these waters. According to Kim et al. (2000) [43] , the carbon and nutrients held in the middle region of turbid water become a good source of food for various bacteria.

4. Conclusions

Lake Wivenhoe is the primary supply water for the city of Brisbane, and it is essential to understand the impact of flood events on water quality in order to fully understand catchment loadings into the system, as well as possible implications for water treatment. The DOC concentration varied spatially and vertically, indicating that the inflow of DOM in the lake varied with space, as well as depth. The UV and fluorescence spectral techniques used in this study showed that organic species were distributed heterogeneously across the lake, both spatially and vertically, and information on specific chemicals or groups of chemicals can be obtained easily. These findings demonstrate the feasibility of optical spectroscopy techniques for understanding the impacts of catchment inflows on DOM species across the lake, and the findings will be highly beneficial for both water treatment and asset management.
Figure 4. Contour diagrams of the fluorescence spectral intensity of flood water for the surface, mid-depth and bottom of water across the lake based on the fluorescence area of each region (colours represent fluorescence intensity).
Water 06 02339 g004

Acknowledgments

The authors wish to thank Seqwater for logistical and financial support and, in particular, Deb Gale and Cameron Veal for their assistance in sample collection.

Author Contributions

The experimental design of the project was undertaken by Rupak Aryal and Alistair Grinham. The majority of field work was conducted by Alistair Grinham. Rupak Aryal, conducted chemical analysis with the help of coauthors Alistair Grinhama and Simon Beecham. All three authors involved equally in interpreting the data and writing this manuscript.

Conflicts of Interest

The authors declare no conflict of interest.

References

  1. Grinham, A.; Gibbes, B.; Gale, D.; Watkinson, A.; Bartkow, M. Extreme rainfall and drinking water quality: A regional perspective. Proc. Water Pollut. 2012, 164, 183–194. [Google Scholar]
  2. Zafiriou, O.C.; Joussot-Dubien, J.; Zepp, R.G.; Zika, R.G. Photochemistry of natural waters. Environ. Sci. Technol. 1984, 18, 358A–371A. [Google Scholar]
  3. Mostofa, K.M.; Wu, F.; Liu, C.-Q.; Vione, D.; Yoshioka, T.; Sakugawa, H.; Tanoue, E. Photochemical, microbial and metal complexation behavior of fluorescent dissolved organic matter in the aquatic environments. Geochem. J. 2011, 45, 235–254. [Google Scholar] [CrossRef]
  4. Davis, J.A. Complexation of trace metals by adsorbed natural organic matter. Geochim. Cosmochim. Acta 1984, 48, 679–691. [Google Scholar] [CrossRef]
  5. Tranvik, L.; Kokalj, S. Decreased biodegradability of algal DOC due to interactive effects of UV radiation and humic matter. Aquat. Microb. Ecol. 1998, 14, 301–307. [Google Scholar] [CrossRef]
  6. Jansson, M.; Bergström, A.-K.; Blomqvist, P.; Drakare, S. Allochthonous organic carbon and phytoplankton/bacterioplankton production relationships in lakes. Ecology 2000, 81, 3250–3255. [Google Scholar] [CrossRef]
  7. McKnight, D.M.; Smith, R.L.; Harnish, R.A.; Miller, C.L.; Bencala, K.E. Seasonal relationships between planktonic microorganisms and dissolved organic material in an alpine stream. Biogeochemistry 1993, 21, 39–59. [Google Scholar] [CrossRef]
  8. Stone, L.; Berman, T. Positive feedback in aquatic ecosystems: The case of the microbial loop. Bull. Math. Biol. 1993, 55, 919–936. [Google Scholar] [CrossRef]
  9. Schindler, D.; Bayley, S.; Curtis, P.; Parker, B.; Stainton, M.; Kelly, C. Natural and man-caused factors affecting the abundance and cycling of dissolved organic substances in precambrian shield lakes. Hydrobiologia 1992, 229, 1–21. [Google Scholar] [CrossRef]
  10. McKnight, D.; Thurman, E.M.; Wershaw, R.L.; Hemond, H. Biogeochemistry of Aquatic Humic Substances in Thoreau’s Bog, Concord, Massachusetts. Ecology 1985, 66, 1339–1352. [Google Scholar] [CrossRef]
  11. Qualls, R.G.; Richardson, C.J. Factors controlling concentration, export, and decomposition of dissolved organic nutrients in the Everglades of Florida. Biogeochemistry 2003, 62, 197–229. [Google Scholar] [CrossRef]
  12. Mladenov, N.; McKnight, D.M.; Wolski, P.; Ramberg, L. Effects of annual flooding on dissolved organic carbon dynamics within a pristine wetland, the Okavango Delta, Botswana. Wetlands 2005, 25, 622–638. [Google Scholar] [CrossRef]
  13. GHOSH, K.; Schnitzer, M. UV and visible absorption spectroscopic investigations in relation to macromolecular characteristics of humic substances. J. Soil Sci. 1979, 30, 735–745. [Google Scholar] [CrossRef]
  14. Aitken, A.; Learmonth, M. The Protein Protocols Handbook 1996; Springer: New York, NY, USA, 1996; pp. 3–6. [Google Scholar]
  15. Korshin, G.V.; Li, C.-W.; Benjamin, M.M. Monitoring the properties of natural organic matter through UV spectroscopy: A consistent theory. Water Res. 1997, 31, 1787–1795. [Google Scholar] [CrossRef]
  16. Dilling, J.; Kaiser, K. Estimation of the hydrophobic fraction of dissolved organic matter in water samples using UV photometry. Water Res. 2002, 36, 5037–5044. [Google Scholar] [CrossRef]
  17. Roig, B.; Thomas, O. UV spectrophotometry: A powerful tool for environmental measurement. Manag. Environ. Qual. 2003, 14, 398–404. [Google Scholar]
  18. Aryal, R.; Kandel, D.; Acharya, D.; Chong, M.N.; Beecham, S. Unusual Sydney dust storm and its mineralogical and organic characteristics. Environ. Chem. 2012, 9, 537–546. [Google Scholar] [CrossRef]
  19. Hong, S.; Aryal, R.; Vigneswaran, S.; Johir, M.A.H.; Kandasamy, J. Influence of hydraulic retention time on the nature of foulant organics in a high rate membrane bioreactor. Desalination 2012, 287, 116–122. [Google Scholar] [CrossRef]
  20. Hussain, S.; van Leeuwen, J.; Chow, C.; Beecham, S.; Kamruzzaman, M.; Wang, D.; Drikas, M.; Aryal, R. Removal of organic contaminants from river and reservoir waters by three different aluminum-based metal salts: Coagulation adsorption and kinetics studies. Chem. Eng. J. 2013, 225, 394–405. [Google Scholar] [CrossRef]
  21. Huber, S.A.; Balz, A.; Abert, M.; Pronk, W. Characterisation of aquatic humic and non-humic matter with size-exclusion chromatography—Organic carbon detection—Organic nitrogen detection (LC-OCD-OND). Water Res. 2011, 45, 879–885. [Google Scholar] [CrossRef]
  22. Aryal, R.K.; Murakami, M.; Furumai, H.; Nakajima, F.; Jinadasa, H.K.P.K. Prolonged deposition of heavy metals in infiltration facilities and its possible threat to groundwater contamination. Water Sci. Technol. 2006, 54, 205–212. [Google Scholar] [CrossRef]
  23. Chen, W.; Westerhoff, P.; Leenheer, J.A.; Booksh, K. Fluorescence excitation-emission matrix regional integration to quantify spectra for dissolved organic matter. Environ. Sci. Technol. 2003, 37, 5701–5710. [Google Scholar] [CrossRef]
  24. Moran, M.A.; Sheldon, W.M., Jr.; Zepp, R.G. Carbon loss and optical property changes during long-term photochemical and biological degradation of estuarine dissolved organic matter. Limnol. Oceanogr. 2000, 45, 1254–1264. [Google Scholar] [CrossRef]
  25. Salonen, K.; Vähätalo, A. Photochemical mineralisation of dissolved organic matter in lake Skjervatjern. Environ. Int. 1994, 20, 307–312. [Google Scholar] [CrossRef]
  26. Ma, H.; Allen, H.E.; Yin, Y. Characterization of isolated fractions of dissolved organic matter from natural waters and a wastewater effluent. Water Res. 2001, 35, 985–996. [Google Scholar] [CrossRef]
  27. Kalbitz, K.; Geyer, S.; Geyer, W. A comparative characterization of dissolved organic matter by means of original aqueous samples and isolated humic substances. Chemosphere 2000, 40, 1305–1312. [Google Scholar] [CrossRef]
  28. Imai, A.; Fukushima, T.; Matsushige, K.; Kim, Y.H. Fractionation and characterization of dissolved organic matter in a shallow eutrophic lake, its inflowing rivers, and other organic matter sources. Water Res. 2001, 35, 4019–4028. [Google Scholar] [CrossRef]
  29. Yabushita, S.; Wada, K.; Inagaki, T.; Arakawa, E. UV and vacuum UV spectra of organic extract from Yamato carbonaceous chondrites. Mon. Not. R. Astron. Soc. 1987, 229, 45P–48P. [Google Scholar] [CrossRef]
  30. Aryal, R.; Vigneswaran, S.; Kandasamy, J. Application of Ultraviolet (UV) spectrophotometry in the assessment of membrane bioreactor performance for monitoring water and wastewater treatment. Appl. Spectrosc. 2011, 65, 227–232. [Google Scholar] [CrossRef]
  31. Kuipers, B.J.; Gruppen, H. Prediction of molar extinction coefficients of proteins and peptides using UV absorption of the constituent amino acids at 214 nm to enable quantitative reverse phase high-performance liquid chromatography-mass spectrometry analysis. J. Agric. Food Chem. 2007, 55, 5445–5451. [Google Scholar] [CrossRef]
  32. Liu, P.-F.; Avramova, L.V.; Park, C. Revisiting absorbance at 230 nm as a protein unfolding probe. Anal. Biochem. 2009, 389, 165–170. [Google Scholar] [CrossRef]
  33. Hur, J.; Schlautman, M.A. Using selected operational descriptors to examine the heterogeneity within a bulk humic substance. Environ. Sci. Technol. 2003, 37, 880–887. [Google Scholar] [CrossRef]
  34. Chevakidagarn, P. Surrogate parameters for rapid monitoring of contaminant removal for activated sludge treatment plants for para rubber and seafood industries in Southern Thailand. J. Songklanakarin. 2005, 27, 417–424. [Google Scholar]
  35. Chen, J.; Gu, B.; LeBoeuf, E.J.; Pan, H.; Dai, S. Spectroscopic characterization of the structural and functional properties of natural organic matter fractions. Chemosphere 2002, 48, 59–68. [Google Scholar] [CrossRef]
  36. Traina, S.J.; Novak, J.; Smeck, N.E. An ultraviolet absorbance method of estimating the percent aromatic carbon content of humic acids. J. Environ. Qual. 1990, 19, 151–153. [Google Scholar] [CrossRef]
  37. Chin, Y.-P.; Aiken, G.; O’Loughlin, E. Molecular weight, polydispersity, and spectroscopic properties of aquatic humic substances. Environ. Sci. Technol. 1994, 28, 1853–1858. [Google Scholar] [CrossRef]
  38. Artinger, R.; Buckau, G.; Geyer, S.; Fritz, P.; Wolf, M.; Kim, J. Characterization of groundwater humic substances: Influence of sedimentary organic carbon. Appl. Geochem. 2000, 15, 97–116. [Google Scholar] [CrossRef]
  39. Dionisio-Sese, M.L. Aquatic microalgae as potential sources of UV-screening compounds. Philipp. J. Sci. 2010, 139, 5–16. [Google Scholar]
  40. Winter, A.R.; Fish, T.A.E.; Playle, R.C.; Smith, D.S.; Curtis, P.J. Photodegradation of natural organic matter from diverse freshwater sources. Aquat. Toxicol. 2007, 84, 215–222. [Google Scholar] [CrossRef]
  41. Whitehead, K.; Vernet, M. Influence of mycosporine-like amino acids (MAAs) on UV absorption by particulate and dissolved organic matter in La Jolla Bay. Limnol. Oceanogr. 2000, 45, 1788–1796. [Google Scholar] [CrossRef]
  42. Peuravuori, J.; Pihlaja, K. Molecular size distribution and spectroscopic properties of aquatic humic substances. Anal. Chim. Acta 1997, 337, 133–149. [Google Scholar] [CrossRef]
  43. Kim, B.; Choi, K.; Kim, C.; Lee, U.H.; Kim, Y.-H. Effects of the summer monsoon on the distribution and loading of organic carbon in a deep reservoir, Lake Soyang, Korea. Water Res. 2000, 34, 3495–3504. [Google Scholar] [CrossRef]
  44. Singh, S.P.; Kumari, S.; Rastogi, R.P.; Singh, K.L.; Sinha, R.P. Mycosporine-like amino acids (MAAs): Chemical structure, biosynthesis and significance as UV-absorbing/screening compounds. Indian J. Exp. Biol. 2008, 46, 7–17. [Google Scholar]
  45. Sinha, R.; Klisch, M.; Gröniger, A.; Häder, D.-P. Ultraviolet-absorbing/screening substances in cyanobacteria, phytoplankton and macroalgae. J. Photochem. Photobiol. B 1998, 47, 83–94. [Google Scholar] [CrossRef]
  46. Vincent, W.F.; Roy, S. Solar ultraviolet-B radiation and aquatic primary production: Damage, protection, and recovery. Environ. Rev. 1993, 1, 1–12. [Google Scholar] [CrossRef]
  47. Chong, M.N.; Sidhu, J.; Aryal, R.; Tang, J.; Gernjak, W.; Escher, B.; Toze, S. Urban stormwater harvesting and reuse: A probe into the chemical, toxicology and microbiological contaminants in water quality. Environ. Monit. Assess. 2012, 1–8. [Google Scholar]
  48. Birdwell, J.E.; Engel, A.S. Characterization of dissolved organic matter in cave and spring waters using UV–Vis absorbance and fluorescence spectroscopy. Org. Geochem. 2010, 41, 270–280. [Google Scholar] [CrossRef]
  49. Coble, P.G. Characterization of marine and terrestrial DOM in seawater using excitation-emission matrix spectroscopy. Mar. Chem. 1996, 51, 325–346. [Google Scholar] [CrossRef]
  50. Stedmon, C.A.; Bro, R. Characterizing dissolved organic matter fluorescence with parallel factor analysis: A tutorial. Limnol. Oceanogr. 2008, 6, 572–579. [Google Scholar] [CrossRef]
  51. Stedmon, C.A.; Markager, S.; Bro, R. Tracing dissolved organic matter in aquatic environments using a new approach to fluorescence spectroscopy. Mar. Chem. 2003, 82, 239–254. [Google Scholar] [CrossRef]

