Article

Flood Damage Modeling on the Basis of Urban Structure Mapping Using High-Resolution Remote Sensing Data

1
Section Hydrology, Helmholtz Centre Potsdam—German Research Centre for Geosciences GFZ, Telegrafenberg, Potsdam 14473, Germany
2
Section Remote Sensing, Helmholtz Centre Potsdam—German Research Centre for Geosciences GFZ, Telegrafenberg, Potsdam 14473, Germany
3
Animal Ecology I, University of Bayreuth, Bayreuth 95440, Germany
*
Author to whom correspondence should be addressed.
Water 2014, 6(8), 2367-2393; https://doi.org/10.3390/w6082367
Submission received: 1 April 2014 / Revised: 28 July 2014 / Accepted: 28 July 2014 / Published: 11 August 2014
(This article belongs to the Special Issue Advances in Remote Sensing of Flooding)

Abstract

:
The modeling of flood damage is an important component for risk analyses, which are the basis for risk-oriented flood management, risk mapping, and financial appraisals. An automatic urban structure type mapping approach was applied on a land use/land cover classification generated from multispectral Ikonos data and LiDAR (Light Detection And Ranging) data in order to provide spatially detailed information about the building stock of the case study area of Dresden, Germany. The multi-parameter damage models FLEMOps (Flood Loss Estimation Model for the private sector) and regression-tree models have been adapted to the information derived from remote sensing data and were applied on the basis of the urban structure map. To evaluate this approach, which is suitable for risk analyses, as well as for post-disaster event analyses, an estimation of the flood losses caused by the Elbe flood in 2002 was undertaken. The urban structure mapping approach delivered a map with a good accuracy of 74% and on this basis modeled flood losses for the Elbe flood in 2002 in Dresden were in the same order of magnitude as official damage data. It has been shown that single-family houses suffered significantly higher damages than other urban structure types. Consequently, information on their specific location might significantly improve damage modeling, which indicates a high potential of remote sensing methods to further improve risk assessments.

Graphical Abstract

1. Introduction

Increasing frequency and intensity of floods, as well as a high settlement density and associated concentration of valuable objects in flood-prone areas, are the central causes of increasing economic losses through extreme events [1]. One third of the worldwide registered economic losses caused by natural hazards are related to floods [2]. For example, the large-scale flood event in June 2013 in the Elbe and Danube catchments caused losses in the range of €8 to 12 billion in Germany. A special reconstruction aid fund of €8 billion has been implemented by the federal states and the German federal government (Aufbauhilfegesetz came into effect 19 July 2013). The 2013 flood is comparable in respect of region affected, intensity and damage to the extreme summer flood in 2002 [3], which caused damage of €11.6 billion in Germany [4]. These facts demonstrate the high importance of an effective flood risk management in order to reduce flood risks and associated losses [5]. An integrated risk-based flood management includes not only engineering systems (structural measures), but also precaution (e.g., flood-adapted building construction, risk adapted land use planning, early warning system) and water retention in the catchment (e.g., land use management in upstream basins) [1]. In this context, flood risk is understood as the probability of the occurrence of losses caused by a flood scenario within a certain time, considering the hazard (return period of the flood, extent and inundation depth) and vulnerability (exposure of people and assets to floods and their susceptibility) [6]. Thus, an efficient risk management requires a detailed risk assessment, combining information about the components flood hazard, exposure (e.g., land use and value of elements at risk), and susceptibility of the elements at risk to hydrologic conditions (e.g., depth–damage curves) [7].
However, flood risk assessments are always associated with significant uncertainty. Qi et al. [8] distinguish between aleatory and epistemic uncertainty. The first type refers to the fact that some variables that are involved in flood risk modeling are not constant, but vary spatially or temporally within the study area (e.g., various possible failure scenarios that may occur). The second type of uncertainty results from incomplete knowledge about the system under study with respect to the physical processes and the parameters involved. Merz and Thieken [9] divide the sources of epistemic uncertainty in flood risk analysis into three categories: flood frequency analysis, inundation estimation and damage estimation. The present study is exclusively focused on the damage estimation part, aiming to reduce its uncertainty via improving exposure and susceptibility estimation by utilizing remote sensing.
Recently, remote sensing data has increasingly been used in order to generate land use/land cover classifications. Based on these land use/land cover maps that describe the spatial location of various elements at risk in the flooded area, flood losses are calculated. Often, only coarse land use classes like residential buildings, industry, and agriculture are derived from satellite images and integrated in flood loss modeling [10,11,12].
Since the 1960s, depth-damage functions were used as a common tool in order to assess flood losses [13,14]. They use the element at risk (e.g., residential buildings, industry, agriculture) and the inundation depth as the most determining factors for expected flood damages to estimate absolute or relative losses [11,12,15]. It is based on the assumption that structures of one object type (e.g., residential buildings) have similar depth-damage curves regardless of their actual values [16]. Some studies focus on urban areas, because here largest damages are expected [17,18,19].
However, studies have shown that depth-damage functions are subject to large uncertainties [20]. This can be explained by the fact that damages are determined by various parameters beside the water depth [21]. Other factors, such as flood duration, flow velocity, transport of sediments and pollutants, building type, construction material, precaution measures, and early warning, also significantly influence flood damage. They may be integrated in multi-parameter flood damage models to enhance flood damage estimations [22].
Recently, some multi-parameter models have been developed, for example, a conceptual model in the UK [23], and a multi-variate regression model to estimate losses in private households in Japan [17]. For Germany, the multi-parameter Flood Loss Estimation MOdels (FLEMO) have been developed [24,25]. A multicriteria approach for analyzing flood loss influencing factors and estimating flood losses was developed by Merz et al. [26]. They used tree-based models based on empirical flood damage data in order to investigate the interaction between 28 predictor variables related to hydrological aspects of the flooding situation, damage reduction measures, and building characteristics. According to this study the most important damage-influencing factors are the water depth, floor space of the building, return period, contamination, inundation duration and precautionary measures. These studies demonstrated that the application of multi-parameter models that take several damage influencing factors into account improve the reliability of flood damage modeling, e.g., [26,27]. However, a main challenge in using multi-parameter flood loss models is the data acquisition of the aforementioned parameters, which requires an enormous effort due to their large spatial and temporal variability [28]. An inadequate data basis is a common reason for uncertainties in flood loss estimation. De Moel and Aerts [7] have demonstrated that uncertain input data have a large effect on the accuracy of the damage estimate.
Up to now urban building types have seldom been subdivided in flood loss estimations [29] since detailed city maps are missing or—when they are available—they are often not up-to-date [19]. This gap can be closed by using high-resolution remote sensing data for mapping urban structure types in order to provide up-to-date high-resolution input data for flood loss modeling [29]. The concept of urban structure type maps exists since the 1970s. They divide the urban fabric into open green spaces, infrastructure and building complexes that are characterized by their physical, functional, and energetic attributes. Urban structure types are distinguished in terms of their composition of different objects (buildings, trees, streets, etc.) and surface materials (e.g., roof materials, vegetation types), and their distribution and arrangement within space [30]. Examples for urban structure types are residential buildings (e.g., block developments, high-rise buildings) (Figure 1), industry facilities, transport infrastructure, and green spaces. Traditionally, urban structure maps were derived through interpretation of aerial photographs, but recently diverse classification methods of remotely sensed images are available. Bochow et al. [31,32] developed fuzzy logic models based on land cover information from hyperspectral data and a digital surface model in order to detect urban structure types. This approach was applied for the inner city of Dresden, and later also for the German capital Berlin and the city Padang in Indonesia [31,33]. Other methods for the detection of urban structure types were applied for different cities in Germany by Banzhaf and Höfer [30] and Wurm et al. [34].
Figure 1. Ikonos imagery of the study area Dresden, Germany (projection: WGS 84 – UTM Zone 32N). Photographs of residential building types in Dresden: (a) Buildings of the historic city center; (b) Closed block development; (c) 4-Story villa (so-called “Würfelhäuser”/“Kaffeemühlenhäuser”); (d) Mid-rise dwellings; (e) High-rise building (“Plattenbau”); (f) Singe-family house.
Water 06 02367 g001
This paper examines how valuable information about the spatial distribution of residential building types and their characteristics derived from remote sensing data can be utilized to improve the applicability of multi-parameter flood damage models on the meso-scale. An urban structure mapping approach is used in order to derive automatically the residential building types of Dresden from remote sensing data. The multi-parameter damage model FLEMOps (Flood Loss Estimation Model for the private sector) as well as regression-tree models are adapted to the building stock information derived from remote sensing data and flood losses are calculated on the basis of different residential building types from the urban structure map. The presented approach is innovative due to the unique automatic mapping approach, the detailed building type classification and the novel multi-parameter flood damage models specifically adapted to the detailed remote sensing input. A post analysis of the losses in Dresden caused by the Elbe flood in 2002 was applied in order to evaluate the presented approach, which can also be used for risk analyses.

2. Materials and Methods
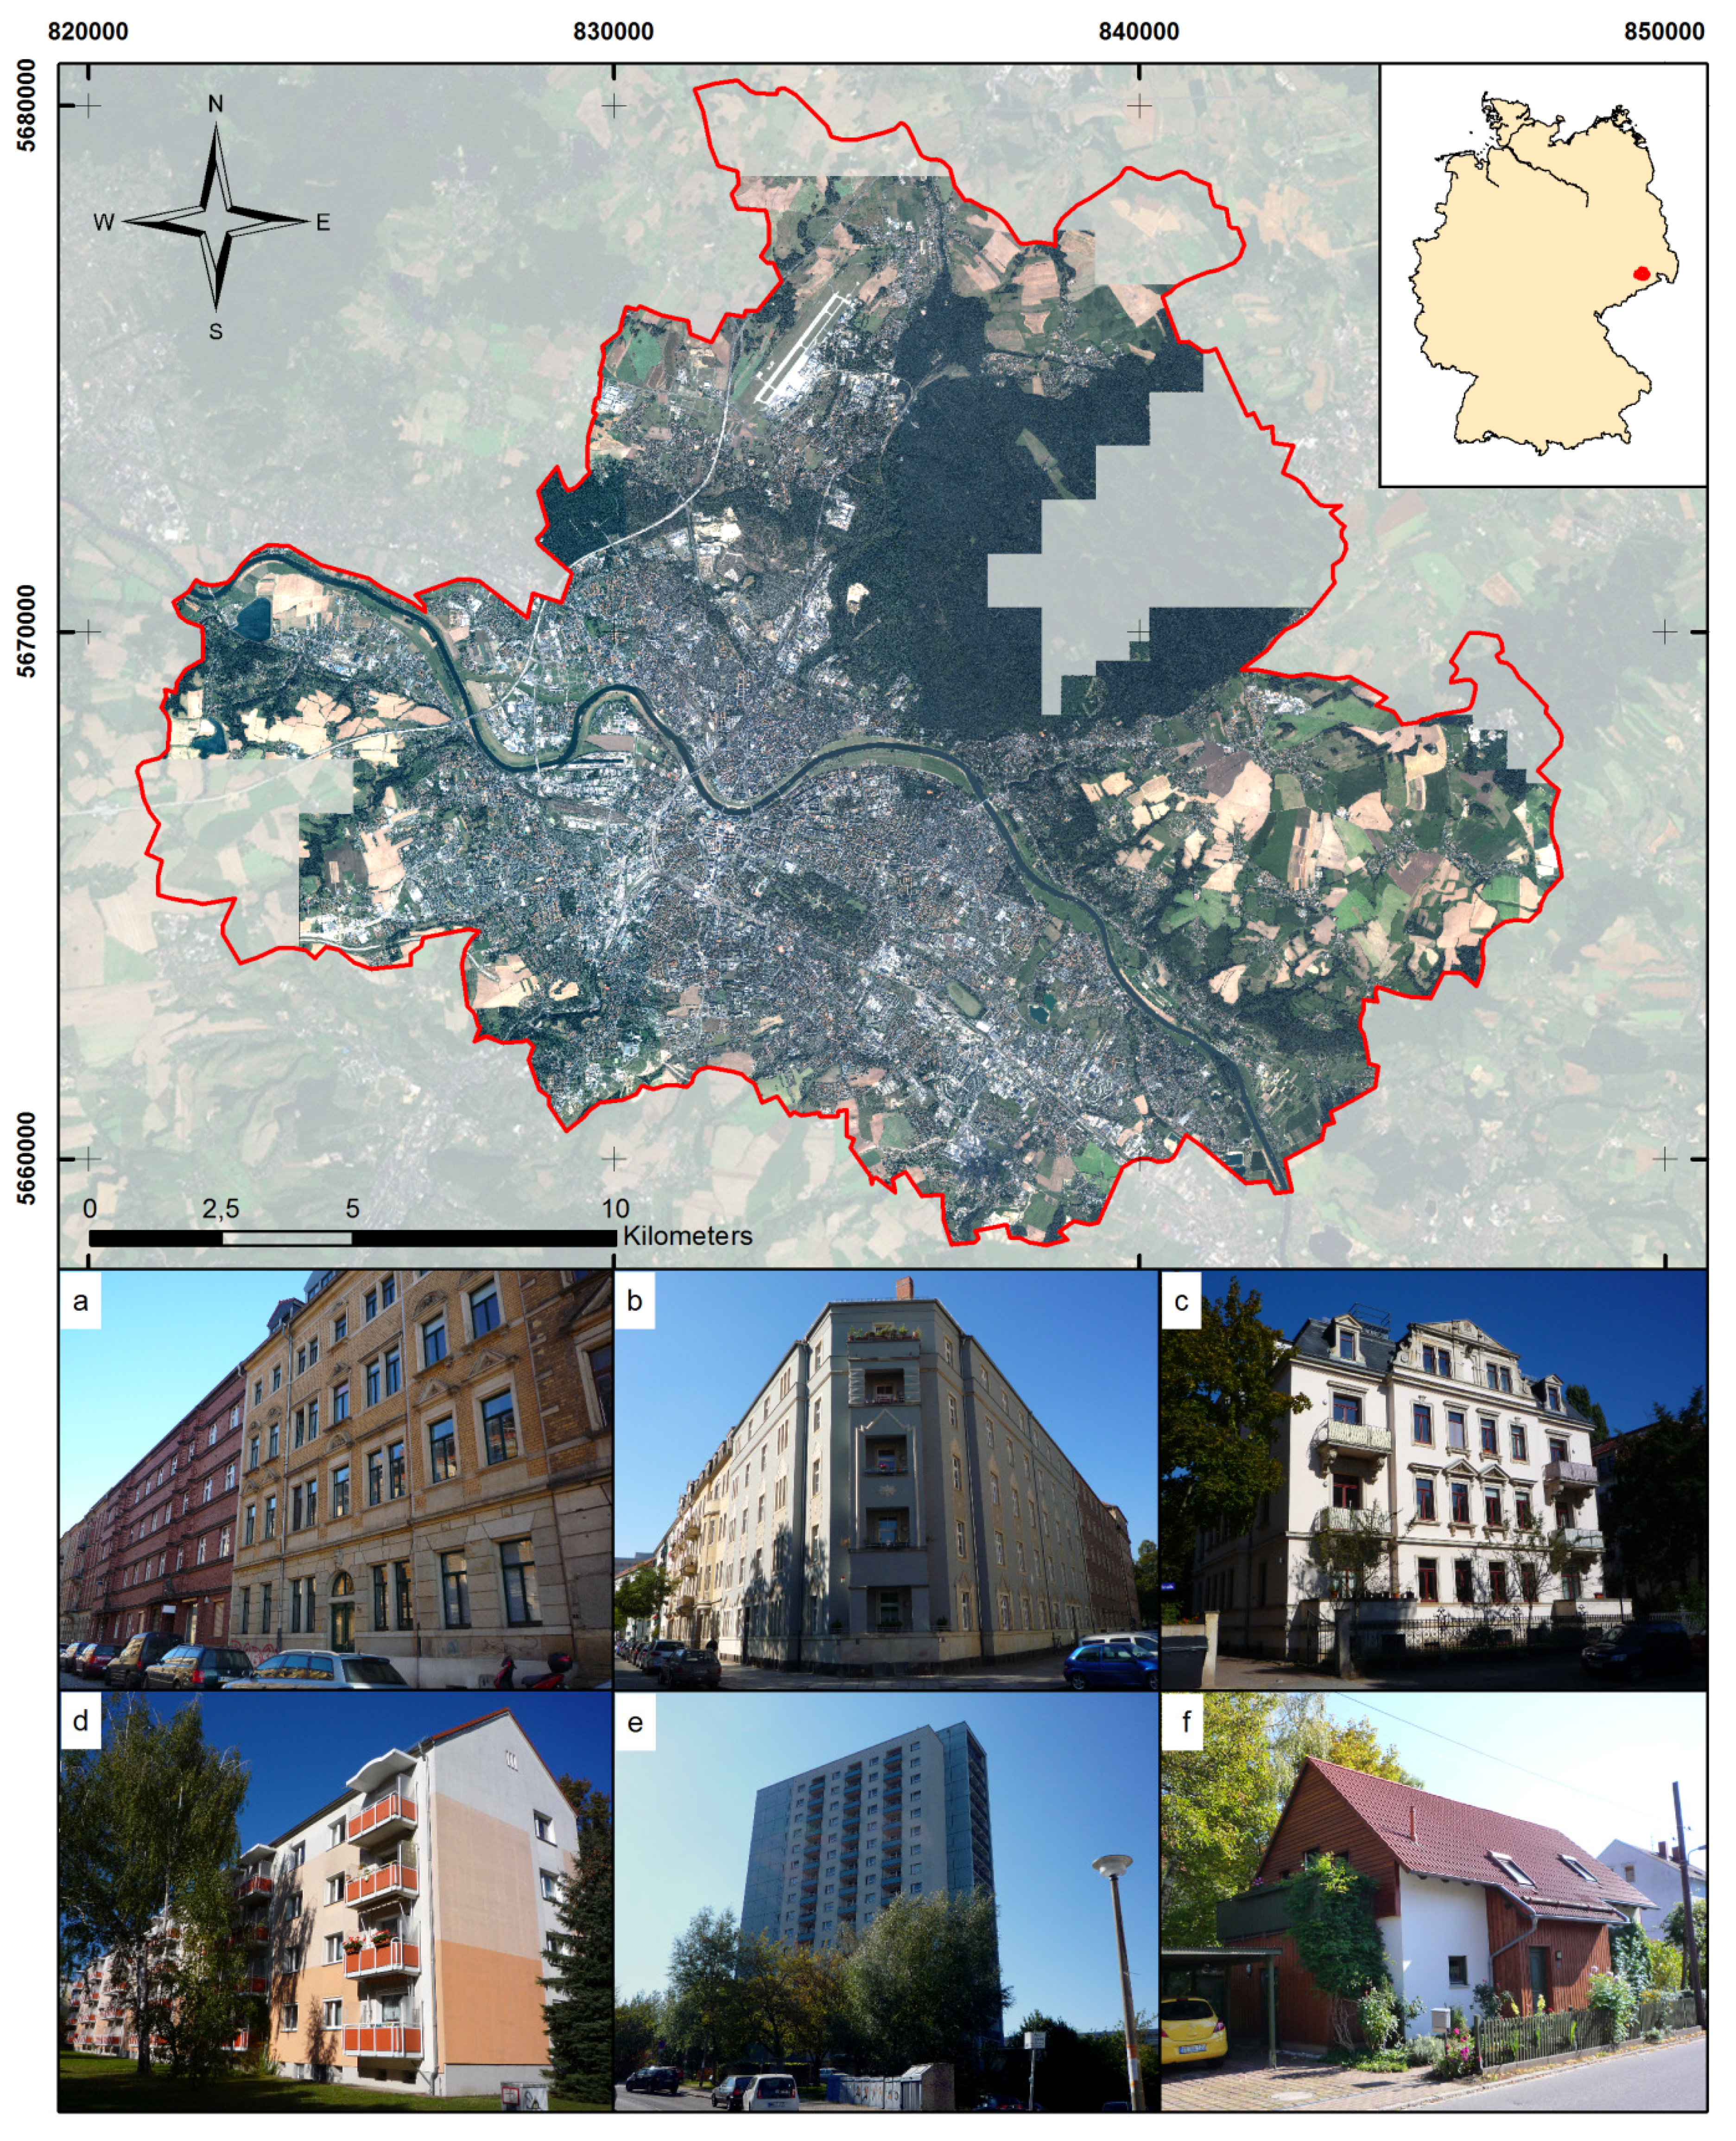
2.1. Study Area

Case study for this research is the Saxon capital Dresden in Germany, located at the river Elbe (Figure 1). The city covers an area of 328 km² and has a population of almost 530,000 inhabitants. About 25% of the total area belongs to built-up area, including buildings and its surrounding open space like gardens. Factories cover an area less than 1%. The area of transportation infrastructure (e.g., streets, railway) makes up 10%, while recreational areas (e.g., parks, sport fields) amount to 4%. The largest areas are represented by farmland (33%) and forests (22%). Water surfaces cover 2% of the total area of Dresden. Less than 2% belong to other uses [35].
The historic development of Dresden is reflected by its current architectural structure. Large parts of the inner city were destroyed through the bombardment of Dresden during the Second World War in 1945. Furthermore, old structures had been deconstructed in the post-war period and during the era of the German Democratic Republic. Instead, closed residential districts were constructed in the 1950s, followed by open constructions in the 1960s. Representative buildings of the mid-1970s were prefabricated houses with 10 to 17-storys, the so-called Plattenbauten. The reconstruction of some historical buildings and monuments did occur as of the 1980/90s [36]. Thus, the city is recently characterized by a densely built-up city core with historical buildings as well as modern multi-story buildings with a high administrative and commercial function. In neighboring districts settlement areas with multi-story residential buildings (e.g., block- perimeter block development, mid-rise dwellings, high-rise buildings) and one-to-three-story open developments (detached, semi-detached, terraced houses) are typical (Figure 1a–f). Descriptions of urban structures can be found in [37].
In August 2002, Dresden was heavily affected by the flood of the river Elbe and its tributaries Weißeritz and Lockwitzbach, which discharge into the River Elbe within the city area of Dresden. The Elbe is the fourth largest river of Central Europe, according to its total length of 1094.3 km and a catchment size of about 148,268 km² [38]. The low-pressure system “Ilse”, a Vb weather system, resulted in an extreme amount of rainfall in Southern Saxony and Northern Czech Republic and, thus, led to an enormous raise of discharges in the Elbe catchment. At the gauging station Dresden discharges of about 4580 m³/s and a water level of 9.40 m were recorded, which had a return period of 150–200 years. The flood of the Weißeritz, with a discharge of 430 m3 s−1, had a return period of 400–500 years. The flood of the Elbe and its tributaries Lockwitzbach and Vereinigte Weißeritz caused a great deal of damages in Dresden [38]. In total about 15% of the city was flooded [39], i.e., 1.04 km² of residential area and 8.11 km² of industrial area were inundated in Dresden (data of inundation areas of [40] and [41]). Damage to residential buildings amounted to €240 to 304 million [42,43]. Companies have suffered damages amounting to €467 million [44], whereas damages to the municipal infrastructure are estimated at €357 million [45].

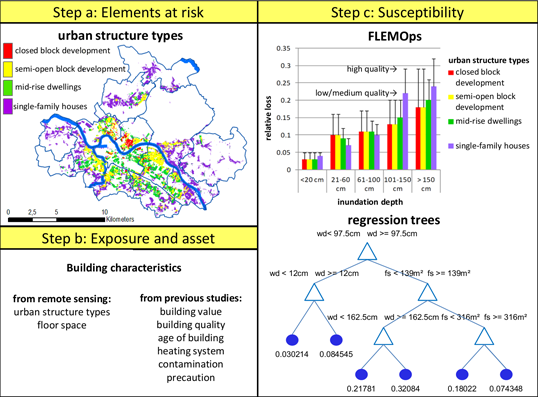
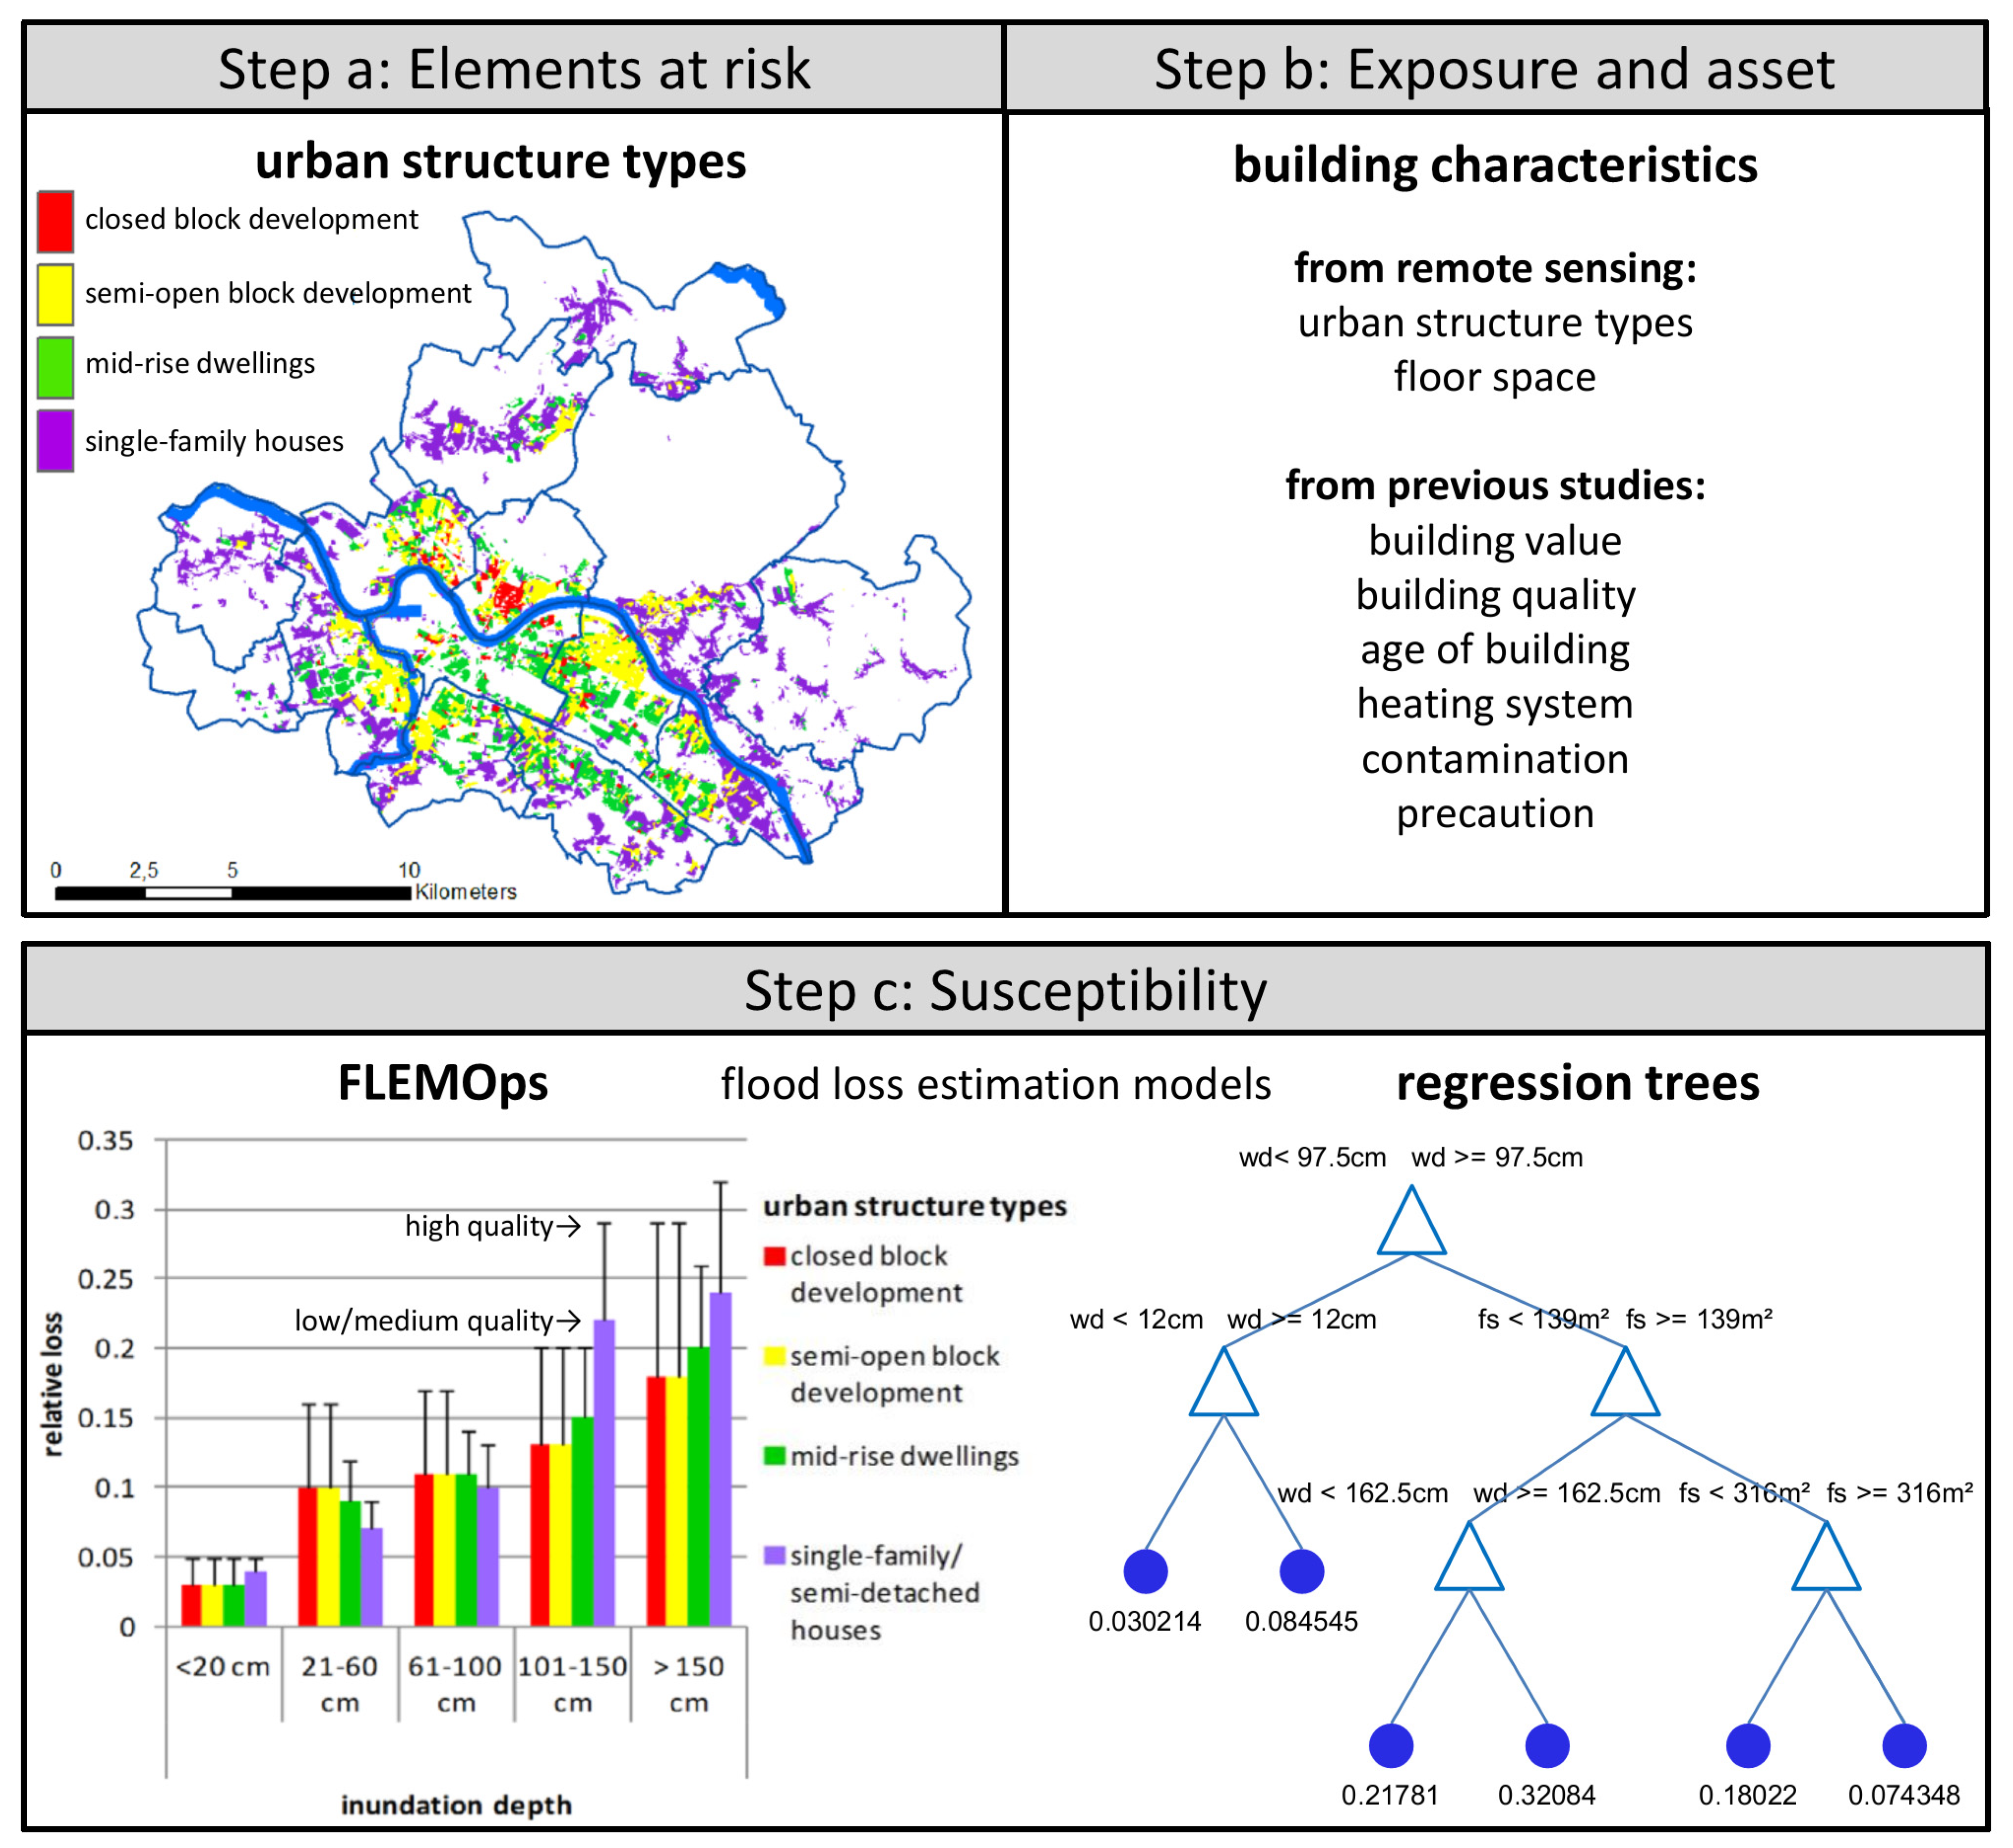
2.2. Flood Damage Modeling Approach

Following Merz et al. [46], a three-step procedure is used for flood loss assessment:
a)
Classification of elements at risk by pooling them into homogeneous classes;
b)
Exposure analysis and asset assessment by describing the number and type of elements at risk and by estimating their asset value; and
c)
Susceptibility analysis by relating the relative damage of the elements at risk to the flood impact.
Remote sensing data is used in various ways throughout this procedure whereas an urban structure map derived from high-resolution images (Subsection 2.3) is of key importance for the presented approach. In step (a), the automatically developed urban structure map provides the classes into which the elements at risk are categorized (Subsection 2.4). In this study only residential buildings are taken into account. In step (b); detailed building characteristics empirically obtained from telephone interviews are linked with the spatially continuous urban structure map that is established on the level of the urban structure types (Subsection 2.5). Finally, in step (c); flood losses related to inundation (scenarios) are estimated based on the previous steps using an adapted version of FLEMOps and regression trees (Subsection 2.6) (Figure 2). The various data sets and processing steps used in the case study application, i.e., the Elbe flood in 2002 in the city of Dresden are described in detail in the following subsections.

2.3. Input Data and Preprocessing

Table 1 contains information about the input data used in the urban structure mapping approach (Subsection 2.4.) and flood loss estimation (Subsection 2.5. and Subsection 2.6.). The pan-sharpened multispectral Ikonos Geo Ortho Kit images were first atmospherically corrected using ground spectra and an empirical line correction, then orthorectified and mosaicked using the Leica Photogrammetry Suite and finally used for a land use/land cover (LULC) classification comprising the classes water, vegetation, soil, traffic, different roofing colors, sport fields, and shadow. Additionally, height information from LiDAR data of 2002 was used to re-classify pixels according to their object height in order to enhance the classification result. The object heights were derived by normalization of the digital surface model by subtracting a digital terrain model.
Figure 2. Three step procedure of flood loss assessment. Step (a) classification of elements at risk by pooling them into homogeneous classes; step (b) exposure analysis and asset assessment by describing the number and type of elements at risk and by estimating their asset value; and step (c) susceptibility analysis using FLEMOps and regression tree models. Input data that are used in the three processing steps are listed in Table 1.
Water 06 02367 g002
Two official vector datasets were used. Basic mapping units for the urban structure mapping approach as well as for map generation of the results of the flood loss modeling were extracted from the digital basis landscape model (basis-DLM) from the Official Topographic Cartographic Information System ATKIS (German: Amtliche Topographisch-Kartographische Informations system). Training information for the urban structure classifier was acquired from the official urban structure map of Dresden from 2007, provided by the Environmental Office of Dresden (Umweltamt Dresden). This map was not directly used in the developed approach since it was generated by visual interpretation of IRS-1 C satellite images and one of the aims of this study is to develop highly automated processing chains that can be applied also for cities where no official urban structure map exists. In such a case only about 50 buildings blocks have to be selected manually as training data for the urban structure classifier.
For flood loss estimation the following important damage influencing parameters were identified (see Subsection 2.5) and are thus required as input data on an area wide basis: water depth, contamination, and building characteristics (floor space, building quality, age of building, heating system, precaution measures). This study uses the maximum flood extent and water depth of the Elbe flood in 2002 that is provided by the Landeshauptstadt Dresden as a raster dataset [47]. Data regarding the precaution measures and the flood damage influencing factor contamination was taken from [48]. Information about the building types and their size, i.e., floor space, is generated in this study by the urban structure mapping approach. Various building characteristics (e.g., age, heating system) were obtained from telephone interviews that have been conducted after the flood events in 2002, 2005, and 2006 [45,46]. A total of about 2700 telephone interviews were carried out, of which 800 originate from Dresden. Detailed descriptions of the questionnaire can be found in [49]. Information on building qualities are provided by INFAS GEOdaten [50]. Originally, this data set consists of six classes from very simple to an exclusive quality. Based on this data, Thieken et al. [51] calculated the mean building quality for each ATKIS building block, divided it into two quality classes and converted the vector data in raster format with a spatial resolution of 10 m. Since relative damage models are used, building values are also necessary to estimate flood losses in monetary terms. Asset values of residential buildings for all municipalities of Germany for the reference year 2000 are available from [52]. Its spatial localization within Dresden was implemented by Kreibich et al. [53] using a binary distribution based on ATKIS building blocks and INFAS GEOdaten. The generated raster data with a resolution of 10 m contains the building values that are given in Euro per square meter. In order to adjust these values to the reference year 2002 a construction price index of 0.999 was used [54].

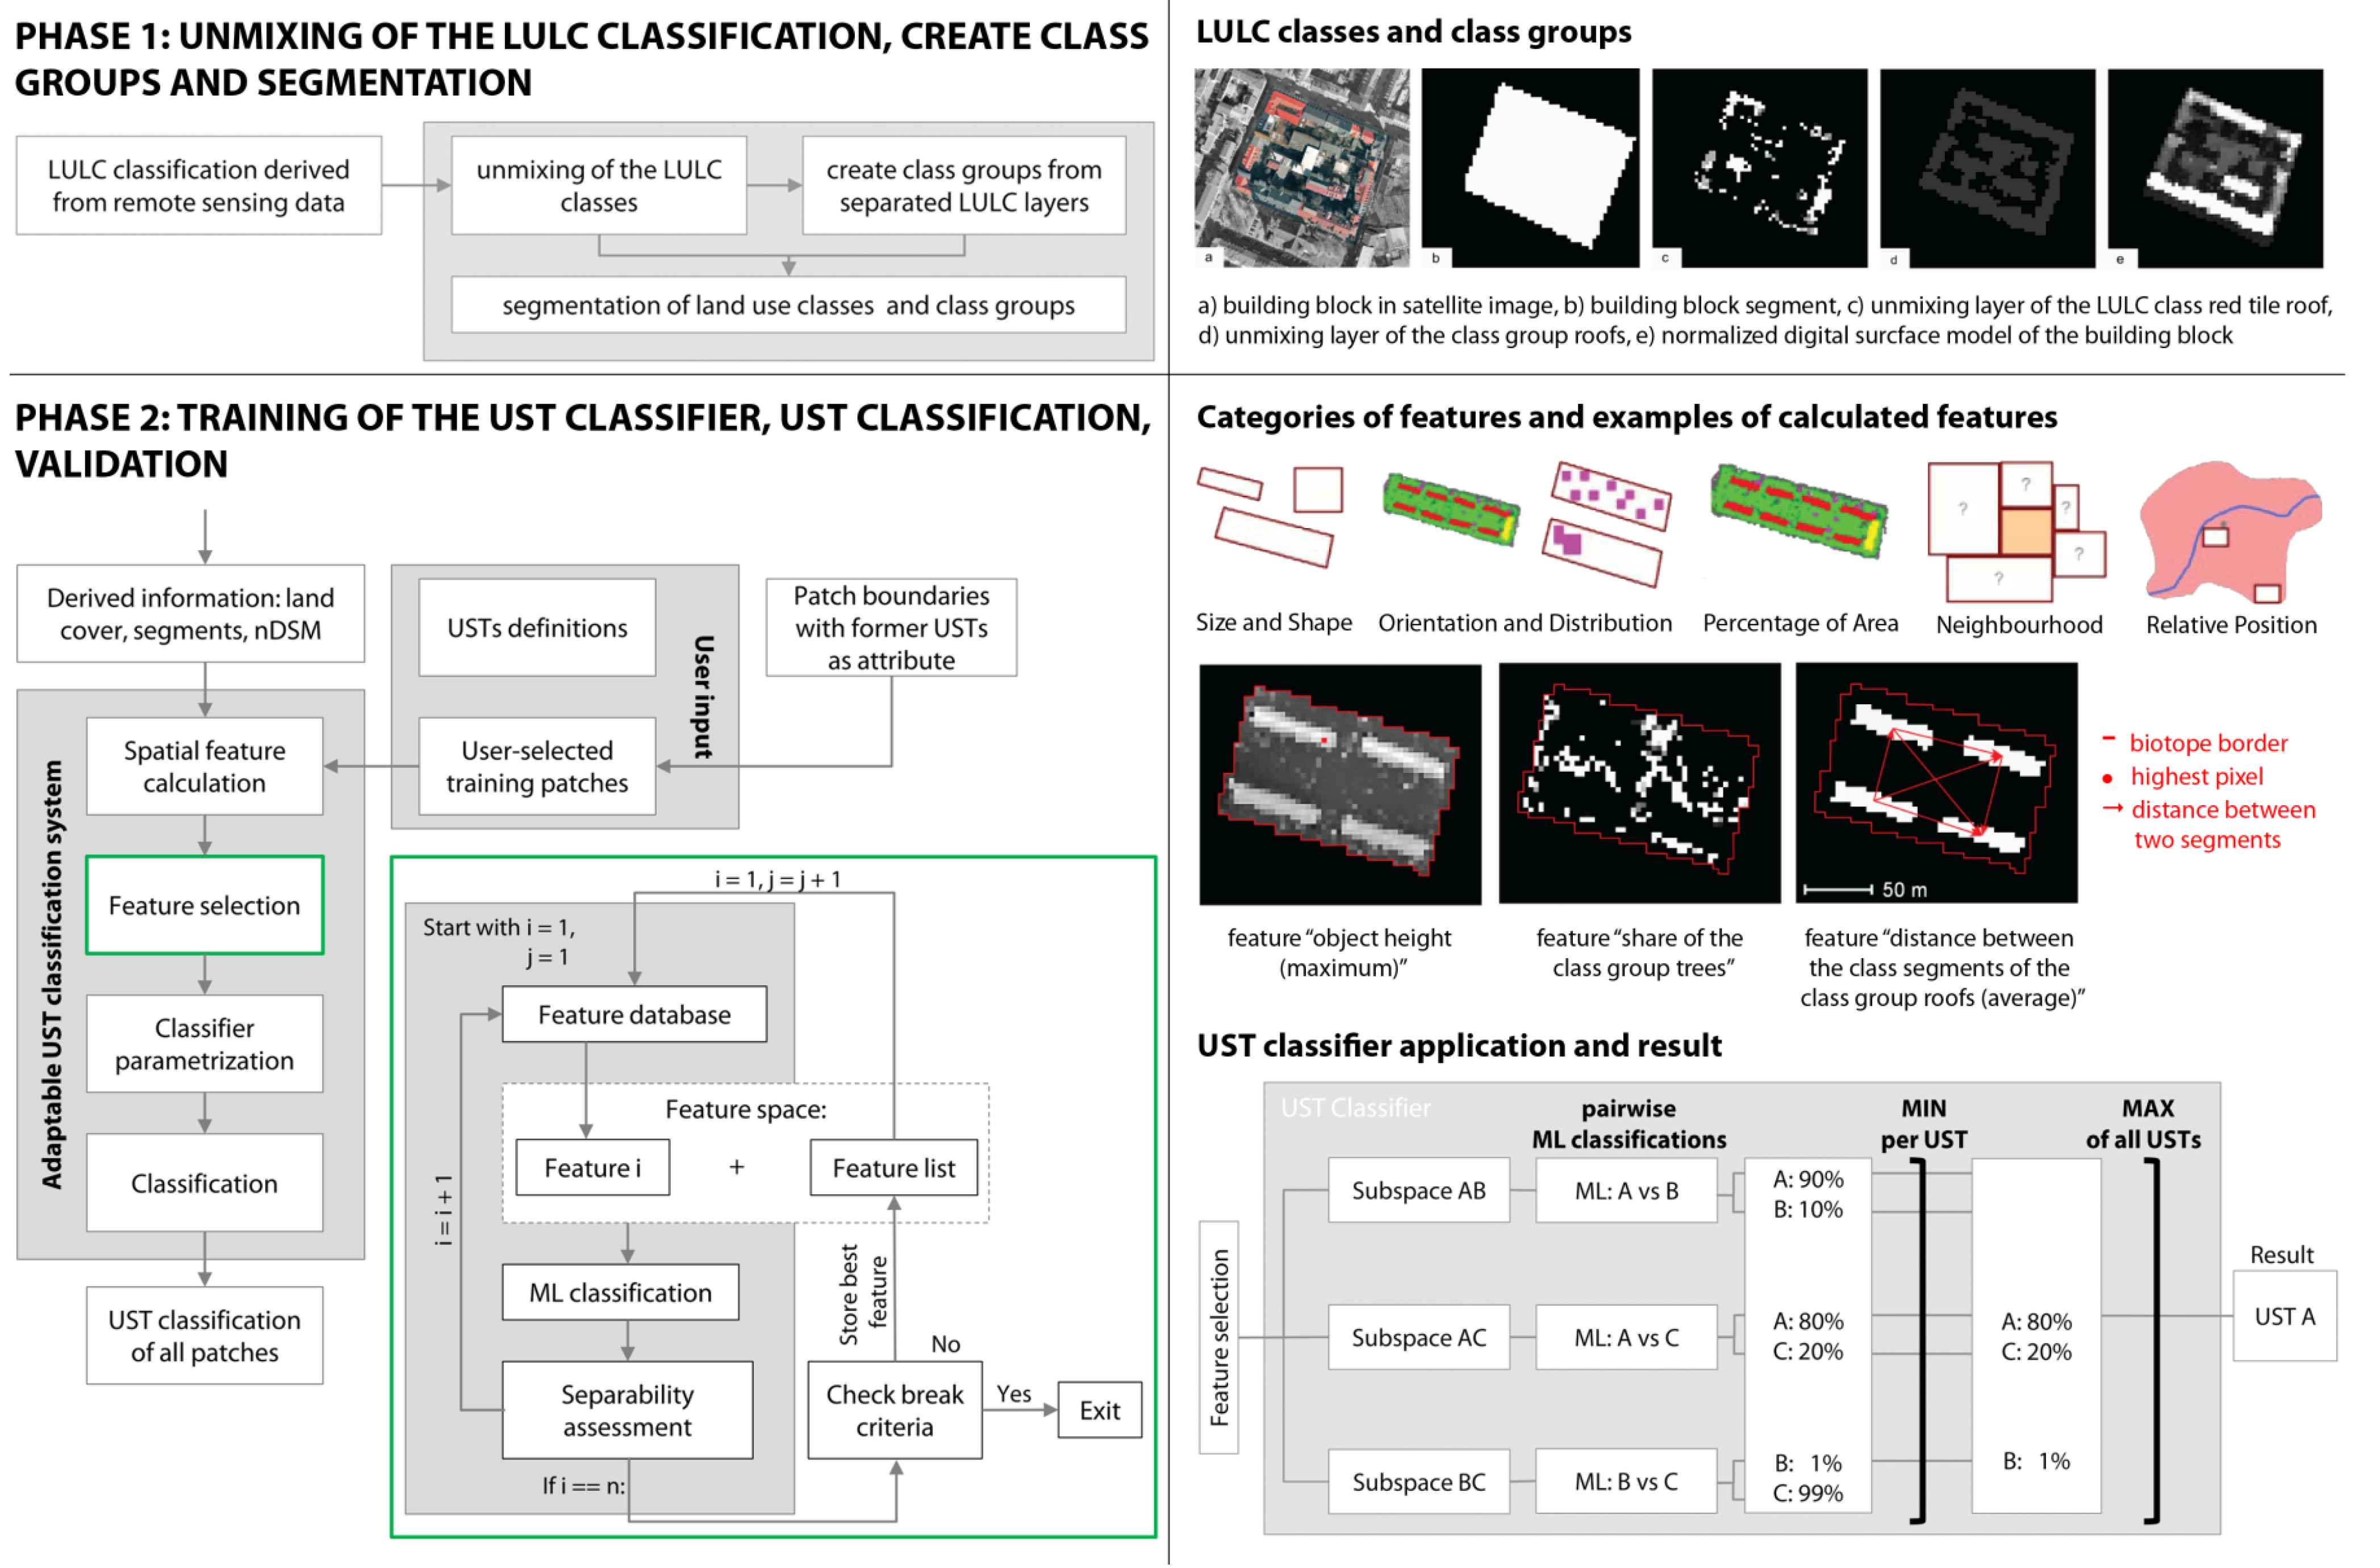
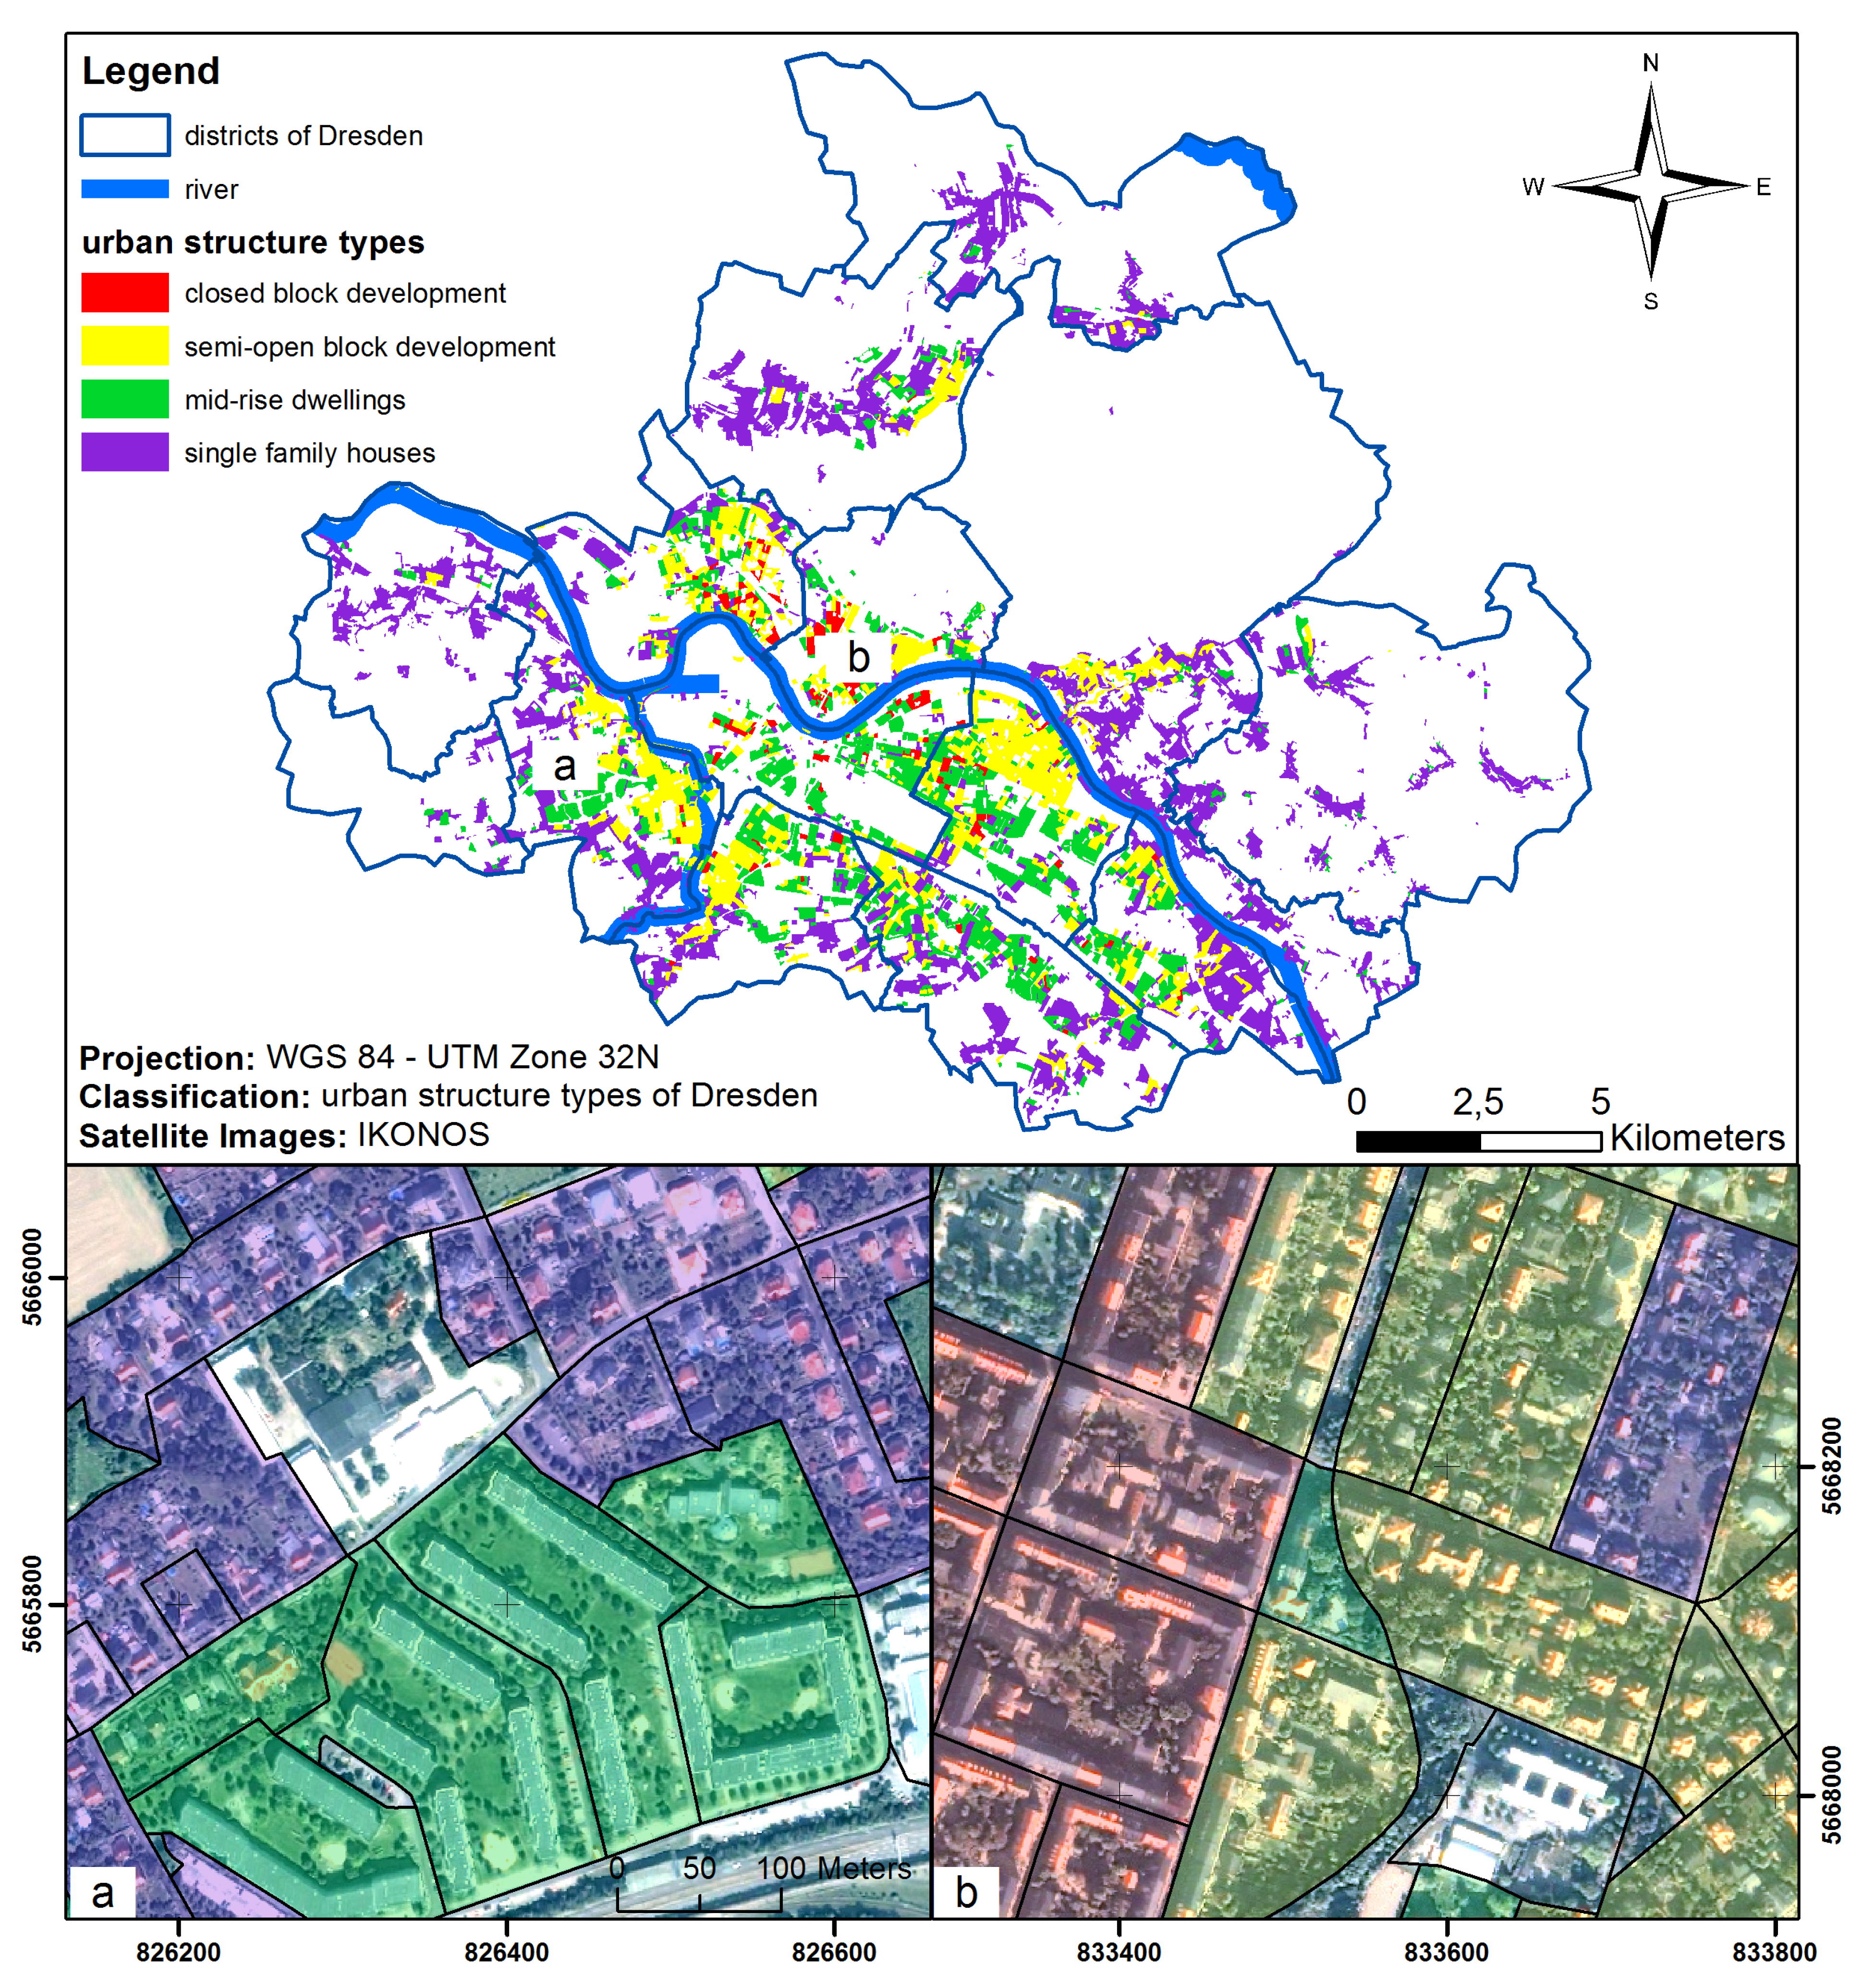
2.4. Classification of Elements at Risk: Urban Structure Type Classification

This study investigates if urban structure types are useful classes for flood loss modeling. In case of a positive answer they can provide valuable input information for multi-parameter flood damage modeling and mapping at the meso-scale. Since each urban structure type is composed of a certain type of residential buildings they can be used to categorize and map the elements at risk (i.e., the residential buildings). In this study, the urban structure map of Dresden is derived using the automatic urban structure mapping approach developed by Bochow et al. [31,33]. This approach requires the following: (a) definition of the types of urban structure; (b) spatial mapping units; (c) a land cover classification; (d) spatial features; and (e) a parameterized classifier for urban structure types. The types of urban structures can be freely defined by the user. In this study, we test the suitability of the urban structure types “closed block development”, “semi-open block development”, “mid-rise dwellings”, and “single-family/semi-detached houses” as defined in the official urban structure map of Dresden from 2007 provided by the Environmental Office of Dresden (Umweltamt Dresden). Building blocks taken from ATKIS data are serving as spatial mapping units. A supervised land use/land cover classification was carried out in the context of this study based on Ikonos data (see below). Spatial features and a generic classifier for urban structure types were implemented by Bochow et al. [33] in an adaptable urban structure type classification system, which is described in detail below.
Table 1. Input data for urban structure mapping and flood loss modeling.
TaskDataSourcePropertiesApplication
Urban structure type mapping (subsection 2.4.)4 Ikonos Geo Ortho Kit images Acquisition time: 2004–2008
Format: raster
Spatial resolution: 1m
Spectral resolution: 4 spectral Bands (blue, green, red, near infrared)
LULC classification using a decision tree classifier
LiDAR Acquisition time: 2002
Format: raster
Spatial resolution: 1 m
Vertical resolution: 1 dm
Reclassification of maximum likelihood classification result using a decision tree
Height information of buildings for spatial feature calculation in the urban structure mapping approach
digital basis landscape model (basis-DLM)Official Topographic Cartographic Information System ATKIS (Amtliche Topographisch-Kartographische Informationssystem)Acquisition time: 2004
Format: vector
Borders of building blocks for urban structure type mapping
Basic mapping units for flood loss estimation
urban structure map of DresdenEnvironmental Office of Dresden (Umweltamt Dresden)Acquisition time: 2007
Format: vector
Training and validation data for urban structure type classification
Flood loss modeling (subsection 2.5. and subsection 2.6.)Water depth of the Elbe flood 2002Landeshauptstadt DresdenAcquisition time: 2002
Format: raster
Spatial resolution: 10 m
Flood loss estimation for the Elbe flood 2002 in Dresden using FLEMOps and three regression tree models
Contamination[48]Class: no contamination
Format: table
Urban structure typesDerived in this study using the urban structure mapping approach developed by Bochow et al. [33]Classes: closed block development, semi-open block development, mid-rise dwellings, single-family houses
Format: vector
Floor spaceCalculated in this study based on the urban structure mapUnit: square meter
Format: table
age of building telephone interviews [45,46,55]Categories: before 1924, 1924–1948, 1949–1990, and after 1990
Format: table
heating systemtelephone interviews [45,46,55]Classes: coal, gas, fuel oil, electricity (night storage), district heating, wood/pellets/tile stoves, and others
Format: table
Precaution measures[48]Class: no precautions
Format: table
Building quality[50]Categories: low/medium quality, high quality
Format: raster
Spatial resolution: 10 m
Building value[49,55]Unit: Euro per square meter
Format: raster
Spatial resolution: 10 m
Relative lossesCalculated based on telephone interviews [45,46,55]Format: table
The data basis for the urban structure mapping approach is a land use/land cover classification of Dresden derived from geometrically and atmospherically corrected pan-sharpened multispectral Ikonos Geo Ortho Kit images of the period 2004–2008 using a maximum likelihood classifier. The classification result covers an area of 377 km² and comprises 15 land use/land cover classes. Height information from LiDAR was integrated in a decision tree, which can be built with the ERDAS Image knowledge engineer, to enhance the classification results. Misclassified pixels (e.g., street pixels that have similar spectral properties as grey roofs) are reclassified by assigning the height information.
Figure 3 shows the concept of the urban structure mapping approach. In a preparatory phase (Phase 1 in Figure 3) the LULC classes are combined into thematic groups (e.g., vegetation integrates meadow and trees), which are stored as additional layers together with the original LULC classes. The resulting layer stack contains the original 15 LULC classes, as well as 12 thematic class groups, namely vegetation, trees, soils, roofs, roofs_metal, roofs_tiles, roofs_flat, traffic, sports, roofs_industry, shadow, and water. In the next processing step sequentially numbered image segments consisting of adjacent pixels of the same class are created and stored for each LULC class and class group. Given the fact that urban structure types contain different geo-objects that consist of several surface materials, the urban structure mapping approach of Bochow et al. [33] calculates numerical spatial features within the boundaries of a certain mapping unit—in this study the ATKIS building blocks—describing the composition of the urban structure types and the arrangement of surface materials within them (Phase 2 in Figure 3). The numerous features belong to the five categories size and shape, orientation and distribution, percentage of area, neighborhood, and relative position. They are calculated either based on the entire ATKIS building blocks, based on individual classes or class groups, or based on the segments of a class. Furthermore, if present the interior (backyard) of a building block or its border area can be considered separately for the feature calculation. For all basic features distinctive statistical parameters like minimum, maximum, mean, and standard deviation are calculated. The total number of spatial features calculated in this study amounts to 3828. Training information for the feature selection and classifier parameterization process is obtained from the official urban structure map of Dresden. Feature selection is conducted independently for every pair of urban structure types in order to find good feature spaces for use within a pairwise classification architecture. The approach (green box in Figure 3) is among the group of wrappers [56] since with the maximum likelihood classification the same classifier is used during feature selection as for the final classification. The implemented search strategy is the Sequential Forward Selection (SFS) algorithm [57]. Feature selection is performed as an iterative process starting with maximum likelihood classifications of a pair of urban structure types in one-dimensional feature spaces using each of the spatial features separately. The feature with the lowest omission error for each pair of urban structure types is written into a feature list. For the case that multiple features lead to a fully correct separation, the feature with the largest Bhattacharyya distance between the two types will be selected. Several iterations result in a feature list for each pair of urban structure types. Based on this feature list and the training building blocks an urban structure type classifier is parameterized. The ATKIS building blocks are then classified by computing a similarity value to each urban structure type and the highest similarity value determines the urban structure type. Finally, the accuracy of the urban structure type classification is assessed using a cross-validation approach.
Figure 3. Flow chart of the urban structure type classification, modified after [31].
Water 06 02367 g003

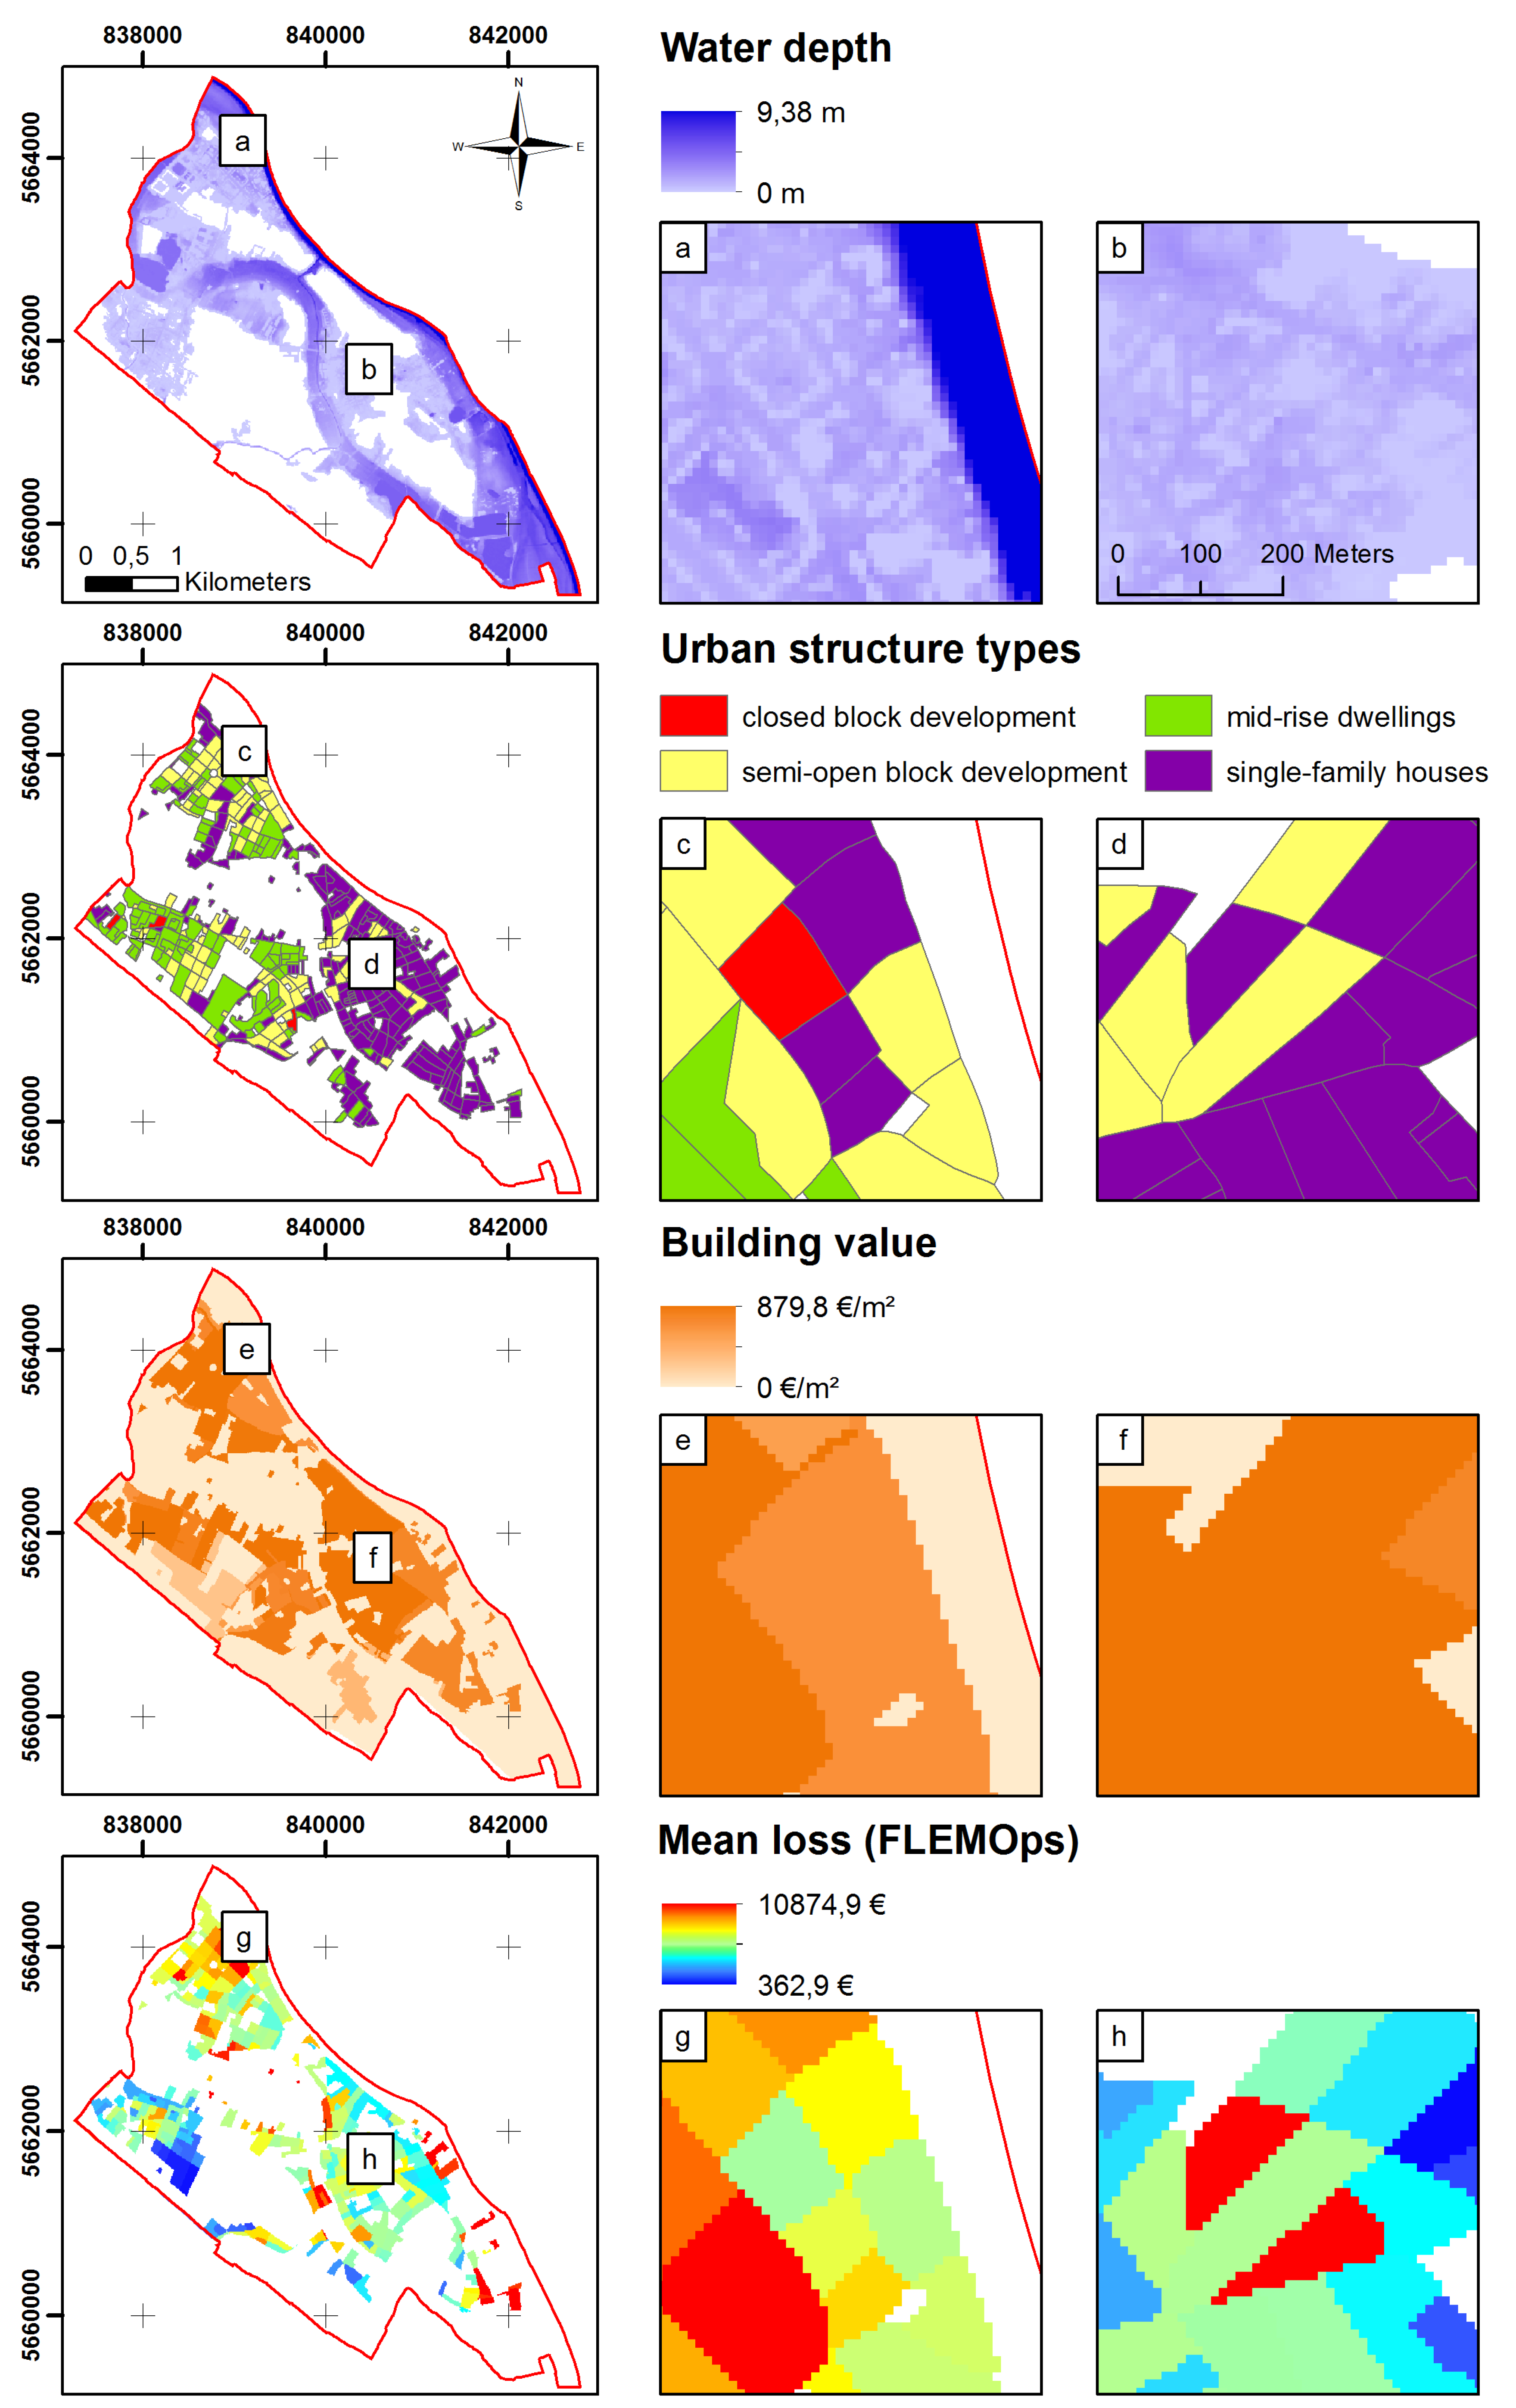
2.5. Exposure Analyses and Asset Assessment

For the exposure analysis the flood-affected building types and detailed information about their characteristics is required. Using a decision tree approach (using MATLAB Statistics Toolbox, algorithms based on [58]), empirical flood damage data has been analyzed in order to identify the most important building characteristics determining the flood damage. These were: floor space, age of building, heating system, and precaution. The mean floor space is calculated for each building block using the spatial features “number of roof segments”, their associated “total area” and “mean height”, that were calculated area-wide during the urban structure mapping, as well as the number of stories. The latter is determined by the building height and an assumed ceiling height of 2.6 m for closed block developments, single-family houses, and mid-rise dwellings and 3.0 m for semi-open block developments. Additional information is obtained from the telephone interviews by spatially linking their registered coordinates with the urban structure map in a GIS. The given information about the parameters age of building and heating system are statistically analyzed and the category with the highest share for each building type is assigned to this class.

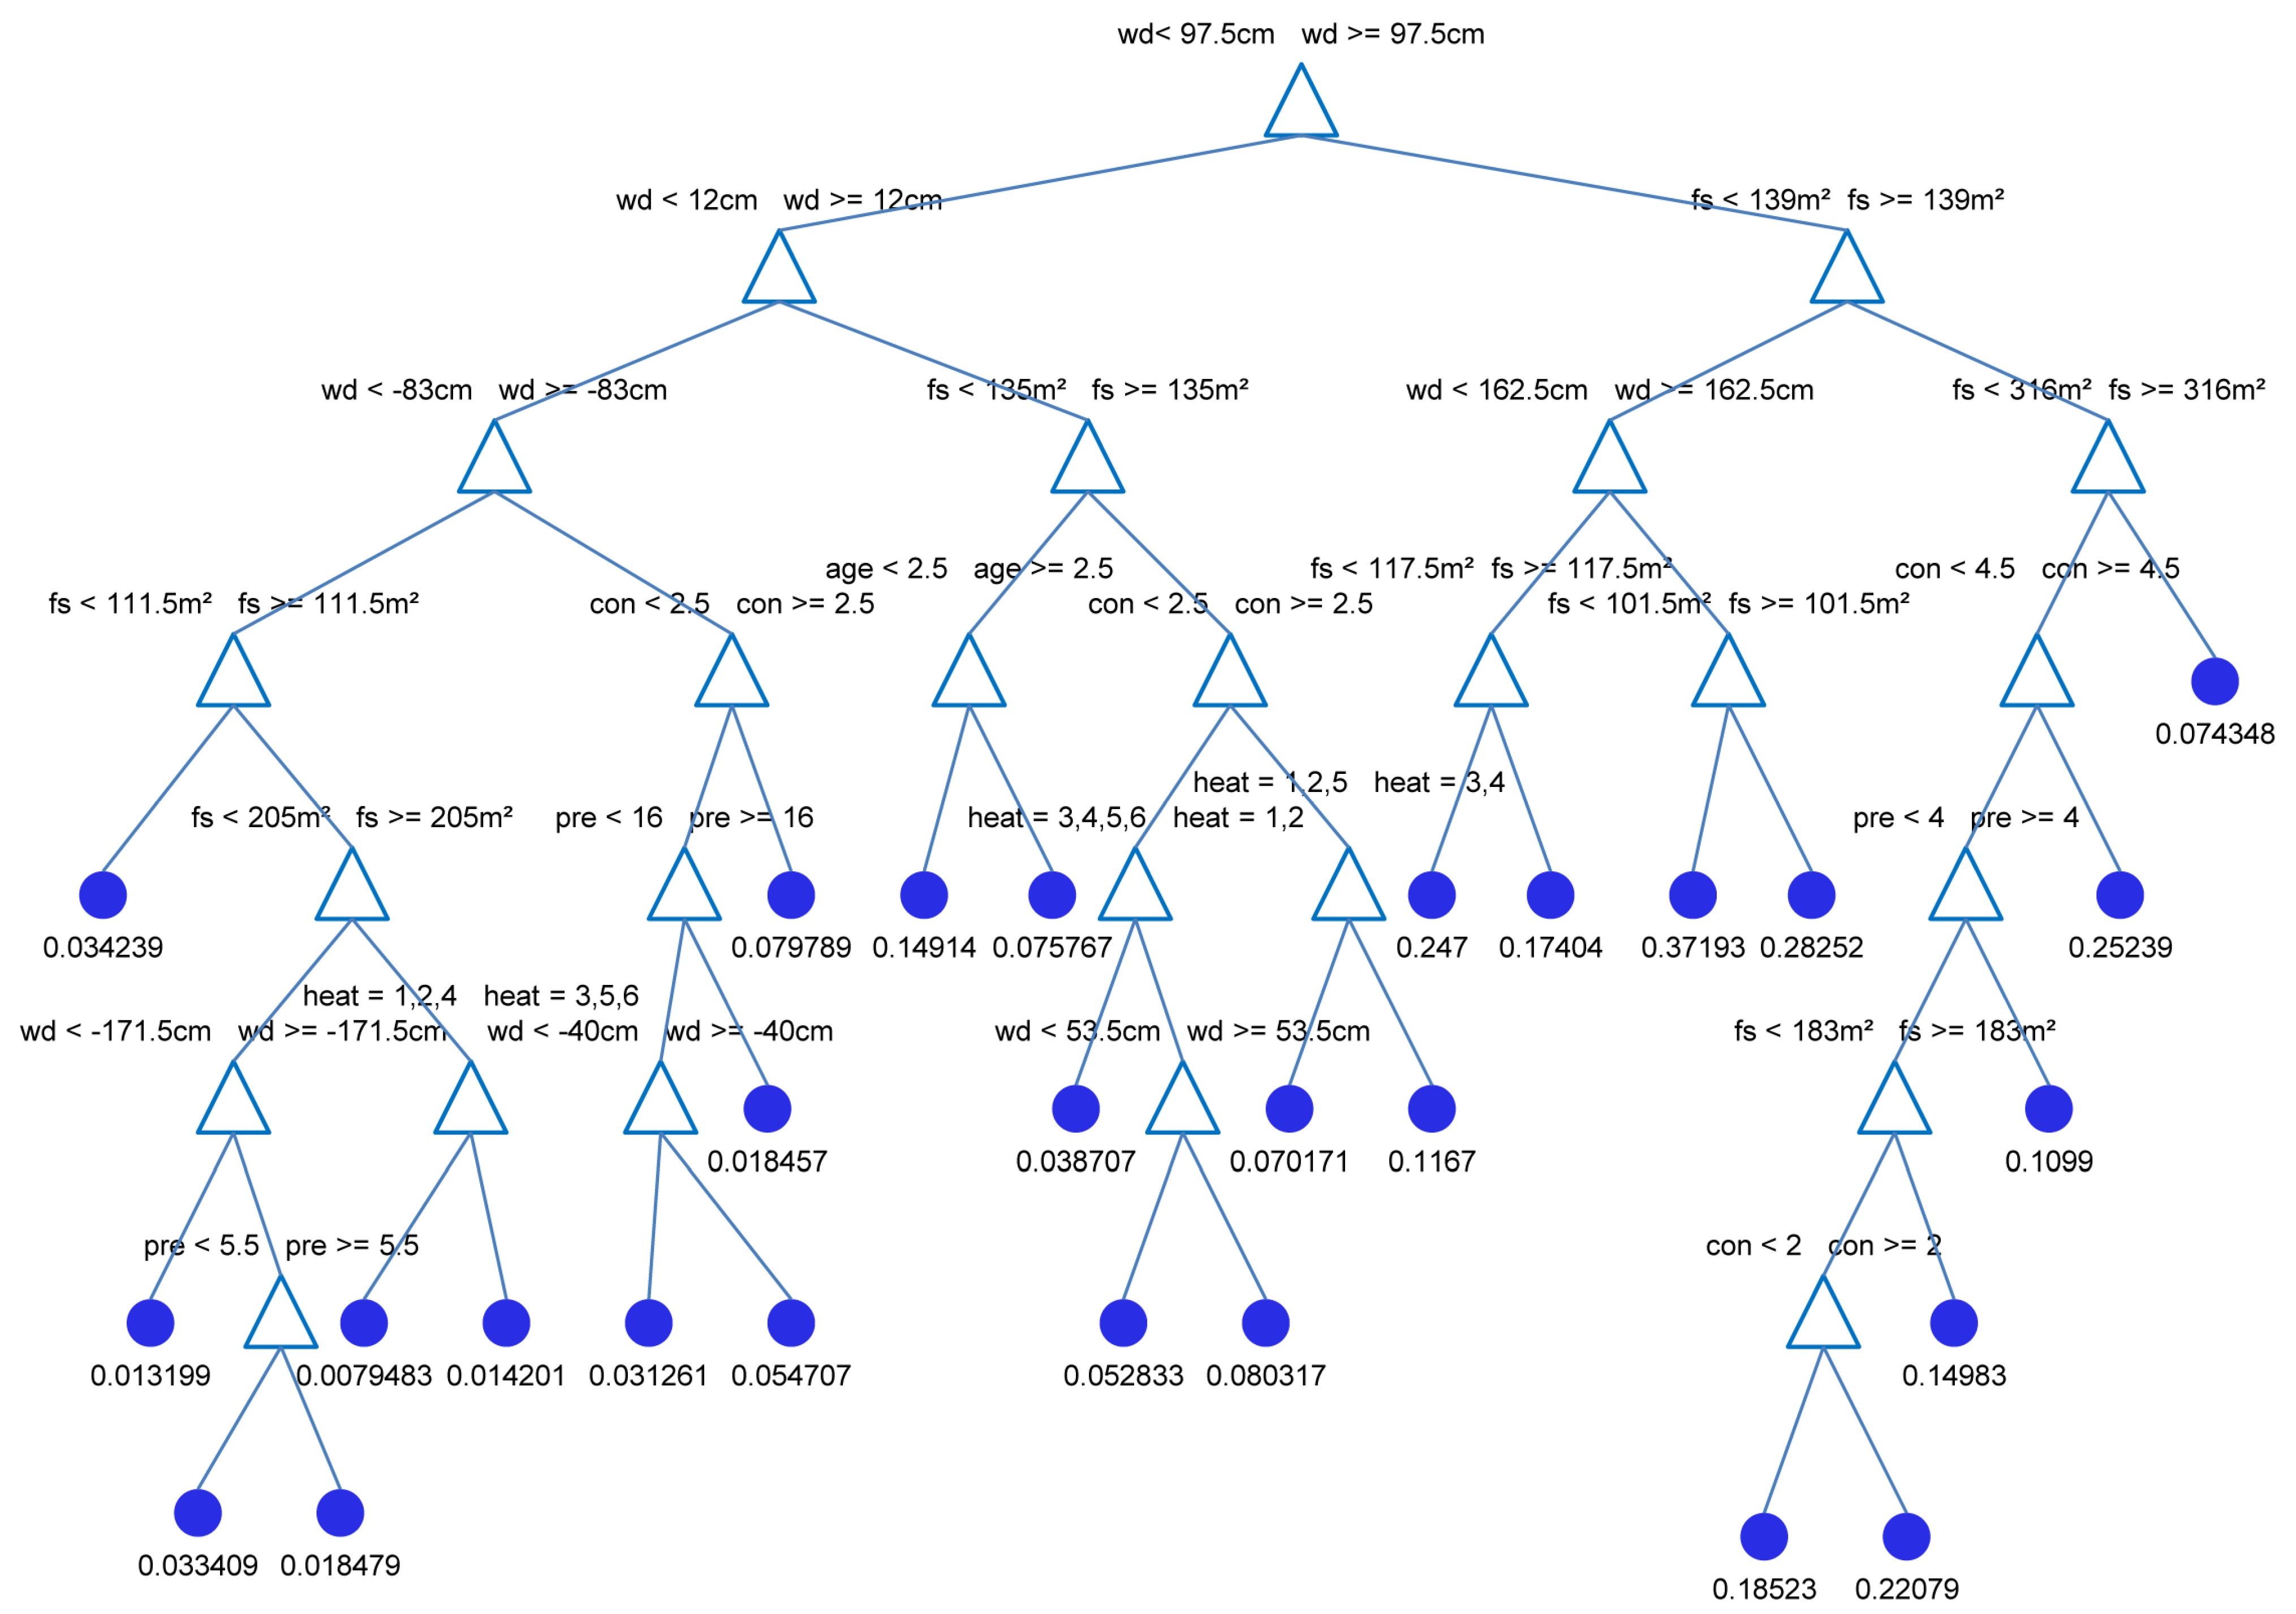
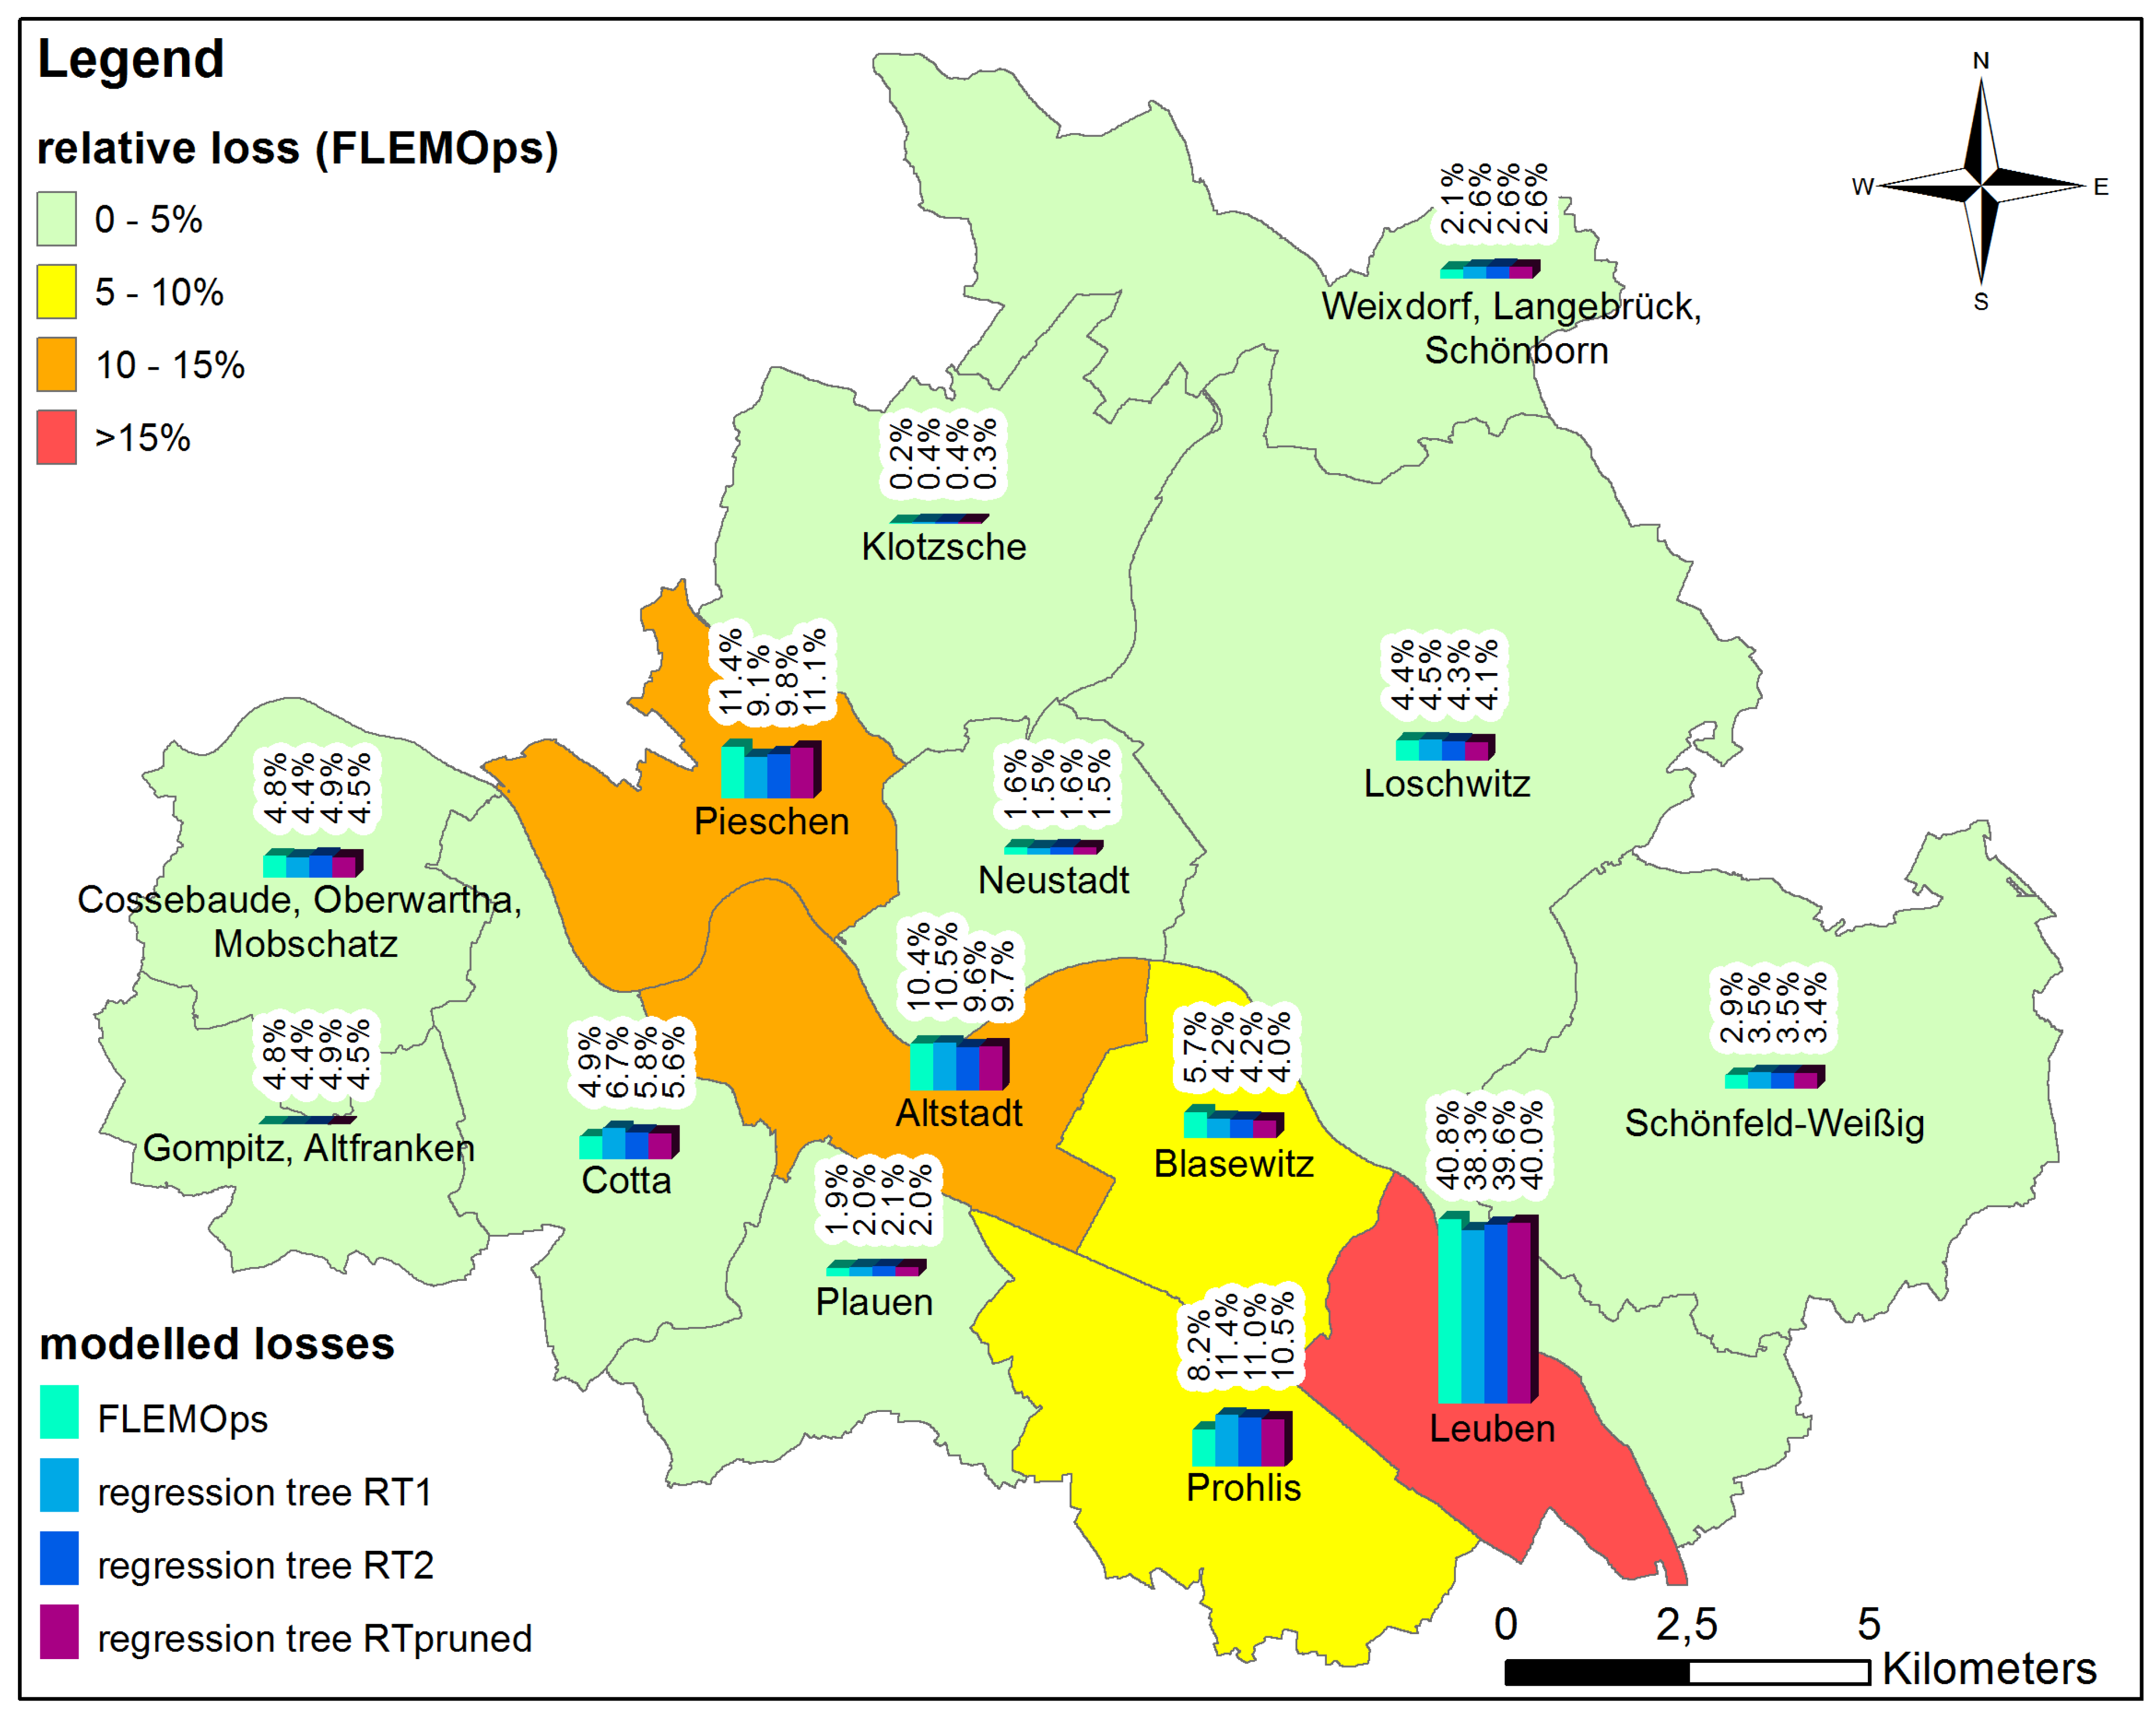
2.6. Susceptibility Analyses

The susceptibility analysis is carried out in MATLAB using two methods: the Flood Loss Estimation MOdel for the private sector, FLEMOps [51], and regression trees [26]. These damage models were adapted to the newly available information from remote sensing, i.e., the urban structure types.
Following the approach of Thieken et al. [51], the adapted rule-based FLEMOps model calculates relative flood losses of residential buildings based on different building types, two building qualities (low/medium, high quality), and five water depth (<20 cm, 21–60 cm, 61–100 cm, 101–150 cm, >150 cm) (see Figure 2, step (c) left). In previous studies the amount of different building types and their quality on municipal scale was estimated on basis of commercial INFAS Geodaten, but detailed information about their spatial assignment within a constituency or municipality was not available [59]. In absence of detailed spatial information a cluster analysis of the INFAS Geodaten was carried out in order to determine the building composition and the mean building quality was calculated for each constituency or municipality. Exposure data were disaggregated based on CORINE land cover data or German ATKIS (Authoritative Topographic Cartographic Information System) [40] applying a dasymetric mapping approach [59]. The previously used three building types (one-family homes, (semi-)detached houses, and multifamily houses) are replaced by the four urban structure types (closed block development, semi-open block development, mid-rise dwellings, and single-family/semi-detached houses) in the adapted version. On the meso-scale, the model FLEMOps uses the area wide (gridded) input information to determine relative loss values which are then assigned to each raster cell [51].
Following the approach of Merz et al. [26], the regression tree (RT1) was built based on all interview data using the MATLAB Statistics Toolbox whose routines classregtree is based on Breiman et al. [58]. The six predictors water depth, contamination, precaution, floor space, age of building and heating system are used to predict loss ratios of residential buildings. The algorithm subdivides the predictor data space into smaller regions, so that by a repeated binary partitioning a tree structure from the root node to the terminal nodes is formed. The split is selected whose split values minimize the error criterion variance of relative loss. The prediction represents the average of the response variable of all samples of the training data set that belong to a terminal node. The stopping criterion is a minimum number of 30 cases per leave. Similar to RT1 a second regression tree was built (RT2), considering only four candidate predictors by excluding contamination and precaution. Additionally, in order to avoid overfitting the regression tree RT1 is pruned (RTpruned), i.e., the large tree is cut back for obtaining a simple tree. On the meso-scale, the calculation of the relative loss per raster cell is performed based on the area wide input data for Dresden. By answering the questions at the nodes, to each grid a relative loss value is assigned. An advantage of tree-based damage models is that they are able to include both continuous (e.g., water depth) and categorical predictors (e.g., building type). Moreover, they exploit the local relevance of predictors and there is no need to make assumptions concerning the relationship between predictand and predictors. In order to identify complex relationships large data sets are necessary, which can be seen as the main disadvantage of this method [26].
FLEMOps and the regression trees calculate the absolute loss for Dresden by multiplying the estimated relative damage with the exposed building values for each raster cell. In addition to the total loss in Dresden, the losses per urban structure type are analyzed.

3. Results and Discussion

3.1. Classification of Elements at Risk

The elements at risk are represented by urban structure types derived from remote sensing data analyses (Figure 4). In accordance to the official urban structure map the four types closed block development, semi-open block development, mid-rise dwellings, and single-family/semi-detached houses are distinguished. About 55% of the approximately 6000 ATKIS building blocks in Dresden are classified as single-family houses. Mid-rise dwellings (23%) and semi-open block developments (19%) are also strongly represented. With a share of 3% closed block development is the least frequent category of residential buildings. This type primarily occurs in the historic inner city of Dresden. Semi-open block development and mid-rise dwellings are typical buildings of the districts near the city core that are part of urban expansion and reconstruction since the beginning of the 20th century and post-war period. Single-family houses especially can be found in external districts and surrounding villages that belong to the municipality of Dresden, which can be explained by suburbanization in recent times.
Table 2 shows the spatial features automatically selected by the feature selection algorithm for the pairwise distinction of the urban structure types. It can be seen that the selected features represent spatial properties in which the respective urban structure types are unequal. For instance, typical for closed block development is that it consists of several interconnected buildings that are built along the street (Figure 4b). In contrast, semi-open block developments in Dresden usually consist of smaller cubic houses (“Würfelhäuser”) (Figure 4b). The area of these free-standing multi-family houses is much lower than the aggregated area of the interconnected houses of closed block developments and thus, the feature “mean area of the segments of the class roofs within the total building block” was selected by the automatic algorithm as a good feature for distinguishing these two types. The buildings of the type mid-rise dwellings are often surrounded by meadows with occasionally small to medium sized shrubs and trees (Figure 4a). Possibly, it would not be a human’s first guess, but, numerically, the algorithm found the features “share of area of the class roofs within the total building block” and “mean height of the class vegetation within the total building block” to be the most distinctive ones between this type and the type closed block developments. The buildings with the smallest groundplan and smallest building heights are single-family houses (Figure 4a). Consequently, height and area features of the class group “buildings” have been selected to distinguish this type from mid-rise dwellings and semi-open block development. In summary the most important features for the performed urban structure type classification across all classes are height of buildings within the building block, the area and number of roof segments, as well as vegetated area and vegetation characteristics (e.g., height of trees) (Table 2). This study supports the findings of [31] that spatial features calculated based on semantic class groups are more important for distinguishing urban structure types than those calculated on spectrally defined land cover classes, as derived by common spectral-based image classification techniques.
Figure 4. Urban structure types map of Dresden.
Water 06 02367 g004
The overall accuracy of the urban structure classification that was calculated using a cross-validation approach reaches 73.6% (Table 3). In detail, the omission errors of the urban structure types closed block development, semi-open block development, and mid-rise dwellings are significantly higher (27% to 36%) than those of single-family houses (>20%). The commission error for closed block development and semi-open block development is about 40%, followed by mid-rise dwellings (24%) and single-family houses (18%). The observed misclassifications can be mainly explained by the occurrence of mixed building blocks. It is difficult to label a building block with a single urban structure type if the block is composed of different dwelling types. It is less likely that the remote sensing input brings significant uncertainty to the urban structure type classification due to the high overall accuracy of 94% of the pixel based land use/land cover classification.
Table 2. Spatial features for pairwise distinction of urban structure types.
Urban Structure Types and Features
Closed block development—semi-open block development
mean height of all objects in the border area
mean area of the segments of the class roofs within the total building block
standard deviation of the linear segment indicator of the class roofs in the border area
Closed block development—mid-rise dwellings
share of area of the class roofs within the total building block
mean height of the class vegetation within the total building block
number of segments per area of the class trees in the border area
height of the mean distance of class pixels from a central region of the class vegetation in the border area
Closed block development—single-family houses
standard deviation of the height of all objects within the building block
mean standard deviation of the height of the segment of the class trees within the building block
mean of the minimal distances between neighboring segments of the class trees within the building block
mean of the minimal distances between neighboring segments of the class shadow in the backyard
Semi-open block development—mid-rise dwellings
number of segments per area of the class roofs within the building block
maximal height of the class grey roof within the building block
minimal height of the class meadow in the border area
Semi-open block development—single-family houses
maximal mean height of the roof segments within the building block
share of the class shadow not on vegetation within the building block
maximal standard deviation of the height of the class soil in the backyard
Mid-rise dwellings—single-family houses
mean height of the class roofs within the building block
standard deviation of the height of the class shadow in the border area
minimal mean height of the segments of the class shadow in the backyard
Table 3. Error matrix of the urban structure type classification. Ground truth data in rows, classification result in columns.
Urban structure typeNumber of training building blocksClosed block developmentSemi-open block developmentMid-rise dwellingsSingle-family housesOmission error
Closed block development3663.916.719.4036.11
Semi-open block development4931.272.811.614.427.18
Mid-rise dwellings7451.516.064.118.435.84
Single-family houses1157011.58.180.419.62
Commission error 42.5041.8224.8418.28
Bochow [31], who used hyperspectral data of the inner city of Dresden, attained a higher accuracy of 83% for his urban structure map considering six urban structure types. However, for closed block development and mid-rise dwellings the omission and commission error with 30% to 40% is of a similar scale. Banzhaf and Höfer [30] achieved a comparable overall accuracy of 73% for their urban structure map that is based on CIR orthophotos. Compared to multispectral images hyperspectral data provides more spectral information, which is useful for the identification of surface materials and improves the discrimination of urban structure types. On the other hand, until now the acquisition of widespread hyperspectral data, which is needed to classify the total area of a city, is very time and cost-intensive. For this reason, a multispectral earth observation system is used for urban analysis in this study. Furthermore, a main advantage is their enhanced spatial resolution.

3.2. Exposure Analysis and Asset Assessment

The Elbe flood in 2002 covered an area of about 43 km² and had a maximal water depth of 9.4 m at the gauging station in Dresden. During this flood event there was almost no contamination through wastewater, chemicals, and oil in Dresden [48]. Overlaying the flooded area onto the urban structure map shows that the area of flood affected residential buildings totals to about 7.67 km² across Dresden. About 50% of these buildings are single-family houses. The second most common type are mid-rise dwellings (25%), followed by semi-open block developments (23%) and closed block development (<3%) (Table 4). The flood loss models require the assignment of a single characteristic value for each category to each urban structure type. This was done by statistically analyzing the telephone interviews, which were spatially linked to the urban structure map. The telephone interviews revealed that most of the closed block developments and mid-rise dwellings in Dresden were constructed during the period 1949–1990. The oldest buildings of the city refer to the urban structure type open block development. Many single-family houses were built in the period 1924–1948. The typical heating system of closed block development and mid-rise dwellings is district heating, which supplies multiple households. Semi-open block developments and single-family houses predominantly use gas. Analyses of remote sensing data revealed that the largest building size with a mean floor space of 4336 m² has the urban structure type closed block development, followed by mid-rise dwellings (2549 m²) and semi-open block development (1078 m²). The smallest mean floor space with 388 m² refers to single-family houses. According to [48], most private households in Dresden had not taken any precaution measures to reduce flood losses before the flood in 2002.
Table 4. Building characteristics of the four urban structure types in Dresden.
Building characteristicsClosed block developmentSemi-open block developmentMid-rise dwellingsSingle-family houses
Share of area (%) 2.922.624.749.8
Age of building(%)before 192428.035.112.225.6
1924–194816.123.125.133.7
1949–199040.922.547.617.6
after 199015.119.215.023.0
heating system(%)coal2.30.60.72.3
gas30.767.538.575.1
fuel oil6.88.66.815.5
electricity (night storage)5.71.34.32.3
district heating54.521.249.02.8
wood, pellets, tile stoves00.60.41.9
others000.40
mean floor space(m²) 433610782549388
The urban structure types are treated as homogenous groups in respect to flood damage modeling, however, Table 4 shows, that there are significant differences within one urban structure type in respect to building characteristics. The assignment of one single characteristic to a type with significant inner variance represents a generalization step, in which information is lost. For example, most of the single-family houses use gas, but about 25% use other heating systems.

3.3. Susceptibility Analysis

The adapted FLEMOps model uses relative losses for the four urban structure types within the range of 0.03 to 0.32 (Table 5). The relative losses in the inundation depth classes differ between the urban structure types. Particularly relative losses of single-family houses differ significantly compared to the other three urban structure types. The relative losses for closed block developments and semi open block developments are exactly the same; the values for mid-rise dwellings are similar to those. While the relative loss rises more quickly for closed block developments, semi-open block developments and mid-rise dwellings within the first meter of inundation, relative loss for single-family houses is low in the first meter and steeply rises above 1 m inundation depth. In general the loss ratios for high quality buildings are larger than for low/medium quality buildings. The observation that single-family houses have higher loss ratios compared to multi-family houses for water depth higher than 1 m was also described by Kreibich et al. [53].
Table 5. Adapted FLEMOps model: loss ratios of the four urban structure types for two classes of building quality and five water depth.
Building qualityWater depthLoss ratio of the urban structure types
Closed block developmentsemi-open block developmentmid-rise dwellingsSingle-family houses
low/medium<20 cm0.030.030.030.04
21–60 cm0.100.100.090.07
61–100 cm0.110.110.110.10
101–150 cm0.130.130.150.22
>150 cm0.180.180.200.24
high<20 cm0.050.050.050.05
21–60 cm0.160.160.120.09
61–100 cm0.170.170.140.13
101–150 cm0.200.200.200.29
>150 cm0.290.290.260.32
Figure 5 shows the regression tree RT1, which can be interpreted in order to evaluate the importance of the different input variables. In general, the more often a variable occurs and the closer it occurs to the root, the more important is the variable as a flood loss-influencing factor. The most frequent parameters are water depth and floor space. They have major impact on flood losses in this study. The parameters contamination, precaution, and heating system are less important. Age of building has the least influence on flood damage estimation. That water depth is the most influential predictor in flood damage estimation is commonly accepted and also stated by many other authors, e.g., [7]. This study shows that buildings with a small floor space have higher loss ratios than large buildings, which is in accordance to [49]. The variables heating system and age of building only show up in the left branch of the regression tree, which means that they only affect the relative loss of buildings, which are affected by water depth below 97.5 cm. The regression tree shows that precaution measures reduce flood losses. The better the precaution, the lower is the loss ratio, which supports the findings of Merz et al. [26]. Buildings that are affected by contamination have higher loss ratios than not contaminated buildings.
Figure 5. Structure of the regression tree RT1. Abbreviations: wd = water depth, fs = floor space, age = age of building, heat = heating system, con = contamination, pre = precaution. Triangles represent the decision nodes, dots are calculated loss ratios.
Water 06 02367 g005
The total damage for Dresden determined with FLEMOps amounts to €289 million, which has the same order of magnitude as official damage data [42,43] and calculations of Kreibich et al. [53]. The flood loss estimation resulting of the regression trees RT1, RT2, and RTpruned are lower between €189 and 242 million (Table 6).
Table 6. Flood loss estimations calculated with FLEMOps and regression trees for the Elbe flood in 2002.
Modeled flood lossesOfficial estimates
FLEMOpsRT1RT2RTprunedSAB [43]Korndörfer [42]
Total loss (€ in million)288.9189.2214.4241.9239.8304.0
When comparing all flood losses on district scale across the city, the district Leuben suffered the greatest losses. More than 38% of all damages are assigned to this district. Further 30% of the total loss is distributed more or less equally among the four districts Pieschen, Prohlis, Blasewitz, and Altstadt. Relatively small losses (<5%) occurred in the other nine districts of Dresden. Only minor differences in the flood damage distribution across the city occur on districts scale between the four modeling approaches (Figure 6).
Figure 6. Distribution of estimated flood losses in Dresden.
Water 06 02367 g006
More than 50% of the total loss is attributed to flood affected single-family houses, mainly because they are the most common urban structure type in the flood-prone area and due to their high building asset value (Table 7). Second most contributing urban structure type is semi-open block development (about 23%–24%), followed by mid-rise dwellings with 17%–22%. The damages of closed block developments amount to 2%–3% of the total loss. The low damage sum can be linked to the rare occurrence of this urban structure type. Comparing the losses per square meter for the four urban structure types, Table 7 reveals that at water depth >97.5 cm losses are higher for single-family houses than for semi-open block developments, followed by mid-rise dwellings, and closed block developments, which is simulated concordantly by all four models. This result confirms that the relative losses of the urban structure types used in this study show significant differences and thus it is evident that urban structure types represent meaningful input data for modeling flood losses. At water depth <97.5 cm, however, there is no clearly discernible pattern. Losses calculated with FLEMOps are higher for semi-open block development and closed block development than for the other two urban structure types. Losses calculated with regression tree RT1 are higher for semi-open block development and single-family houses than for the other two types. RT2 calculated a lower loss for mid-rise dwellings than for the other three types and RTpruned results in more or less equal losses for all types. In general, most of the losses per square meter related to water depths >97.5 cm are higher than those at water depths <97.5 cm confirming the plausibility of the models.
Table 7. Absolute and area-weighted flood losses of the four urban structure types.
Closed block developmentSemi-open block developmentMid-rise dwellingsSingle-family housesTotal loss
flooded area (m²) at water depth < 97.5 cm166,2001,418,0001,579,9002,823,200
flooded area (m²) at water depth > 97.5 cm54,800312,800313,3001,001,300
Flood loss estimations
Water depth <97.5 cmFLEMOps (€ in million)5.650.945.674.3176.4
RT1 (€ in million)2.433.524.569.4129.8
RT2 (€ in million)4.238.129.077.5148.8
RTpruned (€ in million)4.844.244.485.0178.4
Water depth >97.5 cmFLEMOps (€ in million)2.419.318.372.5112.5
RT1 (€ in million)1.110.88.439.059.3
RT2 (€ in million)1.211.38.244.865.5
RTpruned (€ in million)1.211.18.642.563.4
Water depth <97.5 cmFLEMOps(€/m²)33.535.928.926.3
RT1 (€/m²)14.823.615.524.6
RT2 (€/m²)25.326.918.427.5
RTpruned (€/m²)28.831.228.130.1
Water depth >97.5 cmFLEMOps (€/m²)44.561.758.572.4
RT1 (€/m²)21.534.626.938.9
RT2 (€/m²)21.536.226.344.7
RTpruned (€/m²)21.535.527.542.4
Figure 7 shows the water depth, urban structure types, building values and estimated flood losses calculated with FLEMOps for the district Leuben. The strong relationship between high damages and high water depth can be clearly seen by comparing Figure 7a,g. On the other hand, it is also recognizable that there are differences between the urban structure types regarding the losses. For example, the building type closed block development has lower losses compared to surrounding single-family houses at similar water depth (Figure 7a,c,g). The observation of differing flood losses between urban structure types is equally true for single-family houses and semi-open block developments (Figure 7d,h). Differences can be explained by varying water depth and building values (Figure 7a,c,d,g).
Figure 7. Water depth, urban structure types, building values, and resulting distribution of losses in Leuben (projection: WGS 84—UTM Zone 32N).
Water 06 02367 g007
Following the recommendations of Pappenberger and Beven [60] a brief description of potential sources of uncertainty and limits of the approach used in this study is given here. Generally, uncertainty is introduced via all input parameters used for flood damage modeling, some of which are described in the following: Errors in flood extent and water depth have an important impact on the number of flood affected buildings and calculated losses using FLEMOps and regression tree models since water depth is the most important flood loss influencing factor. Furthermore, uncertainty is introduced via estimates of the heating system, contamination and precaution, based on interview data since the answers of the interviewees are subjective. Additionally, the necessary generalization of building characteristics (e.g., age, heating system) leads to a loss of information. Another source of uncertainty is the urban structure type map. About one quarter of the building blocks is wrongly classified, which is attributed to the small number of training and test data of the urban structure type closed block developments and the high occurrence of mixed building blocks. However, since in this study single-family houses have turned out to be most different from the other urban structure types in terms of flood damage, the omission and commission errors of single-family houses which are significantly lower than those of the other urban structure types (<20% compared to 24%–43%) are in this case the more relevant error estimation measures compared to the overall accuracy of the urban structure type map.
Due to the fact that reported flood damage data is scarce or if they are available little is known about their quality, quantitative validation methods that compare modeled damages against observations are difficult [61]. Official or reported flood damage data is highly uncertain [21]. According to Wind et al. [62], the uncertainty concerning the reported damage per flooded object amounts to 20%–40%. This fact is reflected in official damage data for residential buildings caused by the Elbe flood in 2002 in Dresden, which has a range of more than 60 million Euro [42,43] (see Table 6).

4. Conclusions

This study demonstrated how remote sensing data can be used in order to improve flood loss estimation for risk analyses, due to providing detailed spatial information on different residential building types which was not available before. An urban structure mapping approach was applied based on multispectral remote sensing data and LiDAR data to obtain information about the building stock and their characteristics. The urban structure map achieved a good accuracy of 74% and on this basis modeled flood losses for the case study, the Elbe flood in 2002 in Dresden, are in the same order of magnitude as official damage data. Single-family houses show significantly higher losses than the other three urban structure types, so that information on their specific location derived from remote sensing is very valuable for flood damage modeling.
However, a shortcoming of the approach is that some building specific information which are important for flood loss modeling (e.g., precaution) cannot be derived from remote sensing data. Thus, ancillary data or other data acquisition methods are necessary.
Further improvements in flood loss modeling may be possible, by defining and mapping different (maybe more) urban structure types whose classification is more oriented on differences in flood susceptibility. A main advantage of this automatic urban structure type mapping on the basis of remote sensing data is its applicability in territories where other detailed land use maps are not available and where otherwise flood damage modeling would not be possible. Furthermore, remote sensing has a great potential due to its rapid development and improvement of data. In future, it may be possible to extract more relevant building characteristics from remote sensing data like information about construction materials and as such it may be possible to further improve flood damage modeling and risk assessments.

Acknowledgments

We like to thank the Environmental Office of Dresden for providing us with a LiDAR DSM and DTM, the official urban structure map as well as the inundation raster of the 2002 flood in Dresden. The surveys collecting the empirical flood damage data via interviews were funded by the Ministry of Education and Research—BMBF (No. 01SFR9969/5, No. 0330688, No. 0330755) and Deutsche Rückversicherung AG. This research was undertaken partly within the framework of the BMBF funded Project “MULTISURE” (No. 0330755), and the “Climate-proof flood risk management” project supported by the Dutch research programme Knowledge for Climate (Theme 1).

Author Contributions

Idea and concept of this study were developed by Heidi Kreibich and Mathias Bochow. The urban structure type classification was undertaken by Tina Gerl with the help and under the supervision of Mathias Bochow. The flood damage modeling has been undertaken by Tina Gerl with the help and under the supervision of Heidi Kreibich. Tina Gerl wrote the first draft of the article, which was then revised by the other authors.

Conflicts of Interest

The authors declare no conflict of interest.

References and Notes

  1. Jha, A. K.; Bloch, R.; Lamond, J. Cities and Flooding—A Guide to Integrated Urban Flood Risk Management for the 21st Century; The World Bank: Washington, DC, USA, 2012. [Google Scholar]
  2. Douben, K.-J. Characteristics of river floods and flooding: A global overview, 1985–2003. Irrig. Drain 2006, 55-S1, S9–S21. [Google Scholar]
  3. Becker, A.; Grünewald, U. Flood Risk in Central Europe. Science 2003, 300, 1099. [Google Scholar] [CrossRef]
  4. Thieken, A.H.; Kreibich, H.; Müller, M.; Merz, B. Coping with floods: Preparedness, response and recovery of flood-affected residents in Germany in 2002. Hydrol. Sci. 2007, 52, 1016–1037. [Google Scholar] [CrossRef]
  5. Johnson, C.; Penning-Rowsell, E.; Tapsell, S. Aspiration and reality: Flood policy, economic damages and the appraisal process. Area 2007, 39, 214–223. [Google Scholar] [CrossRef]
  6. Grünthal, G.; Thieken, A.H.; Schwarz, J.; Radtke, K.S.; Smolka, A.; Merz, B. Comparative Risk Assessments for the City of Cologne—Storms, Floods, Earthquakes. Nat. Hazards 2006, 38, 21–44. [Google Scholar] [CrossRef]
  7. De Moel, H.; Aerts, J.C.J.H. Effect of uncertainty in land use, damage models models and inundation depth on flood damage estimtes. Nat. Hazards 2011, 58, 407–425. [Google Scholar] [CrossRef]
  8. Qi, H.; Qi, P.; Altinakar, M.S. GIS-Based Spatial Monte Carlo Analysis for Integrated Flood Management with Two Dimensional Flood Simulation. Water Resour. Manag. 2013, 27, 3631–3645. [Google Scholar]
  9. Merz, B.; Thieken, A.H. Flood risk curves and uncertainty bounds. Nat. Hazards 2009, 51, 437–458. [Google Scholar] [CrossRef]
  10. Qi, H.; Altinakar, M.S. Simulation-based decision support system for flood damage assessment under uncertainty using remote sensing and census block information. Nat. Hazards 2011, 59, 1125–1143. [Google Scholar] [CrossRef]
  11. Van der Sande, C.J.; de Jong, S.M.; de Roo, A.P.J. A segmentation and classification approach of IKONOS-2 imagery for land cover mapping to assist flood risk and flood damage assessment. Int. J. Appl. Earth Obs. Geoinf. 2003, 4, 217–229. [Google Scholar] [CrossRef]
  12. Dutta, D.; Herath, S.; Musiake, K. A mathematical model for flood loss estimation. J. Hydrol. 2003, 277, 24–49. [Google Scholar] [CrossRef]
  13. Kates, R.W. Industrial Flood Losses: Damage Estimation in the Lehigh Valley; Research Paper 98; Department of Geography, University of Chicago: Chicago, IL, USA, 1965. [Google Scholar]
  14. White, G.F. Choice of Adjustment to Floods; Research Paper 93; Department of Geography, University of Chicago: Chicago, IL, USA, 1964. [Google Scholar]
  15. Vozinaki, A.E.K.; Kourgialas, N.N.; Karatzas, G.P. Estimation of Agricultural Flood Loss in the Koiliaris River Basin in Crete, Greece. Eur. Water 2012, 39, 53–63. [Google Scholar]
  16. Grigg, N.S.; Helweg, O.J. State-of-the-art of estimating flood damage in urban areas. Water Resour. Bull. 1975, 11, 379–390. [Google Scholar] [CrossRef]
  17. Zhai, G.; Fukuzono, T.; Ikeda, S. Modeling flood damage: Case of Tokai flood 2000. J. Am. Water Resour. Assoc. 2005, 41, 77–92. [Google Scholar] [CrossRef]
  18. Zhu, J.; Tang, C. Urban Flood Damage Estimation Using GIS and Remote Sensing. In Proceedings of the 3rd International Conference on Advanced Computer Theory and Engineering, Chengdu, China, 20–22 August 2010; pp. 232–237.
  19. Hammond, M.J.; Chen, A.S.; Djordjevic, S.; Butler, D.; Khan, D.M.; Rahman, S.M.M.; Haque, A.K.E. The development of a flood damage assessment tool for urban areas. In Proceedings of the 9th International Joint IWA/IAHR Conference on Urban Drainage Modelling, Belgrade, Serbia, 3–6 September 2012.
  20. Ward, P.J.; de Moel, H.; Aerts, J.C.J.H. How are flood risk estimates affected by the choice of return-periods? Nat. Hazards Earth Syst. Sci. 2011, 11, 3181–3195. [Google Scholar] [CrossRef]
  21. Merz, B.; Kreibich, H.; Thieken, A.H.; Schmidtke, R. Estimation uncertainty of direct monetary flood. Nat. Hazards Earth Syst. Sci. 2004, 4, 153–163. [Google Scholar] [CrossRef]
  22. Thieken, A.H.; Ackermann, V.; Elmer, F.; Kreibich, H.; Kuhlmann, B.; Kunert, U.; Maiwald, H.; Merz, B.; Müller, M.; Piroth, K.; et al. Methods for the evaluation of direct and indirect flood losses. In Proceedings of the 4th International Symposium on Flood Defence: Managing Flood Risk, Reliability and Vulnerability, Toronto, ON, Canada, 6–8 May 2008; pp. 1–10.
  23. Nicholas, J.; Holt, G.D.; Proverbs, D. Towards standardising the assessment of flood damaged properties in the UK. Struct. Survey 2001, 19, 163–172. [Google Scholar] [CrossRef]
  24. Kreibich, H.; Seifert, I.; Merz, B.; Thieken, A.H. Development of FLEMOcs—A new model for the estimation of flood losses in the commercial sector. Hydrol. Sci. J. 2010, 55, 1302–1314. [Google Scholar] [CrossRef]
  25. Elmer, F.; Thieken, A.H.; Pech, I.; Kreibich, H. Influence of flood frequency on residential building losses. Nat. Hazards Earth Syst. Sci. 2010, 10, 2145–2159. [Google Scholar] [CrossRef]
  26. Merz, B.; Kreibich, H.; Lall, U. Multi-variate flood damage assessment: A tree-based data-mining approach. Nat. Hazards Earth Syst. Sci. 2013, 13, 53–64. [Google Scholar] [CrossRef]
  27. Apel, H.; Aronica, G.T.; Kreibich, H.; Thieken, A.H. Flood risk analyses—How detailed do we need to be? Nat. Hazards 2009, 49, 79–98. [Google Scholar] [CrossRef]
  28. Merz, B. Hochwasserrisiken: Grenzen und Möglichkeiten der Risikoabschätzung; Schweizerbart: Stuttgart, Germany, 2006. (In German) [Google Scholar]
  29. Taubenböck, H.; Wurm, M.; Netzband, M.; Zwenzner, H.; Roth, A.; Rahman, A.; Dech, S. Flood risks in urbanized areas—Multi-sensoral approaches using remotely sensed data for risk assessment. Nat. Hazards Earth Syst. Sci. 2011, 11, 431–444. [Google Scholar] [CrossRef] [Green Version]
  30. Banzhaf, E.; Höfer, R. Monitoring Urban Structure Types as Spatial Indicators With CIR Aerial Photographs for a More Effective Urban Environmental Management. IEEE J. Sel. Top. Appl. Earth Obs. Remote Sens 2008, 1, 129–138. [Google Scholar] [CrossRef]
  31. Bochow, M. Automatisierungspotenzial von Stadtbiotopkartierungen durch Methoden der Fernerkundung; Fachbereich Mathematik/Informatik, Universität Osnabrück: Osnabrück, Germany, 2010. [Google Scholar]
  32. Bochow, M.; Peisker, T.; Roessner, S.; Segl, K.; Kaufmann, H. Towards an automated update of urban biotope maps using remote sensing data: What is possible? In Urban Biodiversity and Design; Conservation science and practice series, 7; Wiley-Blackwell: Oxford, UK, 2010; pp. 255–272. [Google Scholar]
  33. Bochow, M.; Taubenböck, H.; Segl, K.; Kaufmann, H. An automated and adaptable approach for characterizing and partitioning cities into urban structure types. In Proceedings of the 2010 IEEE International Geoscience and Remote Sensing Symposium (IGARSS), Honolulu, HI, USA, 25–30 July 2010; pp. 1796–1799.
  34. Wurm, M.; Taubenbock, H.; Roth, A.; Dech, S. Urban structuring using multisensoral remote sensing data: By the example of the German cities Cologne and Dresden. In Proceedings of the Urban Remote Sensing Joint Event, Shanghai, China, 20–22 May 2009; pp. 1–8.
  35. Statistisches Landesamt des Freistaates Sachsen. Statistisches Jahrbuch Sachsen 2012; Statistisches Landesamt des Freistaates Sachsen: Kamenz, Germany, 2012. (In German)
  36. Pesch, F.; Sendlewska, A.; Sperle, T.; Goebel, J.; Schmal, P.; Hofheinz, A.; Dippold, F. Lebendige Geschichte—Urbane Stadtlandschaft. In Dresden—Planungsleitbild Innenstadt 2008; Landeshauptstadt Dresden: Dresden, Germany, 2008. (In German) [Google Scholar]
  37. Sukopp, H. Die ökologische Gliederung der Stadt. In Stadtökologie; Sukopp, H., Wittig, W., Klausnitzer, B., Eds.; Gustav Fischer: Stuttgart, Germany, 1998; pp. 316–372. (In German) [Google Scholar]
  38. Internationale Kommission zum Schutz der Elbe (Ed.) Dokumentation des Hochwassers vom August 2002 im Einzugsgebiet der Elbe; Internationale Kommission zum Schutz der Elbe: Magdeburg, Germany, 2004. (In German)
  39. Deutsches Komitee für Katastrophenvorsorge—German Committee for Disaster Reduction (DKKV). Hochwasservorsorge in Deutschland—Lernen aus der Katastrophe 2002 im Elbegebiet; DKKV: Bonn, Germany, 2003. (In German) [Google Scholar]
  40. Bundesamt für Kartographie und Geodäsie (BKG Geodatenzentrum). Digitales Landschaftsmodell 1:25 000 Basis-DLM; BKG Geodatenzentrum: Frankfurt am Main, Germany, 2005; In German). [Google Scholar]
  41. LfUG Saxon State Agency for Environment and Geology. Personal interview with Grafe. 2003
  42. Korndörfer, C. The flood in August 2002—Consequences on flood protection for the city of Dresden. In Flood Risk Management: Hazards, Vulnerability and Mitigation Measures; Springer: Dordrecht, The Netherlands, 2006; pp. 267–273. [Google Scholar]
  43. Sächsische Aufbaubank. Damage to residential buildings caused by the Elbe flood in 2002. Personal communication, 2005. [Google Scholar]
  44. Sächsische Aufbaubank. Flood compensation data of 16 August 2004. Unpublished work, 2004. [Google Scholar]
  45. Sächsische Staatskanzlei. Flood compensation data of 17 April 2003. Unpublished work, 2003. [Google Scholar]
  46. Merz, B.; Kreibich, H.; Schwarze, R.; Thieken, A.H. Assessment of economic flood damage. Nat. Hazards Earth Syst. Sci. 2010, 10, 1697–1724. [Google Scholar] [CrossRef]
  47. Beak Consultants GmbH. Ermittlung des Schadenpotenzials von Hochwassern der Elbe, der Gewässer erster und zweiter Ordnung und des Grundwassers auf dem Gebiet der Stadt Dresden—Hochwasser Dresden 2002; Beak Consultants GmbH: Freiberg, Germany, 2006. (In German) [Google Scholar]
  48. Kreibich, H.; Meyer, S.; Thieken, A.H. Schadensmodellierung auf der Basis von Landnutzungseinheiten (Mesoskala). Mitt. d. DGFZ u. seiner Partner 2012, 6, 73–88. (In German) [Google Scholar]
  49. Thieken, A.H.; Müller, M.; Kreibich, H.; Merz, B. Flood damage and influencing factors: New insights from the August 2002 flood in Germany. Water Resour. Res. 2005, 41, 1–16. [Google Scholar]
  50. INFAS GEOdaten. In Das DataWarehouse; INFAS GEOdaten GmbH: Bonn, Germany, 2005.
  51. Thieken, A.H.; Olschewski, A.; Kreibich, H.; Kobsch, S.; Merz, B. Development and evaluation of FLEMOps—A new flood loss estimation model for the private sector. Flood Recovery, Innovation and Response, WIT Press: Chichester, UK, 2008; 315–324. [Google Scholar]
  52. Kleist, L.; Thieken, A.H.; Köhler, P.; Müller, M.; Seifert, I.; Borst, D.; Werner, U. Estimation of the regional stock of residential buildings as a basis for a comparative risk assessment in Germany. Nat. Hazards Earth Syst. Sci. 2006, 6, 541–552. [Google Scholar] [CrossRef]
  53. Kreibich, H.; Meyer, S.; Diekkrüger, B. Weiterentwicklung von FLEMOps zur Modellierung von Grundhochwasserschäden an Wohngebäuden. Hydrol. Wasserbewirtschaftug 2011, 55, 300–309. (In German) [Google Scholar]
  54. Statistisches Bundesamt (Federal Statistical Agency). Baupreisindizes November 2003; Statistisches Bundesamt: Wiesbaden, Germany. (In German)
  55. Kreibich, H.; Thieken, H.; Grunenberg, H.; Ullrich, K.; Sommer, T. Extent, perception and mitigation of damage due to high groundwater levels in the city of Dresden, Germany. Nat. Hazards Earth Syst. Sci. 2009, 9, 1247–1258. [Google Scholar] [CrossRef]
  56. Guyon, I.; Elisseeff, A. An introduction to feature extraction. StudFuzz 2006, 207, 1–25. [Google Scholar]
  57. Reunanen, J. Search strategies. In Feature Extraction—Foundations and Applications; Springer: Berlin/Heidelberg, Germany, 2006; pp. 119–137. [Google Scholar]
  58. Breiman, L.; Friedman, J.; Stone, C.J.; Olshen, R.A. Classification and Regression Trees; Chapman & Hall: New York, NY, USA, 1984. [Google Scholar]
  59. Wünsch, A.; Hermann, U.; Kreibich, H.; Thieken, A.H. The role of disaggregation of asset values in flood loss estimation: A comparison of different modeling approaches at the Mulde River, Germany. Environ. Manag. 2009, 44, 524–541. [Google Scholar]
  60. Pappenberger, F.; Beven, K.J. Ignorance is bliss: Or seven reasons not to use uncertainty analysis. Water Resour. Res. 2006, 42, W05302. [Google Scholar]
  61. Kourgialas, N.N.; Karatzas, G.P. A hydro-economic modelling framework for flood damage estimation and the role of riparian vegetation. Hydrol. Process. 2013, 27, 515–531. [Google Scholar] [CrossRef]
  62. Wind, H.G.; Nierop, T.M.; de Blois, C.J.; de Kok, J.L. Analysis of flood damages from the 1993 and 1995 Meuse Floods. Water Resour. Res. 1999, 35, 3459–3465. [Google Scholar] [CrossRef]

