1. Introduction
Water management in the twentieth century was based on the expansion of supply, via the construction of large dams, to meet human demands; although dams are important in reducing the incidence of diseases, in the expansion of hydropower, in irrigated agriculture and in flood control, they also result in social, economic and ecological losses [
1].
The intensity and variety of water usage in building facilities, associated with the precariousness of the infrastructure, operation and maintenance, result in excessive consumption. On the other hand, this exposes countless opportunities to rationalize this resource. Hence, the search for reduced water usage to meet the same needs is a priority, with the insertion of conservation and efficiency measures, Brandes
et al. [
2], especially those related to best operational practices, since they do not require high investments.
Therefore, the state government of Bahia, Brazil, sought efforts to rationalize the usage of water and energy in their administrative facilities, primarily driven by the need to reduce operational expenses, and, thus, commenced a partnership with the Network of Clean Technologies at the Federal University of Bahia (TECLIM/UFBA).
The main action of the partnership is to use the AGUAPURA VIANET System for daily consumption monitoring [
3]. This system enables the daily release of data on the web, which includes graphical presentations of daily and monthly accumulated consumption. The daily consumption figures are separated into weekdays, weekends and public holidays.
Unlike other research, where web use is associated with smart metering systems, in this work, the readings are taken by building staff and manually entered. This procedure is necessary to bring the people responsible for data reading and the building management staff closer to data analysis, sensitizing them to consumption variations. In accordance with authors, such as Stewart
et al. [
4], this is done so that those involved can interact with information components—search, display and attention—and, thus, use this information in the decision making process for rational consumption.
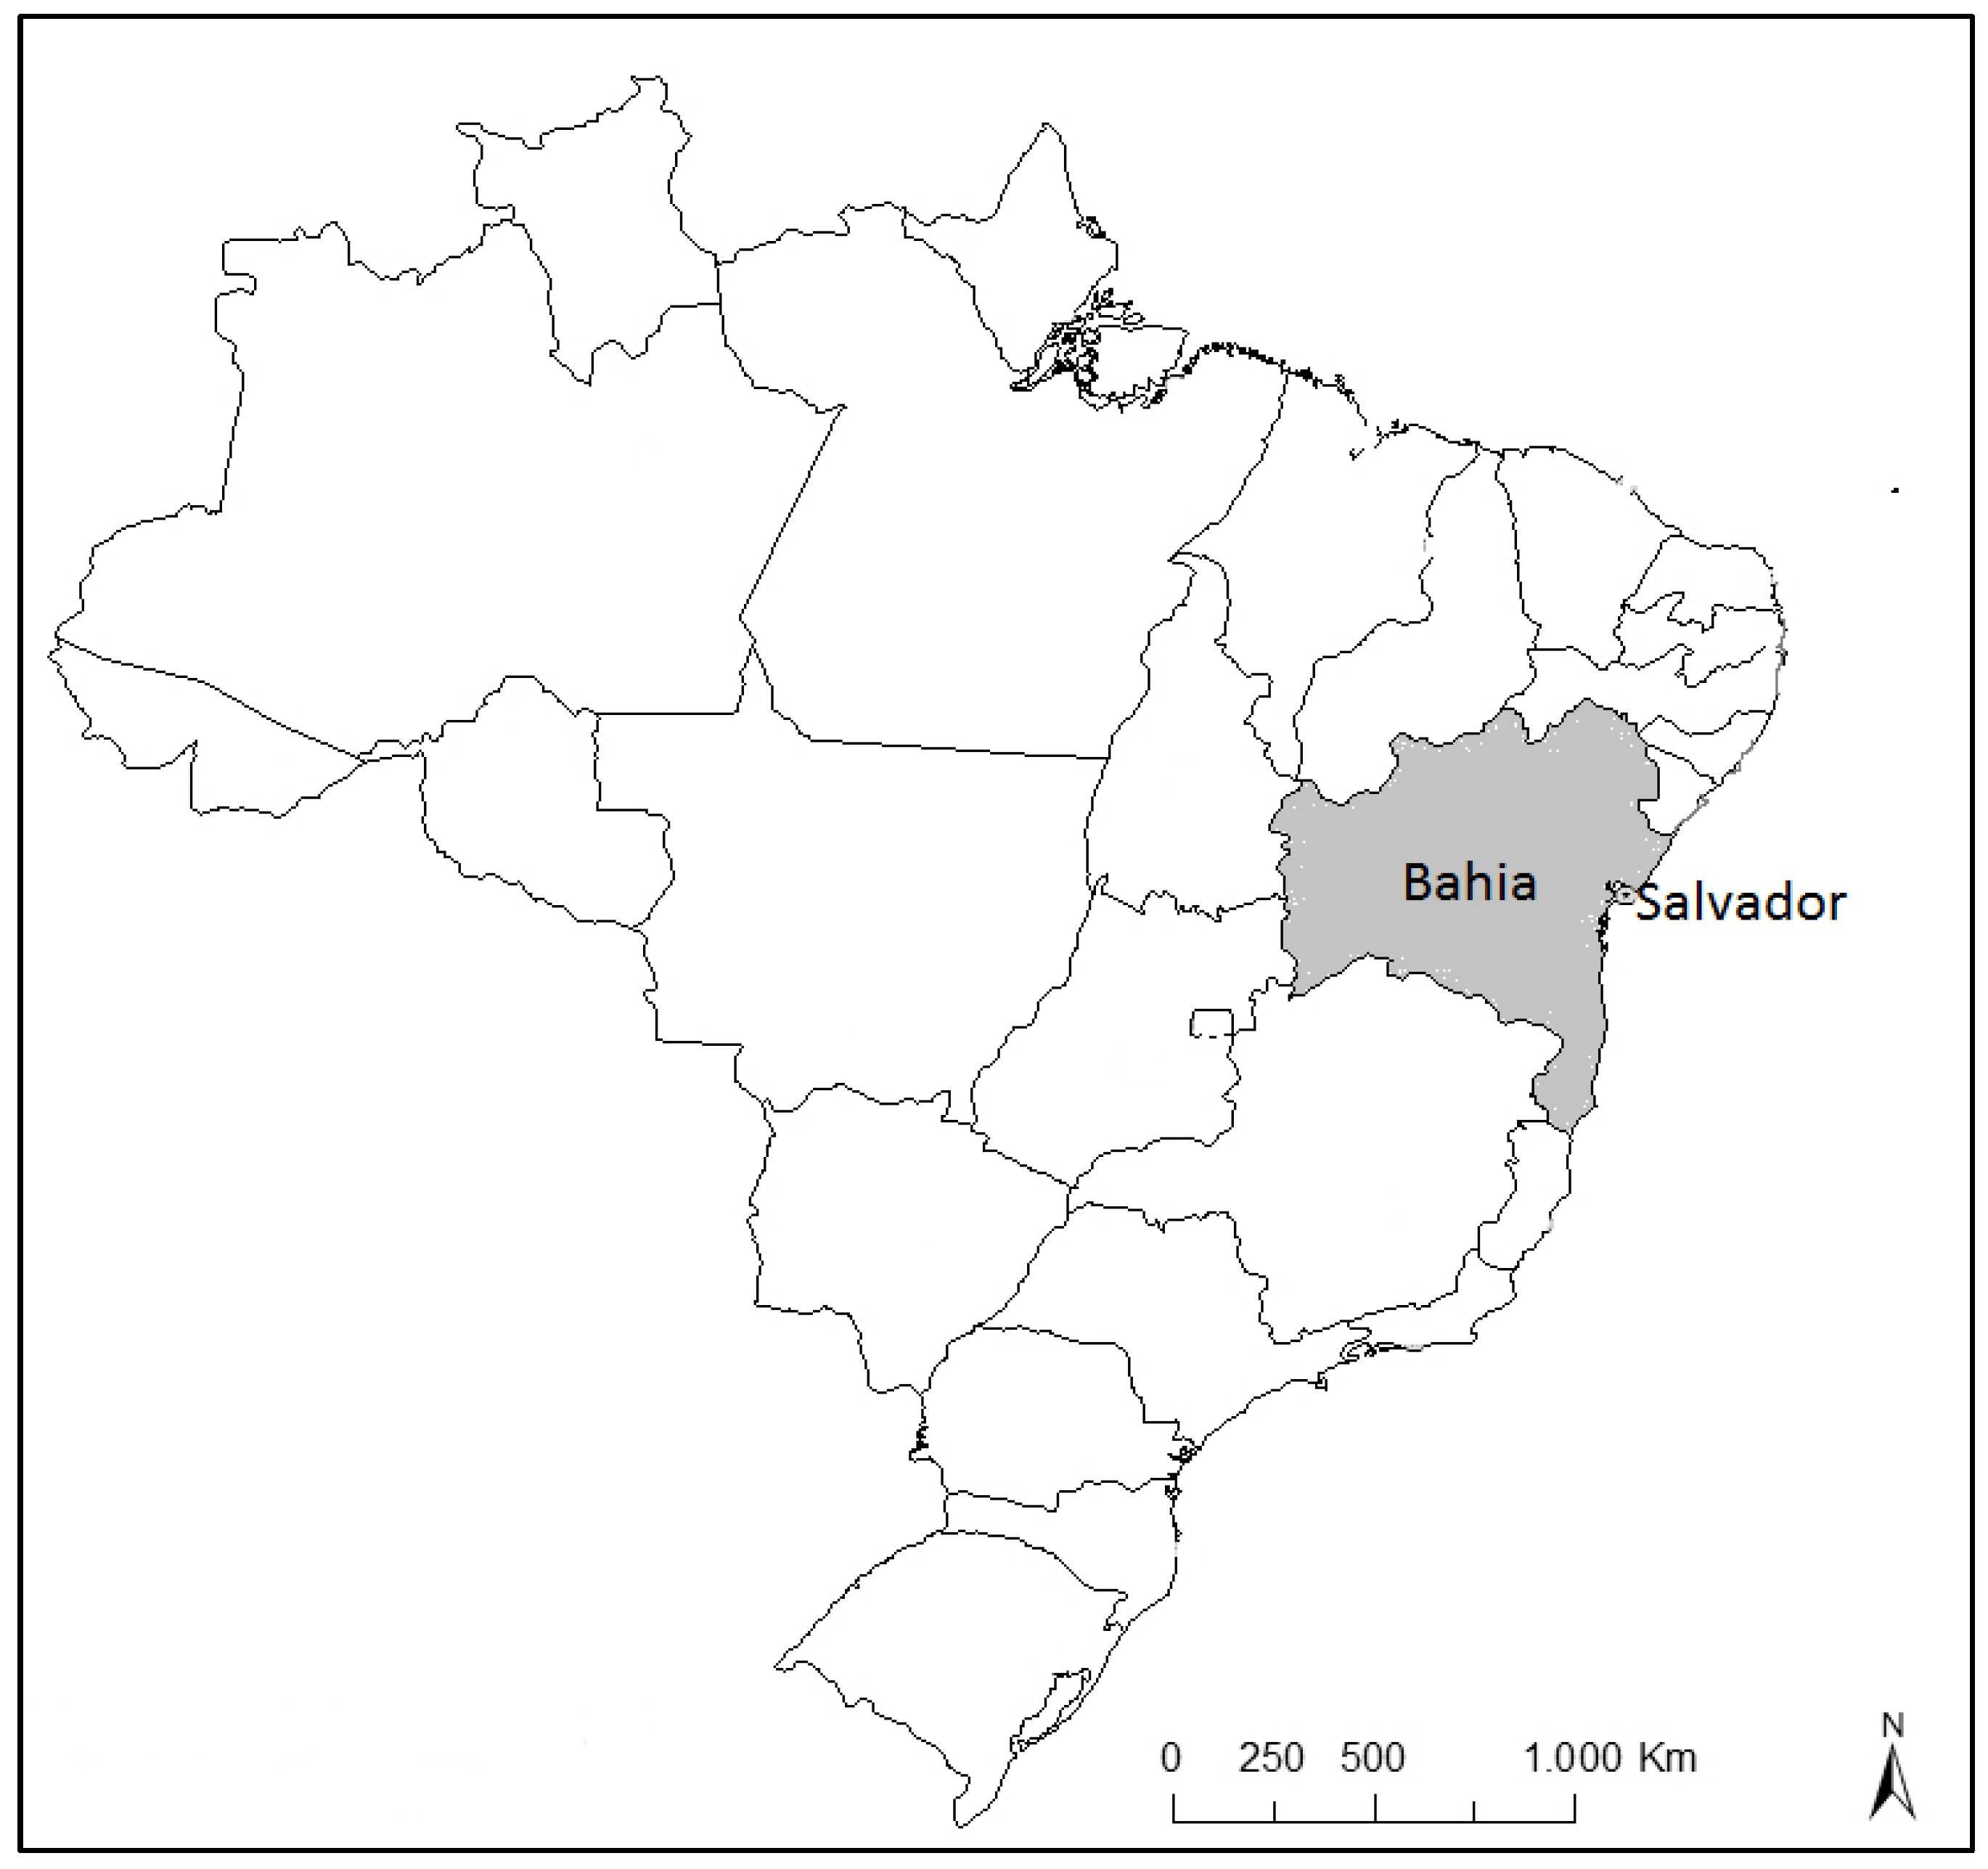
Thus, it was decided to implement the Program for the Rational Use of Water and Energy via web monitoring of consumption in 17 state public buildings of the Administrative Center of Bahia (CAB), located in the State capital. The Program reinforced important elements, such as the possibility of the State being an example of such efforts for rational water use, especially given the high energy and environmental cost of supplying water from the Paraguaçu River Basin to the Integrated Water Supply System of the Salvador Metropolitan Region, the severe drought of recent years in the water production basin, as well as the possible impacts of climate change [
5].
This article aims to present systematized actions on water consumption knowledge, among them, technical inspections, adjustments of plumbing equipment flow rates and rapid repair of leaks, and the respective savings achieved. These actions are the main part of the initiative, which is to implement water management at the location where the consumption occurs. Results for the efficient use of water in the 17 CAB buildings, from Stage I to Stage III, will also be presented.
2. Rational Water Consumption
Rational water consumption is imperative in the pursuit of environmental sustainability, efficient management and climate change mitigation [
6]. Brandes
et al. [
2] take an approach regarding the sustainability of water management through “soft paths”, which are guided by less water use to meet the same needs; hence, conservation and efficient use measures must be considered. This concept seeks to improve the efficiency of water usage, according to the qualitative and quantitative needs of each user and conservation measures, even including changes in water use habits. Brooks and Holtz [
7] mention that the smooth path includes technologies and policies focused on reducing demand rather than increasing supply.
Demand management becomes an instrument in the pursuit of sustainability. Brandes
et al. [
2] mentioned that demand management should be the first option, because it provides lower costs, quick turnaround and lower environmental impact. For Farias
et al. [
8], the concept of water demand management approaches the clean technology concept, since both have as priorities the practice of conservation and reuse, in which the optimization and rationalization of usage are included by the reuse of wastewater and by reducing both consumption and wastewater generation.
Some tools and techniques used to promote demand management were classified into four categories, Brooks (1988)
apud Rosegrant [
9]: laws, market-based measures, non-market measures (social pressure, information and consulting services) and direct interventions, such as repairing leaks, pressure adjustments and wastewater reuse. Gleick [
10] defines four key strategies for a water resource sustainable script: (1) reconsider the assumptions and definitions about water supply; (2) reduce water demand through conservation and efficiency programs; (3) develop better water management systems; and (4) integrate climate change considerations into water system decisions. The same author mentions necessary tools to make these changes, including new technologies, economic approaches, regulatory requirements and education.
Demand management can further be translated into structural and non-structural measures. For public water supply systems, structural measures consist of the use of alternative technologies in order to promote the reduction of water consumption, for example to improve the control and operation of water distribution networks. The non-structural measures translate into economic incentives, laws, regulations and environmental education, so that a change in the behavior of water users is achieved [
11,
12].
Corral-Verdugo [
13] researched psychological and situational factors in two Mexican cities. The research revealed that the possession of appliances and household items that consume water promotes its waste. It also showed that water shortage is a motivation to conserve and that the individuals who live in this condition develop greater conservation skills, which provides a reduction in water consumption.
According to Gleick [
14], the conditions of climate, hygiene, culture, lifestyle, diet, nature, city size, the availability of resources, water proximity to the domicile, access, consumption metering, network pressure, technology and income, among others, are key factors in water consumption in homes. Dolnicar
et al. [
6] mentioned that education programs, lengthy droughts, water restrictions and demand management initiatives may reduce water consumption. These authors cite work that includes consumption information among the factors that contribute positively to the conservation of water.
In the book “Water and Energy Conservation” by Kiperstok [
15], the elements that comprise or influence water consumption in buildings were presented, separating consumption by: necessary or desired, waste, losses in building facilities, environmental quality of the building and facilities and control level. The first item relates to the amount of water that is necessary to ensure hygiene and health conditions, considering consumption performed consciously by users, aiming to satisfy their needs for pleasure and relaxation associated with water. Waste is not a necessary or desired consumption, which is associated with avoidable losses due to user contact with sanitary appliances, is caused directly by the user or is induced by the equipment characteristics. Losses in building facilities are associated with leaks, which are dependent on the installation characteristics (material, age, maintenance, pressure to which facilities are subjected). The characteristics of a building that allow or encourage the use of alternative water sources, such as rainwater and wastewater reuse, comprise the environmental quality of the building and facilities, and the control level is associated with metering and provides knowledge of consumption, thus enabling demand management.
Accordingly, Stewart
et al. [
4] proposed a web-based system of knowledge management as a tool for the planning and rationalization of water consumption and the integration of smart metering with end-use water consumption data, networks of wireless communication and management information systems, to provide real-time information on how, when and where water is being consumed. Through this system, the user was allowed to examine the daily, weekly and monthly consumption, segregated by categories of final water use, with online alarms to indicate potential causes for excessive water use (for example, internal leaks). The conclusions of this work include the transfer of water consumption data into information and knowledge, enabling one to predict consumer trends and identify opportunities for conservation, enriching the understanding of consumer behavior.
Numerous studies of rational consumption have been carried out. Proença and Ghisi [
16], Sautchúk [
17] and Kammers and Ghisi [
18]. Proença and Ghisi [
16] evaluated the consumption of potable water in ten office buildings in Florianopolis, Brazil, by comparing different water sources—use of rainwater and greywater reuse—and replacing equipment—toilets and taps. Among the alternatives, the replacement of toilets combined with economic taps promoted a reduction of between 27.9 and 103.6 m
3/month, which equates to a savings of between 26.5% and 62.9%. Greywater reuse combined with rainwater use generated a reduction from 19.1 to 80.7 m
3/month, which equates to a savings of between 14.5% and 50.2%. In this type of building, the main changes implemented are the use of economic sanitary appliances, individual metering, leak detection and promoting user awareness [
18].
Vieira and Ribeiro [
11] and Proença and Ghisi [
19] estimated the consumption, segregated by end uses, through measuring the equipment flows or gathering information in the technical literature, determining the consumed volumes from information on user habits, identified through interviews and spreadsheets. Proença and Ghisi [
19] found that 56%–86% of the potable water uses in ten office buildings in Florianopolis, southern Brazil, were for non-potable purposes, such as cleaning and toilet flushing. These authors indicate the installation of more efficient toilet flushing systems and the use of rainwater and greywater as important sources for non-potable usage, essential to reduce the demand for potable water.
4. Method
The state government of Bahia, Brazil, sought efforts to rationalize the usage of water and energy in their administrative facilities, primarily driven by the need to reduce operational expenses, and, thus, commenced a partnership with the Network of Clean Technologies at the Federal University of Bahia, by monitoring water and energy consumption in public agencies since June 2008. This monitoring has been performed with the support of TECLIM/UFBA, and it has been executed in three steps. Steps I and II occurred in the following periods: from June 2008 to December 2008, and from January 2010, to December 2011, respectively. Step I aimed to identify which units would be contemplated for monitoring, since the structure of the Bahia State Government has approximately 3000 contracts with the public water utility. It should be pointed out that only information about the monthly consumption emitted by the water utility bill until that period is available. In this step, 17 buildings located in BAC were selected. In Step II, the daily monitoring and continuous logging of water and energy consumption and routine inspections in the 17 buildings to conduct leak tests began. For that, the AGUAPURA VIANET System developed by TECLIM/UFBA was utilized. In Step III, the monitoring was expanded for other State buildings. The present article is limited to exhibiting the results of building units located in BAC, although 100 others have already adhered to the Program.
By starting the Program, it was noticed that there was not enough data nor information about building installations and the consumption to allow the execution of water management. Because of this, initially, it was necessary to know, in as disaggregated a manner as possible, the consumption in order to identify the intervention to reduce it; so, the AGUAPURA VIANET System, developed by TECLIM, was used.
Given the lack of the development of a communication plan to encourage users’ awareness and environmental labelling, as well as due to the characteristics of the exceeded lifetime of the plumbing facilities, the precariousness of preventive and corrective maintenance and administrative barriers to the acquisition and installation of new equipment, the program emphasized loss detection from daily monitoring of water consumption, it being necessary to create Ecoteams with the commitment of the principals of the units to the Program purposes.
The consumption monitoring of the 17 public headquarters has been conducted since June 2008, via the AGUAPURA VIANET System [
3]. This system consists of an online tool for the monitoring and control of water consumption. It generates daily and monthly charts of water and energy consumption from the daily input of water and energy meter readings. This allows for the insertion of interpretive field observations on consumer behavior and other registration information. The insertion of observations is motivated by abnormal events that could explain consumption variations identified in the graphs. The system also provides an interface for the registration of consumption points, encouraging knowledge of the consumption pattern of each building, facilitating the identification of abnormalities and quickly indicating the existence of leaks or waste [
20].
By these means, the principal of each building unit can obtain a range of reports, which express, for example, the daily consumption of water and energy and which can be compared against the performance of other units with similar profiles.
4.1. Creation and Consolidation of Ecoteams
The Ecoteam is an administrative body, bound to the administrative directors or equivalent entities of the building units, that manages and coordinates the deployment, operation and consolidation of the Program for the Rational Use of Water and Energy in the State Public Buildings included in the program. It was designed to be composed of a coordinator, his deputy and other members mobilized to ensure greater propagation to improve the Program, having a size proportional to the unit size, complexity and number of buildings. In practice, so far, the Ecoteams have been effectively comprised of only one or two people.
The following criteria are required of its members: to be known and possess leadership qualities among staff; to demonstrate understanding of the Program, to adhere to its principles, to have recognized sensitivity to environmental issues and to have availability to implement its procedures; to know the location and peculiarities of the water facilities; to participate in the training provided by the Program; and to be able to articulate with the unit segments directly or indirectly involved with the use of resources.
The good performance of an Ecoteam requires the accomplishment of the following actions: to perform data collection and water consumption recording in the AGUAPURA VIANET System; to promote ongoing maintenance and adjustment of building plumbing facilities, with a view toward rationalizing water use; to monitor and analyze information processed in the system and, upon finding a consumption change/abnormality, adopt appropriate solutions; and to meet and enforce the goals of the consumption unit, monitoring them and taking the necessary actions to rectify the course. Indexes and consumption goals, as well as the compliance or not, should be disclosed to unit managers and users. The goals are tools for consolidated management that firmly commit to a desirable future through efforts to reach a value set in a certain timeframe.
The proposition of goals was performed for each of the buildings in the Program, considering their main characteristics, the analysis of historical data from public utility bills and the analysis of data recorded in the AGUAPURA VIANET System compared with major atypical features. Linked to these analyses, actions of local efficiency were listed to support the achievement of goals, being proposed and agreed upon at a meeting in the building unit between UFBA, the Administration Department, the Ecoteam and the unit director.
The Ecoteam should also encourage employees to: adopt more responsible environmental practices; monitor the performance of preventive maintenance; record in the system the identified occurrences, as well as the maintenance service measures taken to repair them or occurrences that will be the object of future consumption efficiency actions; evaluate proposals for equipment replacement by more efficient models; promote or organize events—lectures, movies, text distribution, stickers and send emails to encourage building users to engage in the rational use of water and participate in meetings about purchasing, ensuring the acquisition of plumbing apparatuses, equipment and accessories that consume less water and that are technically more suitable.
In practice, currently, most Ecoteam members are considered to be very busy with other administrative activities, and due to orders from their coordinators, they simply update the system with the meter readings. However, those who are motivated by personal engagement and identification with the project, in addition to entering the daily consumption readings, analyze and justify the abnormalities observed.
4.2. Commitment of Directors with the Program
Given the action possibilities mentioned in the previous section for rational water consumption and the relatively low performance of Ecoteams, the need to involve the directors of the units in the valuation process of consumption reduction measures was perceived. It is imperative that directors act according to the principles of natural resource rationalization, emphasizing this awareness to all departments located in the building and encouraging the Ecoteam.
After three and a half years since the beginning of the program, in January 2011, it was institutionalized by the publication of State Decree No. 12544 [
21]. The formalization of the program positively affected the engagement of the 17 participating units, especially regarding: the frequency of daily postings, system updating and response time of Ecoteams to questions via e-mails and/or the AGUAPURA VIANET System made by the UFBA monitoring team regarding atypical consumption.
In September 2012, the Program expanded its operations to other units of the State Government, which led to a change in the frequency of the Ecoteams’ activities at department buildings by the UFBA monitoring team, focusing on only the units with significant consumption and with indications of extreme water losses.
In August 2013, the State Government introduced Decree No. 14710/2013 [
22], seeking the curtailment of staffing and funding cost, and established an immediate 20% reduction in water and energy consumption. The decree arose from the need to cope with the frustration of the expectations of aggregating resources from existing partnerships with international agencies; rejected by the Finance Ministry. The low impact of the Decree in the participation of new units in the Program ratified the consequences of the lack of a continued communication plan, the lack of a labelling plan and, especially, the low level of mobilization of State managers. If participation had been extended, the units would reduce their consumption, with proper use of the tools suggested by the Program.
The water consumption reduction obtained ranged between departments depending on the leadership board, commitment and participation of users. As indicated by Marinho
et al. [
3], although legally established, the involvement of the units with the program ranged from enthusiastic to negligent attitudes. Indifference has been a constant.
4.3. Communication Plans and Environment Labelling
Communication is essential to the success of environmental management systems, as it acts as a liaison between the elements involved in the process and favors the realization of the proposed actions, though it has not been adopted as a primary step [
23].
Since Stage I of the Program, it was expected to create a communication and labelling plan in the environment, under the responsibility of the State Government with the assistance of the Federal University of Bahia, via the formulation and production of promotional materials. The plan aimed to implement approaches, such as labelling of equipment and their suitable forms of use, including assessing the impact of climate variability, especially recurrent droughts in the State. The promotion of communication and the dissemination of events via external media were identified as opportunities.
There must be a disclosure of the importance of efficient water consumption and its management inside and outside the building unit. In this regard, it is essential to encourage leaders and users regarding the importance of resource rationalization attitudes. Furthermore it is necessary to conduct periodic advertising campaigns, to publicize results and to implement procedures for efficient water and energy use.
It is essential to properly label the facilities, equipment and plumbing accessories, guiding users to reduce the waste of water services. The labels need to encourage proactive actions to reduce waste, besides frequent demands for actions in support of efficient basic resource use. Owing to the lack of the elaboration of a communication and labelling plan for the Program, graphic materials were not made available for disclosure in buildings. Hence, Ecoteams were encouraged to develop this material in partnership with the communication office of the unit. Due to the lack of a liaison between them, the Program has provided examples of signs to be printed by the unit and publicized near water consumption points. However, few have carried out this activity.
Some examples of the communication and labelling suggested are to: provide flushing instructions near dual flush toilets; encourage the use of urinals in men’s restrooms; provide the contact details of the Ecoteam in water consumption environments to enable users to report identified leaks; inform users that the gate valves must be immediately closed when there is a water leak; and publicize the results of rational water consumption in the building unit.
Some approaches tend to cause more impacts during publicizing aimed at changing behavior regarding the consumption of water. A study conducted in Australia found that the messages of good consumer practices attracted more attention and brought more results when they are presented together with the negative experiences of drought, water shortages and rationing [
6].
However, a communication and labelling plan was not prepared throughout the Program, and some labelling actions identified during inspections were empirical and very general, being the Ecoteams’ own initiatives.
4.4. Preventive and Corrective Maintenance of Plumbing Facilities by Hiring Company
Most of the participating units are characterized by having old plumbing facilities in lunch rooms and auditoriums that are used for garden watering and car washing. The 17 units have indirect distribution systems from the public network to consumption points with unnecessary underground water tanks in the current supply reality, and a pumping supply with a level regulated by buoys. Two units had ornamental pools with fish that have been disabled due to frequent leaks, and one unit had been adapted to a system to capture rainwater for car washing.
Owing to poor or lack of maintenance staff in each building, the Program proposed hiring maintenance staff by the State Government. The team would be enabled to act with preventive and corrective maintenance, according to the good practices of rational consumption. However, the contracting of external staff has not been feasible until now, due to administrative barriers.
In order to mitigate the impact of the absence of specific maintenance staff for the Program, improvised maintenance technicians were trained and, if in doubt, they call upon the UFBA team.
By joining the Program, the Ecoteam unit may inspect the building and register all consumption points and plumbing equipment. The AGUAPURA VIANET System provides a tool for registration and storage of this information, which shall be available to authorized stakeholders, including the manufacturer’s name and equipment flow. Flow rates should be analyzed and compared with proposed standards for immediate adjustment.
During inspection, leakage tests must be done, for example at the building water feeder and upper and lower water tanks, with the objective of identifying leaks in the building plumbing system. Once a leak is identified by the Ecoteam, they should immediately organize its repair, record its location and perform an action on VIANET.
The starting focus of the Program actions was to detect and combat losses, since this is a primary action, as there is no sense in investing in projects to improve environmental quality (water-saving equipment installation, rainwater use, greywater reuse) if there are significant losses in the system. Santos [
24] found that economic plumbing equipment installation in a public administrative building unit brought short-term benefits by reducing consumption, but in a few months, the consumption was the same as previous consumption, due to poor control of water losses, enhancing the importance of paying attention to possible leaks and the need to often adjust hydraulic equipment, in addition to divulging procedures about saving water.
Some units were undergoing a renovation, and a document with recommendations for flow regulation and the acquisition of water-saving equipment was elaborated for public buildings. The purpose of this document is to avoid new equipment purchases, when there is still the possibility of flow regulation, and to provide guidance on plumbing equipment purchases based on the quality guidelines of the Federal Government.
4.5. Daily Monitoring of Water Consumption
The Program’s core focus is the daily and continuous monitoring of water meter readings. Its principle consists of data inputting on the web, via the AGUAPURA VIANET System, which features, among other interfaces, graphical presentations of daily and monthly consumption of water and energy, since “one only controls what is known” [
3]. Daily consumptions are visually differentiated in weekdays, weekends and holidays.
Daily readings are performed by the Ecoteam—a staff group engaged in promoting consumption rationalization actions, who knows the physical structure of the building unit and coordinates with the maintenance team to conduct periodic scanning of plumbing equipment, amongst other tasks.
The possibility of a leak is detected when there is an elevation in the unit consumption pattern or when there is significant consumption during non-working weekends. If any abnormality in consumption occurs, the Ecoteam includes it in the observations field of the AGUAPURA VIANET System and, if necessary, performs leak tests in water tanks and scan consumption points.
The evaluation of atypical consumption events is performed by the TECLIM/UFBA team, through the analysis of the time series stability of daily entered readings in the AGUAPURA VIANET System, discriminated between working days and weekends. As BAC departments work on an administrative schedule, it is expected that consumption on weekends and holidays is insignificant when compared to weekdays. Thus, a limit of up to 10% was established between the consumption of these samples. If the difference is greater, the TECLIM/UFBA team sends an e-mail to the Ecoteam, so it can justify the abnormality. This procedure is also performed to analyze anomalies that occur on weekdays. In both situations, the Ecoteam enters the reasons for such system abnormalities in the observations field. For example these reasons could be: events carried out in the auditorium, leakage detection, etc. If there is no consistent justification for the consumption increase, an inspection is necessary for identification of the possible leakage.
These measures ensure that the data collected can be used by public managers and building maintenance teams to better manage consumption. The simple act of data inputting promotes understanding of consumption patterns and rapid identification of abnormalities and, in the case of water, indicates possible leaks. When no daily monitoring is done, the unit is at the mercy of the arrival of the water utility bill, with direct implication in leakage duration (at least 30 days) and its aftermath.
Within the University, an interdisciplinary consumption monitoring staff was established, composed of engineering students, engineers and an administrator, to monitor the actions of the Ecoteams in VIANET. It is up to the monitoring staff to encourage Ecoteams to identify leaks, indicated by atypical consumption, and to propose technical and management actions for rational consumption. The staff monitors, daily, the data quality entered in VIANET and also converses with Ecoteams in the search for solutions, as well as providing procedures in the VIANET System for: leak detection; buying economic plumbing equipment; flow regulation; improvement in restroom layouts; efficiency in the operation of storage and pumping systems; tank washing and garden watering.
4.6. Proposal for Adjustments to Hydraulic Equipment Flow
In the second half of 2013, all BAC restrooms were inspected in order to register consumption points, to measure hydraulic equipment flows and to propose mitigation actions. Hydraulic equipment flows were compared with those standards defined by the Program (
Table 1).
Table 1.
References for hydraulic equipment adjustment.
Table 1.
References for hydraulic equipment adjustment.
| Equipment | Standard |
|---|
| Self-closing taps | 0.2 ± 0.1 L/flux and 4 to 10 s/flux |
| Manual closing taps without sprinkler | 0.05 ± 0,01 L/s (3 L/min) |
| Manual closing taps with sprinkler | 0.03 ± 0.01 L/s (1.8 L/min) |
| Urinal valve | 0.3 ± 0.1 L/flux and 4 to 10 s/flux |
| Sanitary Shower | 0.1 ± 0.05 L/s (6 L/min) |
| Sanitary discharge | Disposal capacity of toilet bowl |
These references and procedures to adjust the flow of hydraulic equipment were available to Ecoteams at the website of the AGUAPURA VIANET System.
5. Results
5.1. Atypical Consumption Analysis
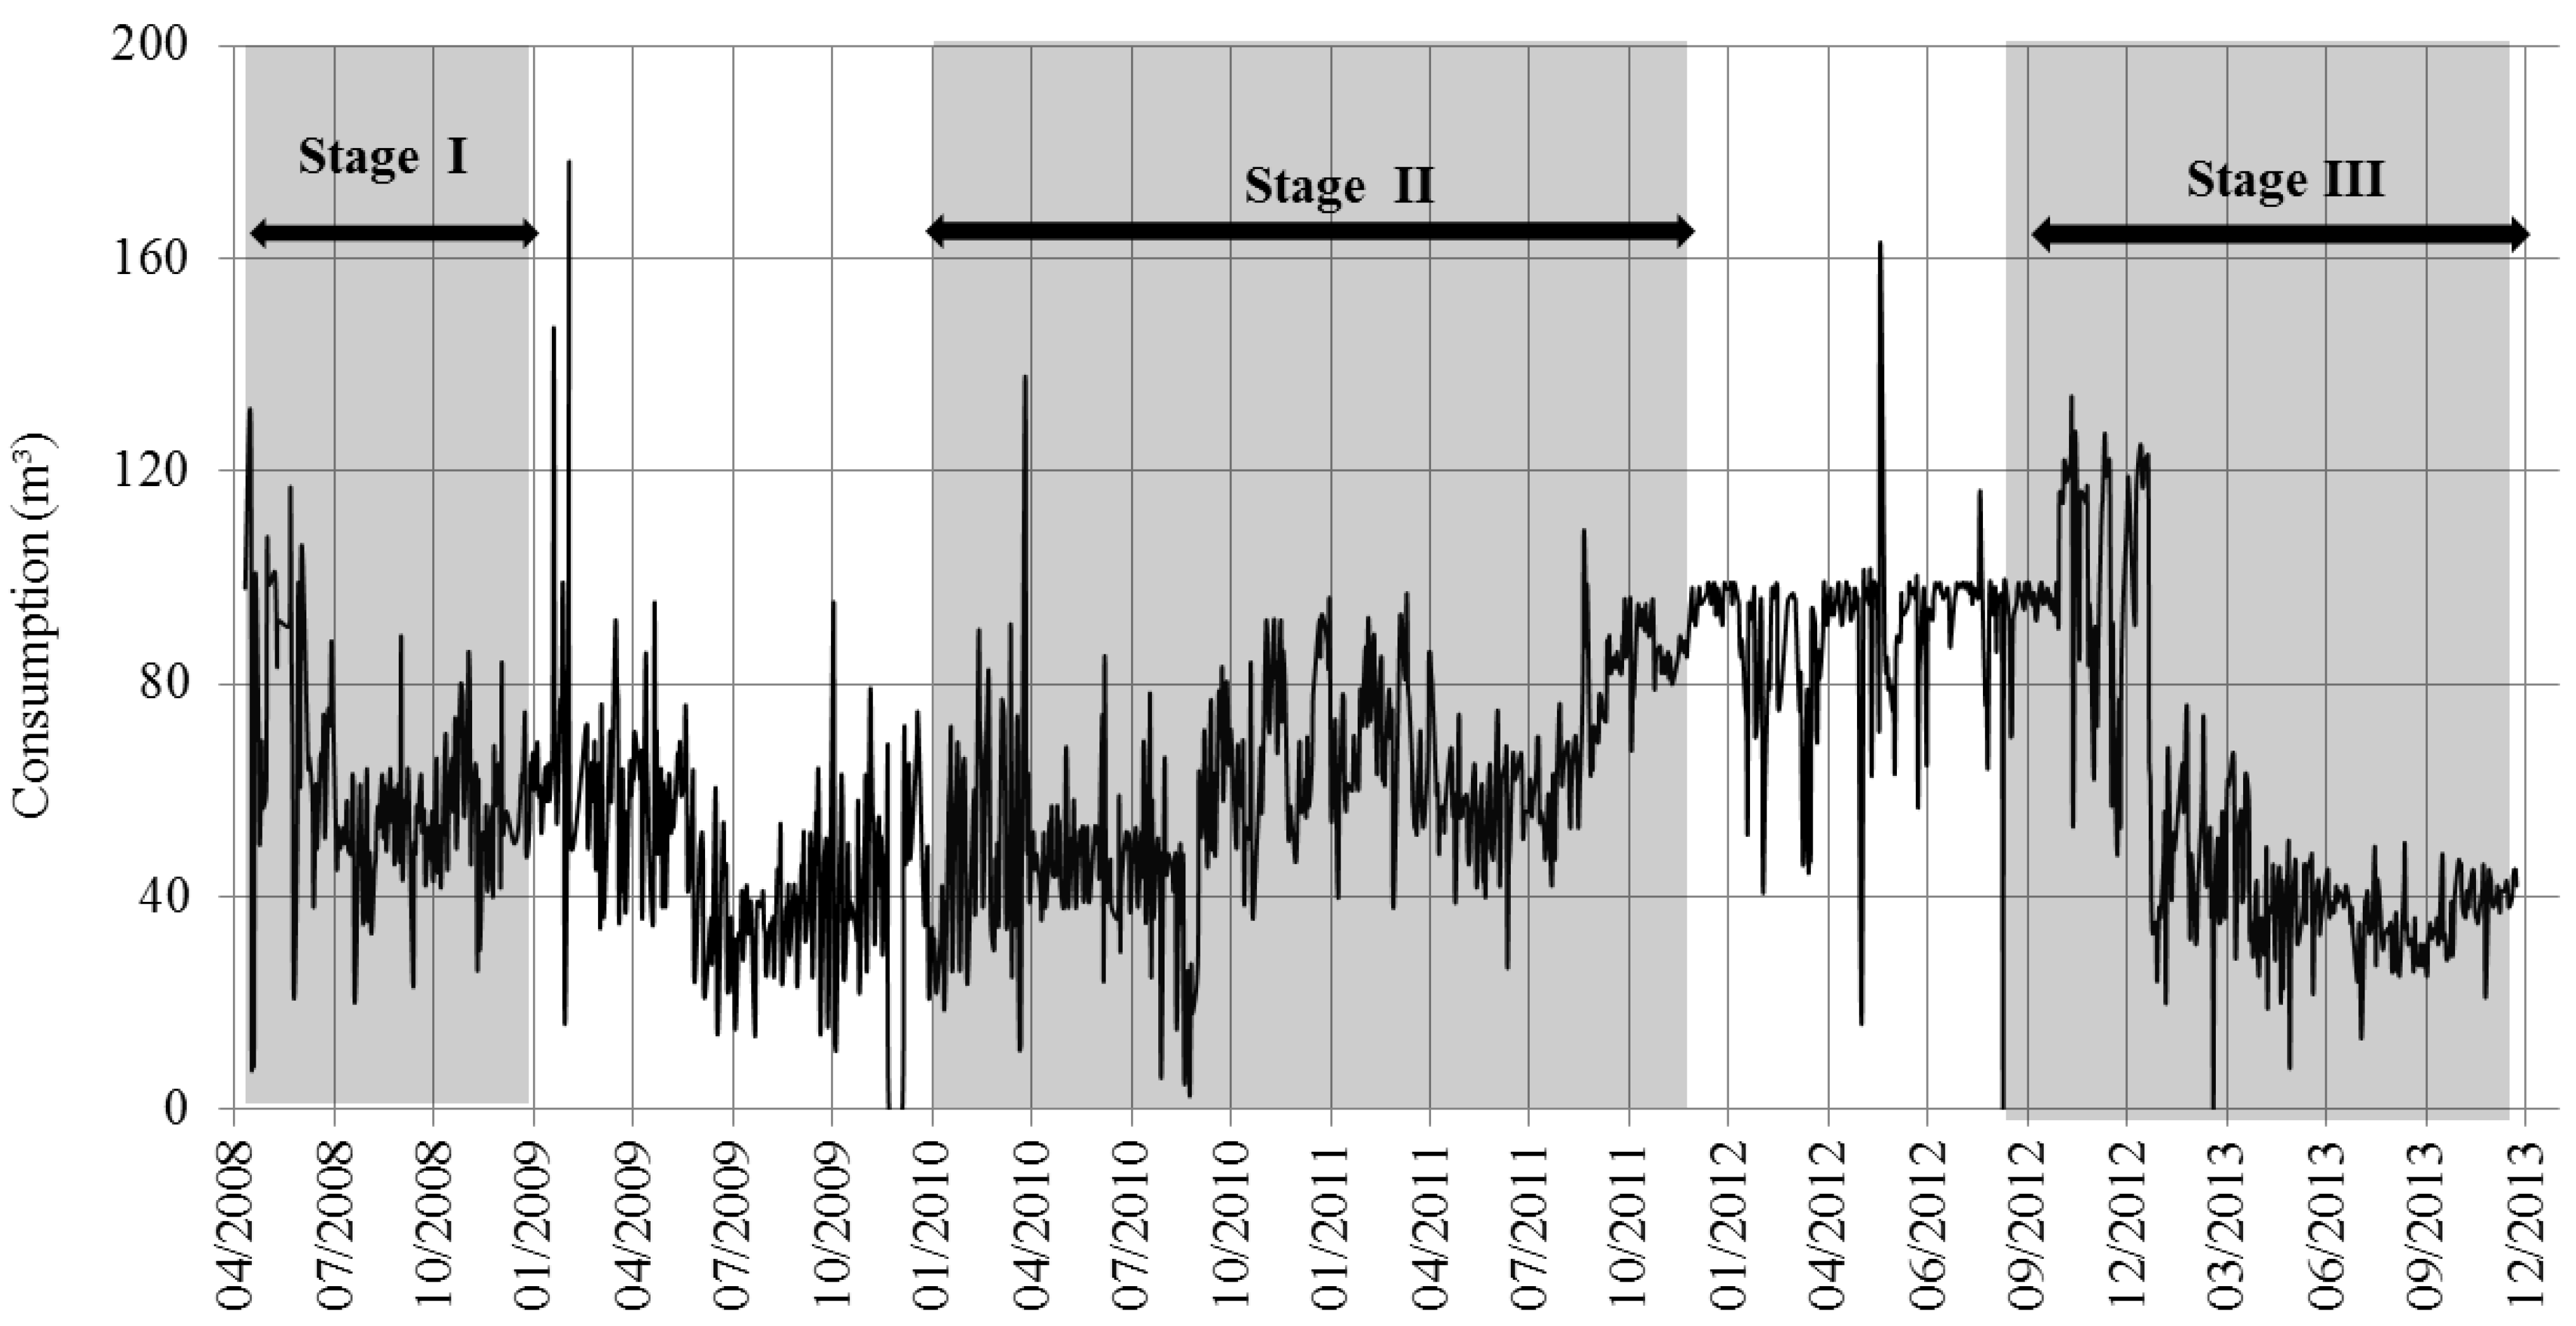
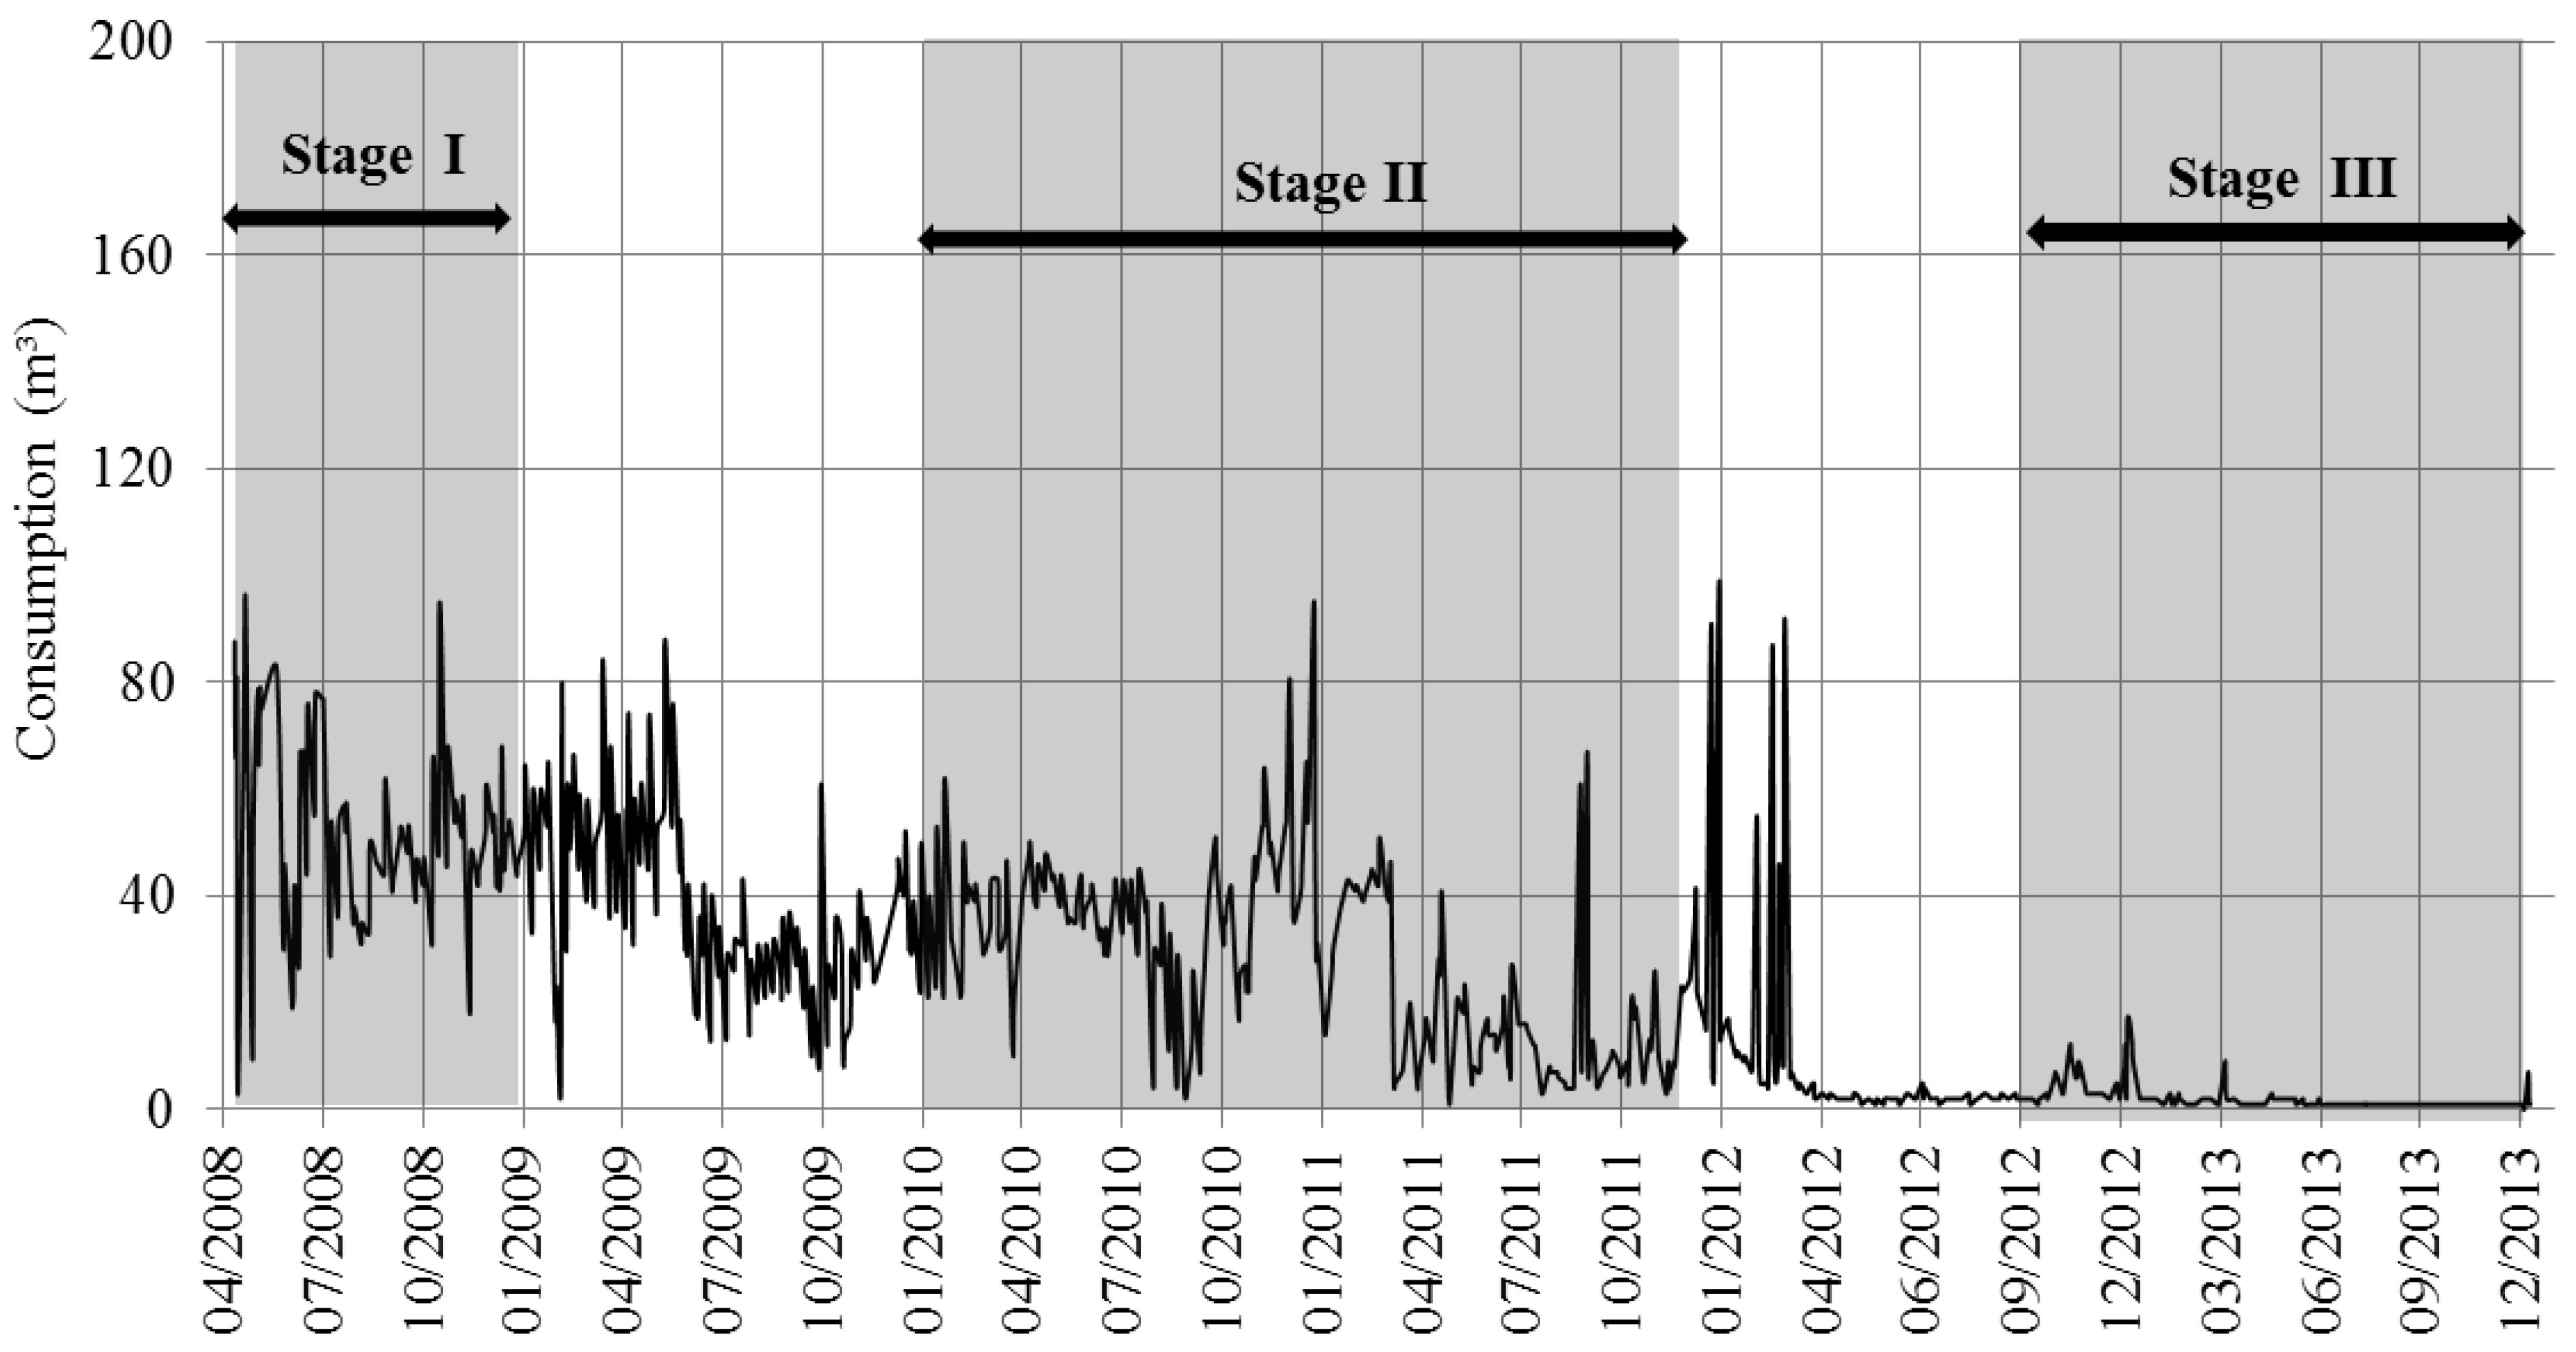
Figure 2 and
Figure 3 illustrate water consumption stratified by days with and without a working schedule, extracted from output data of the AGUAPURA VIANET System from the Department of Planning (SEPLAN). It can be observed from the second half of 2012 that there was a significant consumption reduction and stabilization on weekends and holidays, while on weekdays, this only occurred after 2013. It should be noted that consumption on weekdays in 2013 was lower than that observed in Step I of the Program on weekends and holidays. The reductions took place primarily due to changes in procedures for car washing, garden watering and leakage repairs in the building water feeder, which had been requested by the UFBA monitoring team many months earlier. These requests were made upon the identification of significant consumption on weekends and holidays and very high consumption on weekdays at SEPLAN compared to similar units. The unit median consumption on weekdays in 2013 was reduced to 39 m
3/day, while on weekends and holidays, only 2 m
3/day were consumed.
Other departments did not reach less than 10% of consumption on weekends and holidays compared to weekdays, a fact that reveals opportunities for consumption reduction.
The most common problems found in the participating units were buoy malfunctions, infiltrations and leakages in lower water tanks, leakages in the building water feeder and leakages in hygienic showers and flush valves.
Figure 2.
Water consumption at SEPLAN on weekdays; AGUAPURA VIANET System data.
Figure 2.
Water consumption at SEPLAN on weekdays; AGUAPURA VIANET System data.
Figure 3.
Water consumption at SEPLAN on weekends and holidays; AGUAPURA VIANET System data.
Figure 3.
Water consumption at SEPLAN on weekends and holidays; AGUAPURA VIANET System data.
5.2. Proposal for Adjustments to Hydraulic Equipment Flow
In the second half of 2013, all BAC restrooms were inspected in order to register consumption points, to measure hydraulic equipment flows and to propose mitigation actions. Hydraulic equipment flows were compared with those standards defined by the Program (
Table 1).
In general, restrooms are intended for collective use, with only a few private ones. Among the participating units of the Program, only the restrooms of the Institute for Environment and Water Resources (INEMA) buildings were not inspected. Therefore, 14 buildings were inspected. During this action, 222 sanitary showers (which are often stolen) were identified with recurring leakages. Thus, where possible, their deactivation was recommended.
More than 600 taps were also identified, with 371 self-closing taps, 227 manual closing taps, four self-closing sensor taps and eight disabled taps, or the restrooms were under renovation. According to reports from the Ecoteam members who accompanied the inspections, it is a common habit of users to forget to turn taps off, even in private restrooms. Flow measurement was performed by flow sampling. This procedure was performed on 361 self-closing taps and 168 manual closing taps; over 80% and 90% had a flow above the standard recommend range, respectively. The use of flow restrictors or flow rate regulators on taps, sanitary showers and bath showers was recommended.
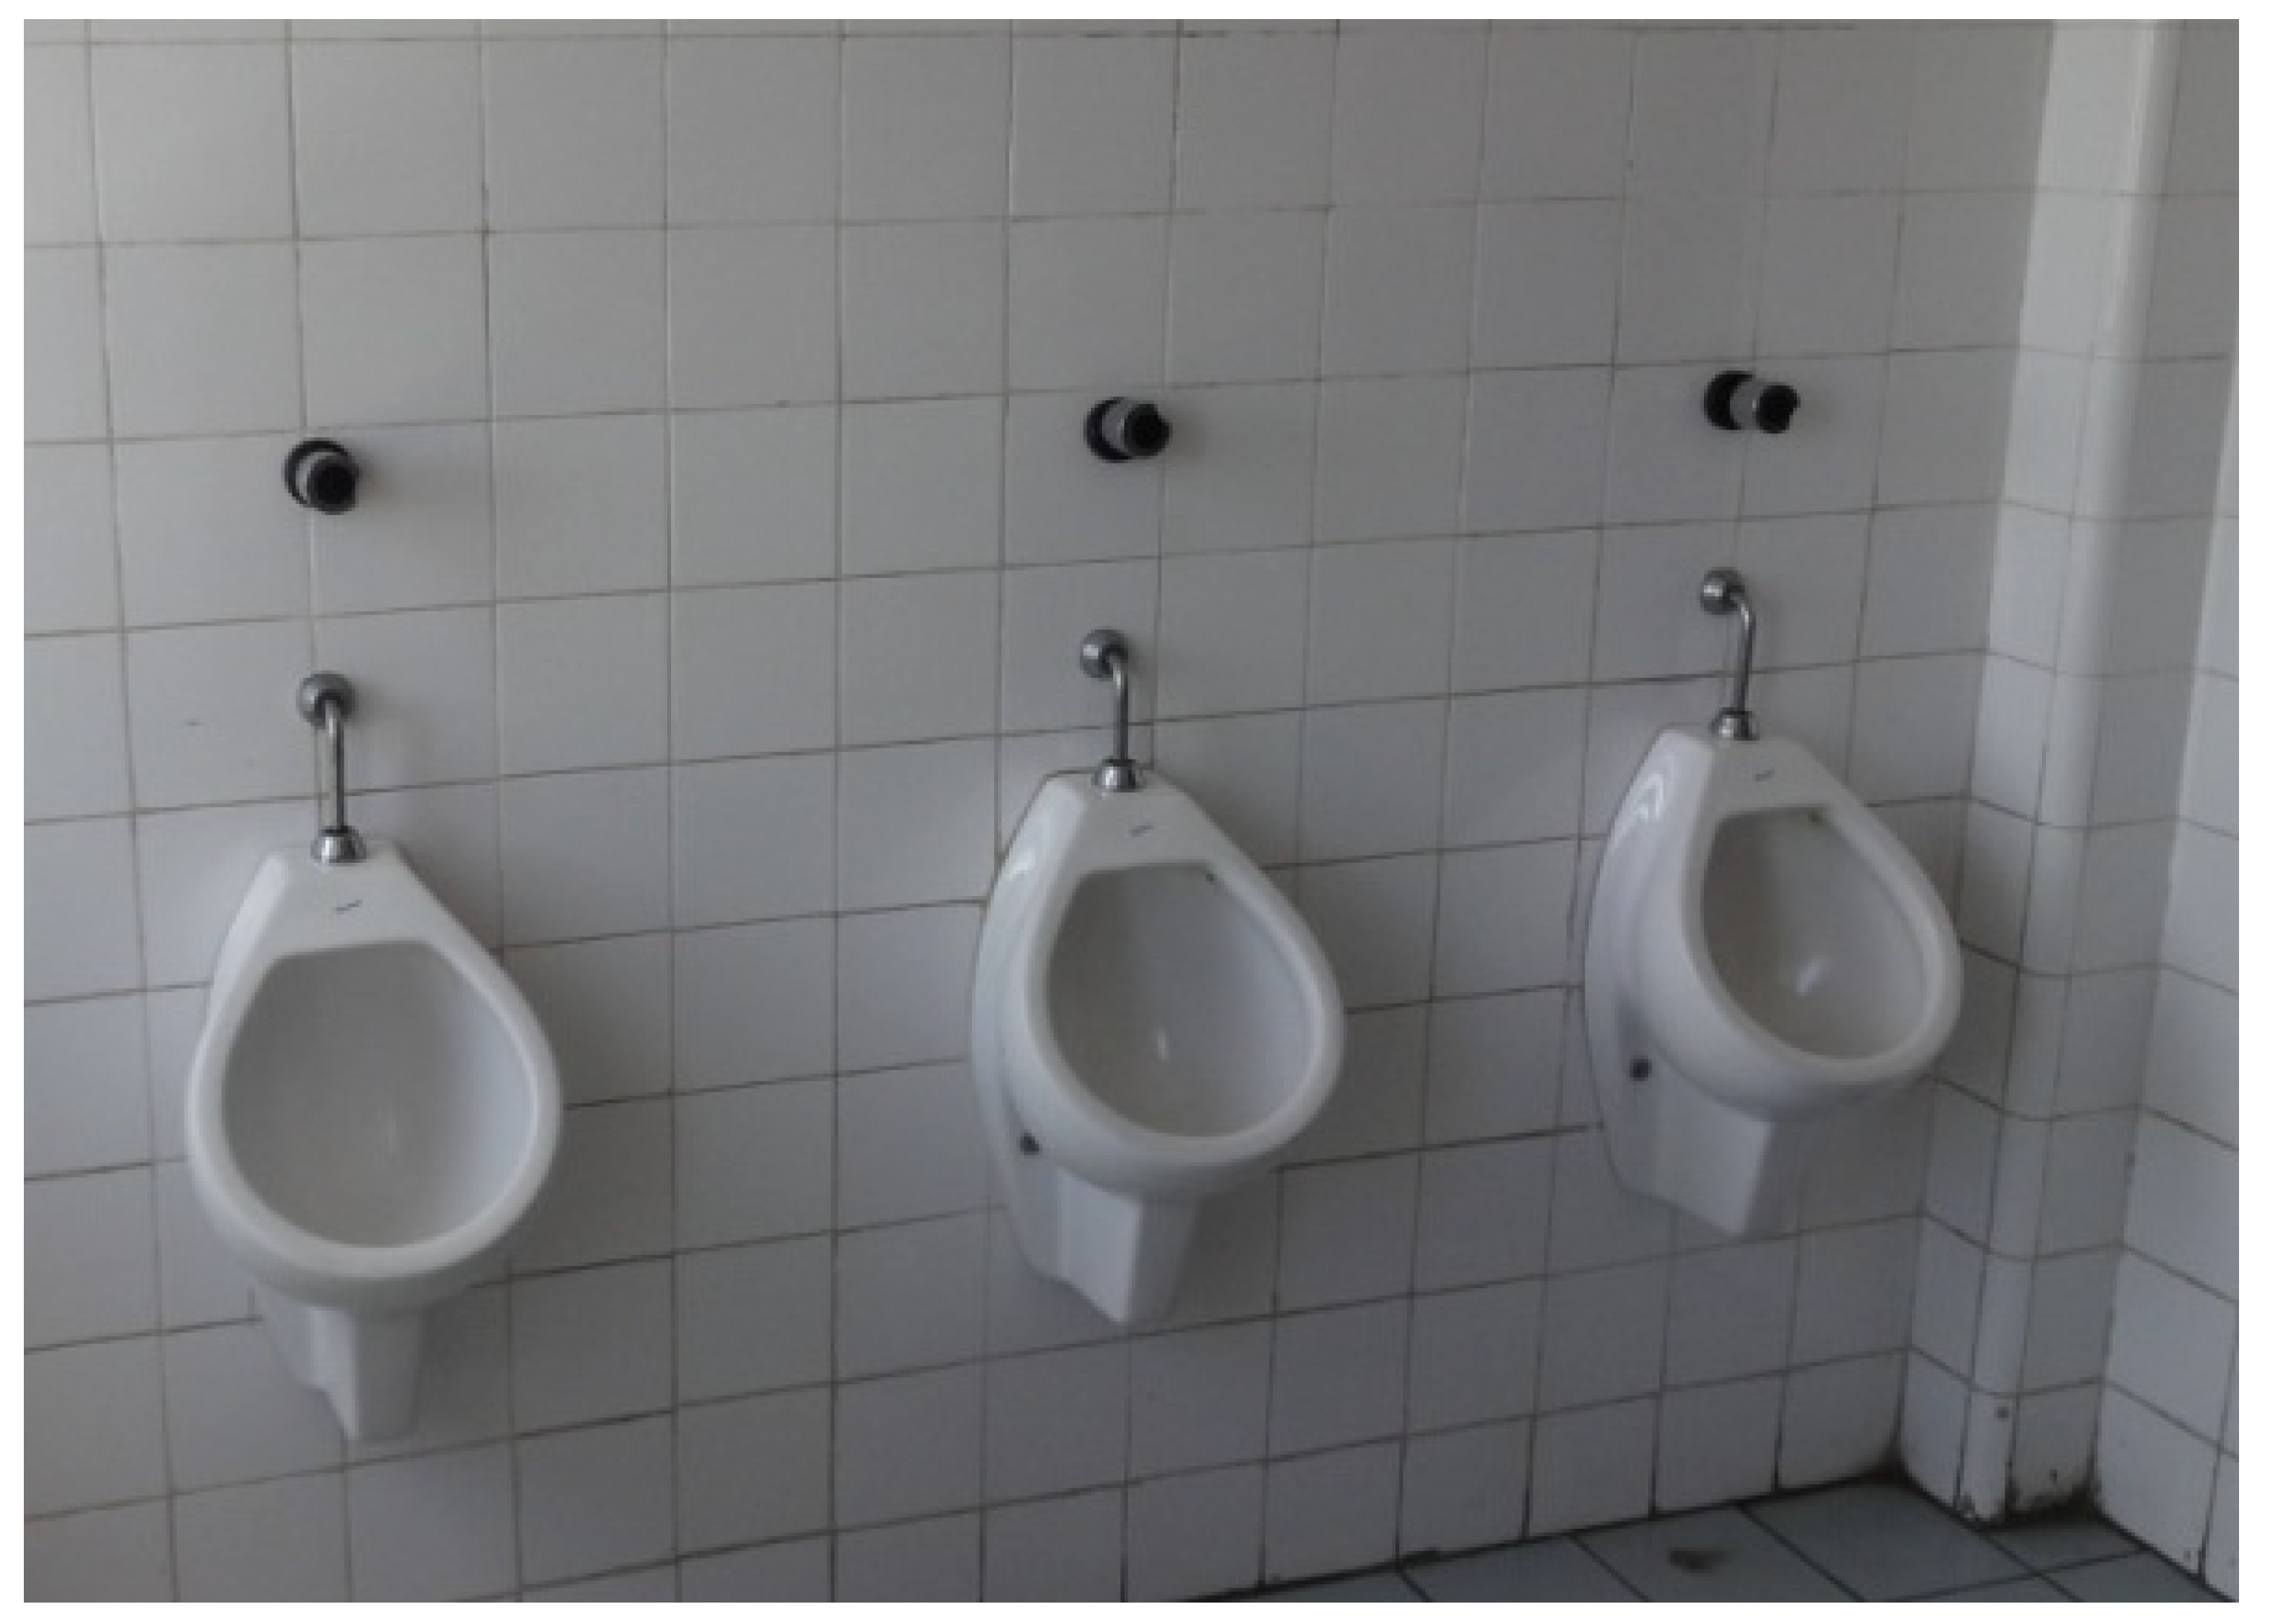
The research team inspected 160 urinals in men’s BAC restrooms, among these, 13 with manual closing valves, 135 with self-closing valves, three trough-type urinals and nine unidentified-type urinals. It was recommended that the trough type urinals be immediately replaced with private and individual urinals.
With the exception of one department, the installed urinals did not allow for privacy, as dividing screens were non-existent and/or inadequate (
Figure 4 and
Figure 5). It is important to install dividing screens at urinals to provide privacy during use and to perform equipment maintenance, thus avoiding the use of the toilet bowl just to urinate. It was recommended that the dividing screens be 1.3 m high and 0.7 m wide, installed at 0.60 m above floor level. Further, the quantity of urinals was not always sufficient.
As for the characterization of sets of toilet bowls and flushes, the following were identified: 344 coupled toilets, 165 wall-mounted flush valve toilets, 18 with valves attached to an overflow tube and 63 dual-drive coupled toilets; and in 29 toilets, inspections were not conducted. These sets of toilet bowls and flushes should only be replaced when their usage or adjustment is no longer possible.
Figure 4.
Urinals without proper dividing screens.
Figure 4.
Urinals without proper dividing screens.
Figure 5.
Broken urinal without proper dividing screens.
Figure 5.
Broken urinal without proper dividing screens.
It was recommended that in the case of restrooms with more than one wall-mounted flush valve toilet, only one should be regulated to flush feces (6 L per flush). The remaining flows should be adjusted to 1 L per flush, it being necessary to inform users which toilets are unique to urination and defecation and why only one is selected for this purpose. Among the reasons are: water savings, the greater frequency of urination use and the slight chance of two people needing to use the toilet to defecate at the same time. Coupled discharge toilets, dual-drive coupled discharge toilets or toilets with flush valves attached to an overflow tube shall have their flow regulated as guided by the manufacturers.
In Stage II, research was conducted to identify the profile of users in all departments. In the case of the Department of Transport Infrastructure, it was observed via an applied survey that 35% of women mentioned using the toilets to defecate, while 100% of people affirmed using it to urinate. As for male staff, 56% reported using the toilets to defecate. Similar results were found in other departments.
Table 2 shows the minimum savings to be achieved in each unit of BAC buildings after adjustment of wall-mounted flush valve toilets to the proposed flows. It is worth noting that the highest water consumption in public buildings is to fulfill uses in toilets. Therefore, adjustment of discharges is a priority and essential.
Table 2.
Proposal for wall flush toilets, replacement of urinals, the quantity that shall be adjusted to 1 L/flush and the reduction percentages after adjustments.
Table 2.
Proposal for wall flush toilets, replacement of urinals, the quantity that shall be adjusted to 1 L/flush and the reduction percentages after adjustments.
| Units | Quantity | Total demand (L/Flush of equipment) | Savings |
|---|
| Before | After | Before | After | Absolute (L) | Relative (%) |
|---|
| (12 L/Flush of equipment) | (6 L/Flush of equipment) | (1 L/Flush of equipment) |
|---|
| AGERBA/SEI | 16 | 8 | 8 | 192 | 56 | 136 | 71 |
| SAEB/SETRE | 4 | 4 | 0 | 48 | 24 | 24 | 50 |
| SEAGRI | 8 | 4 | 4 | 96 | 28 | 68 | 71 |
| SEC/SEDUR/SECTI | 6 | 4 | 2 | 72 | 26 | 46 | 64 |
| SEFAZ | 25 | 15 | 10 | 300 | 100 | 200 | 67 |
| SEINFRA | 8 | 5 | 3 | 96 | 33 | 63 | 66 |
| SEPLAN | 26 | 17 | 9 | 312 | 111 | 201 | 64 |
| SESAB | 14 | 7 | 7 | 168 | 49 | 119 | 71 |
| SICM | 23 | 15 | 8 | 276 | 98 | 178 | 64 |
| SJCDH | 11 | 5 | 6 | 132 | 36 | 96 | 73 |
| SSP | 24 | 18 | 6 | 288 | 114 | 174 | 60 |
Considering the average consumption of BAC units exposed in
Table 2, a preliminary analysis of possible reductions in daily consumption and cost on water/wastewater resulting from the proposed adjustments (
Table 3) was performed. In this regard, the following were estimated: consumption of toilets (60% of unit daily consumption), price per cubic meter of US$ 2.7 million (consumption range higher than 50 m
3/month, using the current water rate from June 2013) and proportion of wall-mounted flush valve toilets to total toilets in each unit (
Table 2).
The calculation assumed no preferences in the user’s choice to use any sanitary toilet. Therefore, the savings presented in
Table 2 can be much higher, so it is imperative to properly label toilets so that the user gives preference to urinate in toilets adjusted to 1 L/flush. Thus, it is recommended to indicate the savings obtained in urinal and toilets adjusted to 1 L/flush, instead of conventional toilets (non-regulated), as well as operating instructions of the dual-drive-coupled mechanism toilet flush (3 and 6 L) when appropriate.
Table 3.
Consumption of wall-mounted flush valve toilets before and after the proposed adjustment and the possible water savings achieved.
Table 3.
Consumption of wall-mounted flush valve toilets before and after the proposed adjustment and the possible water savings achieved.
| Units | Daily consumption (l/d) | Relation WMFV/TT | Consumption BSVD (l/d) | Savings |
|---|
| Before regulation | After regulation | m3/month | R$ **/month |
|---|
| AGERBA/SEI | 9,600 | 84 | 5,659 | 1,651 | 120 | 3,145 |
| SAEB/SETRE | 21,767 | 7 | 1,051 | 525 | 16 | 412 |
| SEAGRI | 30,133 | 38 | 6,888 | 2,009 | 146 | 3,349 |
| SEC/SEDUR/SECTI | 9,600 | 5 | 320 | 116 | 6 | 160 |
| SEFAZ | 14,467 | 51 | 5,167 | 1,722 | 103 | 2,703 |
| SEINFRA | 25,500 | 67 | 11,900 | 4,091 | 234 | 6,127 |
| SEPLAN | 39,833 | 44 | 12,288 | 4,372 | 237 | 6,211 |
| SESAB | 17,333 | 45 | 5,480 | 1,598 | 116 | 2,950 |
| SICM | 9,533 | 96 | 6,395 | 2,271 | 124 | 3,236 |
| SJCDH | 12,300 | 42 | 3,643 | 993 | 79 | 2,079 |
| SSP | 5,200 | 86 | 3,120 | 1,235 | 57 | 1,479 |
| Total | | | 61,909 | 20,582 | 1,240 | 31,852 |
Another opportunity to reduce water consumption is the deactivation of lower water tanks, where the largest loss proportions were identified due to cracks caused by tree roots. Currently, there is enough pressure from the public water network, and therefore, this action would also bring about a reduction in energy consumption, as it would result in deactivation of the pumping system. If periodic maintenance occurs, lower water tanks can be used as rainwater tanks for use in toilets and for watering gardens.
To the extent that water consumption in the government departments is reduced, it is possible to take advantage of part of the volume of the upper water tank for non-potable water use, from its internal division, to segregate drinking from non-drinking water. This suggestion is feasible, since most BAC water tanks were oversized.
These proposals were presented to the State Administration Department and shall be followed-up by the TECLIM/UFBA team during the first semester of 2013.
5.3. Global Analysis of Savings
The results were analyzed via series of water consumption and associated monthly costs (water/wastewater). Therefore, the “base year” that represents the consumption of the 12 months preceding the unit participation in the Program was determined. The series median of the “base year” was defined as the “base consumption”, serving as a reference for determining the water and cost savings.
The projection of the water consumption of each unit at previous conditions to the implementation of the Program (that is, using the consumption baseline) was determined in subsequent months of the unit inclusion in the Program.
The expense related to the baseline matches the expense base, and its projection corresponds to the baseline expense, which is the projection of the consumption preceding the program multiplied by the current rate of water consumption per month. July 2013, was the most recent update of water tariffs.
Table 4 shows the values of the rate applied by the water dealership before and during the Program.
Table 4.
Water tariffs applied by the water dealership before and during the Program.
Table 4.
Water tariffs applied by the water dealership before and during the Program.
| Duration | <10 m3 | 11–30 m3 | 31–50 m3 | >50 m3 |
|---|
| 1 June 2008‑31 March 2009 | R$ 39.00 | R$ 7.75 | R$ 8.23 | R$ 9.70 |
| 1 April 2009‑30 April 2010 | R$ 39.00 | R$ 7.75 | R$ 8.23 | R$ 9.70 |
| 1 May 2010‑30 April 2011 | R$ 41.70 | R$ 8.29 | R$ 8.80 | R$ 10.37 |
| Duration | <10 m3 | 10–50 m3 | >50 m3 |
| 1 May 2011‑30 April 2012 | R$ 45.30 | R$ 9.94 | R$ 11.72 |
| 1 May 2012‑30 June 2013 | R$ 51.15 | R$ 11.22 | R$ 13.23 |
| 1 July 2013‑30 June 2014 | R$ 56.20 | R$ 12.32 | R$ 14.53 |
| 1 July 2014‑30 June 2015 | R$ 60.60 | R$ 13.28 | R$ 15.66 |
The volume savings were determined by the difference between the monthly consumption series and the consumption baseline.
It was observed that the amounts billed by the water and sewage public utility did not always correspond to the amounts owed, even in months without the transition of tariff rates. For this reason, based on water consumption and the tariffs of each period, the expenses of water and sewage were determined. Therefore, water expenses often did not correspond to the invoices issued. Thus, the real savings were determined by the difference between monthly consumption expense and the baseline of expenses.
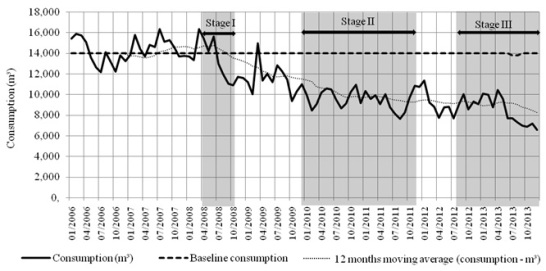
Figure 6 shows the consumption of BAC units relative to the baseline of consumption generated at the 17 units. Previous data from the beginning of the Program were inserted in the system to enable the comparison of savings achieved.
Figure 6.
Consumption and baseline of water consumption of seventeen units.
Figure 6.
Consumption and baseline of water consumption of seventeen units.
According to the rolling average during the 12 months prior to the implementation step of the Program, there was an increasing trend of water consumption in BAC units. In the period prior to the Program, water consumption fluctuated between 12,000 and 16,000 m3, with an average of 14,365 m3/month. However, upon the implementation of Step I of the Program, there was an inflection in the rolling average curve, and until the beginning of the second half of 2010, the average water consumption steadily declined to 11,596 m3/month. From that period to June 2013, stabilization in consumption of around 9500 m3/month was observed. In July 2013, there was another inflection of the rolling average curve, with a new reduction in consumption. Thereafter, the average consumption was about 7000 m3/month. Therefore, the last half of 2013 showed the lowest consumption values.
The differences in economies achieved at each stage of the Program are consequences of the executed activities. While in Stage I, the selection of the participating units and their opportunities to reduce consumption were realized, in subsequent steps, the following actions were performed: daily and continuous consumption entering, leakage tests and adjustments of hydraulic equipment flows. Therefore, the actions that contributed to the results are due to daily and continuous monitoring and, consequently, leakage detection and repair of water tanks and building water feeders, as well as deactivation of ornamental pools.
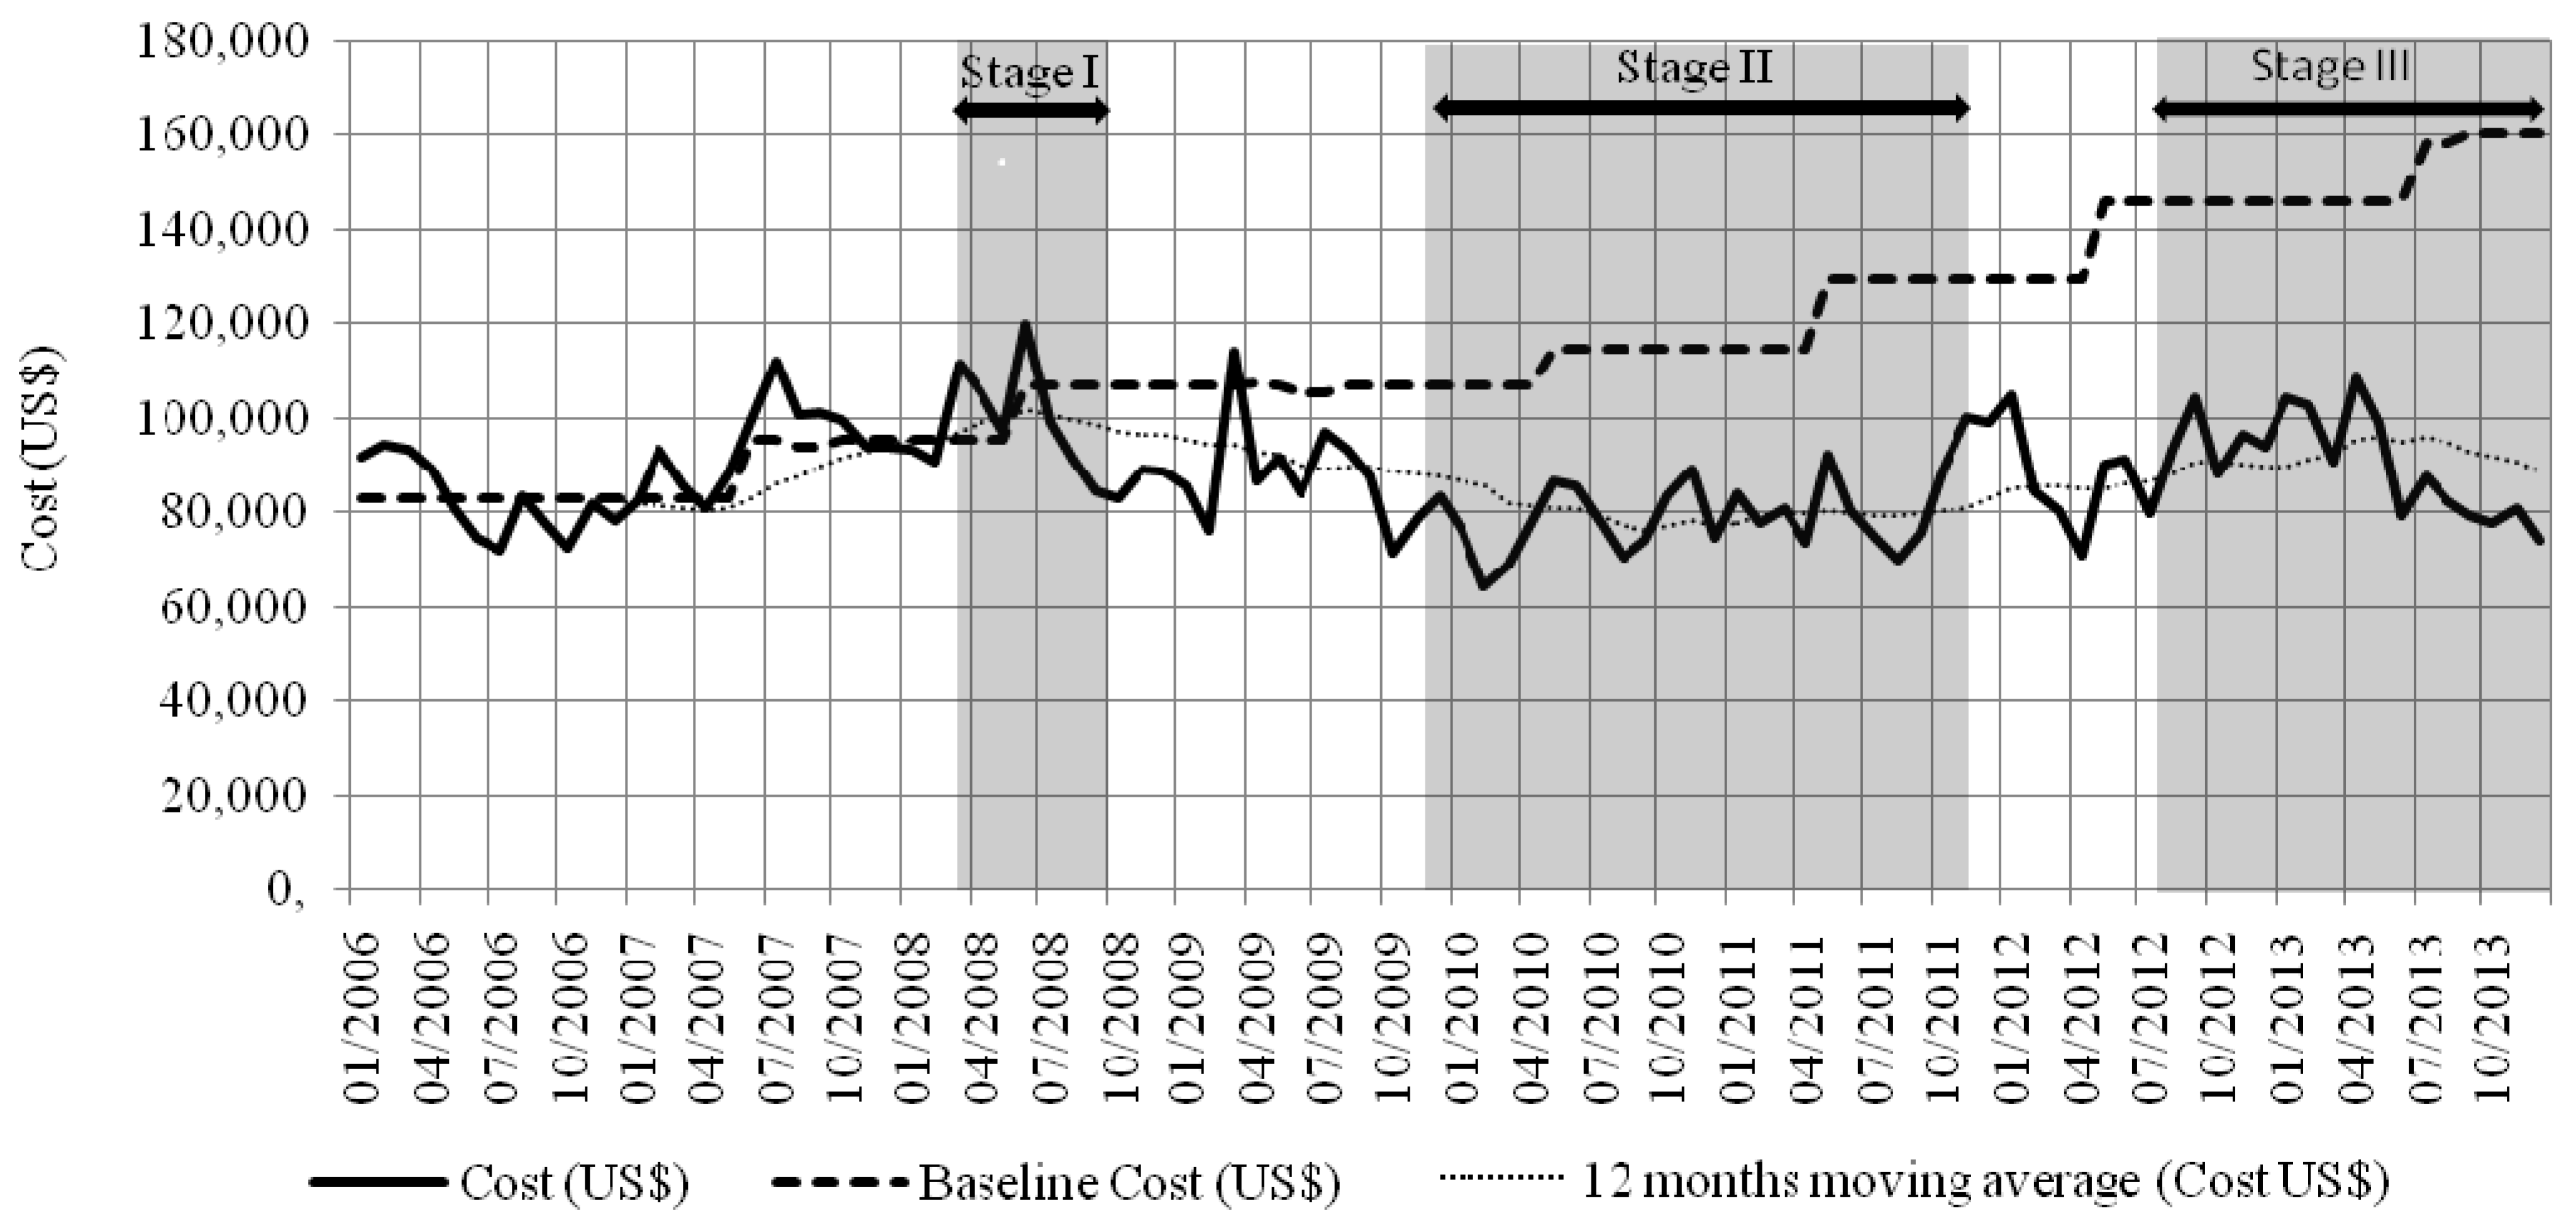
Regarding water/wastewater expenses, there was an increasing trend in the period prior to the implementation of the Program (
Figure 7)—see the rolling average over 12 months of cost. The savings in water consumption promoted the cost reduction, especially between Stage I and the beginning of 2012, even with increased tariffs. At the end of Stage II, increased rates in 2011 and 2012 caused an increase in expenses, though still well below the baseline cost. Even with all of the rate increases that occurred during the Program, in most months, the monthly water expenses were still lower than those during 2008.
Figure 7.
Cost and baseline cost of the 17 units.
Figure 7.
Cost and baseline cost of the 17 units.
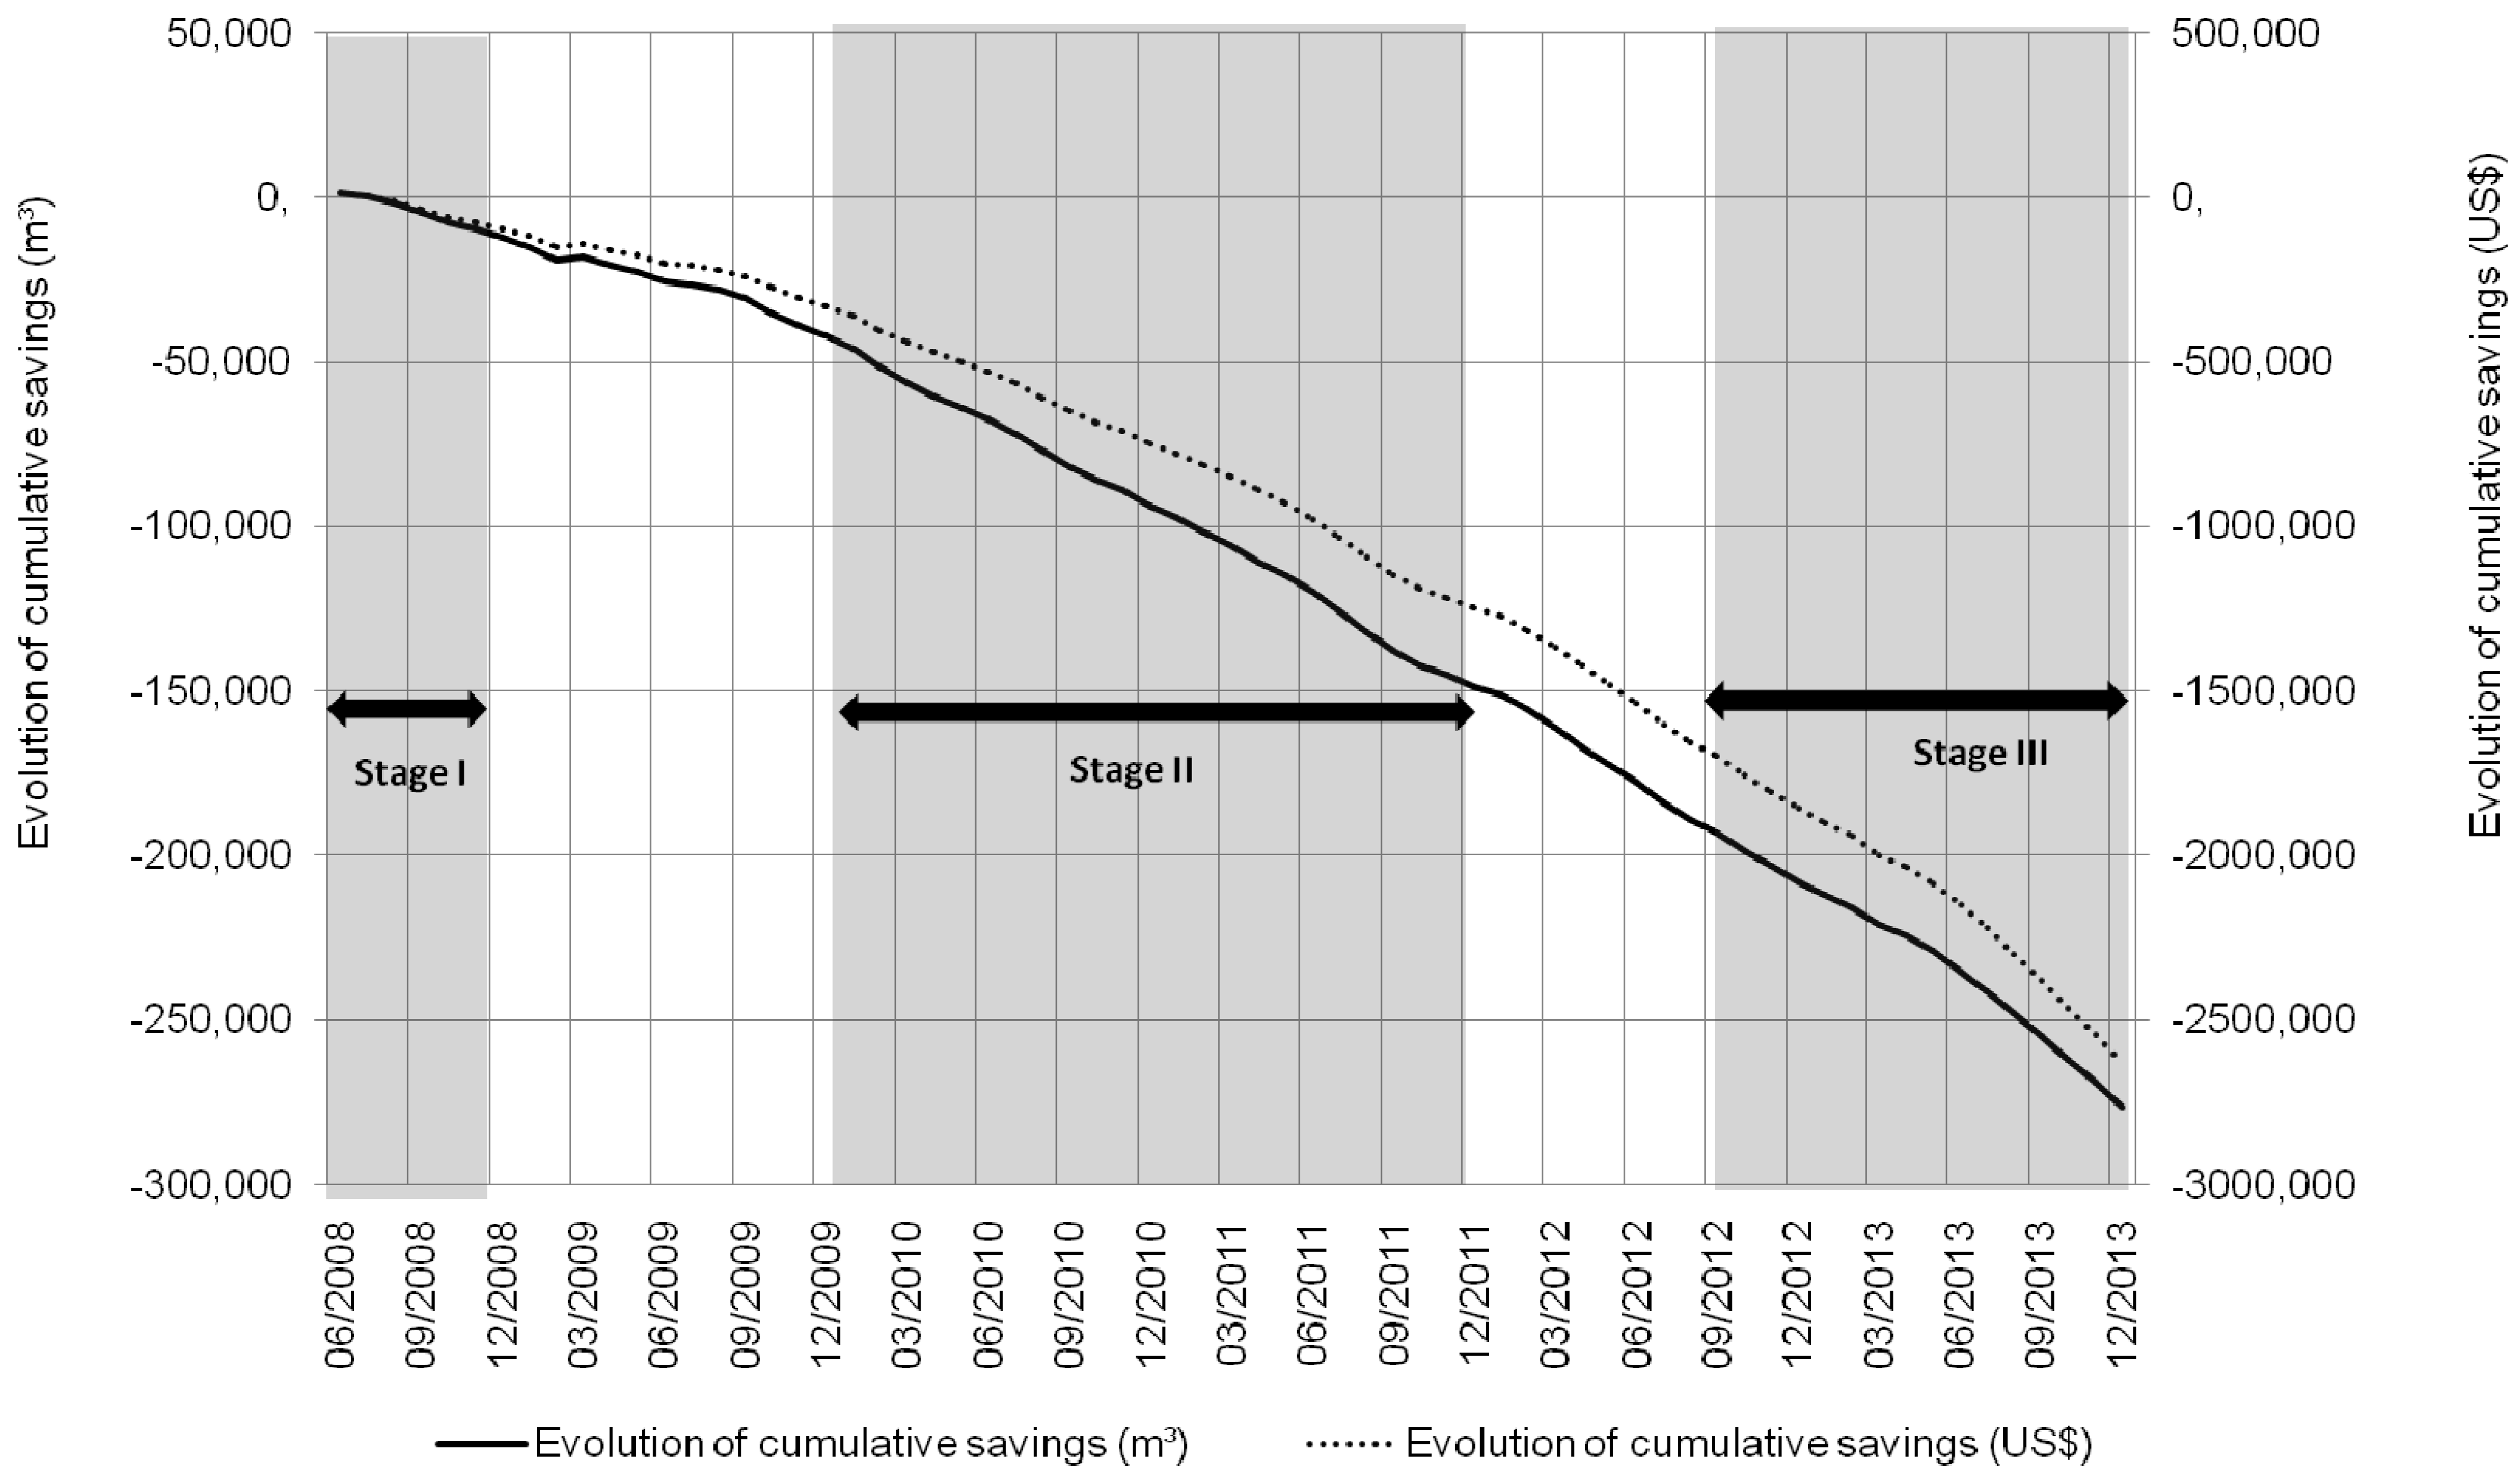
Figure 8 shows the accumulated savings in consumption and cost throughout the Program steps.
Figure 8.
Accumulated savings in water consumption of the 17 units.
Figure 8.
Accumulated savings in water consumption of the 17 units.
The Program resulted in a consumption reduction of more than 270,000 m3 and a savings of approximately US$ 2.7 million.
Some research in Brazil has been realized that is similar to this present article. Sautchúk [
17] elaborated scenarios of conservation and use of water in one commercial building in the conception phase. In this scenario, she considered the prevision of water consumption in a conventional project (without any type of intervention in favor of water conservation) and the utilization of hydromechanics equipment, electronics and urinals without the use of water. This author observed reductions ranging between 23% and 30%. Scenarios contemplating the use of rainwater and well water also were considered. Proença and Ghisi [
19] estimated the main final uses of water in ten office buildings located in Florianópolis, South of Brazil, in order to evaluate their potential of potable water savings. They observed that if the water from taps was reused for toilet flushing, potable water demand would be reduced from 7% to 38%, considering the ten studied buildings.
In recent research by Proença and Ghisi [
16], with the same aim of the previously mentioned study, a reduction of potable water was observed when substituting conventional toilets for dual-flush toilet, providing savings that range from 9.2% to 57.4% across the ten buildings. The savings can range from 6.8% to 38.4% with the use of greywater. The use of rainwater could save between 6.1% and 21.2%; replacement of conventional taps with water-savings taps could reduce between 2.7% and 15.4%. By combining these alternatives, the largest savings were obtained when the four options were jointly simulated (36.9% to 78.9% savings), next the use of dual-flush toilets and water-savings taps (26.5% to 62.9% savings) and after, by rainwater and greywater (from 14.5% to 50.2% savings).
It should be emphasized that the research cited above was conducted through the proposition of equipment replacement and/or new sources of supply (rainwater, greywater reuse and well water), and, therefore, the results cannot be compared to the present study, since its main action takes place on daily consumption knowledge, identifying spills and immediate correction of these. Moreover, the interventions of Proença and Ghisi [
16,
19] were designed to be proposed in the design phase of the building project, while the interventions of this Program were in building installations built about 30 years. No other references to present rational use in public administrative buildings were identified.
6. Conclusions
The State Government of Bahia, Brazil, has consolidated the Program for the Rational Use of Water and Energy through a partnership with the Network of Clean Technologies of Bahia of Federal University of Bahia, which was performed in three steps. During the steps, the Program was implemented under the scope of the Administrative Center of the State Government of Bahia. This article presents the developed and/or suggested actions of the government and the achievements at the BAC regarding rational water consumption.
Among the actions implemented effectively, some are highlighted as follows: trainings of Ecoteams; preparation of procedures for leakage detection; inspections and repairs of identified leaks, especially in water tanks, building water feeders, showers and flush valves; defective buoys; and the deactivation of ornamental pools due to maintenance difficulties. New purchasing procedures to reduce plumbing equipment expenses, adjustments of flows, improved layouts of restrooms, efficiency of pumping systems and optimization in washing water tanks and watering gardens were also suggested.
The actions and procedures implemented until now enabled a reduction of more than 270,000 m3 in water consumption between June 2008 and December 2013, which is equivalent to a reduction of about 30% when compared to the base year. The savings in water expenses enabled a reduction of approximately US$ 2.7 million, or 31% compared to the expenses of the base year. The total water volume saved by the Program would be enough to supply the daily water requirements of 1350 people for the entire period of the Program, considering a per capita domestic consumption of 100 L/inhabitant day.
The results will be improved when suggested actions have been effectively implemented, including, especially, quarterly adjustments of hydraulic equipment flow, a labelling and communication plan, as well as the changing of user attitudes that support rational water consumption.
7. Recommendations
In many building units of the departments, naphthalene, used as a disinfectant, was observed in restrooms, especially in urinals. According to the Agency for Toxic Substances and Disease Registry of the United States, results of studies in animals exposed to this substance by oral administration, by inhalation or by parenteral administration identified several health effects of potential interest to human beings. The World Health Organization advises against using naphthalene, because it is potentially carcinogenic.
During inspections, numerous leakages were identified in bathroom showers in bad conditions due to a lack of organization and/or cleaning in four of 14 departments. Additionally, during one of the inspections, the following was observed: the precariousness of ceramic tiles, housing insects, prohibited areas, falling ceilings and tight booths with poorly located toilet paper holders, hampering user access.
Captured rainwater and the reuse of water for non-potable purposes, especially watering gardens, cleaning, car washing and sanitary discharges, will be contemplated in the future. These alternatives have not yet been proposed, first because the units still do not perform preventive and corrective maintenance, with recurring spills and losses. Additionally, most of these units do not have records of building installations, although, already, some conceptual designs of harvesting rainwater have been done. It should be pointed out that these new sources of supply could be stored in the lower reservoir, considering that upper reservoirs can be currently fed by the water supply.
Understanding the factors involved in water consumption of the buildings studied will guide future actions in Step III.
The results achieved in the first two steps of this Program were justifications to agree on Step III, whose main objective is to expand the Program actions for other buildings of the State Government, which culminated in the publication of Decree No. 12.544/2011. For the realization of the proposed actions, the creation of local levels of monitoring was suggested, operating under the responsibility of the State Departments, hierarchized according to their chart. The purpose of these local organizations is to monitor and encourage water savings in units linked to them. Therefore, units organized in networks spread through Bahia, with decentralized buildings, should be prioritized.


