Article

Effect of Dust Deposition on Stomatal Conductance and Leaf Temperature of Cotton in Northwest China

1
Institute of Agricultural Engineering, Tropics and Subtropics Group, Universität Hohenheim, Garbenstraße 9, Stuttgart 70593, Germany
2
Faculty of Agriculture, Chiang Mai University, Chiang Mai 50200, Thailand
3
College of Hydraulic and Civil Engineering, Xinjiang Agricultural University, Urumqi 830052, China
4
Institute of Soil Science and Land Evaluation, Universität Hohenheim, Emil-Wolff-Str. 27, Stuttgart 70593, Germany
5
College of Science, Centre for Chemicals Application Technology, China Agricultural University, Beijing 100083, China
*
Author to whom correspondence should be addressed.
Water 2015, 7(1), 116-131; https://doi.org/10.3390/w7010116
Submission received: 21 August 2014 / Accepted: 3 December 2014 / Published: 24 December 2014

Abstract

:
The Xinjiang Region in Northwest China is known as the “dust center” of the Eurasian mainland. Dust on the leaf surface affects overall plant development. While emphasis was on studying the impacts of industrial dust particles on crop development, the effect of natural dust deposition on the physiological parameters of cotton had not been studied before. The objective of this study was to examine the effects of dust deposits on cotton leaves and to estimate their impact on crop development and yield. For this purpose, an experiment was set up having two treatments and a control. In Treatment 1, cotton leaves were cleaned with water at three-day intervals or after a natural dust fall. In Treatment 2, 100 g·m−2 of dust was applied at 10-day intervals. The control received neither additional dust nor cleaning. In all of the treatments, stomatal conductance, leaf temperature, biomass and yield were measured. The results show a 28% reduction in yield and 30% reduction in stomatal conductance of the dust treatment compared to the control treatment. This indicates blocking of the stomata on the top of the leaf surface. In addition, the canopy temperature of the dust-applied leaves was always higher than the control and treatment.

1. Introduction

The desert regions in north and Northwest China are the major sources of dust and sandstorms (DSS) in the country. Due to the presence of some of the largest deserts, such as Taklamakan desert in the south and Gurbantunggut in the north, the Xinjiang Region is also known as “dust center” of the Eurasian mainland [1]. About 90% of the DSS occur in the period from March to September and mainly during the afternoon [2]. Due to the variations in topography, vegetation cover and weather conditions the annual average number of DSS days in the south of Xinjiang is double that in the north of Xinjiang [3]. The highest frequency of DSS occurs in the Tarim Basin with more than 30 DSS days per year [4]. During summer time, high temperature, little rainfall and sandy soil provide favorable conditions for wind erosion. According to the dynamic characteristics of dust, grains with diameters <10 μm can be transported by wind for several thousands of kilometers [5]. Trends of DSS in Northwest China have been studied intensively [6]. Conclusions, however, remain controversial; while some researchers report an increase of DSS in recent years [7], others claim to observe a reducing trend [8].
Without a doubt, DSS cause many detrimental effects to human health, like respiratory and cardio-vascular problems [9], and environmental impacts, such as soil fertility loss or direct damage to crops, thereby reducing agricultural production and, consequently, causing economic losses on a large scale [10]. Plants exposed to high wind exhibit anatomical and morphological changes. For example, carbon assimilation is shifted from the leaf development to the growth of stems and roots, leading to reduced leaf area. The effects are devastating in an arid environment, because even drought-tolerant crops, if wind stressed, show an increased rate of water loss due to increased stomatal conductance, abrasion of the vapor barrier and an increase of transpiration [11,12]. A positive effect of the vegetation to the environment is its air filtering ability: dust particles in the atmosphere get deposited on the leaves, which improves the air quality. The leaves’ ability to act as dust receptors depends upon their surface geometry, orientation, epidermal and cuticle features, leaf pubescence and plant height [13]. However, at the same time, dust on the leaf surface affects plant growth and development. For example, dust deposits on the leaves can alter their optical properties, especially the surface reflectance in the visible and near-infrared range of the wavelength [14]. Leaves covered with dust receive less light for photosynthesis; this interferes with gas exchange between the leaf and air, and the reduction of leaf stomatal conductance influences plant biomass formation and yield. Cornisch et al. [15] concluded that an increase in yield is associated with the stomatal conductance in Pima cotton (Gossypium barbadense L.). Stomatal conductance depends on environmental factors, position at the canopy and age of the leaves [16]. This may occur only on the lower (abaxial) surface (hypostomatous leaves), only on the upper (adaxial) surface (hyperstomatous leaves) or on both the abaxial and adaxial surfaces (amphistomatous leaves).
In addition, dusted canopies have a high absorption of solar radiation, raising the leaf temperature [17]. Other impacts, such as sandblasting, result in the loss of plant leaves, which reduces photosynthetic activities and the development of grain or fruit. In the long term, dust can also affect plants via changes in soil chemistry or it may also worsen other stresses, such as drought stress or pathogen stress [18].
In the past, emphasis was on studying the impacts of industrial dust particles on crop development and crop physiological parameters [19,20]. The chemical composition of dust, its particulate size, age of plants and deposition rate were studied intensively [19,21]. For example, cement kiln dust reduced 73% of the photosynthesis in green beans [22], while ash reduced up to 90% of the rate of photosynthesis of apple trees [23]. Nanos and Ilias [24] described the effects of cement dust, such as a reduced stomatal conductance and transpiration rate of olive trees. Similarly, Shukla et al. [25] reported that the highly alkaline nature of the cement dust resulted in the reduced chlorophyll content of dusted plants. This leads to reduced photosynthesis, due to reduced leaf area, clogging of stomata and interception in the incident light due to cement encrustations on the leaf surface. Thomson et al. [26] studied the effects of roadside dust on photosynthesis and leaf diffusion resistance over a range of light intensities. They concluded that photosynthesis was reduced tremendously when leaves were dusted with 5 to 10 g of dust per m² of leaf surface.
Increased concentration of industrial dust particles from cement, coal or thermal power plants has drawn much attention due to their serious impacts on human and plant health. Similarly, much focus was given to study the trend of DSS in the Xinjiang region. However, the effect of dust deposition on the physiological parameters of cotton, the main crop in Northwest China, has not been studied yet. Thus, the objective of this study was to examine the effects of dust deposits on cotton leaves and to estimate the impact on canopy temperature, stomatal conductance and yield.

2. Materials and Methods

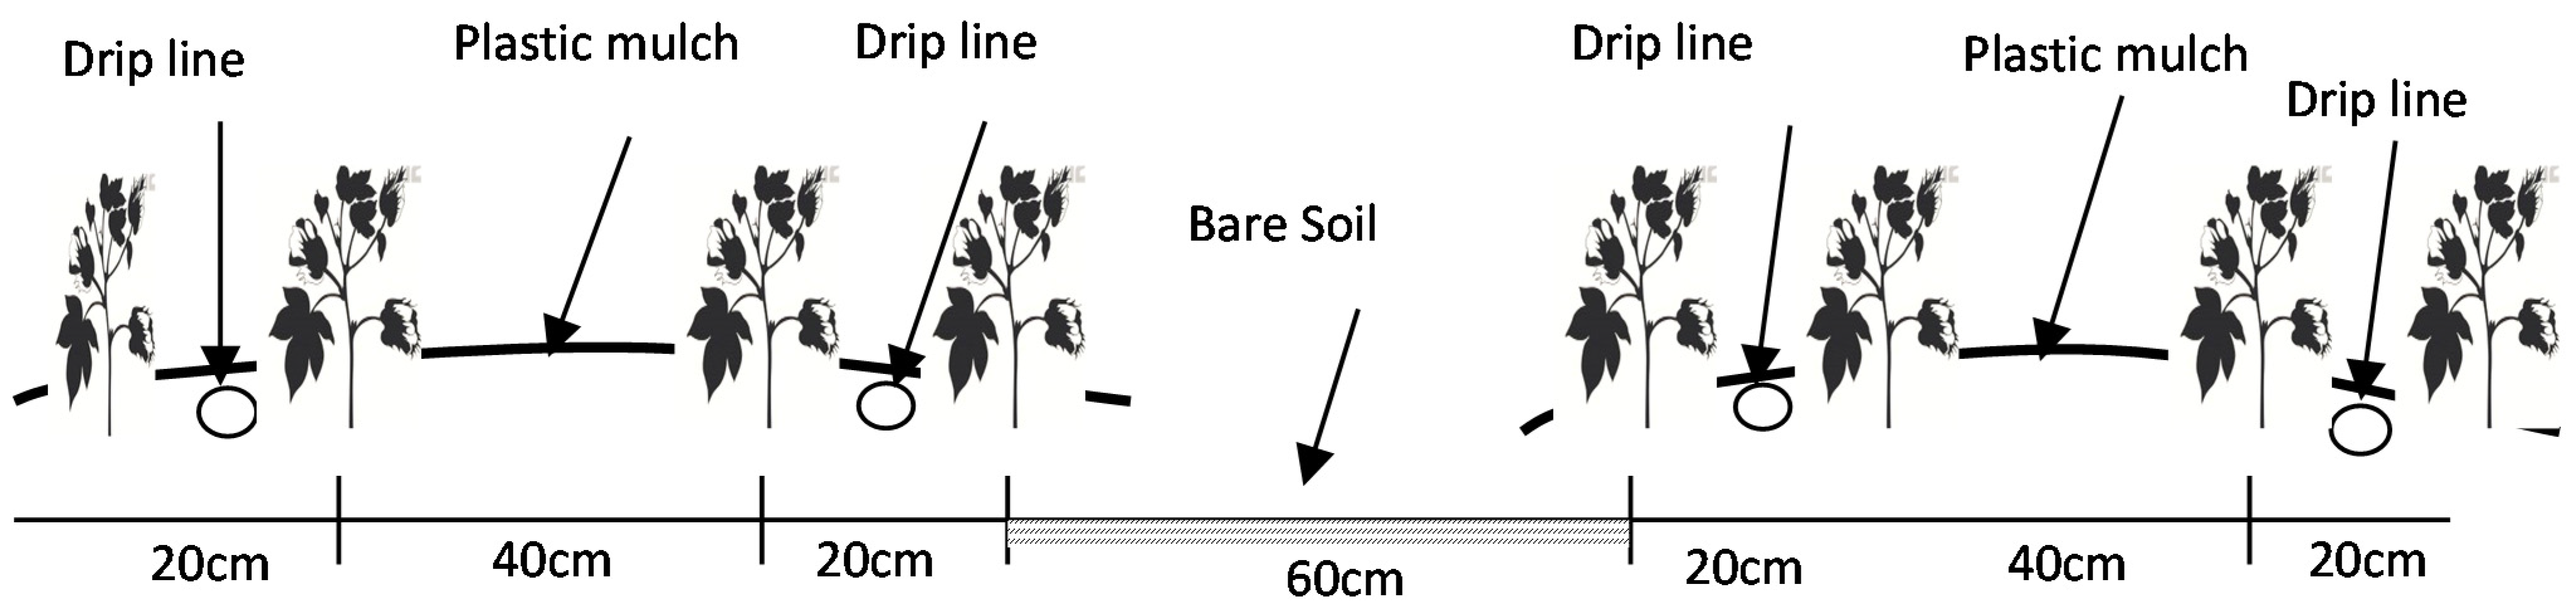
2.1. Experimental Site

The experiment was conducted at the Kuerle experimental station of Xinjiang Agriculture University, located at Xinier Township, Kuerle City, Xinjiang (41°35' N, 86°09' E). Located in the warm temperate climatic zone, the area is arid, with an average annual rainfall of 60 mm and an average annual potential evaporation of 2450 mm (ø 120 cm evaporation pan). The soil at the experimental station is classified as sandy loam soil. The field capacity (FC) and permanent wilting point (PWP) are 0.25 m3·m−3 and 0.09 m3·m−3, respectively. The detailed soil analysis at different depths is shown in Table 1. A meteorological station positioned at the site provides hourly measurements of solar radiation, rainfall, air temperature, relative humidity and wind speed during the growing season. The monthly average values measured throughout the growing season are shown in Table 2.
Table 1. The soil chemical and physical properties at Kuerle experimental station: cation exchange capacity (CEC), bulk density (BD), electrical conductivity (ECe), organic carbon (Corganic), total nitrogen (Ntotal), calcium carbonate (CaCO3), carbonate (CO32−), bicarbonate (HCO3), chloride (Cl), sodium (Na+), calcium (Ca2+) potassium (K+), magnesium (Mg2+) and sulfate (SO42−).
Soil DepthCECBDPHECeCorganicNtotalCaCO3CO32−HCO3ClSO42−Ca2+Mg2+Na+K+Soil Texture
(cm)(cmol/kg)(g/cm3)(mS/cm)(g/kg)
272.91.577.823.84.81.1116.10.000.20.22.10.80.20.20.1Sandy loam
522.01.558.121.01.70.9123.50.000.30.40.60.30.10.30.1Sandy loam
631.51.508.221.01.60.9120.70.000.20.20.90.40.10.20.1loamy sand
852.91.568.225.22.40.9115.90.010.30.61.20.40.20.50.1Sandy loam
1201.21.508.516.81.50.9111.10.010.30.20.40.20.10.20.1Loamy sand
1401.91.578.418.22.10.9116.50.010.20.20.40.20.10.20.1Sandy loam
Table 2. Meteorological information at Kuerle experimental station during the whole sowing season: mean maximum (Tmax) and minimum air temperature (Tmin), average temperature (Tavg), relative humidity (RH), mean wind speed (u2), daily average solar radiation (Rs) and rainfall (P).
MonthTmax (°C)Tmin (°C)Tavg (°C)RH (%)U2 (m/s)Rs (W·m−2)P (mm)
May301623351.42031
June312026451.324216
July321926521.127021
August321825521.02284
September291422.480.71850

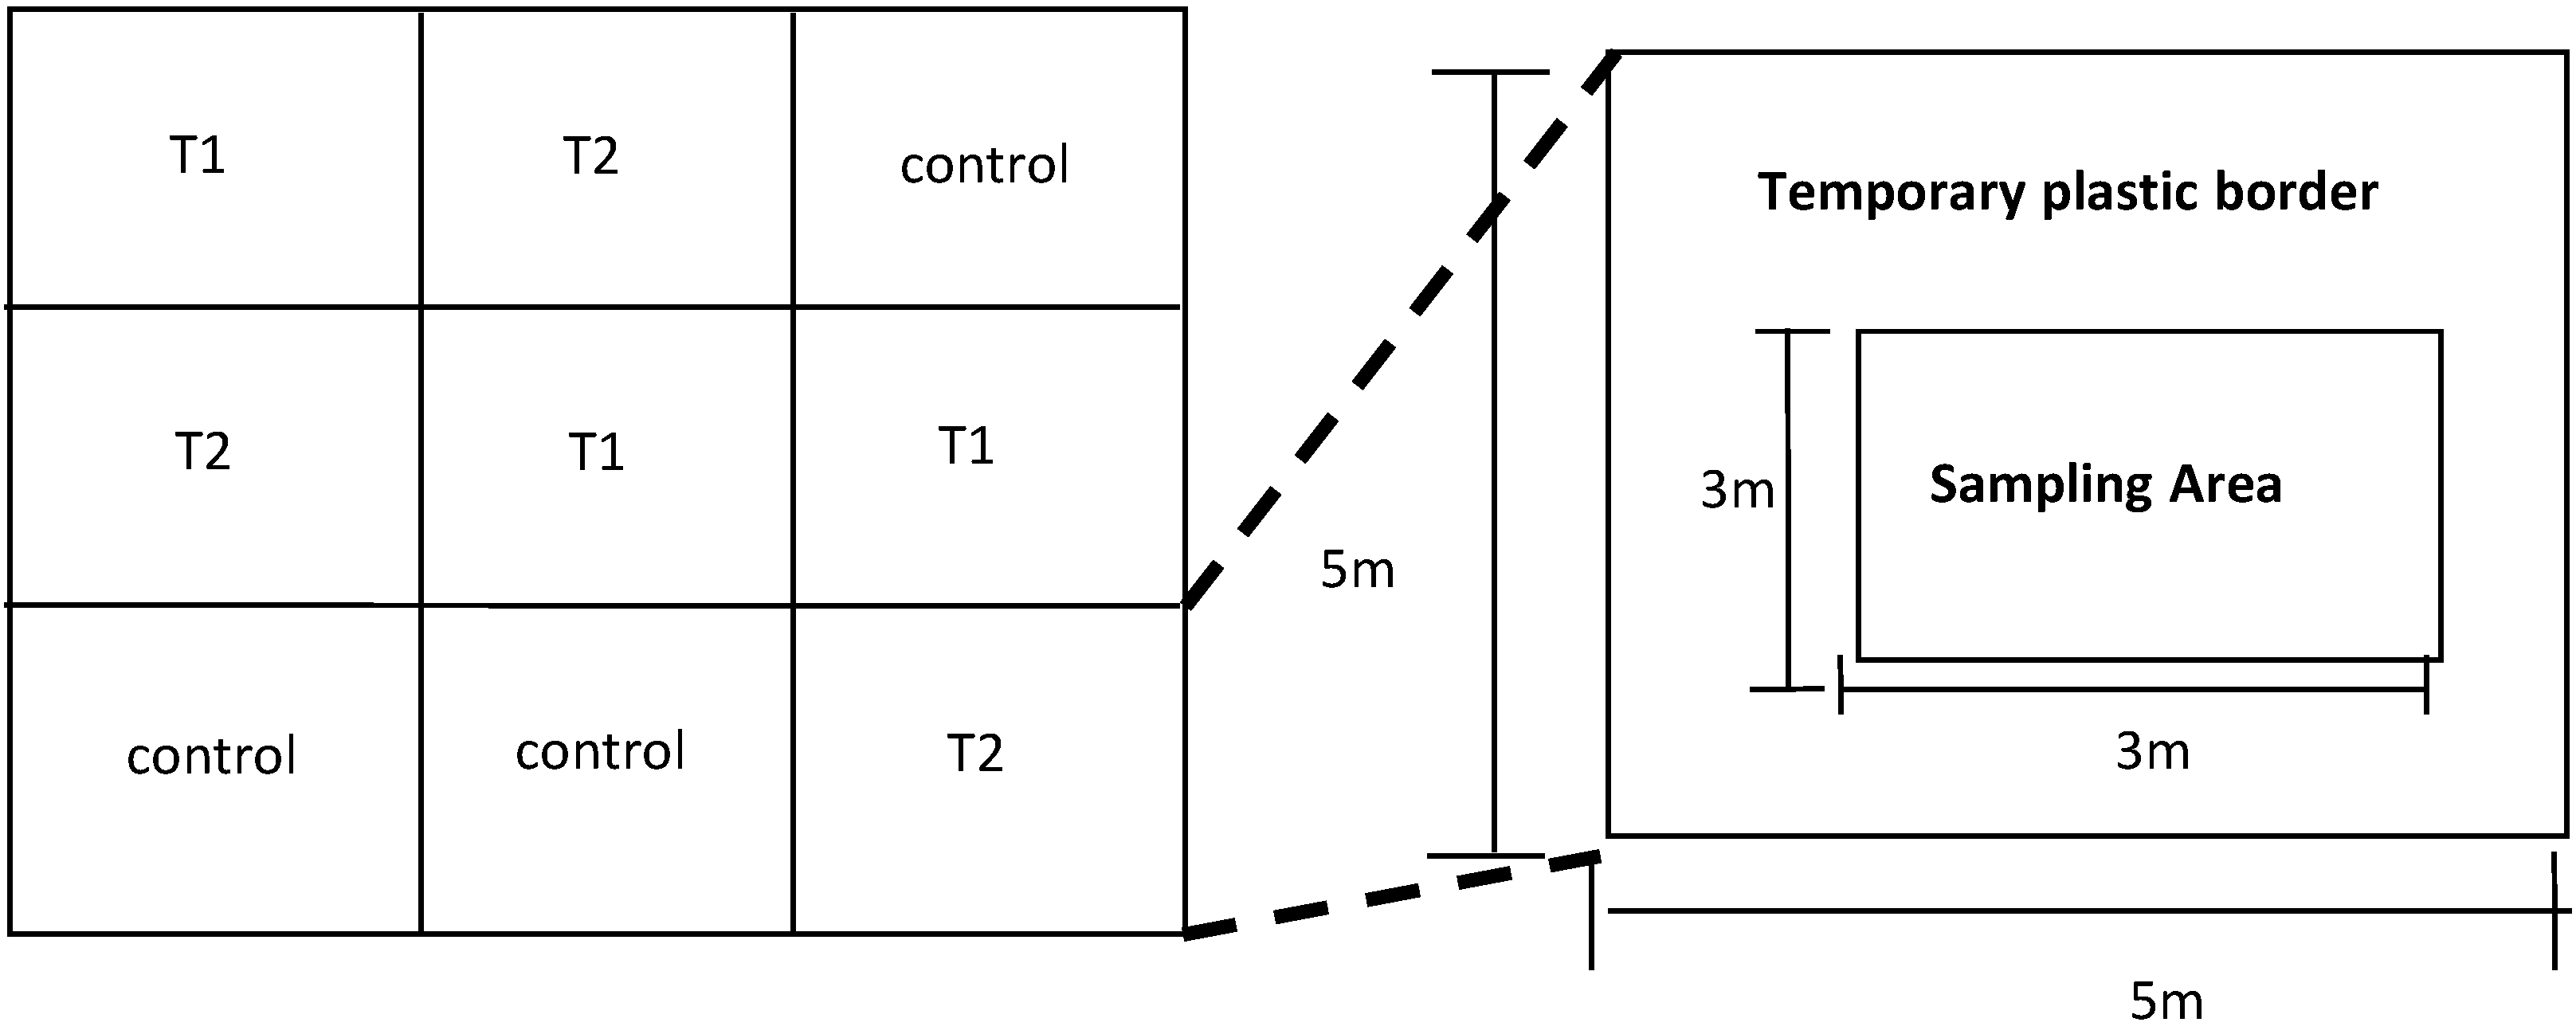
2.2. Experiment Design

Cotton (Gossypium hirsutum L., Xinluzhong-21) was sown on 4 May 2012, which was covered with 0.08-mm transparent polythene film as a mulch. Plastic mulch covered four cotton rows (N-S direction) having a width of 140 cm. The inter-row spacing was 20-40-20 cm, leaving a bare soil width of 60 cm (Figure 1). Hence, the ground surface was approximately 80% covered by the plastic mulch. Two drip lines were placed underneath each of two cotton rows with a dripper distance of 29 cm and a discharge rate of 1.6 L·h−1. Plastic mulch and drip lines were placed with a specially equipped sowing machine. In total, 24 irrigation events took place starting from mid-June until the end of August.
Figure 1. Planting pattern with drip irrigation and plastic mulch.
Water 07 00116 g001
The experiment consisted of two treatments and a control. In Treatment 1, cotton leaves were cleaned with water at 3-day intervals or after a natural dust fall. In Treatment 2, 100 g·m−2 of dust was applied at 10-day intervals. For this, dust was collected by placing paper sheets in the cotton field, which was later sieved to get a uniform particle size. The control received neither additional dust nor cleaning, but was exposed to the natural conditions. Treatments and control were repeated 3 times with a random arrangement of plots each of an area of 5 m × 5 m (Figure 2). Only the plots in Treatment 2 were surrounded by a 1.5 m-high polythene fence, called a “dusting chamber”. The dusting chamber kept the dust confined within the specified area, was placed at each dust application time and removed afterwards. All plant samples were taken from the center area of 3 m × 3 m. Leaf dusting began at the budding stage in the morning hours of every tenth day and was continued till the end of the experiment. The treated plants were visibly dusty compared to the control and cleaned plants and retained dust on the leaves between the application (Figure 3).
Figure 2. Experiment design showing the treatments and layout of the dusting chamber (zoom out).
Water 07 00116 g002
Figure 3. Cotton leaves of the control and treatments.
Water 07 00116 g003

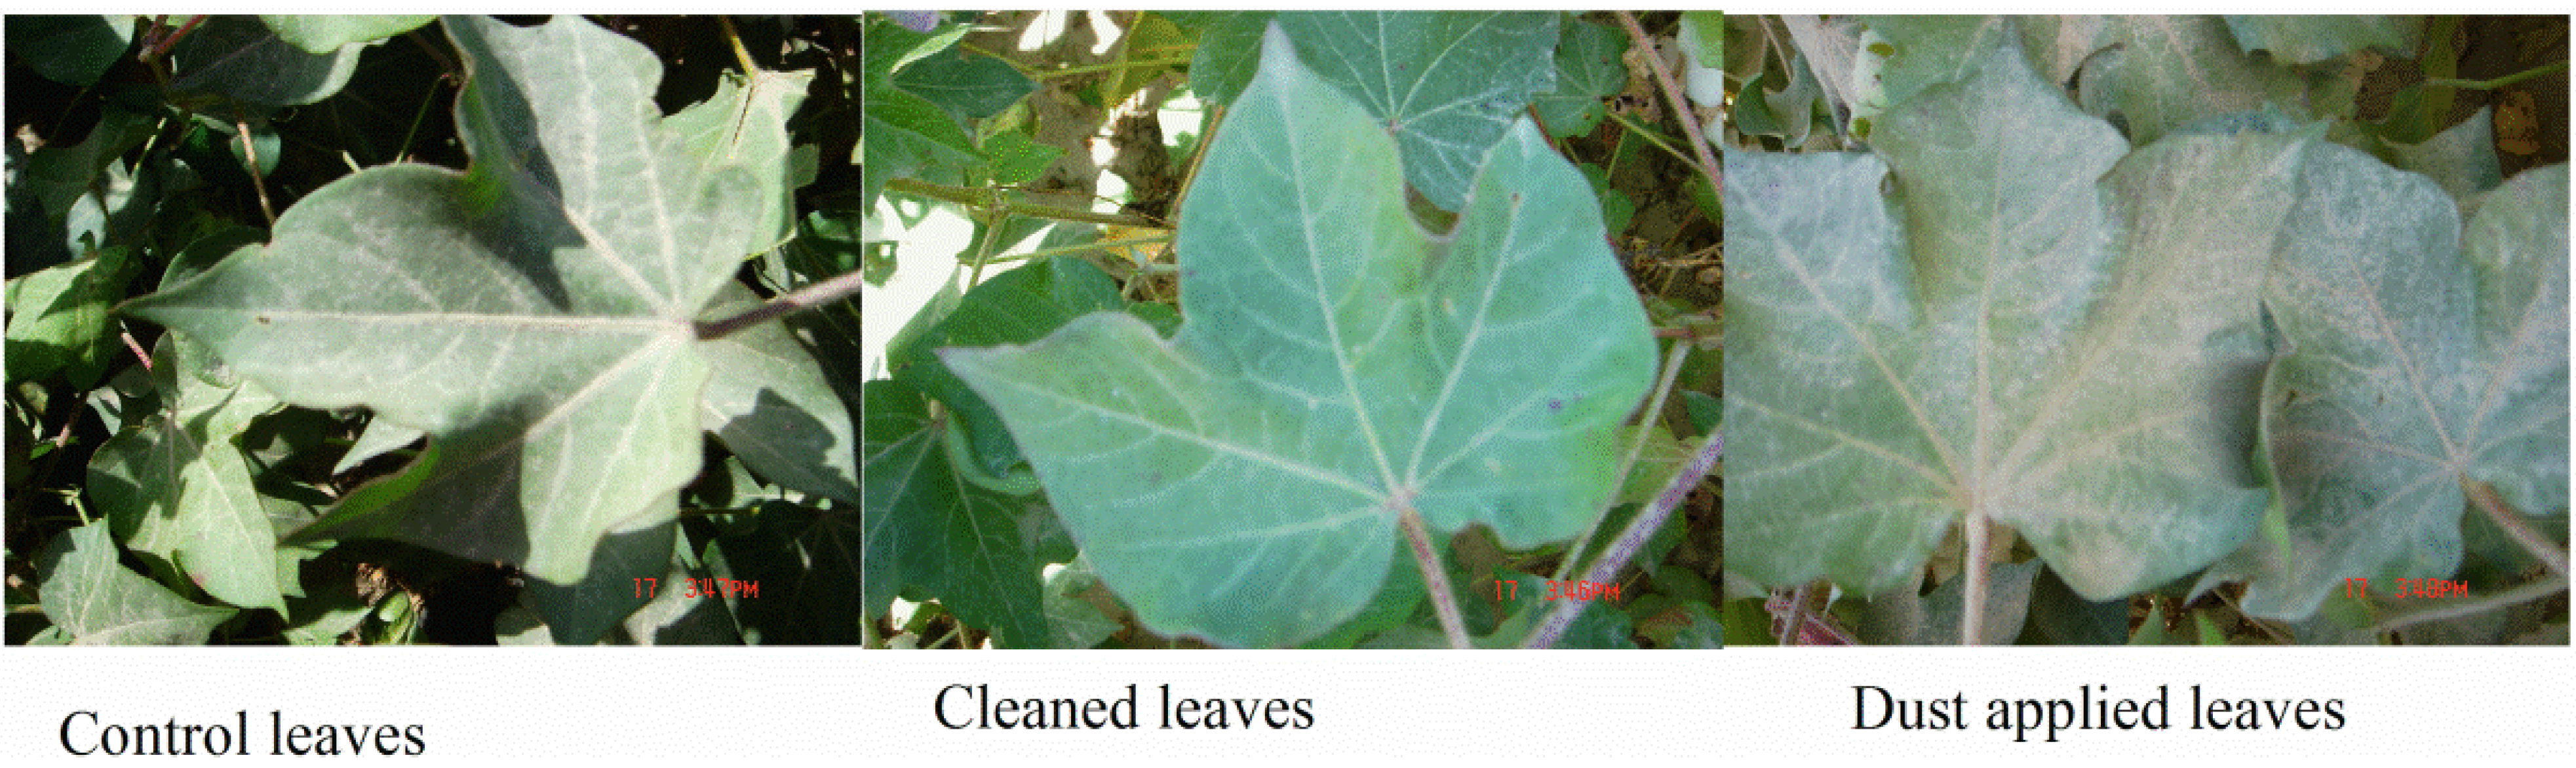
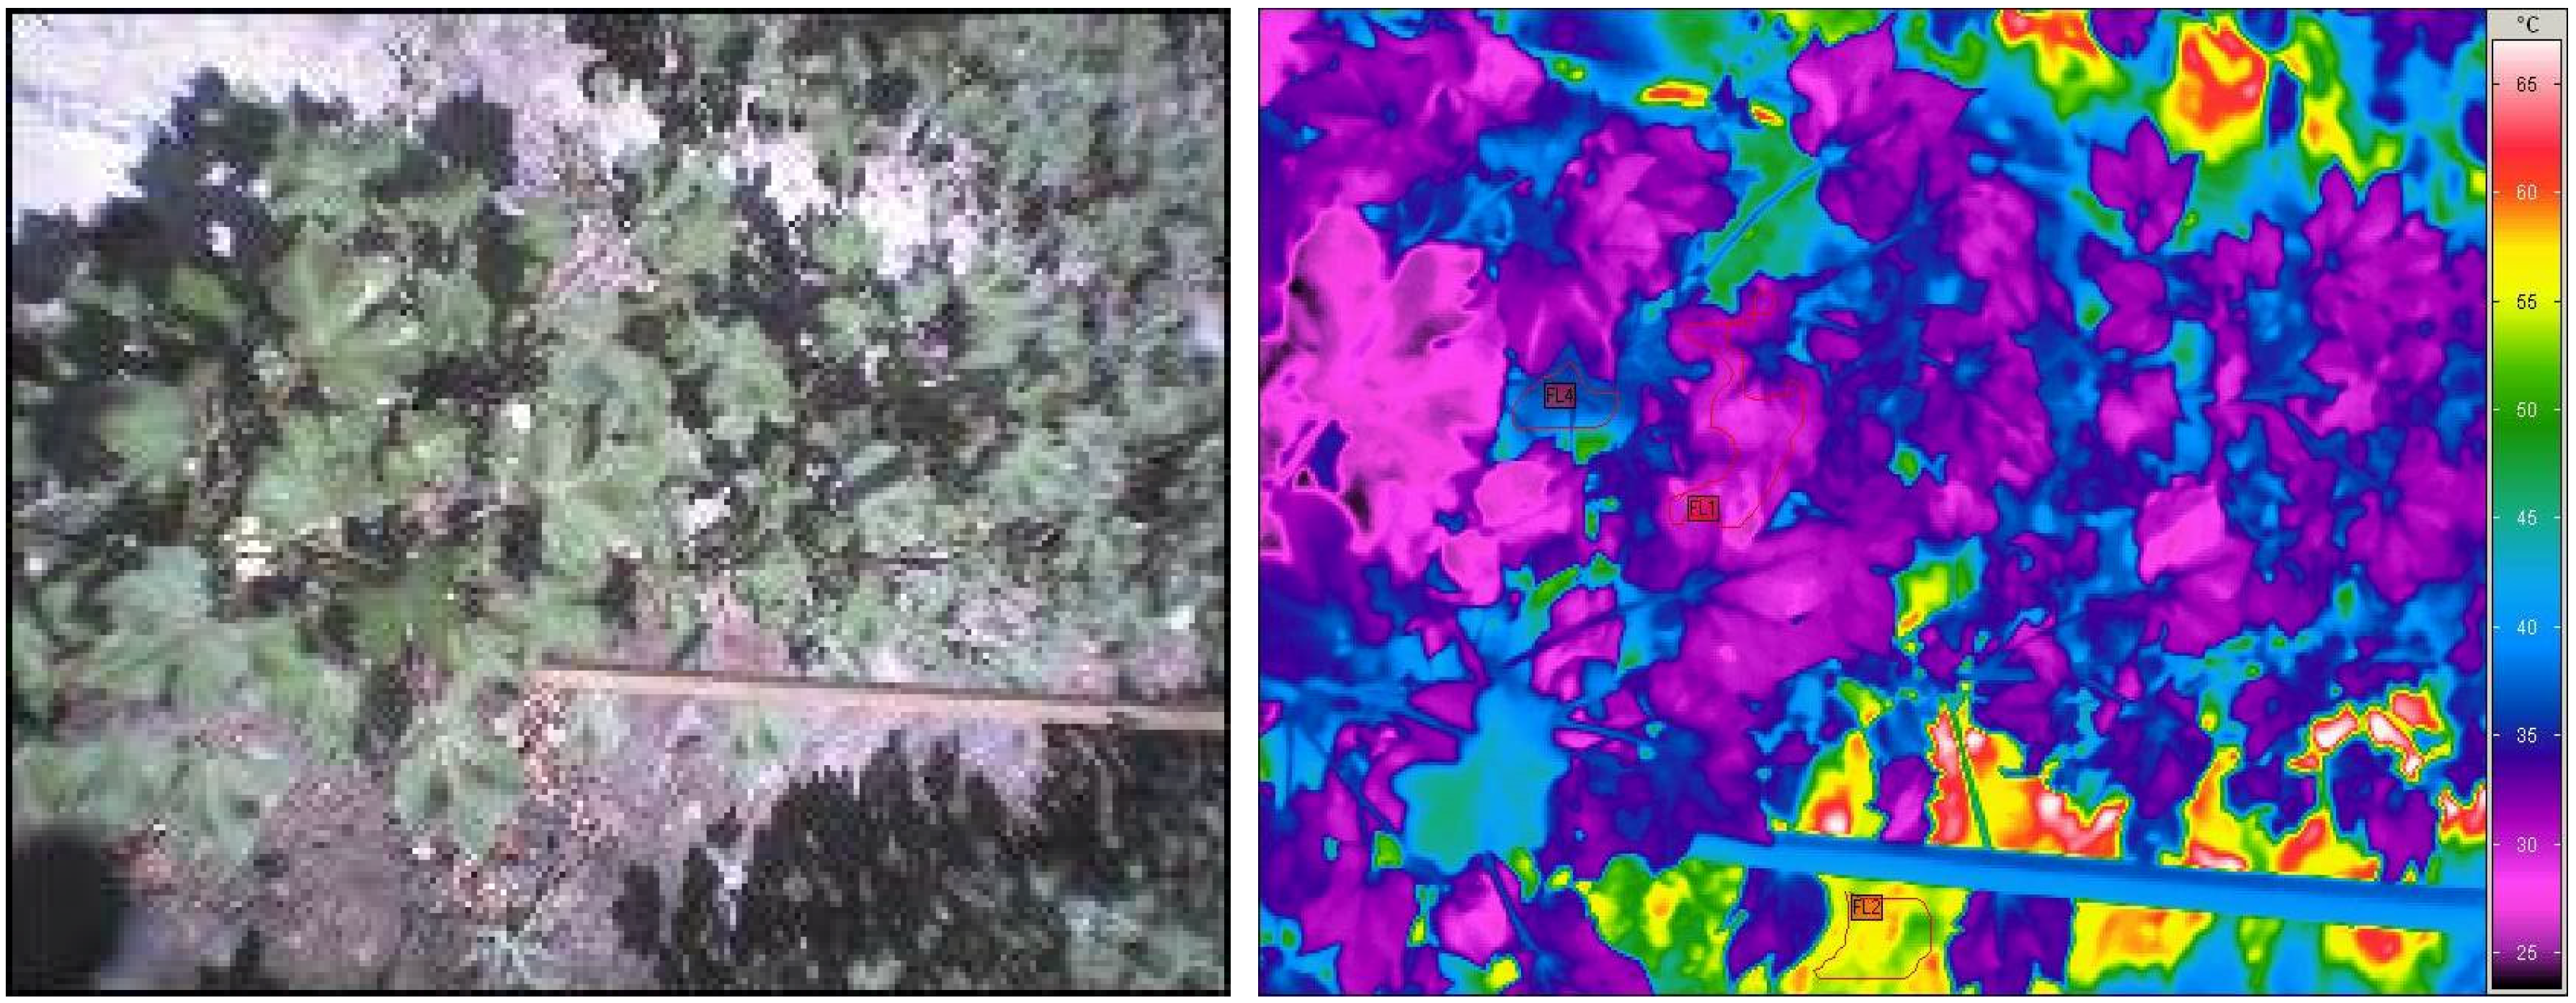
2.3. Measurement of Canopy Temperature and Stomatal Conductance

A high resolution (384 × 288 pixel) thermal camera (VarioCAM, Infra Tech GmbH, Dresden, Germany) was used to measure canopy temperature (Tc). All images were acquired between 12:00 and 14:00. Thermal images were analyzed using the IRBIS-PROFESSIONAL-3 software (Infra Tech GmbH, Dresden, Germany), which allowed corrections for object emissivity, object distance and temperature. Infrared pictures were pre-processed manually to exclude any extraneous surfaces in the analysis of leaf temperature, such as the marking sticks, plastic mulch and soil. The temperature difference between the soil and the upper leaves was in the range of 15 to 25 °C. Since the soil (53 °C) and plastic mulch (52 °C) had a much higher temperature (red and blue color) than the leaves (30 °C) (purple color), it was easy to differentiate during the image analysis, as shown in Figure 4. The selected area of interest was outlined by vertical dotted lines, and statistical parameters, like maximum, minimum, average temperatures and standard deviation, were calculated by the image processing software.
Figure 4. Digital image and the corresponding infrared image of a cotton row.
Water 07 00116 g004
Stomatal conductance (gs) was measured at the same time when infrared images were taken using a portable porometer (SC-1; Decagon devices, Washington, DC, USA). Measurements were taken on the abaxial side on three randomly-selected, fully-developed, sunlit leaves per plot. Before each measurement, the instrument was calibrated according to the manufacturer’s instructions.

2.4. Soil Moisture Content, Plant Dry Matter and Yield

Volumetric soil water content was measured with TDR-TRIME tube access probes (IMKO GmbH, Ettlingen, Germany). One access tube per plot was installed, and the measurement was made down to a depth of 0.7 m in 0.1-m intervals. Measurements were taken at 3-day intervals, before and after irrigation and whenever there was a rainfall event. The irrigation amount supplied to the field was based on the soil water content: whenever the water content dropped below 65% FC, it was irrigated up to 100% FC. Total available water content (TAW) was estimated to be 110 mm, assuming the maximum rooting depth of cotton to be 1 m [27]. The readily-available water content (RAW) was calculated as 55 mm based on a depletion factor of 0.5. Fresh biomass above the ground was taken by cutting three randomly-selected plants per plot, which were than dried at 70 °C for 48 h to get the dry biomass.
At physiological maturity, all bolls were harvested manually, and the plant density (Dp), capsule with cotton (Cc), without cotton (Cwc) and capsules smaller than 2 cm (Nsc) were determined for each treatment. The weight per capsule (mc) was determined before and after oven drying at 70 °C for 24 h. The average capsule number per cotton plant (Nc) and cotton seed yield (Ycs) in t·ha−1 was calculated for each plot using the method described by the Ministry of Agriculture of China [28].
Y cs = D p × N c × m c × 85 %
N c = Cc + Cw c + 1 / 3 N sc

2.5. Data Analyses and Statistics

An analysis of variance (ANOVA) was performed in order to evaluate the influence of the different treatments on canopy temperature, stomatal conductance and yield. Linear correlations were calculated for the relationship between canopy temperature and yield. The significance of the correlation was determined using a Pearson coefficient analysis.

3. Results

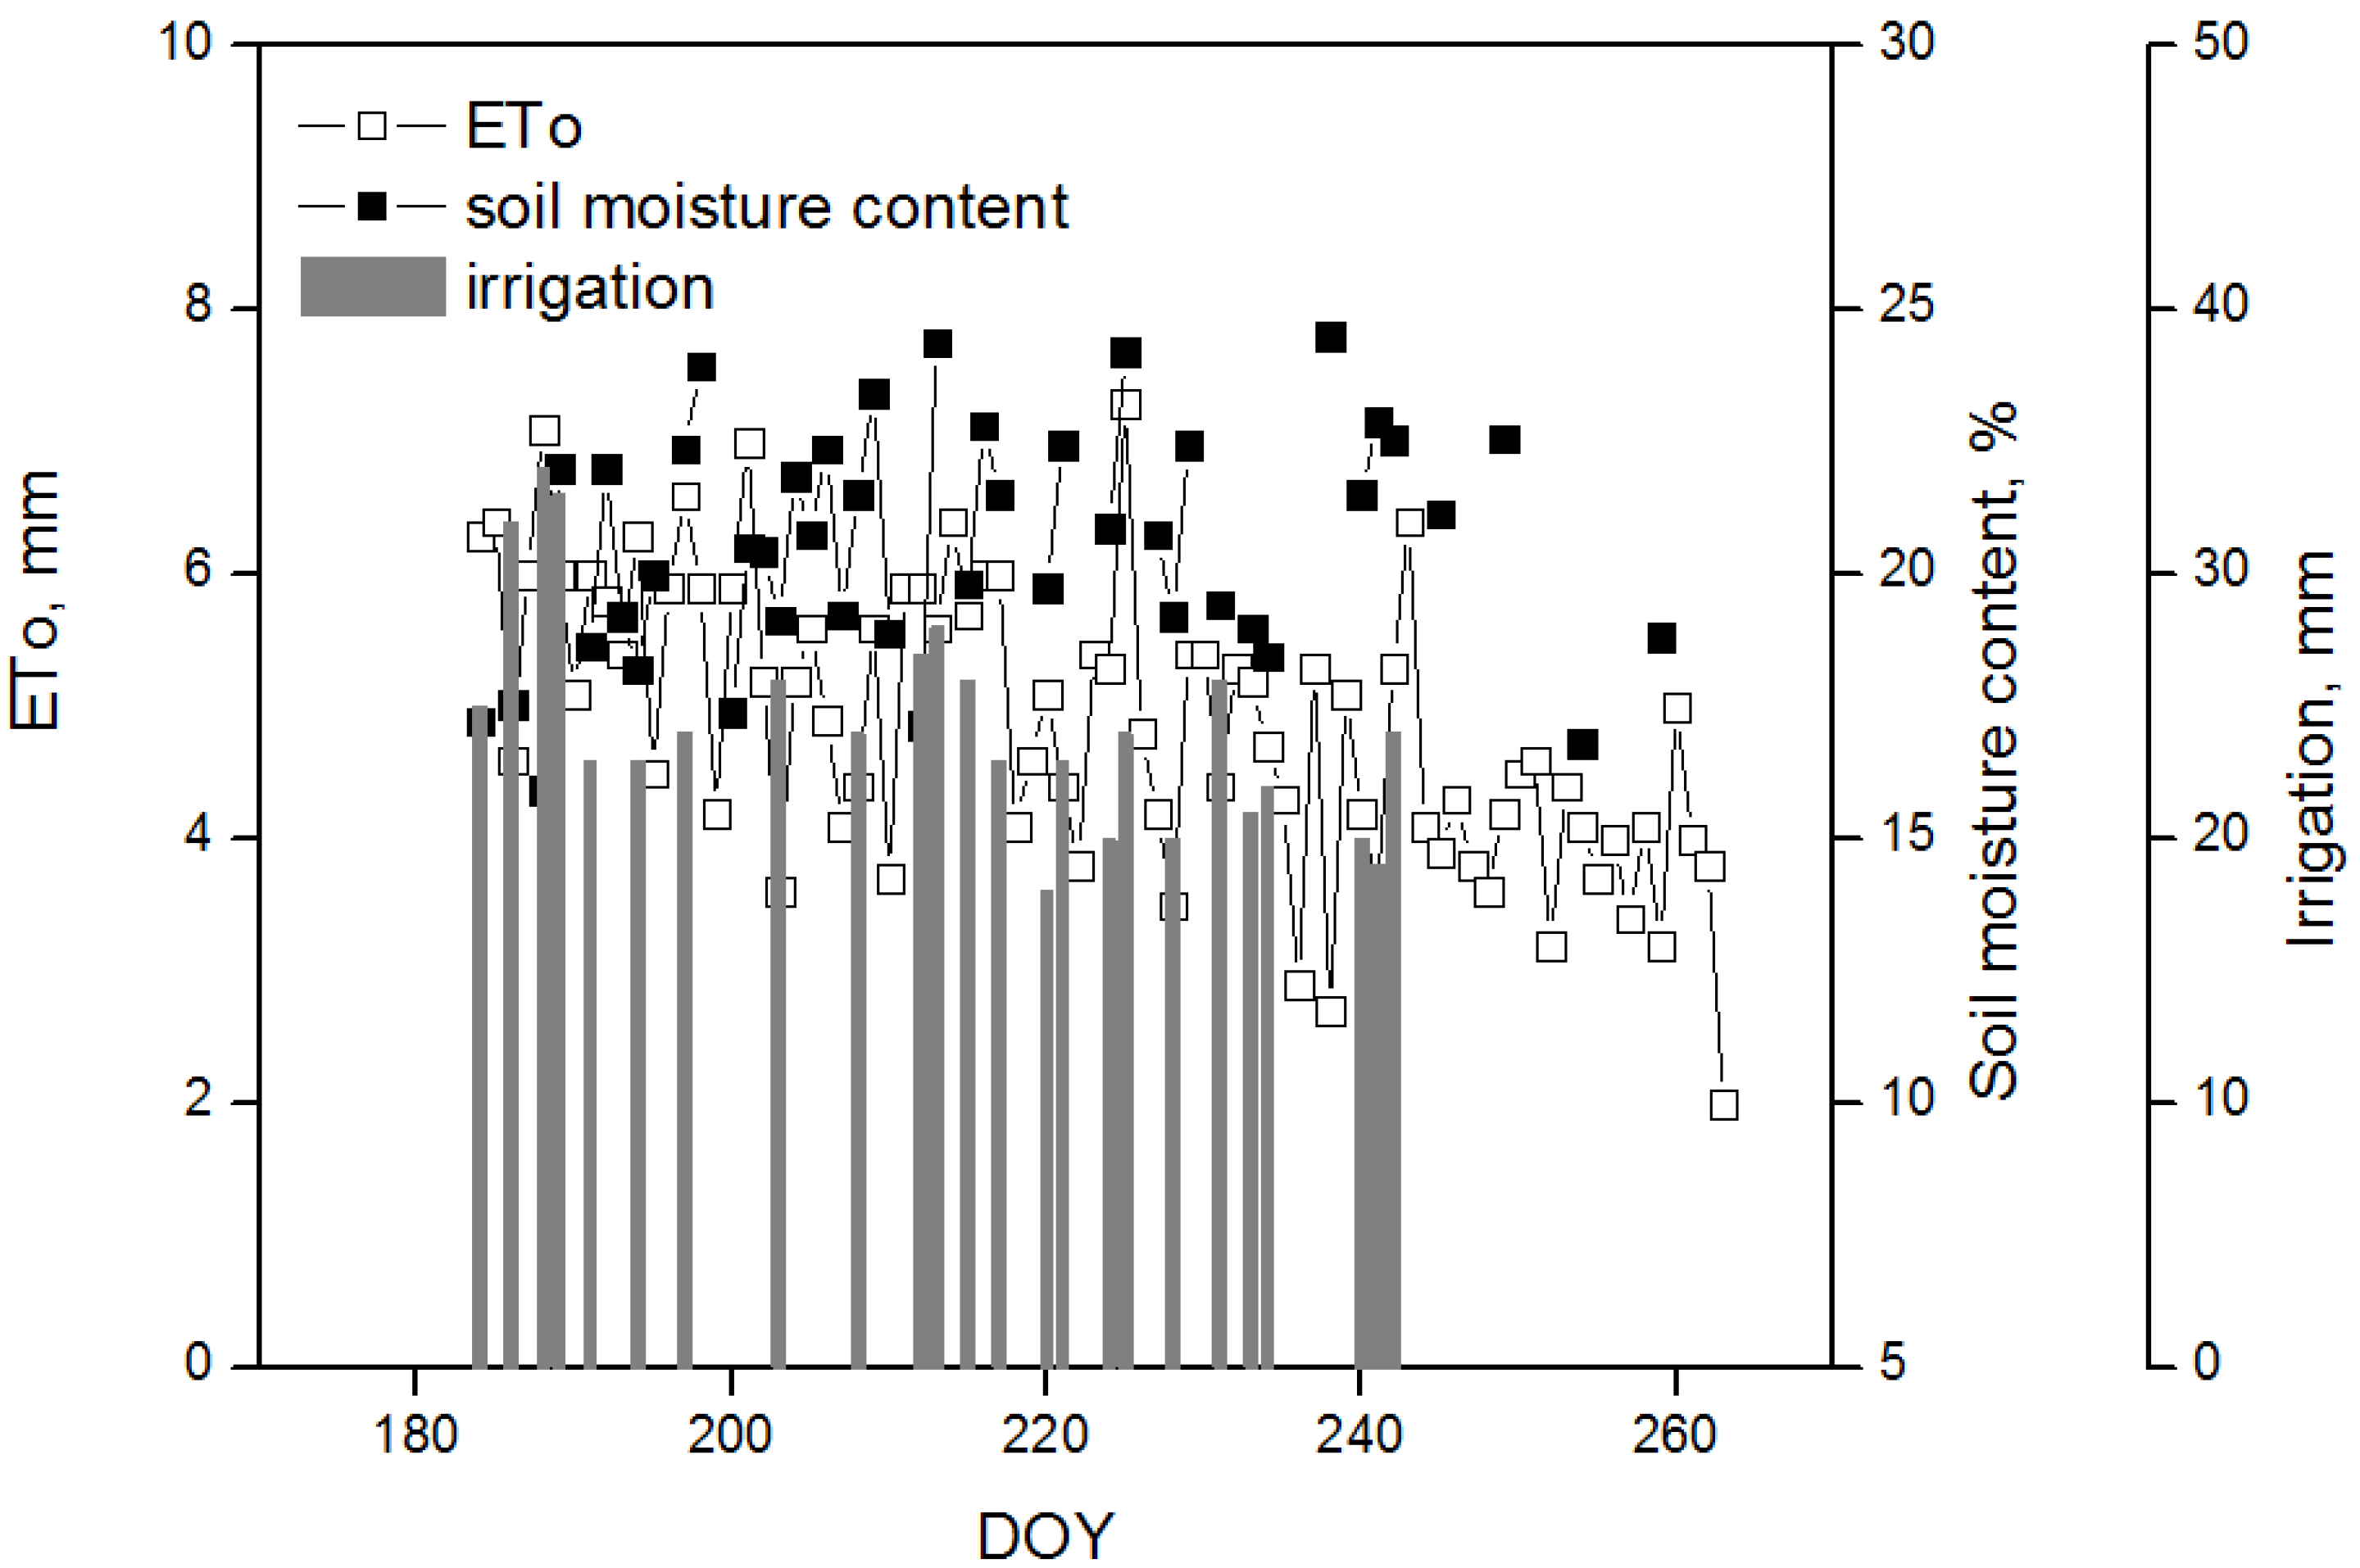
3.1. Irrigation and Soil Moisture Content

Potential evapotranspiration (ET0) from the date of sowing till the harvesting time amounted to 693 mm and the total irrigation amount was 631 mm. This does not included pre-plant leaching for salinity management. The crop received a total of 40 mm of rainfall throughout the growing season (Figure 5).

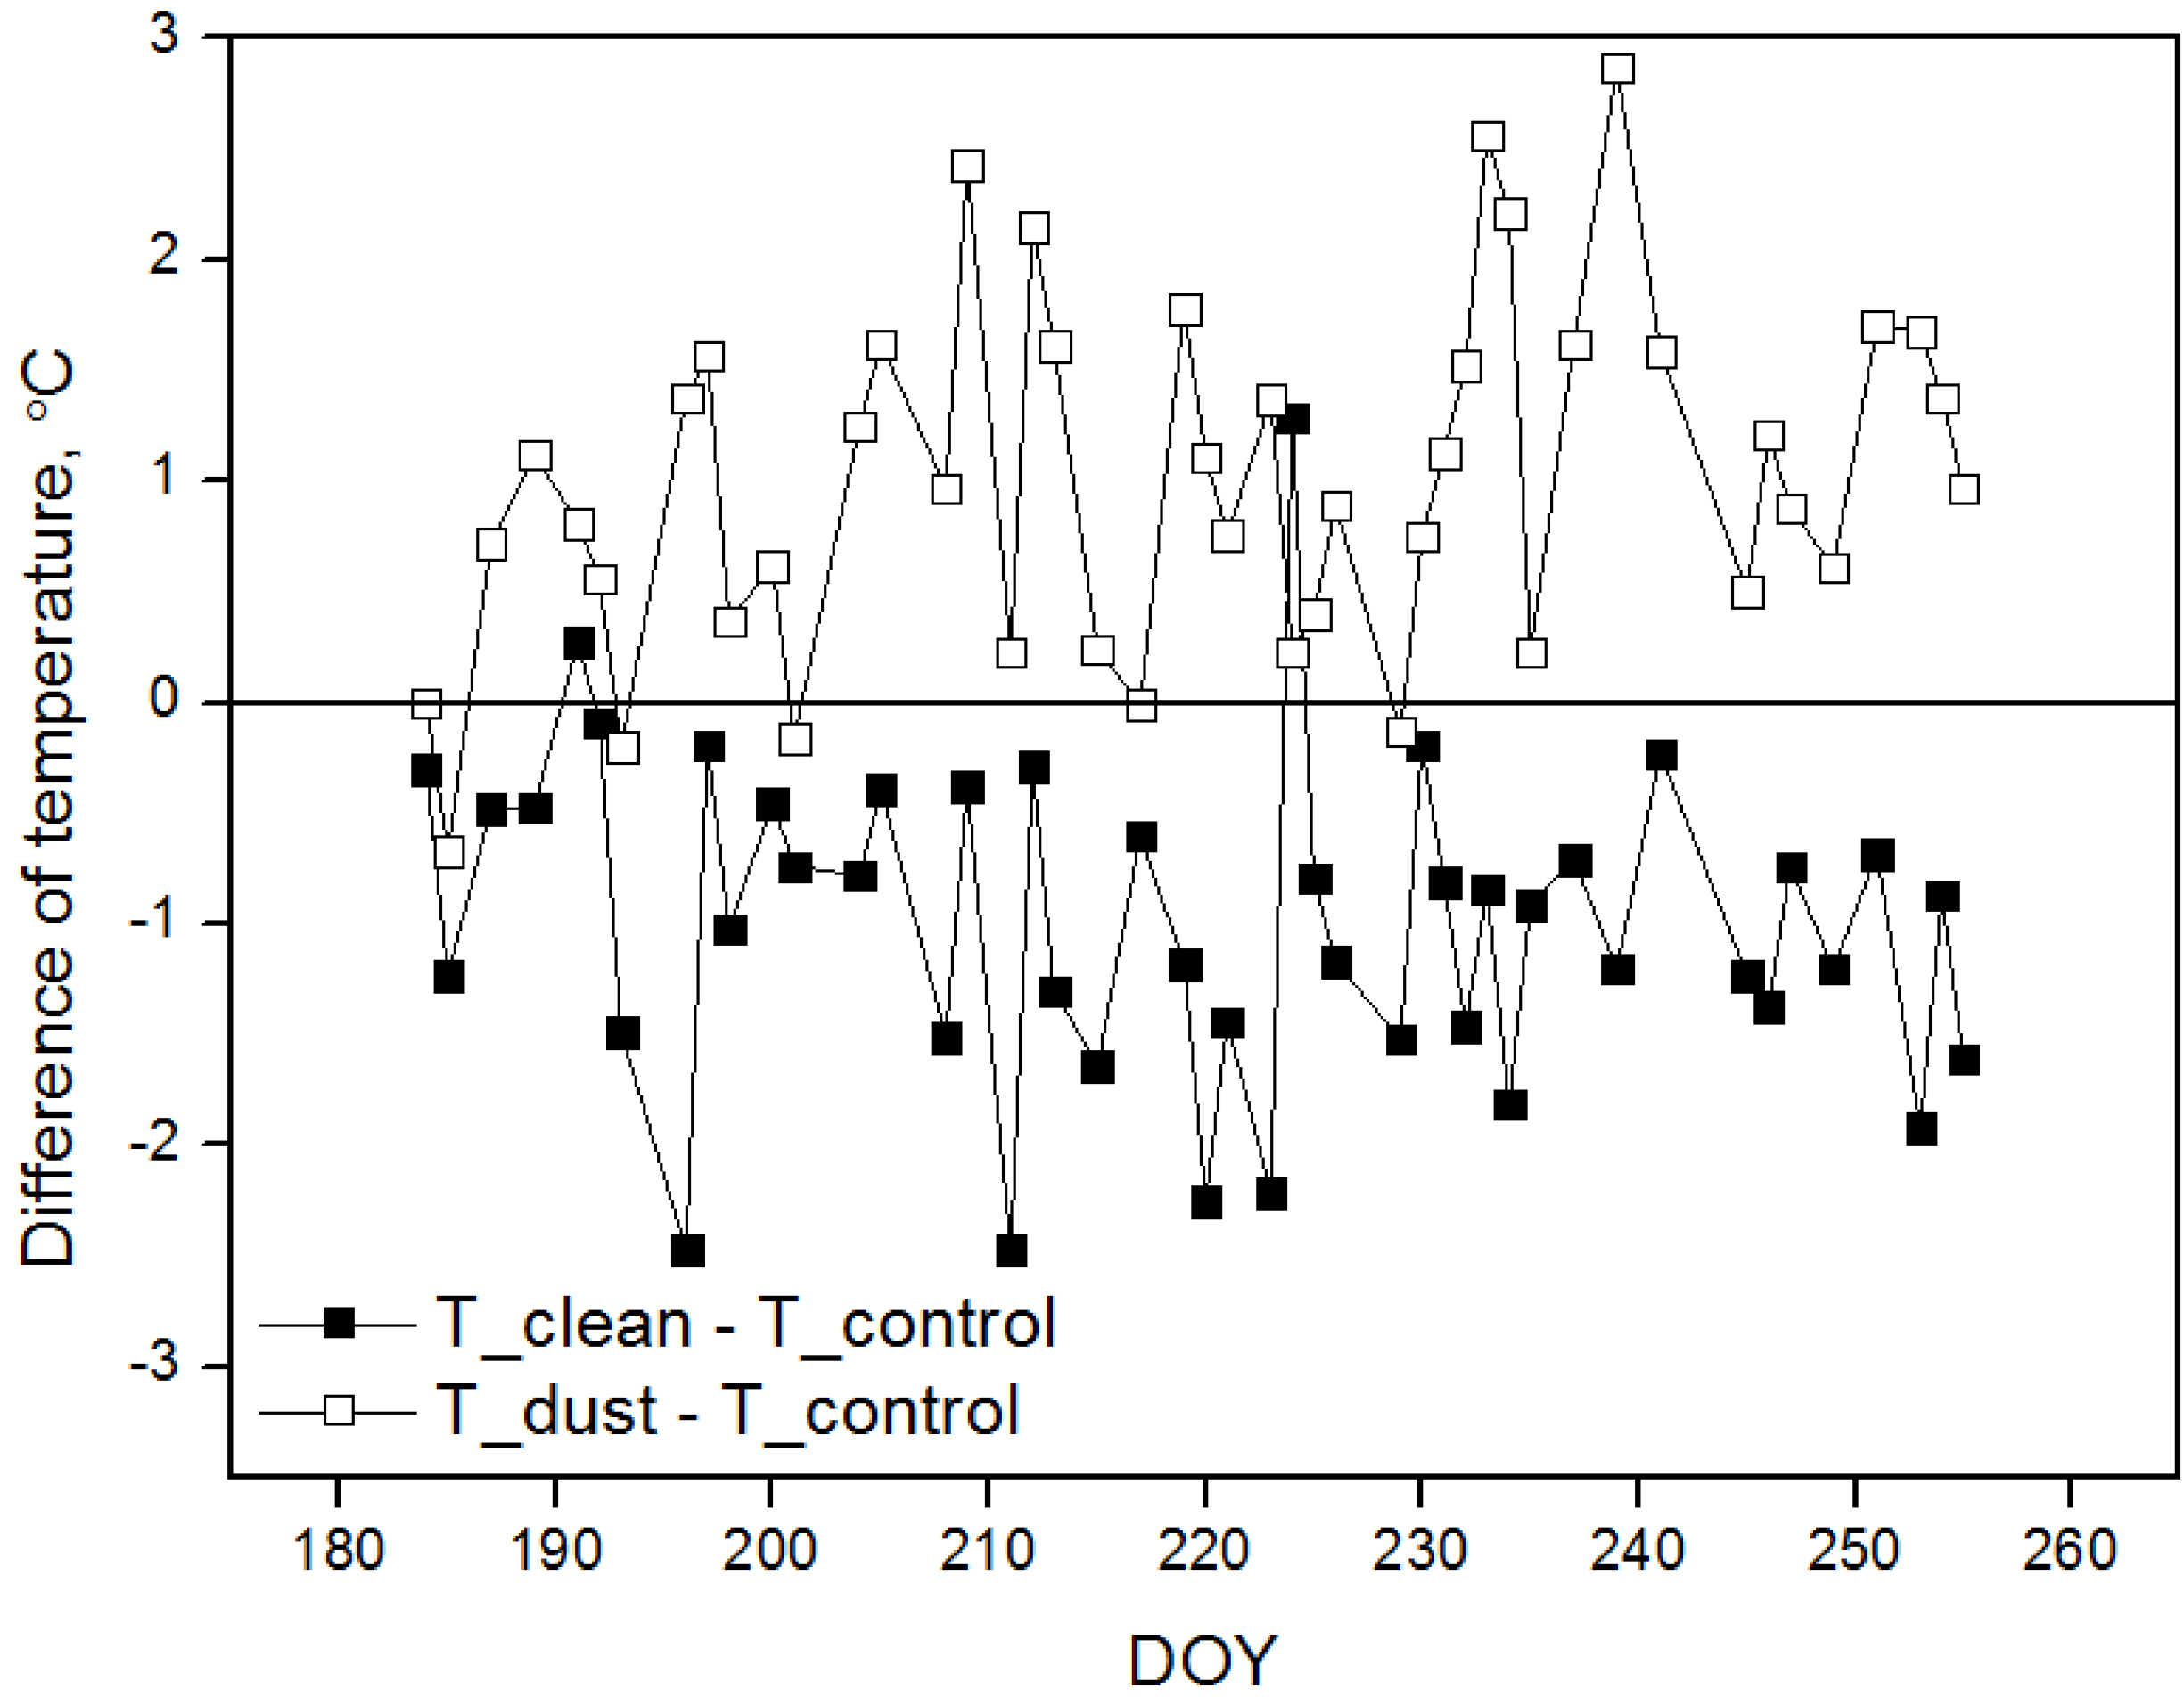
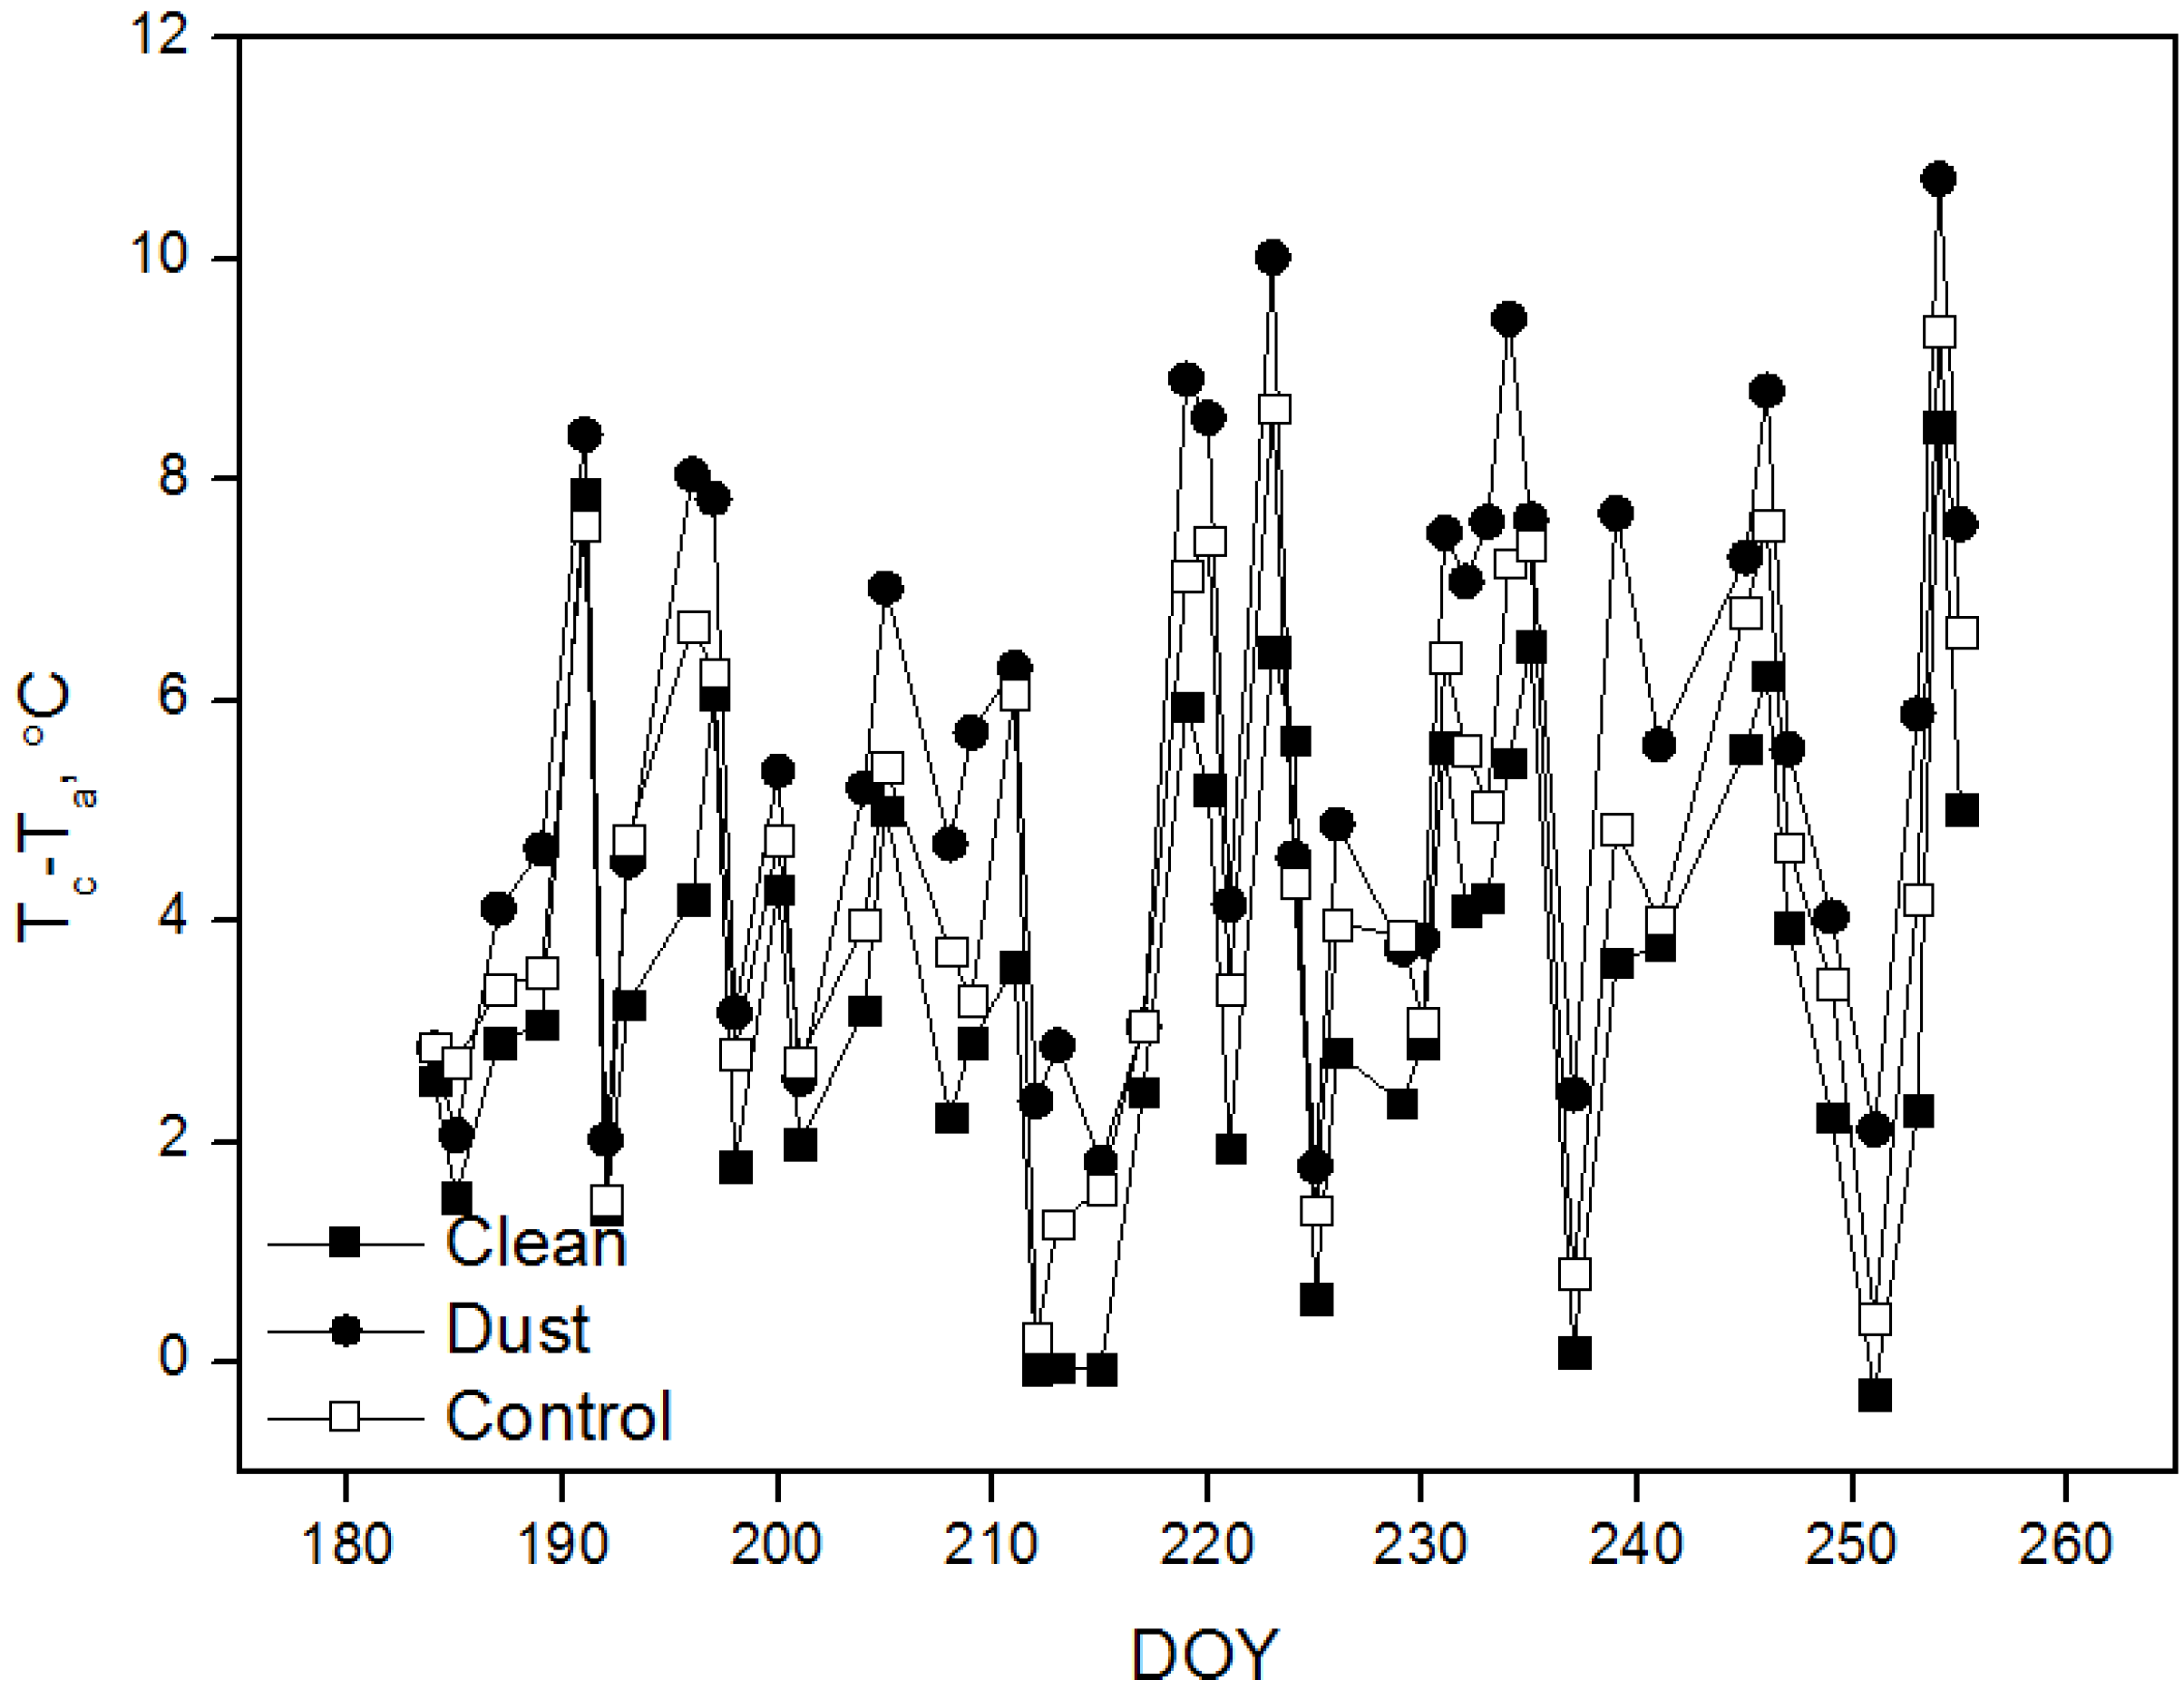
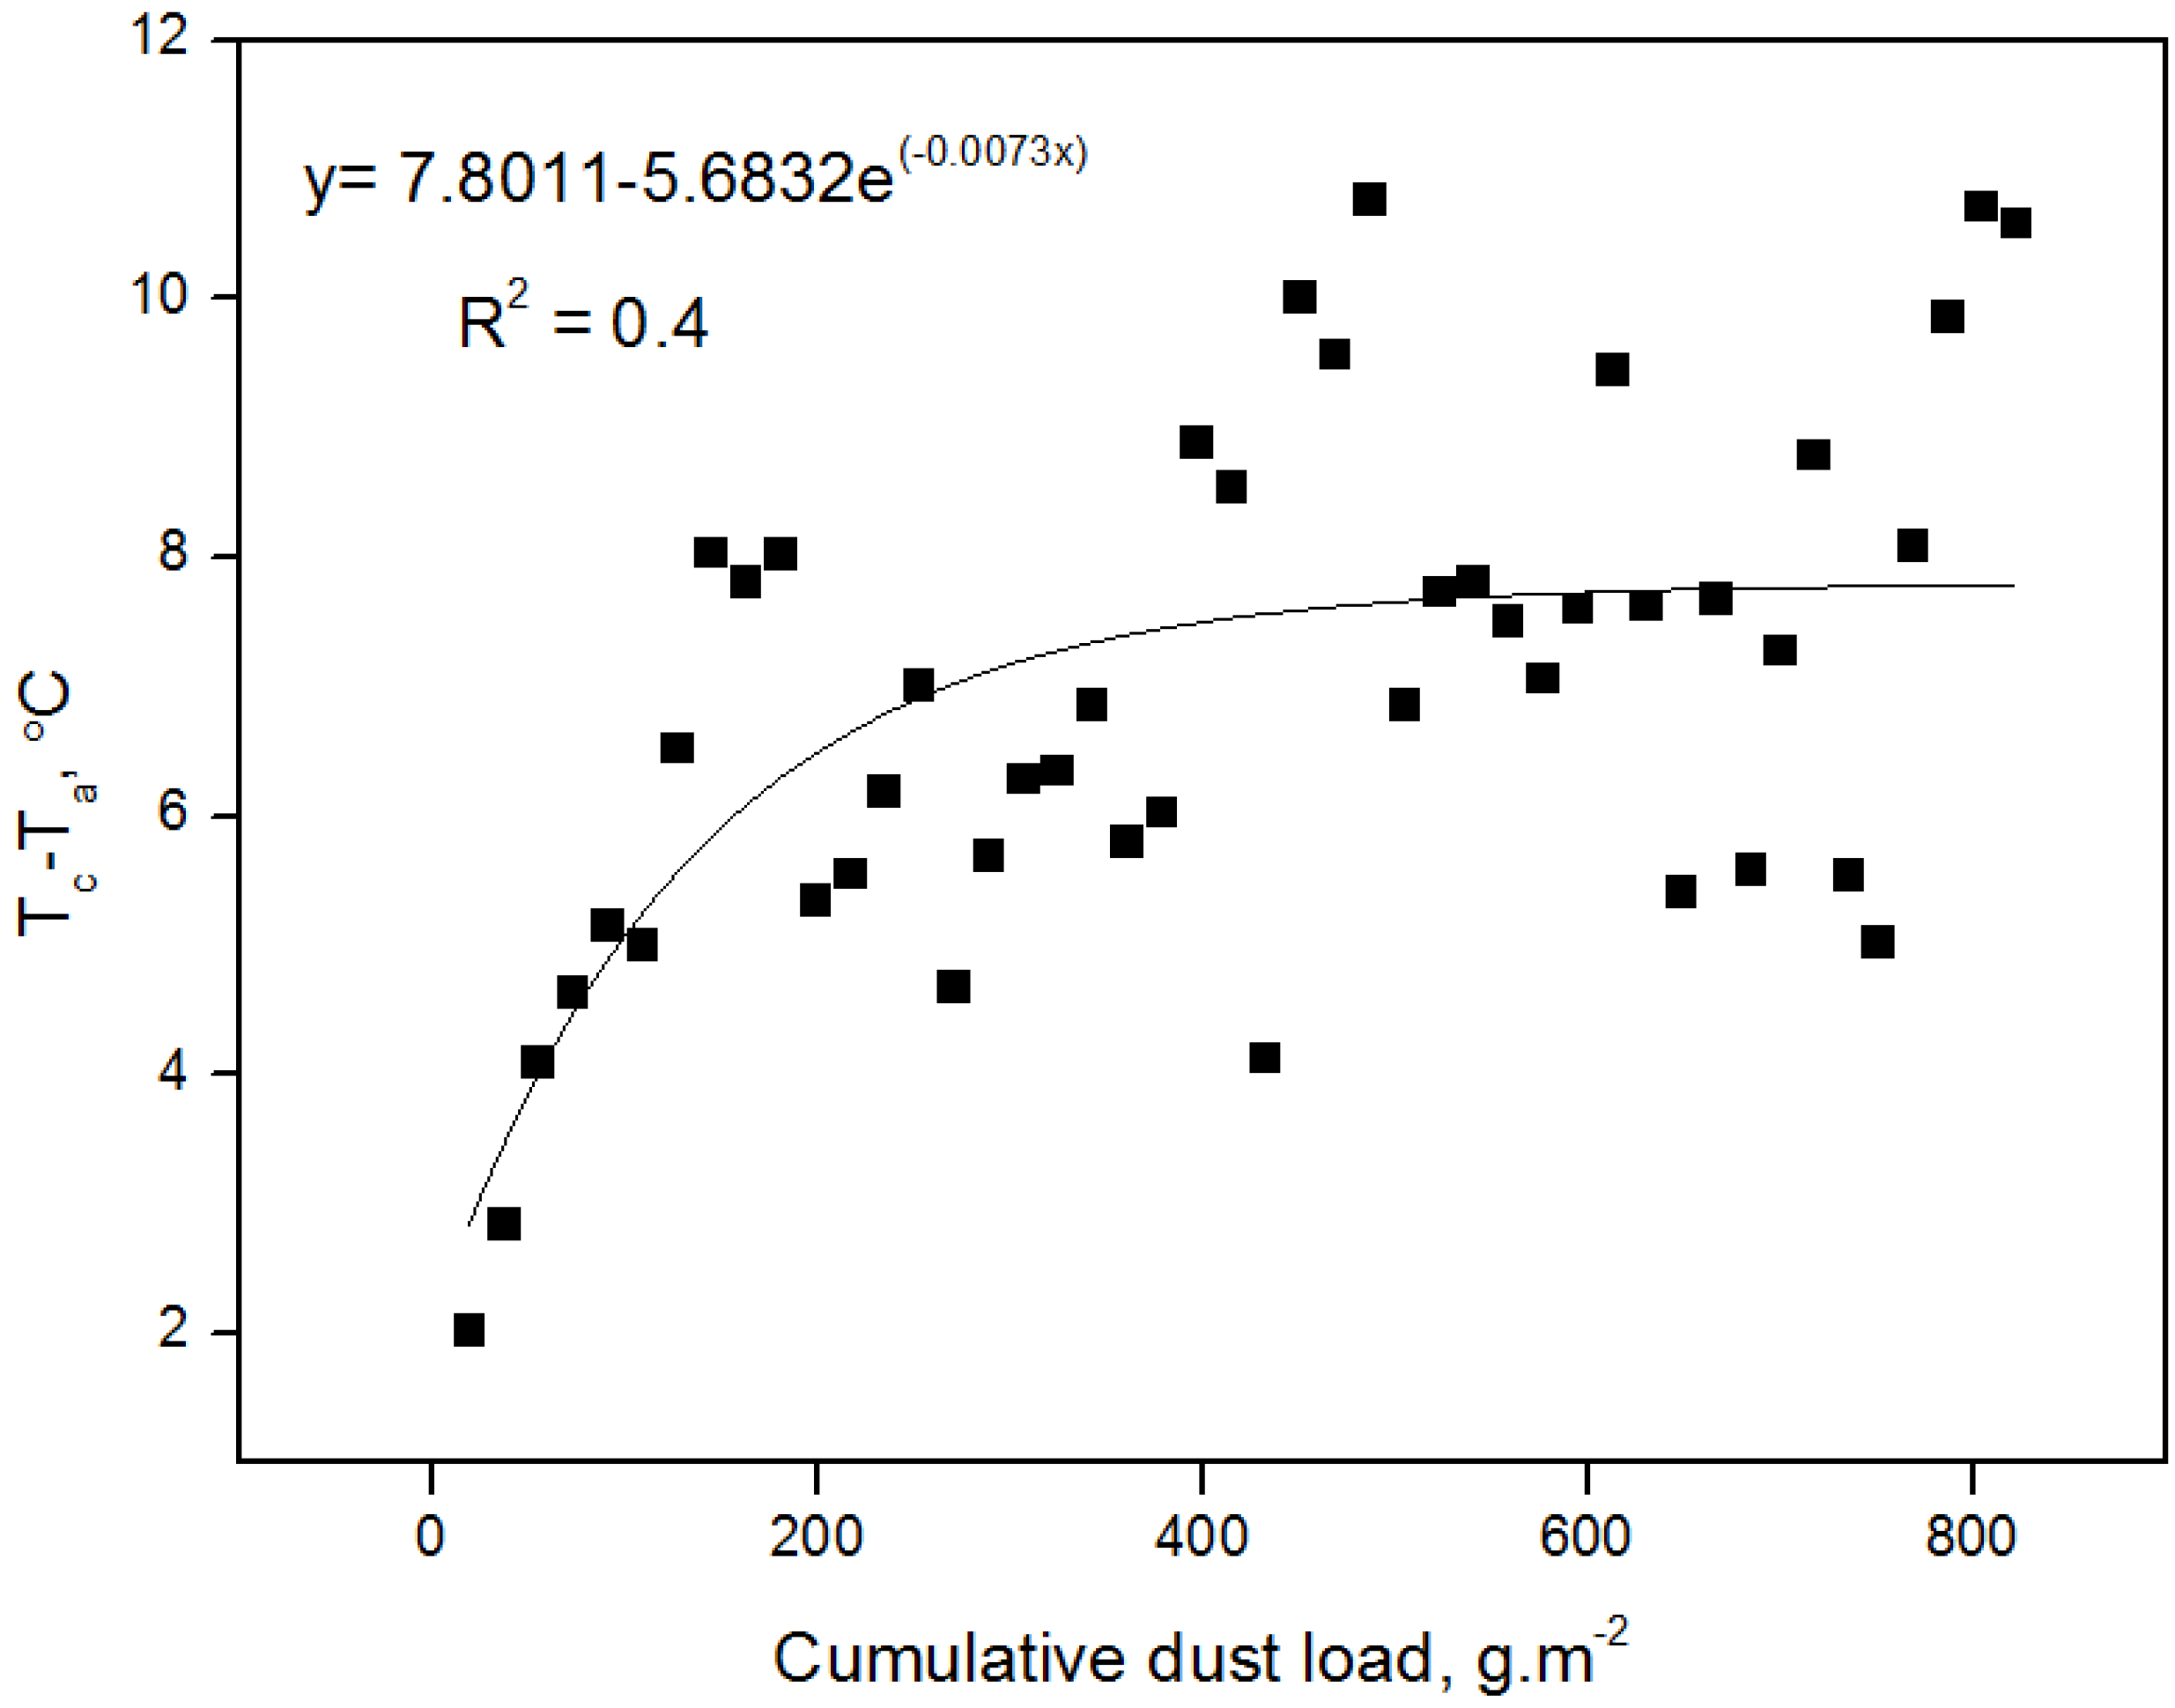
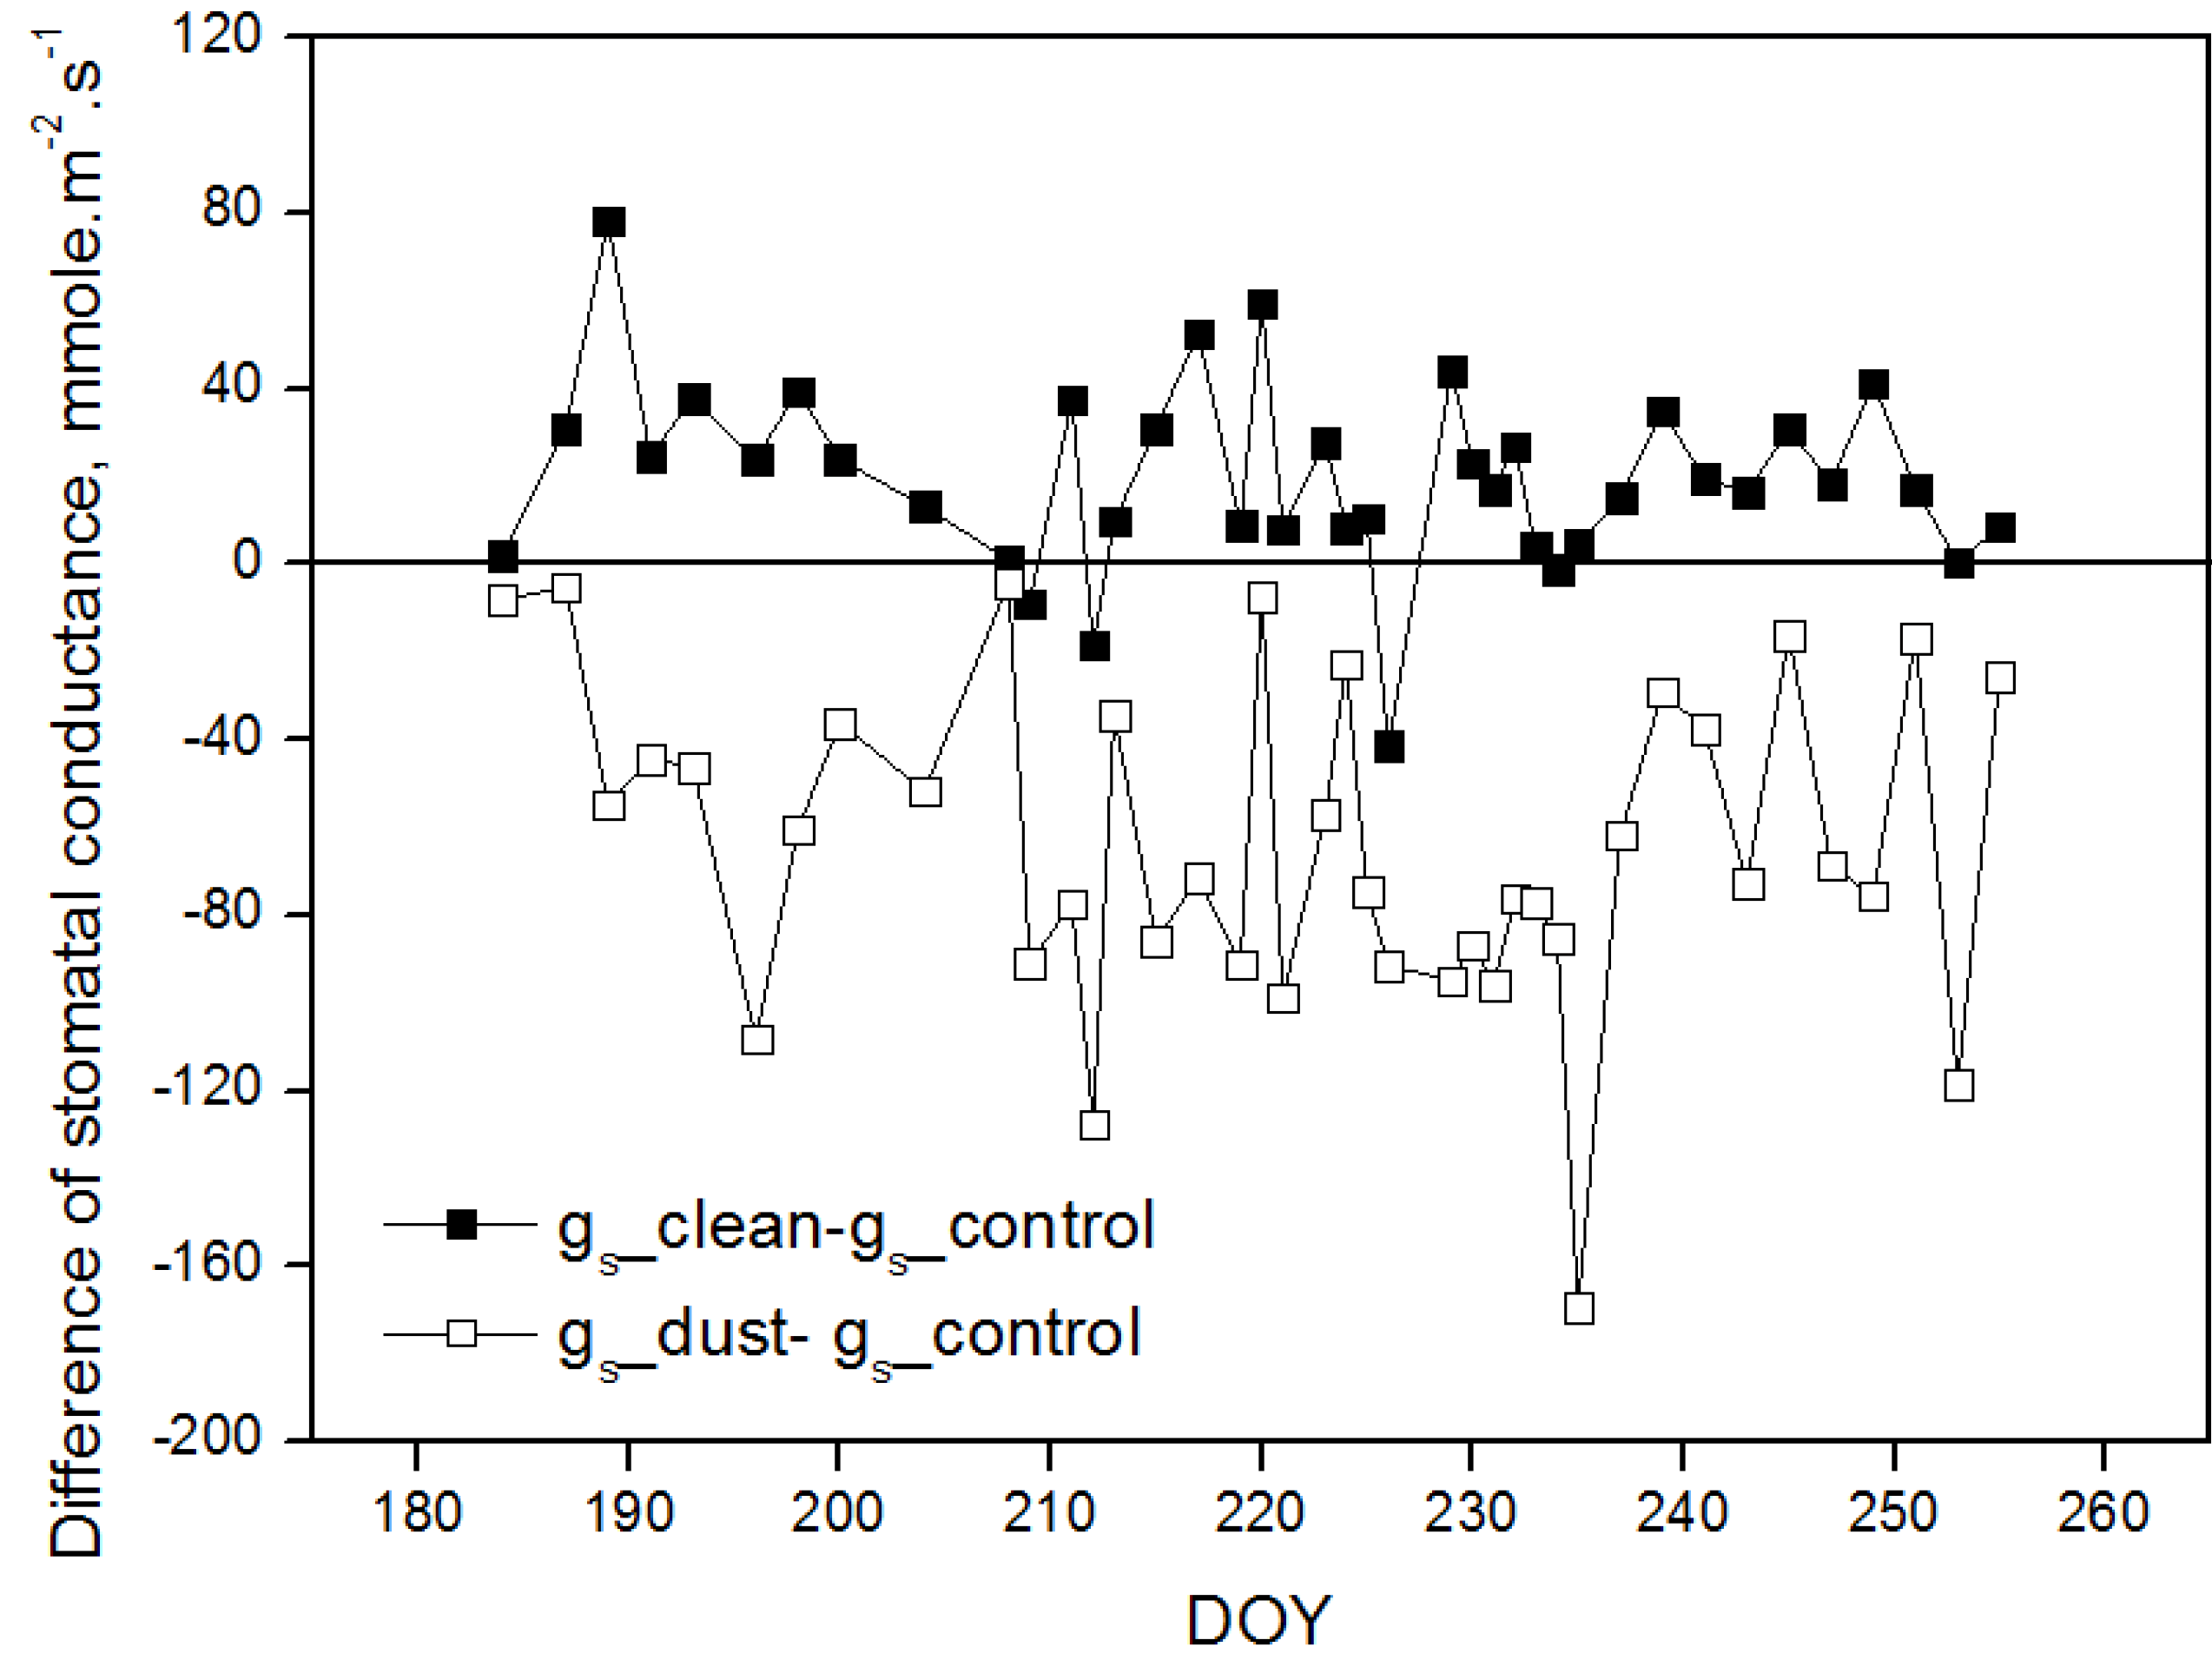
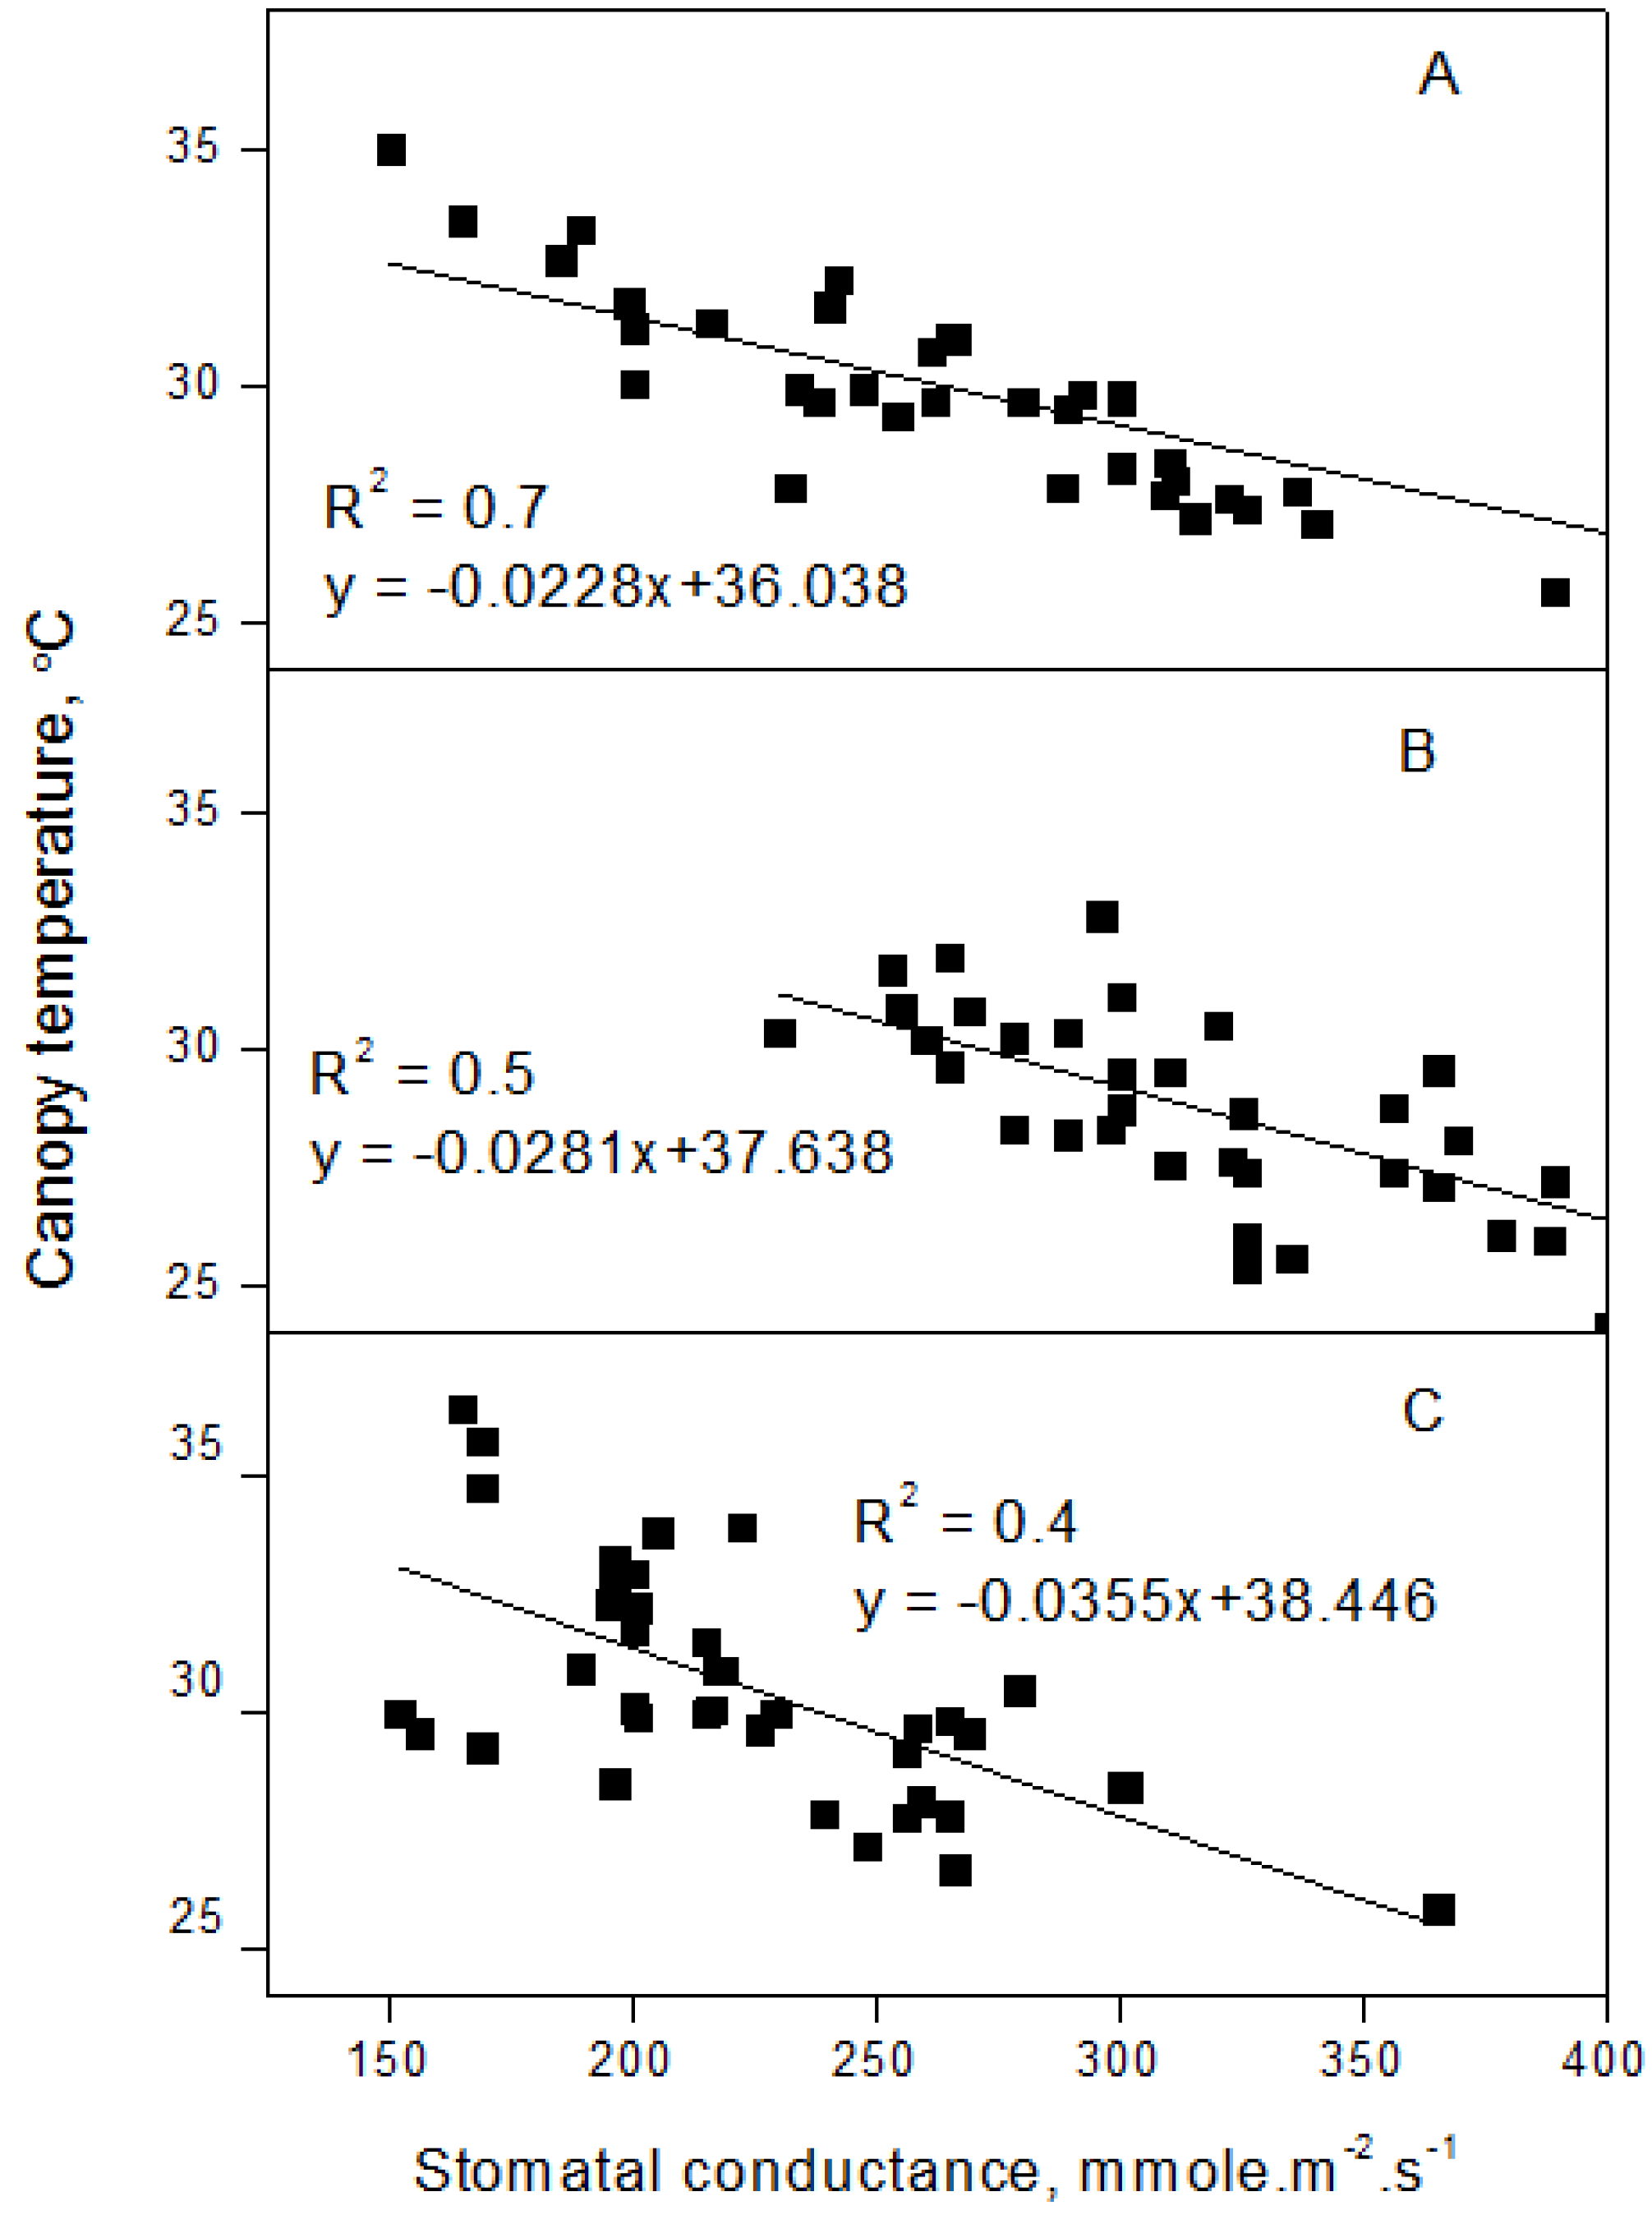
3.2. Canopy Temperature and Stomatal Conductance

The maximum temperature difference between the plants treated with dust and cleaned with water was 4.1 °C, whereas the temperature difference between plants applied with dust and control plants was 2.9 °C. The canopy temperature (Figure 6) difference between the treatments showed that dust treatment generally or on average had a higher canopy temperature when compared with the clean and control treatment. Figure 7 shows the difference in temperature between canopy (Tc) and ambient air (Ta), with the dust treatment showing higher values than the non-dusted treatments. Differences in canopy temperature between control, cleaned and dust applied were found to be significant (p < 0.001) for all of the measured days. In order to find out the influence of the quantity of dust on the canopy temperature, the accumulated amount of dust was divided into the total number of days when dust was applied. The increasing trend of the canopy temperature with the dust quantity in the beginning and later had no change in the canopy temperature with the amount of dust observed, as shown in Figure 8.
Figure 5. Potential evapotranspiration (ET0), irrigation and volumetric soil moisture content throughout the growing season (DOY = day of year).
Water 07 00116 g005
Figure 6. Canopy temperature difference between the treatment and control throughout the growing season.
Water 07 00116 g006
Figure 7. Difference of canopy temperature (Tc) and air temperature (Ta) for treatments and control.
Water 07 00116 g007
Figure 8. Influence of cumulative dust load on the difference of canopy temperature (Tc) and ambient temperature (Ta).
Water 07 00116 g008
The stomatal conductance (gs) of dusted plants was lower than that of control plants at all growing stages. The differences of gs among the treatments are shown in Figure 9. The gs of the clean leaves was compared to the dust-applied and control canopies, and the differences were higher between the dust-applied and control treatment. ANOVA analysis showed highly significant differences (p < 0.001) in stomatal conductance between the treatments. The stomatal conductance in all of the treatments decreased at the end of the experiment. The correlation between gs and the canopy temperature of all of the treatments showed a good correlation (Figure 10). It was observed that the canopy temperature of the dust treatment increased as gs decreased.
Figure 9. Difference of stomatal conductance between treatment and control.
Water 07 00116 g009
Figure 10. Canopy temperature vs. stomatal conductance: (A) control; (B) cleaned; (C) dusted.
Water 07 00116 g010

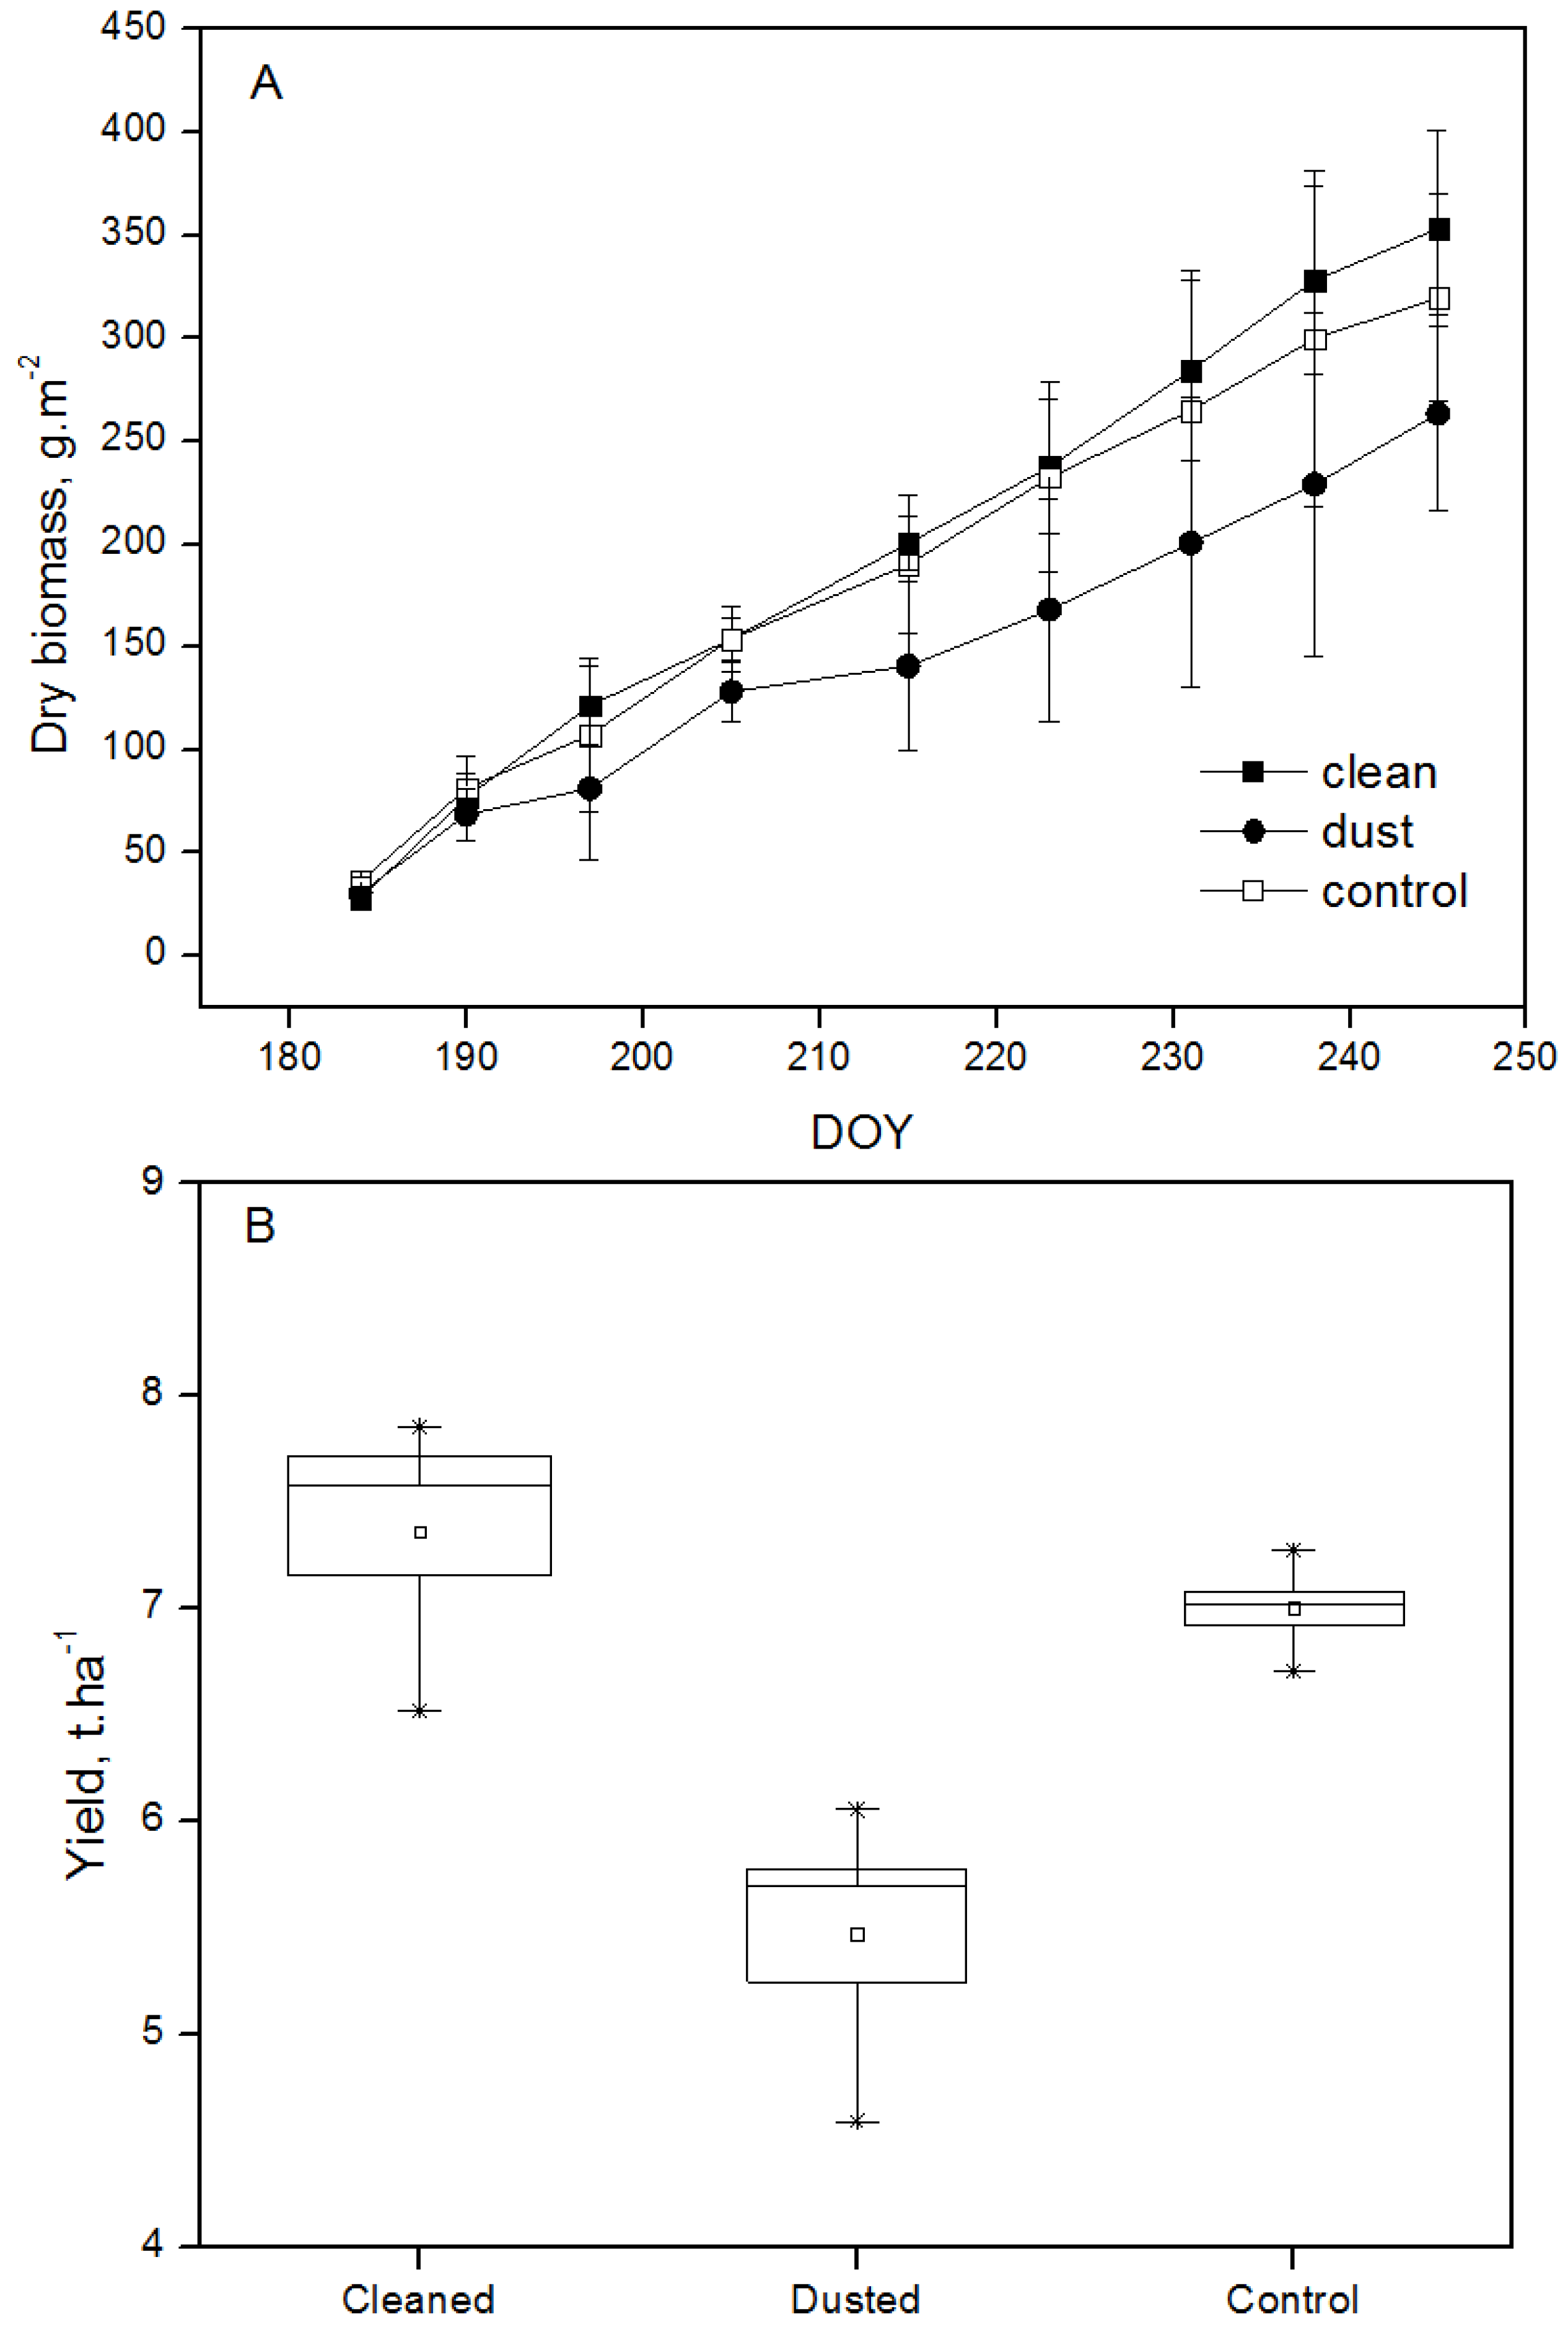
3.3. Biomass and Yield

Dry matter development throughout the measurement period is shown in Figure 11A. The dust treatment showed the lowest dry matter development when compared with the control and clean treatments. Significant differences (p < 0.05) of biomass between the control and clean treatments were visible after DOY 225. Box plots in Figure 11B show the yield data of all of the treatments. About a 28% yield reduction was observed when plants were exposed to additional dust compared with the control. By cleaning the leaves with water at a regular interval, there was a yield increase of 10%.
Figure 11. Dry biomass (A) throughout the growing season (DOY = day of year) and yield (B) of all of the treatments.
Water 07 00116 g011

4. Discussion

The highest cotton yield of 8 t·ha−1 was achieved in the plots where leaves were cleaned with water, which indicates the most favorable growing conditions. The mean reduction in yield of the dusted treatment was about 28%, indicating that the stress conditions in this experiment were relatively severe. Therefore, the reduction in yield can be taken as an integrated plant response to dust deposition on the cotton leaves. Previous studies reported similar results for black gram when leaves were dusted with cement dust, and a 50% reduction in the number of flowers was observed [29]. From the physiological measurements of control and dusted plants, it is quite apparent that a dusted environment had an unfavorable effect on the flowering and fruiting potential of plants, thus indicating a considerable reduction in the productivity of cotton [29]. It is important to state that by cleaning of the leaves, yield was increased by a substantial extent. While this is, of course, not a practical measure to be taken in field production, it shows the considerable damage that dust deposition causes to agricultural production. However, this data can contribute to analyzing the impact of dust deposition on agricultural production. In addition, environmental services in terms of DSS reduction can be evaluated.
Dust particles deposited on cotton leaves resulted in the reduction of the total dry matter weight (Figure 11). This is due to the reduction in the stomatal conductance, which might be due to the reduction in the photosynthesis rate, as it was not measured. This resulted in the decreased plant biomass, even just five to six days after dust was applied. In contrast to our results, [30] reported the decrease in dry plant weight after one to three days of the dust application, but this is due to the increased frequency of the dust application. Chaurasi et al. [31] reported a decrease in the aboveground biomass of a groundnut crop planted in the vicinity of the cement factory, and it increased as the distance between the two increased.
Since the stomatal conductance in cotton leaf is higher on the abaxial (lower) than on the adaxial (upper) surface [32,33], only the abaxial surface was used to determine the whole leaf stomatal conductance. Furthermore, due to the large number of measurement points and a small measurement window, i.e., 12:00–14:00 h, only one side of the leaf was used to measure conductance. This is unlike beans and cucumber, where the difference between the adaxial and abaxial stomatal conductance is large, and therefore, the sum of the values on both the surfaces is used to determine the whole leaf conductance [32]. Further, since the dust load on the adaxial surface is larger than that on the abaxial surface, it can be inferred that the adaxial surface influences the stomatal conductance more significantly than the latter. The transpiration rate of the dusted treatment was lower than that of the control treatment at all stages of growth. A 30% reduction in the stomatal conductance (Figure 9) of the dust-treated plants compared to the control treatment shows the blocking of the stomata on the top leaf surface due to the shading effect caused by the dust layer, which decreased the overall net photosynthesis rate soon after the dust was applied. Similar results were reported by Singh and Rao [20], where the transpiration rate was decreased by 22% as a result of cement dust on wheat plants. They concluded that cement crust reduces the light reaching the leaf surface and, thereby, decreases the thermal balance of the leaf. Hirano et al. [34] showed that this effect became greater as the dust particle size decreased.
The canopy temperature of the dust-applied leaves was always higher than the control and the water-cleaned treatments. An increase of 2 to 4 °C was observed between all treatments; however, thedust-applied treatment had the highest value of 4.1 °C when compared with the water-cleaned treatment. A lowered gs of the dusted treatment resulted in the higher leaf temperature [35]. A similar result was reported by Hirano et al. [34], where the temperature of the dusted leaves was higher than that of the control leaves, and the differences were 3.7, 3.1 and 1.7 °C at an air temperature of 15 °C, 25°C and 40 °C respectively. It was reported that road dust could raise the leaf temperatures by 2 to 4 °C [36]. Figure 8 depicts the effect of dust on leaf temperature, which clearly shows an increasing trend of the difference in Tc and Ta as the amount of dust applied increases, but later, no change in Tc-Ta was observed. This is in contrast to the results of Wijayratne et al. [17], who showed an increase in canopy temperature with the quantity of dust. The effect of the chemically inert dust on plant physiology is apparently similar to drought stress, which leads to stomatal closure and higher leaf temperature [37]. It is thus important to point out that a possible increase in the plant leaf temperature due to water stress can be excluded in this study, due to the fact that the soil moisture content was always about 70% of the field capacity. Sharifi et al. [38] reported that dust of 10 g·m−2 reduced Photosynthetically active radiation (PAR) absorption by 20% in desert shrubs. They found an inverse relationship between the weights of dust per unit leaf surface to absorptance of PAR. Therefore, apart from the closure of the stomatal conductance, another reason for the increase of canopy temperature of the dusted treatment is due to the increased absorbance of the near-infrared solar irradiance. For example, Eller [36] reported an experimental study in Switzerland and showed a doubling of absorptance in the near-infrared (700–1350 nm) for dusty leaves compared with control leaves, which resulted in a 2–4 °C increase in leaf temperature.

5. Conclusions

It was found that the dust accumulation on leaf surfaces induces water stress-like conditions, such as a reduction of stomata conductance, photosynthesis and transpiration and increased leaf temperature. More importantly, the results of this study show that both the growth of cotton plants and the yield are adversely affected by dust deposits by DSS over a short interval of time during the flowering period. There is no regular natural removal of dust particles on the plant leaves by strong winds and rain in arid climates, like in the study area, as rainfall is scarce and wind brings more dust rather than alleviating the situation. Future research should focus on measures to reduce the dust deposition on the plants, such as wind breaks and the avoidance of wind erosion, and their potential to increase the cotton yield in Northwest China.

Acknowledgments

This work was financed by the Bundesministerium für Bildung und Forschung (BMBF) within the collaborative research work “Sustainable Management of River Oases along the Tarim River” (SuMaRiO).

Author Contributions

Shamaila Zia-Khan, Wolfram Spreer and Joachim Müller designed the experiment. Shamaila Zia-Khan analyzed the data and wrote the first draft of the manuscript. Wolfram Spreer, Xiongkui He and Joachim Müller remotely supervised data collection, elaborated the statistical analysis and gave input on the draft of the manuscript.
Yang Pengnian provided his support and guidance throughout the field experiment. His timely suggestions during the experiment and writing have greatly improved the experiment design and the manuscript.
Zhao Xioning and Hussein Othmanli took the soil samples at different depths and did the soil chemical and physical properties analysis.
All authors reviewed the final manuscript.

Abbreviation

DSS
Dust and sand storms
Tc
Canopy temperature (°C)
Ta
Air temperature (°C)
gs
Stomatal conductance (mmole.m−2·s−1)
FC
Field capacity (m3·m−3)
PWP
Permanent wilting point (m3·m−3)
TAW
Total available water content (mm)
RAW
Readily available water content (mm)
Dp
Plant density
Cc
Capsule with cotton
Cwc
Capsule without cotton
Nsc
Capsules smaller than 2 cm
mc
Weight per capsule (g)
Nc
Average capsule number per cotton plant
Ycs
Cotton seed yield (t·ha−1)
ET0
Potential evapotranspiration (mm)
DOY
Days of the year (days)

Conflicts of Interest

The authors declare no conflict of interest.

References

  1. Qian, W.; Tang, X.; Quan, L. Regional characteristics of dust storms in China. Atmos. Environ. 2004, 38, 4895–4907. [Google Scholar] [CrossRef]
  2. Yang, X.; Mamtimin, A.; He, Q.; Liu, X.; Huo, W. Observation of saltation activity at Tazhong area in Taklimakan Desert, China. J. Arid Land 2013, 5, 32–41. [Google Scholar] [CrossRef]
  3. Wang, X.; Ma, Y.; Wang, H.; Tao, Z. Analysis on the climate characteristics of sandstorms in North Xinjiang. Acta Sci. Nat. Univ. Pekin. 2002, 38, 681–687. [Google Scholar]
  4. Qian, W.; Quan, L.; Shi, S. Variations of the dust storm in china and its climatic control. Am. Meteor. Soc. 2002, 15, 1216–1229. [Google Scholar]
  5. Abuduwaili, J.; Liu, D.W.; Wu, G.Y. Saline dust storms and their ecological impacts in arid regions. J. Arid Land 2010, 2, 144–150. [Google Scholar] [CrossRef]
  6. Zhang, X.; Chen, X.; Guo, Y.; Wang, Z.; Liu, L.; Paul, C.; Li, S.; Pi, H. Ambient TSP concentration and dustfall variation in Urumqi, China. J. Arid Land 2014, 6, 668–677. [Google Scholar] [CrossRef]
  7. Zhang, K.; Qu, J.; Zu, R.; Fang, H. Environmental characteristics of sandstrom of Minqin Oasis in china for recent 50 years. J. Environ. Sci. 2005, 17, 857–860. [Google Scholar]
  8. Ding, R.; Li, J. Decadal change of the spring dust storm in northwest China and the associated atmospheric circulation. Geophys. Res. Lett. 2005, 32, 1–4. [Google Scholar] [CrossRef]
  9. Giannadaki, D.; Pozzer, A.; Lelieveld, J. Modeled global effects of airborne desert dust on air quality and premature mortality. Atmos. Chem. Phys. 2014, 14, 957–968. [Google Scholar] [CrossRef]
  10. Wang, X.; Oenema, O.; Hoogmoed, W.B.; Perdok, U.D.; Cai, D. Dust storm erosion and its impact on soil carbon and nitrogen losses in northern China. Catena 2006, 66, 221–227. [Google Scholar] [CrossRef]
  11. Cleugh, H.A.; Miller, J.M.; Böhm, M. Direct mechanical effects of wind on crops. Agrofor. Syst. 1998, 41, 85–112. [Google Scholar] [CrossRef]
  12. Armbrust, D.V.; Retta, A. Wind and sandblast damage to growing vegetation. Ann. Arid Zone 2000, 39, 273–284. [Google Scholar]
  13. Prajapati, S.K. Ecological effect of airborne particulate matter on plants. Environ. Skept. Crit. 2002, 1, 12–22. [Google Scholar]
  14. Prajapati, S.K.; Tripathi, B.D. Seasonal variation of leaf dust accumulation and pigment content in plant species exposed to urban particulates pollution. J. Environ. Qual. 2008, 37, 865–870. [Google Scholar] [CrossRef] [PubMed]
  15. Cornish, K.; Radin, J.W.; Turcotte, E.L.; Lu, Z.-M.; Zeiger, E. Enhanced photosynthesis and stomatal conductance of Pima cotton (Gossvpium harbadense L.) bred for increased yield. Plant Physiol. 1991, 97, 484–489. [Google Scholar] [CrossRef] [PubMed]
  16. Hitron, O.; Zur, B. Differences in stomatal response within cotton canopy. Biotronic 1990, 19, 39–48. [Google Scholar]
  17. Wijayratne, U.C.; Scoles-Scilla, S.J.; Defalco, L.A. Dust deposition effects on growth and physiology of the endangered Astragalus Jaegerianus (Fabaceae). Madroño 2009, 56, 81–88. [Google Scholar] [CrossRef]
  18. Farmer, A.M. The effects of dust on vegetation—A review. Environ. Pollut. 1993, 79, 63–75. [Google Scholar] [CrossRef] [PubMed]
  19. Chaturvedi, R.K.; Prasad, S.; Rana, S.; Obaidullah, S.M.; Pandey, V.; Singh, H. Effect of dust load on the leaf attributes of the tree species growing along the roadside. Environ. Monit. Assess. 2012. [Google Scholar] [CrossRef]
  20. Singh, S.N.; Rao, D.N. Certain responses of wheat plants to cement dust pollution. Environ. Pollut. Ser. A 1981, 24, 75–81. [Google Scholar] [CrossRef]
  21. Raajasubramanian, D.; Sundaramoorthy, P.; Baskaran, L.; Ganesh, S.K.; Chidambaram, A.L.A.; Jeganathan, M. Effect of cement dust pollution on germination and growth of groundnut (Arachis hypogaea L.). Int. Multidiscip. Res. J. 2011, 1, 25–30. [Google Scholar]
  22. Darley, E.F. Studies on the effect of cement-kiln dust on vegetation. J. Air Pollut. Control Assoc. 1966, 16, 145–150. [Google Scholar] [CrossRef] [PubMed]
  23. Cook, R.J.; Barron, J.C.; Papendick, R.; Williams, G.J. Impact on agriculture of the Mount St. Helens Eruptions. Science 1981, 211, 16–21. [Google Scholar] [CrossRef] [PubMed]
  24. Nanos, G.D.; Ilias, F.I. Effects of inert dust on olive (Olea europaea L.) leaf physiological parameters. Environ. Sci. Pollut. Res. 2007, 14, 212–214. [Google Scholar] [CrossRef]
  25. Shukla, J.; Pandey, V.; Singh, S.N.; Yunus, M.; Singh, N.; Ahmad, K.J. Effect of cement dust on the growth and yield of Brassica campestris L. Environ. Pollut. 1990, 66, 81–88. [Google Scholar] [CrossRef] [PubMed]
  26. Thompson, J.R.; Mueller, P.W.; Fliickigert, W.; Rutter, A.J. The effect of dust on photosynthesis and its significance for roadside plants. Environ. Pollut. Ser. A 1984, 34, 171–190. [Google Scholar] [CrossRef]
  27. Allen, R.G.; Pereira, L.S.; Raes, D.; Smith, M. Crop Evapotranspiration—Guidelines for Computing Crop Water Requirements—FAO Irrigation and Drainage Paper 56; FAO—Food and Agriculture Organization of the United Nation: Rome, Italy, 1998. [Google Scholar]
  28. Anonymous. The Notification of Cotton Yield Calculation. Ministry of Agriculture of the People’s Republic of China. (in Chinese). 2010. Available online: http://www.moa.gov.cn/govpublic/ZZYGLS/201008/t20100816_1619412.htm (accessed on 13 August 2014). [Google Scholar]
  29. Prasad, M.S.V.; Inamdar, J.A. Effect of cement kiln dust pollution on black gram (Vigna mungo (L.) Hepper). Proc. Plant Sci. 1990, 100, 435–443. [Google Scholar]
  30. Armbrust, D.V. Effect of particulates (dust) on cotton growth, photosynthesis, and respiration. Agron. J. 1986, 78, 1078–1081. [Google Scholar] [CrossRef]
  31. Chaurasia, S.; Karwaria, A.; Gupta, D.A. Cement dust pollution and morphological attributes of groundnut (Arachis hypogaea), Kodinar, Gujrat, India. J. Environ. Sci. Toxicol. Food Technol. 2013, 4, 20–25. [Google Scholar] [CrossRef]
  32. Lu, Z.; Quinones, M.A.; Zeiger, E. Abaxial and adaxial stomata from Pima cotton (Gossypium barbadense L.) differ in their pigment content and sensitivity to light quality. Plant Cell Environ. 1993, 16, 851–858. [Google Scholar] [CrossRef]
  33. Pallas, J.E., Jr. An apparent anomaly in peanut leaf conductance. Plant Physiol. 1980, 65, 848–851. [Google Scholar] [CrossRef] [PubMed]
  34. Hirano, T.; Kiyota, M.; Aiga, I. Physical effects of dust on leaf physiology of cucumber and kidney beans plants. Environ. Pollut. 1995, 89, 255–261. [Google Scholar] [CrossRef] [PubMed]
  35. Zia, S.; Du, W.; Spreer, W.; Spohrer, K.; He, X.; Müller, J. Assessing crop water stress of winter wheat by thermography under different irrigation regimes in North China Plain. Int. J. Agric. Biol. Eng. 2012, 5, 24–34. [Google Scholar]
  36. Eller, B.M. Road dust induced increase of leaf temperature. Environ. Pollut. 1977, 13, 99–107. [Google Scholar] [CrossRef]
  37. Zia, S.; Romano, G.; Spreer, W.; Sanchez, C.; Cairns, J.; Araus, J.L.; Müller, J. Infrared thermal imaging as a rapid tool for identifying water-stress tolerant maize genotypes of different phenology. J. Agron. Crop Sci. 2013, 199, 75–84. [Google Scholar] [CrossRef]
  38. Sharifi, R.M.; Gibson, A.C.; Rundel, P.W. Dust impacts on gas exchange in Mojave desert shrubs. J. Appl. Ecol. 1997, 34, 837–846. [Google Scholar] [CrossRef]

