Article

Multiple Time-Scale Monitoring to Address Dynamic Seasonality and Storm Pulses of Stream Water Quality in Mountainous Watersheds

1
Department of Forest Environment Protection, College of Forest & Environmental Sciences, Kangwon National University, Chuncheon 200-701, Korea
2
Department of Forest Resources, College of Forest & Environmental Sciences, Kangwon National University, Chuncheon 200-701, Korea
3
Department of Hydrology, University of Bayreuth, Bayreuth D-95440, Germany
4
Department of Environmental Science & Engineering, Ewha Womans University, Seoul 120-750, Korea
*
Author to whom correspondence should be addressed.
Water 2015, 7(11), 6117-6138; https://doi.org/10.3390/w7116117
Submission received: 23 September 2015 / Revised: 23 October 2015 / Accepted: 27 October 2015 / Published: 4 November 2015

Abstract

:
Rainfall variability and extreme events can amplify the seasonality and storm pulses of stream water chemistry in mountainous watersheds under monsoon climates. To establish a monitoring program optimized for identifying potential risks to stream water quality arising from rainfall variability and extremes, we examined water chemistry data collected on different timescales. At a small forested watershed, bi-weekly sampling lasted over two years, in comparison to three other biweekly sampling sites. In addition, high-frequency continuous measurements of pH, electrical conductivity, and turbidity were conducted in tandem with automatic water sampling at 2 h intervals during eight rainfall events. Biweekly monitoring showed that during the summer monsoon period, electrical conductivity (EC), dissolved oxygen (DO), and dissolved ion concentrations generally decreased, but total suspended solids (TSS) slightly increased. A noticeable variation from the usual seasonal pattern was that DO levels substantially decreased during an extended drought. Bi-hourly storm event samplings exhibited large changes in the concentrations of TSS and particulate and dissolved organic carbon (POC; DOC) during intense rainfall events. However, extreme fluctuations in sediment export during discharge peaks could be detected only by turbidity measurements at 5 min intervals. Concomitant measurements during rainfall events established empirical relationships between turbidity and TSS or POC. These results suggest that routine monitoring based on weekly to monthly sampling is valid only in addressing general seasonal patterns or long-lasting phenomena such as drought effects. We propose an “adaptive” monitoring scheme that combines routine monitoring for general seasonal patterns and high-frequency instrumental measurements of water quality components exhibiting rapid responses pulsing during intense rainfall events.

Graphical Abstract

1. Introduction

Headwater streams are a habitat for aquatic organisms, provide drinking water for downstream population centers, and contribute sources of organic matter, nutrients, and sediments to higher-order streams and rivers [1,2]. Mountainous watersheds are particularly important for providing water resources, as illustrated by the disproportionately high contribution of mountainous areas (32% of the world’s land area) to the total discharge in the world’s major river basins (63%) [3]. Land use changes on steep mountainous terrain, such as deforestation and agricultural expansion, have been associated with elevated flood risks [4,5] and water quality deterioration caused by suspended sediment eroded from disturbed soils [6,7]. More frequent intense monsoon rainfall events, which might occur as a consequence of climate change [8], can also have significant impacts on material transport and surface water quality in mountainous watersheds [9]. Instantaneous changes in discharge rates and stream chemistry in response to intense rainfalls cannot be adequately captured by conventional monitoring approaches and networks based on low frequency water sampling at weekly to monthly intervals. Novel monitoring approaches employing high frequency sampling and advanced sensor techniques have been proposed as tools to detect pulses of dissolved solutes, suspended sediments, or organic matter during important hydrologic events such as heavy rainfalls or snowmelts [10,11]. However, there have been few systematic assessments of sampling frequency and water quality components in the context of assessing climate-induced risks to water quality in mountainous headwater streams.
The strong coupling of headwater streams to hillslope processes often results in large sediment flows from episodic slope failures during extreme hydrologic events [1,7]. Forest management practices have been shown to significantly affect soil erosion on steep forested slopes through changes in forest conditions such as tree density, species composition, and soil compaction [12]. Recent studies have shown the effects of extreme climatic events such as typhoons on the flow of sediments and nutrients in mountainous watersheds in East Asia [13,14,15]. Suspended sediment is a major water quality problem in headwater streams, as it degrades drinking water quality and impacts aquatic organism habitats [6,16]. It also plays an important role in transporting nutrients [17], particulate organic carbon (POC) [11,18,19], and toxic metals [20].
Temporal variations in stream water chemistry reflect changes in both the forest ecosystem processes and the hydro-biogeochemical processes on the watershed level [21], offering a window through which we can monitor changes in environmental conditions that are important for regulating the production and release of materials within a forested watershed [22]. For example, long-term changes in stream water nitrogen and sulfur concentrations have been linked to the changing rates of acid deposition over recent decades [23,24]. It has also been suggested that changes in the amount and spatiotemporal distribution of precipitation, attributed to global climate change, has significant influences on the biogeochemical processes that regulate nutrient production and hydrologic export in forested watersheds [9,25,26]. Changes in rainfall amount and intensity can affect hydrologic flowpaths, along which nutrients released from soil sources are transported into streams [27]. Compared to the relatively well-established relationships between dissolved organic carbon (DOC) in forest streams and changing hydrologic conditions during storms [28,29], inconsistent patterns have been observed regarding nutrient releases in responses to storms (e.g., [30,31]). It has recently been reported that the concentrations and fluxes of DOC and POC in headwater streams respond differently to rainfall events of varying intensity and duration, with much stronger responses of POC occurring during extreme rainfall events [11,32].
Extreme rainfall events are often defined as events exceeding relative (i.e., the upper first percentile of long-term data) or absolute (e.g., 100 mm per day) thresholds of precipitation [33]. The frequency and intensity of extreme rainfall events has been increasing over a large part of the Northern Hemisphere [8,34], including the Korean Peninsula [35]. There have been many reports on storm-induced water quality deterioration in large watersheds where storm responses might be more moderate compared to more rapid responses at smaller watersheds (e.g., [10,36,37]). Humic-like substances associated with aromatic and condensed structures have been shown to increase in forested watersheds during intense rainfall events, elevating the potential of disinfection byproduct formation upon chlorination in drinking water facilities [38,39]. These studies provide rare examples of climate-induced risks to water quality in headwater streams draining forested watersheds, yet more high-resolution monitoring data should be collected across a range of climatic conditions and watershed types to enhance our capacity to predict stream water quality changes during extreme rainfall events of varying duration and intensity.
The primary objective of this study was to compare different monitoring approaches based on different timescales and sampling methods in order to establish monitoring programs that can address large temporal variations of stream water quality associated with rainfall variability and extremes. Stream water chemistry was monitored on sub-hourly to bi-weekly timescales at small forested watersheds in the Haean Basin—a mountainous basin in northern South Korea. A specific goal was to identify major climate-induced risks to stream water quality in mountainous watersheds. Another important goal was to examine the potential of high-frequency, continuous measurements of turbidity to capture short-term changes in stream concentrations of suspended sediment and POC during rainfall events. For this purpose, high-frequency (5 min) instrumental measurements of pH, electrical conductivity (EC), and turbidity during several rainfall events of various duration and intensity were compared with bi-hourly measurements using an automatic water sampler.

2. Materials and Methods
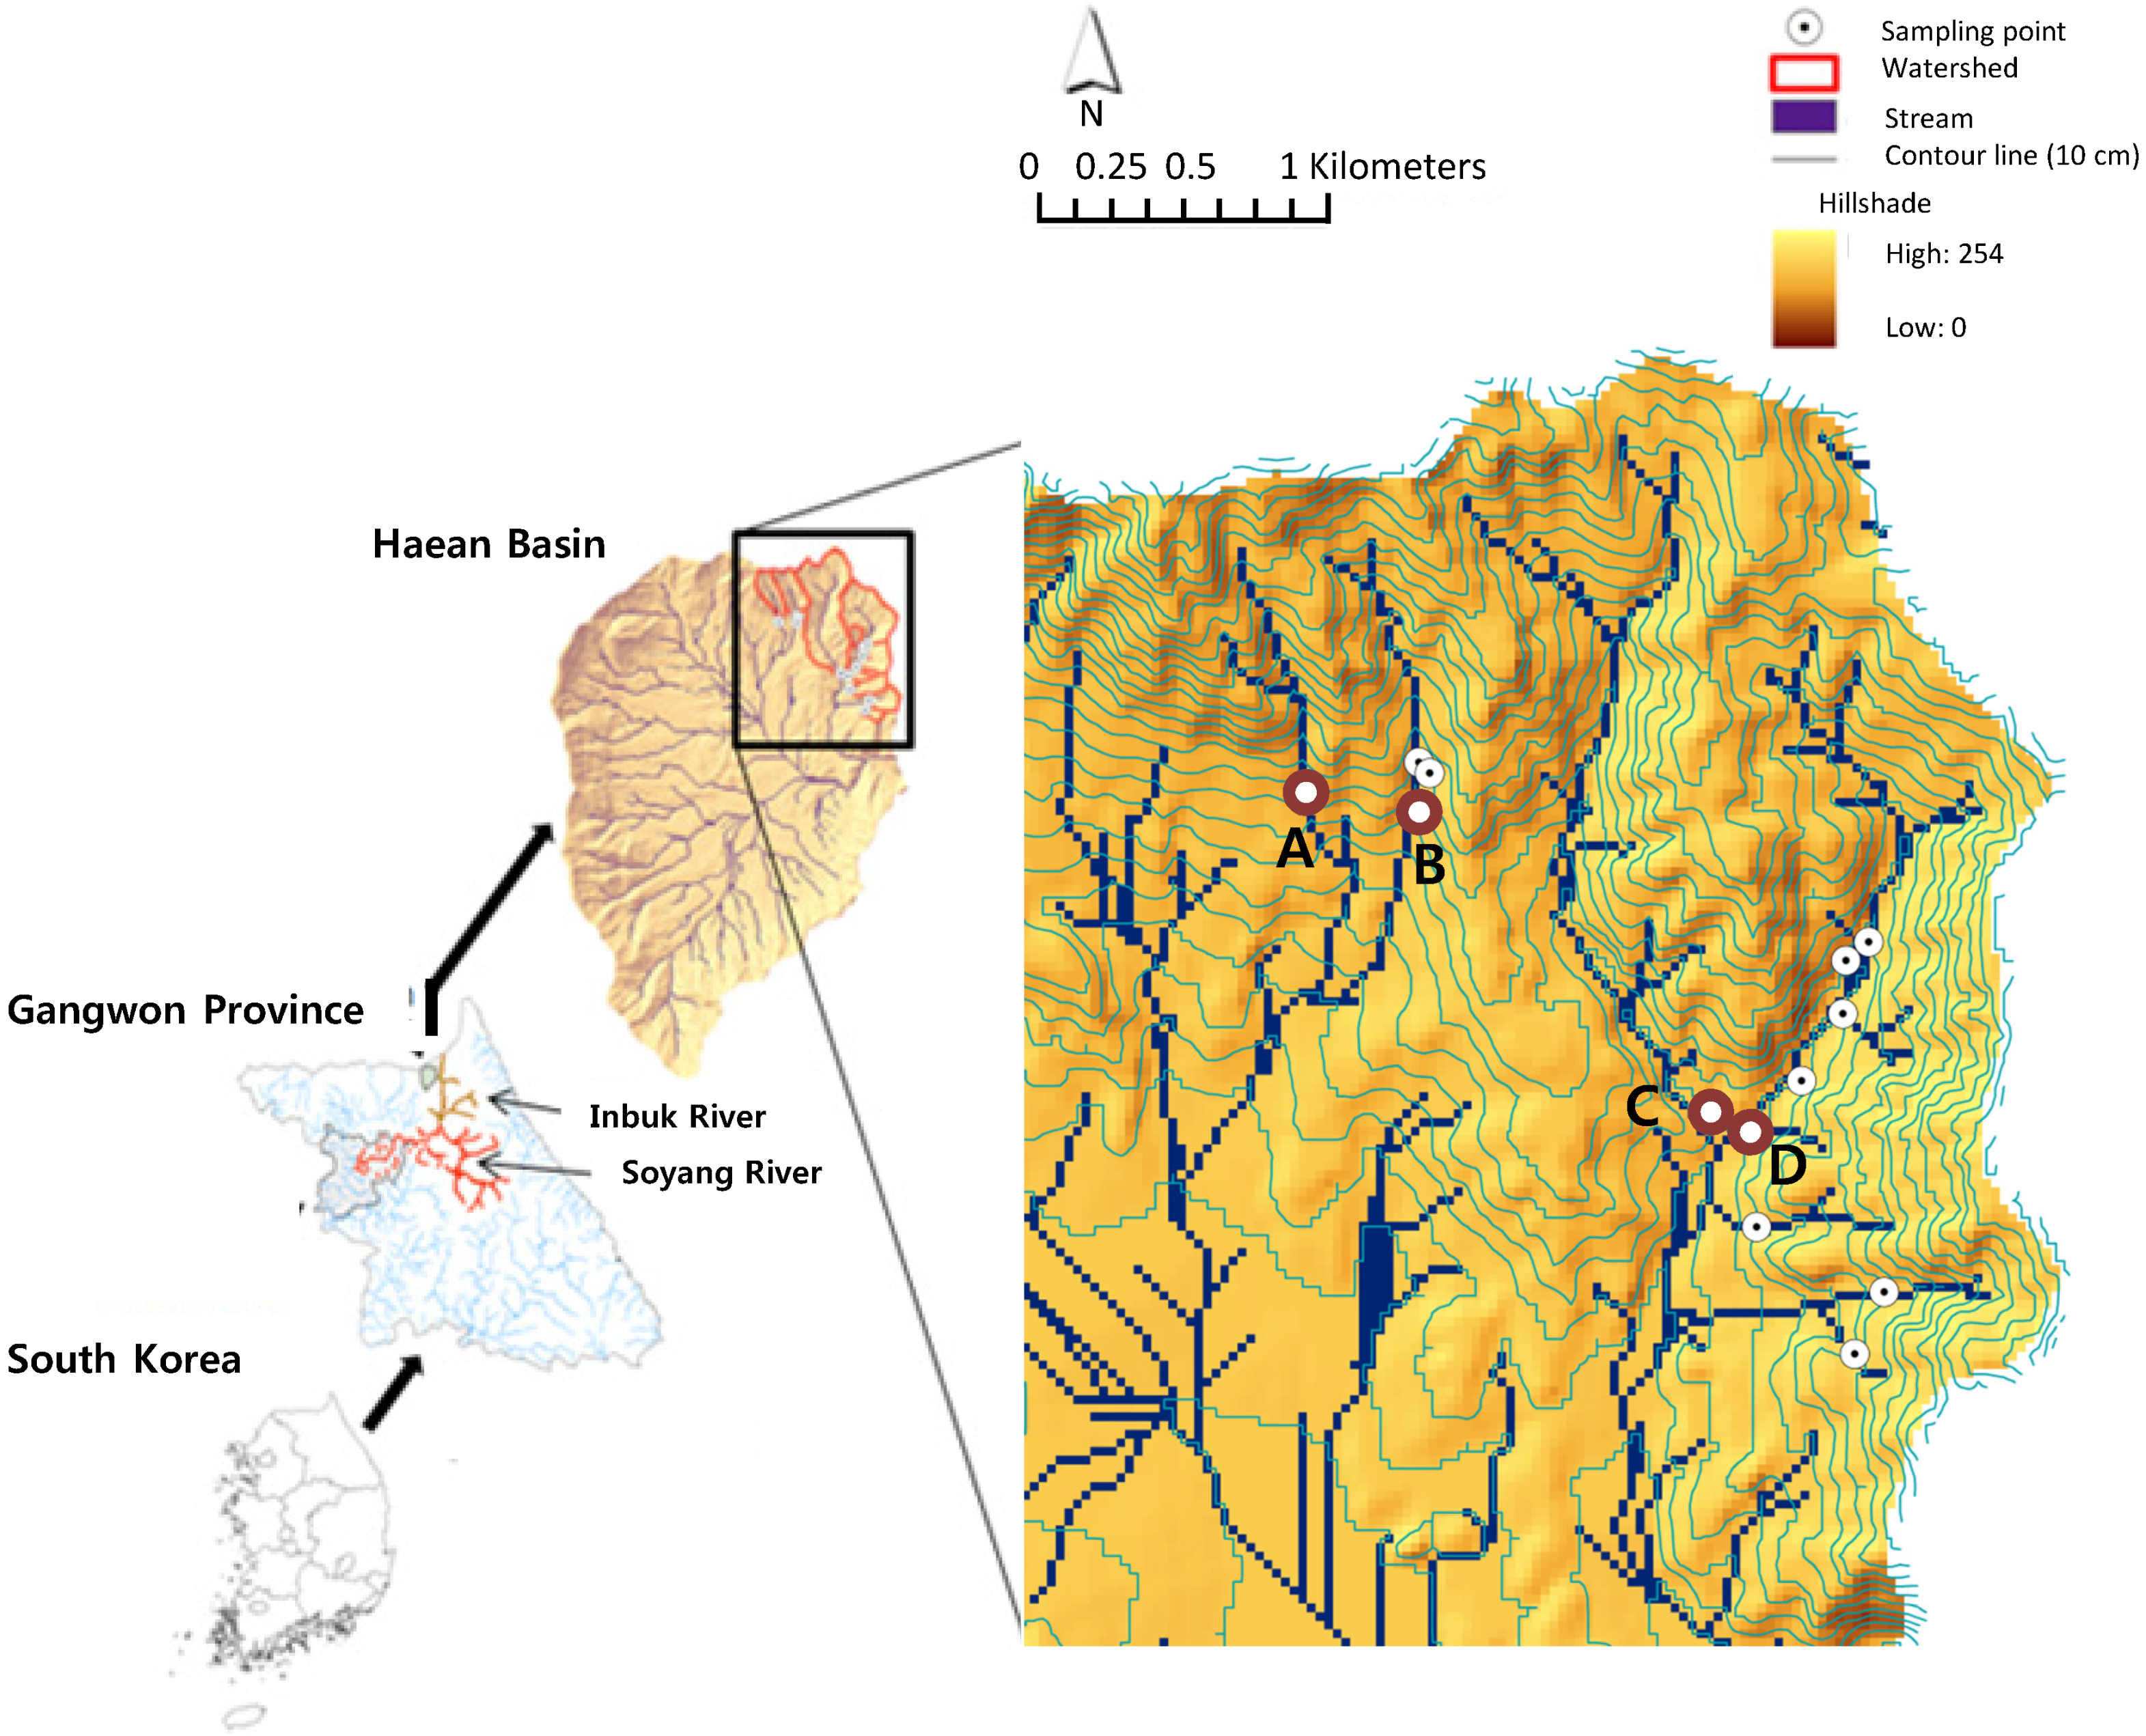
2.1. Study Site

The study was conducted at four small forested watersheds in the Haean Basin (38°15′–38°20′ N; 128°05′–128°10′ E; 400 m–1304 m asl), a bowl-shaped, mountainous basin 1–2 km south of the demilitarized zone (DMZ) between South and North Korea (Figure 1) [19,20]. The bedrock below the center of the basin consists of highly weathered biotite granite surrounded by metamorphic rocks along the mountain ridges. Mixed deciduous forests were re-established through natural processes on the mountain slopes in the study area since the late 1970s, after recurrent forest fires during the three decades following the Korean War in 1950–1953. Rapid conversion of low-elevation forests to agricultural fields has occurred in recent decades, and natural forests now remain only on steep slopes (>20°) and along the mountain ridges, comprising 58% of the entire 60 km2 area of the basin. The dominant tree species in the basin include Mongolian oak (Quercus mongolica), Daimyo oak (Quercus dentata), and Korean ash (Fraxinus rhynchophylla). Typical soils on the forested mountain slopes are dry to slightly moist, brown soils (acid Cambisols according to the FAO World Reference Base for Soil Resources), overlain by moder-like forest floors with a distinct Oi horizon and less distinct Oe/Oa horizons.
Figure 1. Stream water sampling locations for routine bi-weekly monitoring at the four streams (A–D). The location of the V-notch weir and the weather station within watershed A is indicated by the letter of X.
Water 07 06117 g001

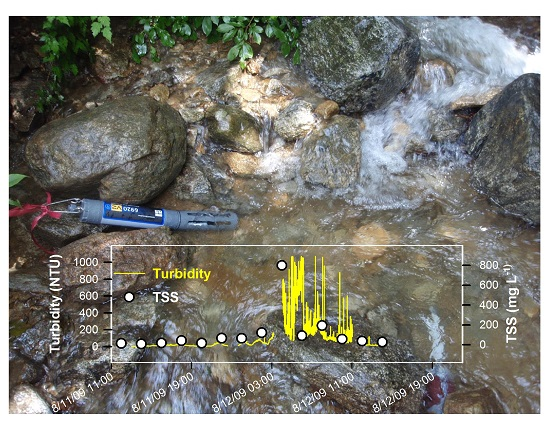
2.2. Sampling and In Situ Measurements

Routine bi-weekly water sampling was conducted at the four headwater streams from May 2008 to April 2010 (Figure 1). The four watersheds are all similar with regard to vegetation, soil, and topography, but their sizes vary (A: 38 ha; B: 56 ha; C: 190 ha; D: 171 ha). Grab water samples were collected at 10 cm below the stream surfaces near the centers of the streams using a 1 L Teflon bottle. The stream sampling procedure included measuring in situ water temperature, pH, EC, and dissolved oxygen (DO) using a portable pH meter (Orion 5 star, Thermo). In one forested watershed (A), throughfall (n = 4) and forest floor leachate (collected using custom-made zero-tension lysimeters; n = 4) were also sampled bi-weekly. Comparison of streamwater chemistry data with those for throughfall and forest floor leachate might provide some insights into the relative importance of atmospheric inputs and soil pools as potential sources of exported materials from the watershed.
Intensive storm event sampling at 2 h intervals was conducted eight times throughout two summer monsoon periods at the same stream location of watershed A previously described. During the eight rainfall events, stream samples were collected every 2 h using an autosampler (6712 Portable Sampler, ISCO Inc., Lincoln, NE, USA). In tandem with the automatic water sampling during rainfall events, in-stream, high-frequency measurements of pH, EC, and turbidity at 5 min intervals were conducted using a multi-parameter probe (6920 Water Quality Monitoring System, YSI, Inc., Yellow Springs, OH, USA). The water quality probe was routinely checked with standard solutions and calibrated when necessary.
Continuous micrometeorological measurements were conducted at watershed A using a data logger (CR10X, Campbell Scientific, Logan, UT, USA) that was connected to various sensors, including precipitation, air and soil temperature, and volumetric soil water content at 10 and 30 cm depths (Figure 1). Discharge measurements were initiated at watershed A in July 2009, with the construction of a V-notch weir (Figure 1). A vented pressure transducer (Druck PDCR 830, Druck Ltd., Leicester, UK) was installed in a fully screened polyvinyl chloride (PVC) tube in a shallow pool upstream of the V-notch weir. Water level measurements were collected every 5 min. Discharge from the forested watershed during the period prior to the weir construction was estimated using a hydrologic model (HBV-Lite) [40]. The model was calibrated for the period from 16 July through 20 September 2009 on the basis of the observed soil moisture and stream discharge data. We then validated the model with the same parameters for two additional periods (30 June–30 August 2010; 5 August–5 October 2010). The validation period R2 and efficiency values were 0.89 and 0.88 for the first period and 0.92 and 0.91 for the second period, respectively.

2.3. Chemical and Statistical Analyses

All water samples were transported in an ice box to the laboratory and then kept refrigerated at <4 °C. Within 24 h after sampling, a portion of the water sample (50–200 mL) was filtered through a pre-combusted glass fiber filter (GF/F, Whatman; nominal pore size of 0.7 μm, Whatman, Clifton, NJ, USA) after pre-filtering through a plastic sieve with 2 mm pores. The concentrations of total suspended solids (TSS) were measured gravimetrically as the difference in filter weight before and after filtering. Prior to filtering, the GF/F filters were combusted at 450 °C to remove any organic materials in the filters and then weighed. After filtering of the water samples, the filters were dried at 65 °C to a constant weight and re-weighed for the calculation of the TSS concentrations. For eight monsoon rainfall event samples, the dried filters were fumed with HCl in a sealed desiccator for 24 h to remove inorganic C prior to the analysis of POC. The concentrations of POC in the acidified filters were measured with an elemental analyzer (Vario MAX CN, Elementar, Germany).
Filtered water samples were analyzed for dissolved ions (Cl, SO42−, NO3, and NH4+) using an ion chromatograph (DX-320, Dionex, Sunnyvale, CA, USA). For the eight monsoon rainfall event samples, DOC in the filtered water samples was measured with a TOC analyzer using high-temperature combustion of organic matter followed by thermal detection of CO2 (TOC 5000a, Shimadzu, Japan). As part of the quality control, a laboratory blank (Mili-Q ultrapure water) and a standard solution of a concentration that was typical of the concentration range of samples were analyzed for every batch of ten samples. Relative standard deviations (standard deviations divided by mean in percentage) from the repeated measurements of check standards were generally within 5%. Replicate analysis was conducted for approximately 10% of the total number of samples. Contamination from sampling and filtering was checked with field blank samples (Mili-Q ultrapure water).
Pearson correlation coefficients were used to characterize the correlations between bi-weekly water quality data and hydroclimatic variables. To reflect large changes in solute concentrations in response to rapidly changing discharge during rainfall events, event mean solute concentrations were obtained by weighting discharge to each corresponding solute concentration. Linear regression analyses were conducted to establish the relationships between the discharge-weighted event mean solute concentration (TSS, POC, and DOC) and the total rainfall amount or the mean rainfall intensity of each rainfall event. Most of POC and DOC data presented in this study (all events except events 5 and 6) have previously been used in two publications on differential storm responses of DOC and POC [11,19]. We included the published data in this study to provide a more complete view of watershed biogeochemical responses to storm events, incorporating both the traditional water quality and novel carbon cycle perspectives.

3. Results

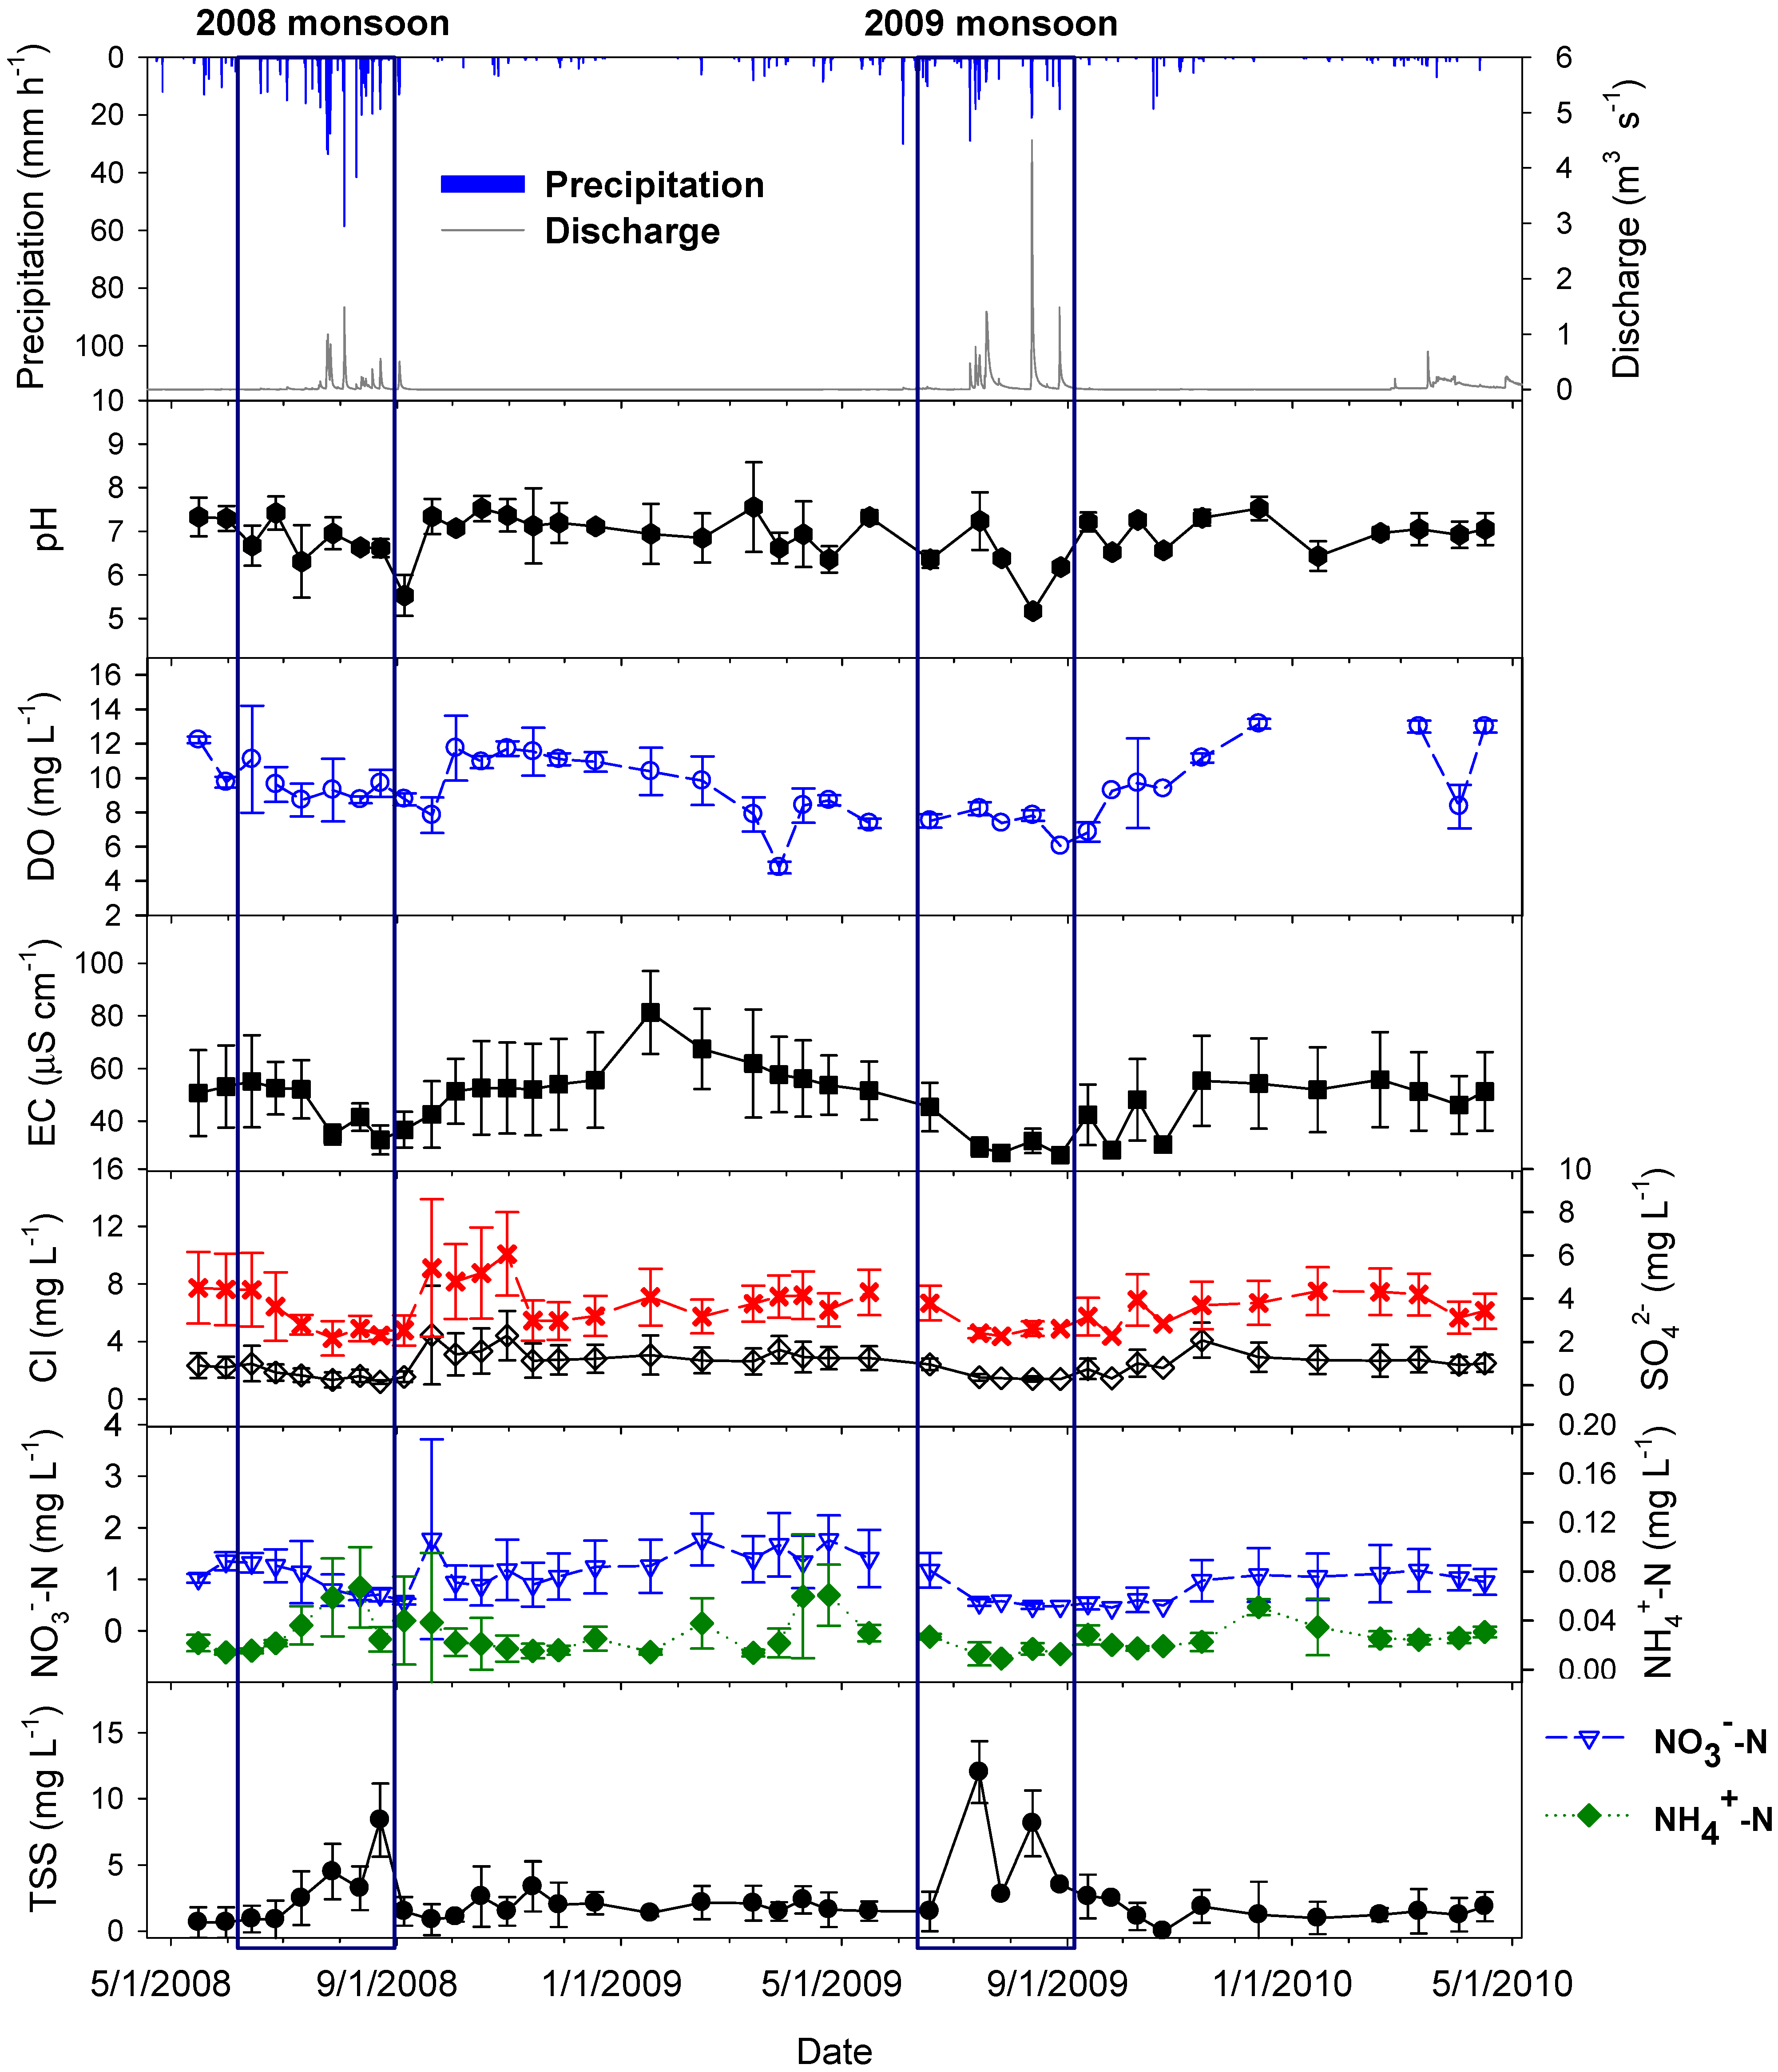
3.1. Routine Bi-Weekly Monitoring in Four Streams

Volume-weighted mean concentrations of measured water quality components in the four forest streams were generally different from those for throughfall and forest floor leachate (Table 1). The stream water pH was usually circumneutral with the two-year mean of 6.7, indicating high acid-neutralizing capacity of the soil given the much lower pH values found in throughfall (5.6) and forest floor leachate (5.8). While the mean concentrations of all the measured parameters fell within the usual range found in streams draining temperate forested watersheds [6,12,13,17,22,29], it is notable that the mean concentrations NO3–N in stream water were higher than those for throughfall, indicating leaching losses from the forest soils.
Table 1. Means and standard errors (n = 4) of volume-weighted mean pH and electrical conductivity (EC) and concentrations of Cl, SO42, NO3–N, NH4+–N, and total suspended solids (TSS) in throughfall (TF), forest floor leachates (FF), and stream water (SW) for the monitoring period from May 2008 to April 2010. Dissolved oxygen (DO). SE indicates standard error.
pHEC (μS·cm−1)DOClSO42−NO3-NNH4+-NTSS
(mg·L−1)
TFmean5.622.45.11.362.760.510.4414.0
(n = 4)SE0.11.90.30.140.130.040.032.5
FFmean5.889.75.43.995.173.230.867.2
(n = 4)SE0.17.30.20.370.480.460.170.2
SWmean6.735.28.71.63 2.650.700.027.3
(n = 4)SE0.12.60.20.130.190.050.000.6
Over the 2 year monitoring period, water quality components showed similar seasonal patterns at all four streams, including lower EC, DO, and dissolved anion concentrations and higher TSS concentrations during the summer monsoon period (Figure 2). The seasonal patterns observed for the measured anions were not clear for NH4+ concentrations. On some occasions during the monsoon period, pH was lower than the usual circumneutral level, but the decrease did not continue throughout the season. The discharge-weighted mean concentrations of TSS in stream water were relatively low (7.3 mg·L−1; Table 1), constrained largely by very low concentrations during dry periods (Figure 2).
At least one of the analyzed hydroclimatic variables, including antecedent precipitation, soil moisture, and discharge, had significant negative correlations with pH (at all the sites except B), EC (at all the sites except A), and the concentrations of dissolved anions, but positive correlations with the concentrations of NH4+ at site B and TSS at all the sites (Table 2). The DO levels showed significant negative correlations with temperature at all streams except stream A and with soil moisture (SWC) at sites C and D.
Figure 2. Temporal variations in hourly precipitation (mm), discharge (m3·s−1), pH, EC (μS·cm−1), and concentrations (mg·L−1) of DO, Cl, SO42−, NO3–N, NH4+–N, and TSS in four forest streams from May 2008 to April 2010. Error bars indicate standard deviations. Data collected during the monsoon period from June through August are indicated by the two rectangular boxes.
Water 07 06117 g002
Table 2. Correlations between bi-weekly water chemistry data (pH, DO, EC, and concentrations of Cl, SO42−, NO3–N, NH4+–N, and TSS) in four streams and climatic variables including air temperature (Temp), 3-day antecedent precipitation (3-day ppt), and 14-day antecedent precipitation (14-ppt), soil water content (SWC) at 30 cm, and discharge. Asterisks indicate statistical significance.
SiteClimaticCorrelation (r) with
VariablepHDOECClSO42−NO3-NNH4+-NTSS
ATemp−0.26 −0.14 −0.35*−0.31 −0.22 0.02 0.01 0.36*
3-day ppt−0.12 −0.23 −0.21 −0.43**−0.25 −0.20 0.10 0.75**
14-ppt−0.16 −0.14 −0.20 −0.38*−0.34*−0.01 0.21 0.71**
SWC−0.37*−0.24 −0.11 −0.36*−0.40*0.39*0.24 0.32*
Discharge−0.196 −0.23 −0.20 −0.42**−0.16 −0.27 −0.02 0.52**
BTemp−0.29 −0.51**−0.77**−0.71**−0.50**−0.61**0.23 0.29
3-day ppt−0.06 −0.24 −0.62**−0.60**−0.58**−0.49**0.08 0.78**
14-ppt−0.25 −0.27 −0.67**−0.64**−0.62**−0.46**0.36*0.57**
SWC−0.31 −0.34 −0.30 −0.36*−0.54**−0.07 0.59**0.20
Discharge−0.15 −0.18 −0.53**−0.50**−0.45**−0.46**−0.05 0.64**
CTemp−0.13 −0.35*−0.69**−0.48**−0.25 −0.50**0.28 0.47**
3-day ppt−0.24 −0.23 −0.75**−0.59**−0.58**−0.57**0.04 0.79**
14-ppt−0.07 −0.22 −0.79**−0.64**−0.58**−0.56**0.18 0.64**
SWC−0.28 −0.40*−0.66**−0.75**−0.67**−0.50**0.13 0.46**
Discharge−0.50**−0.24 −0.61**−0.48**−0.45**−0.54**−0.01 0.67**
DTemp−0.13 −0.37*−0.47**−0.12 −0.18 0.02 −0.05 0.37*
3-day ppt−0.35*−0.25 −0.64**−0.30 −0.49**−0.23 −0.18 0.88**
14-ppt−0.20 −0.24 −0.62**−0.36*−0.56**−0.24 −0.15 0.69**
SWC−0.27 −0.35*−0.33 −0.28 −0.41*0.01 0.15 0.46**
Discharge−0.54**−0.23 −0.57**−0.23 −0.33 −0.20 −0.10 0.75**
Notes: *: p < 0.05; **: p < 0.01; ***: p < 0.001.

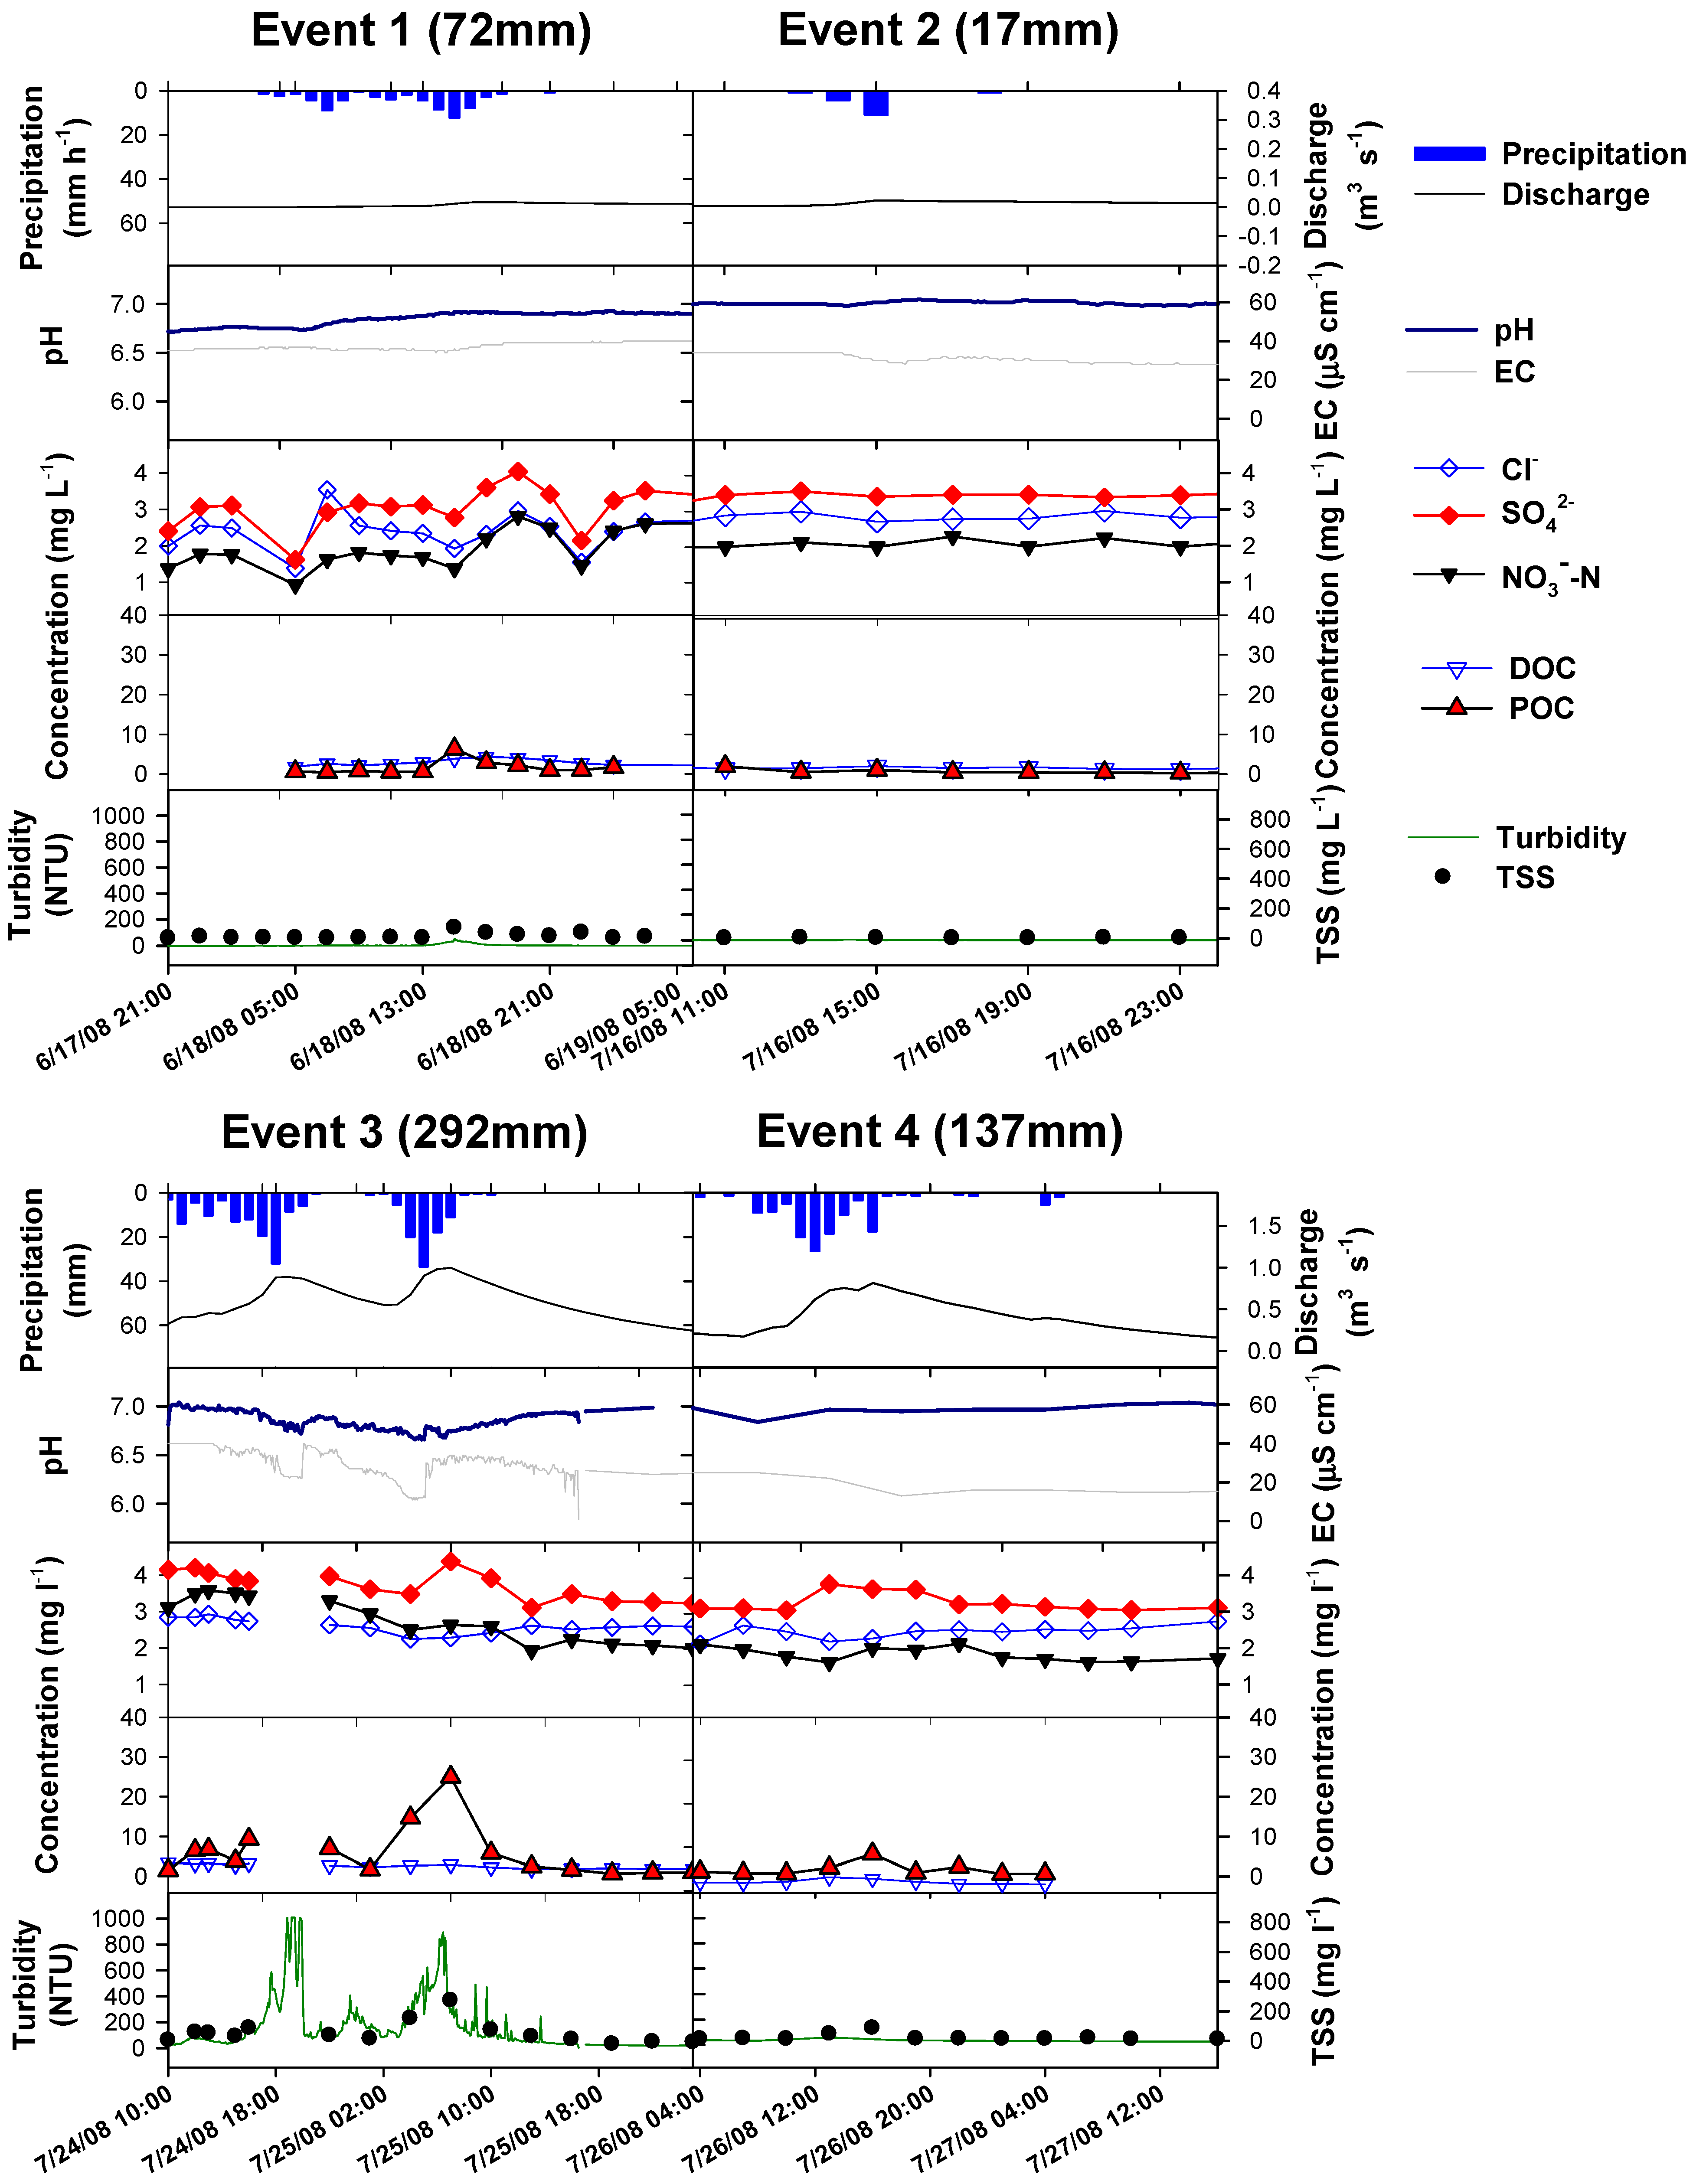
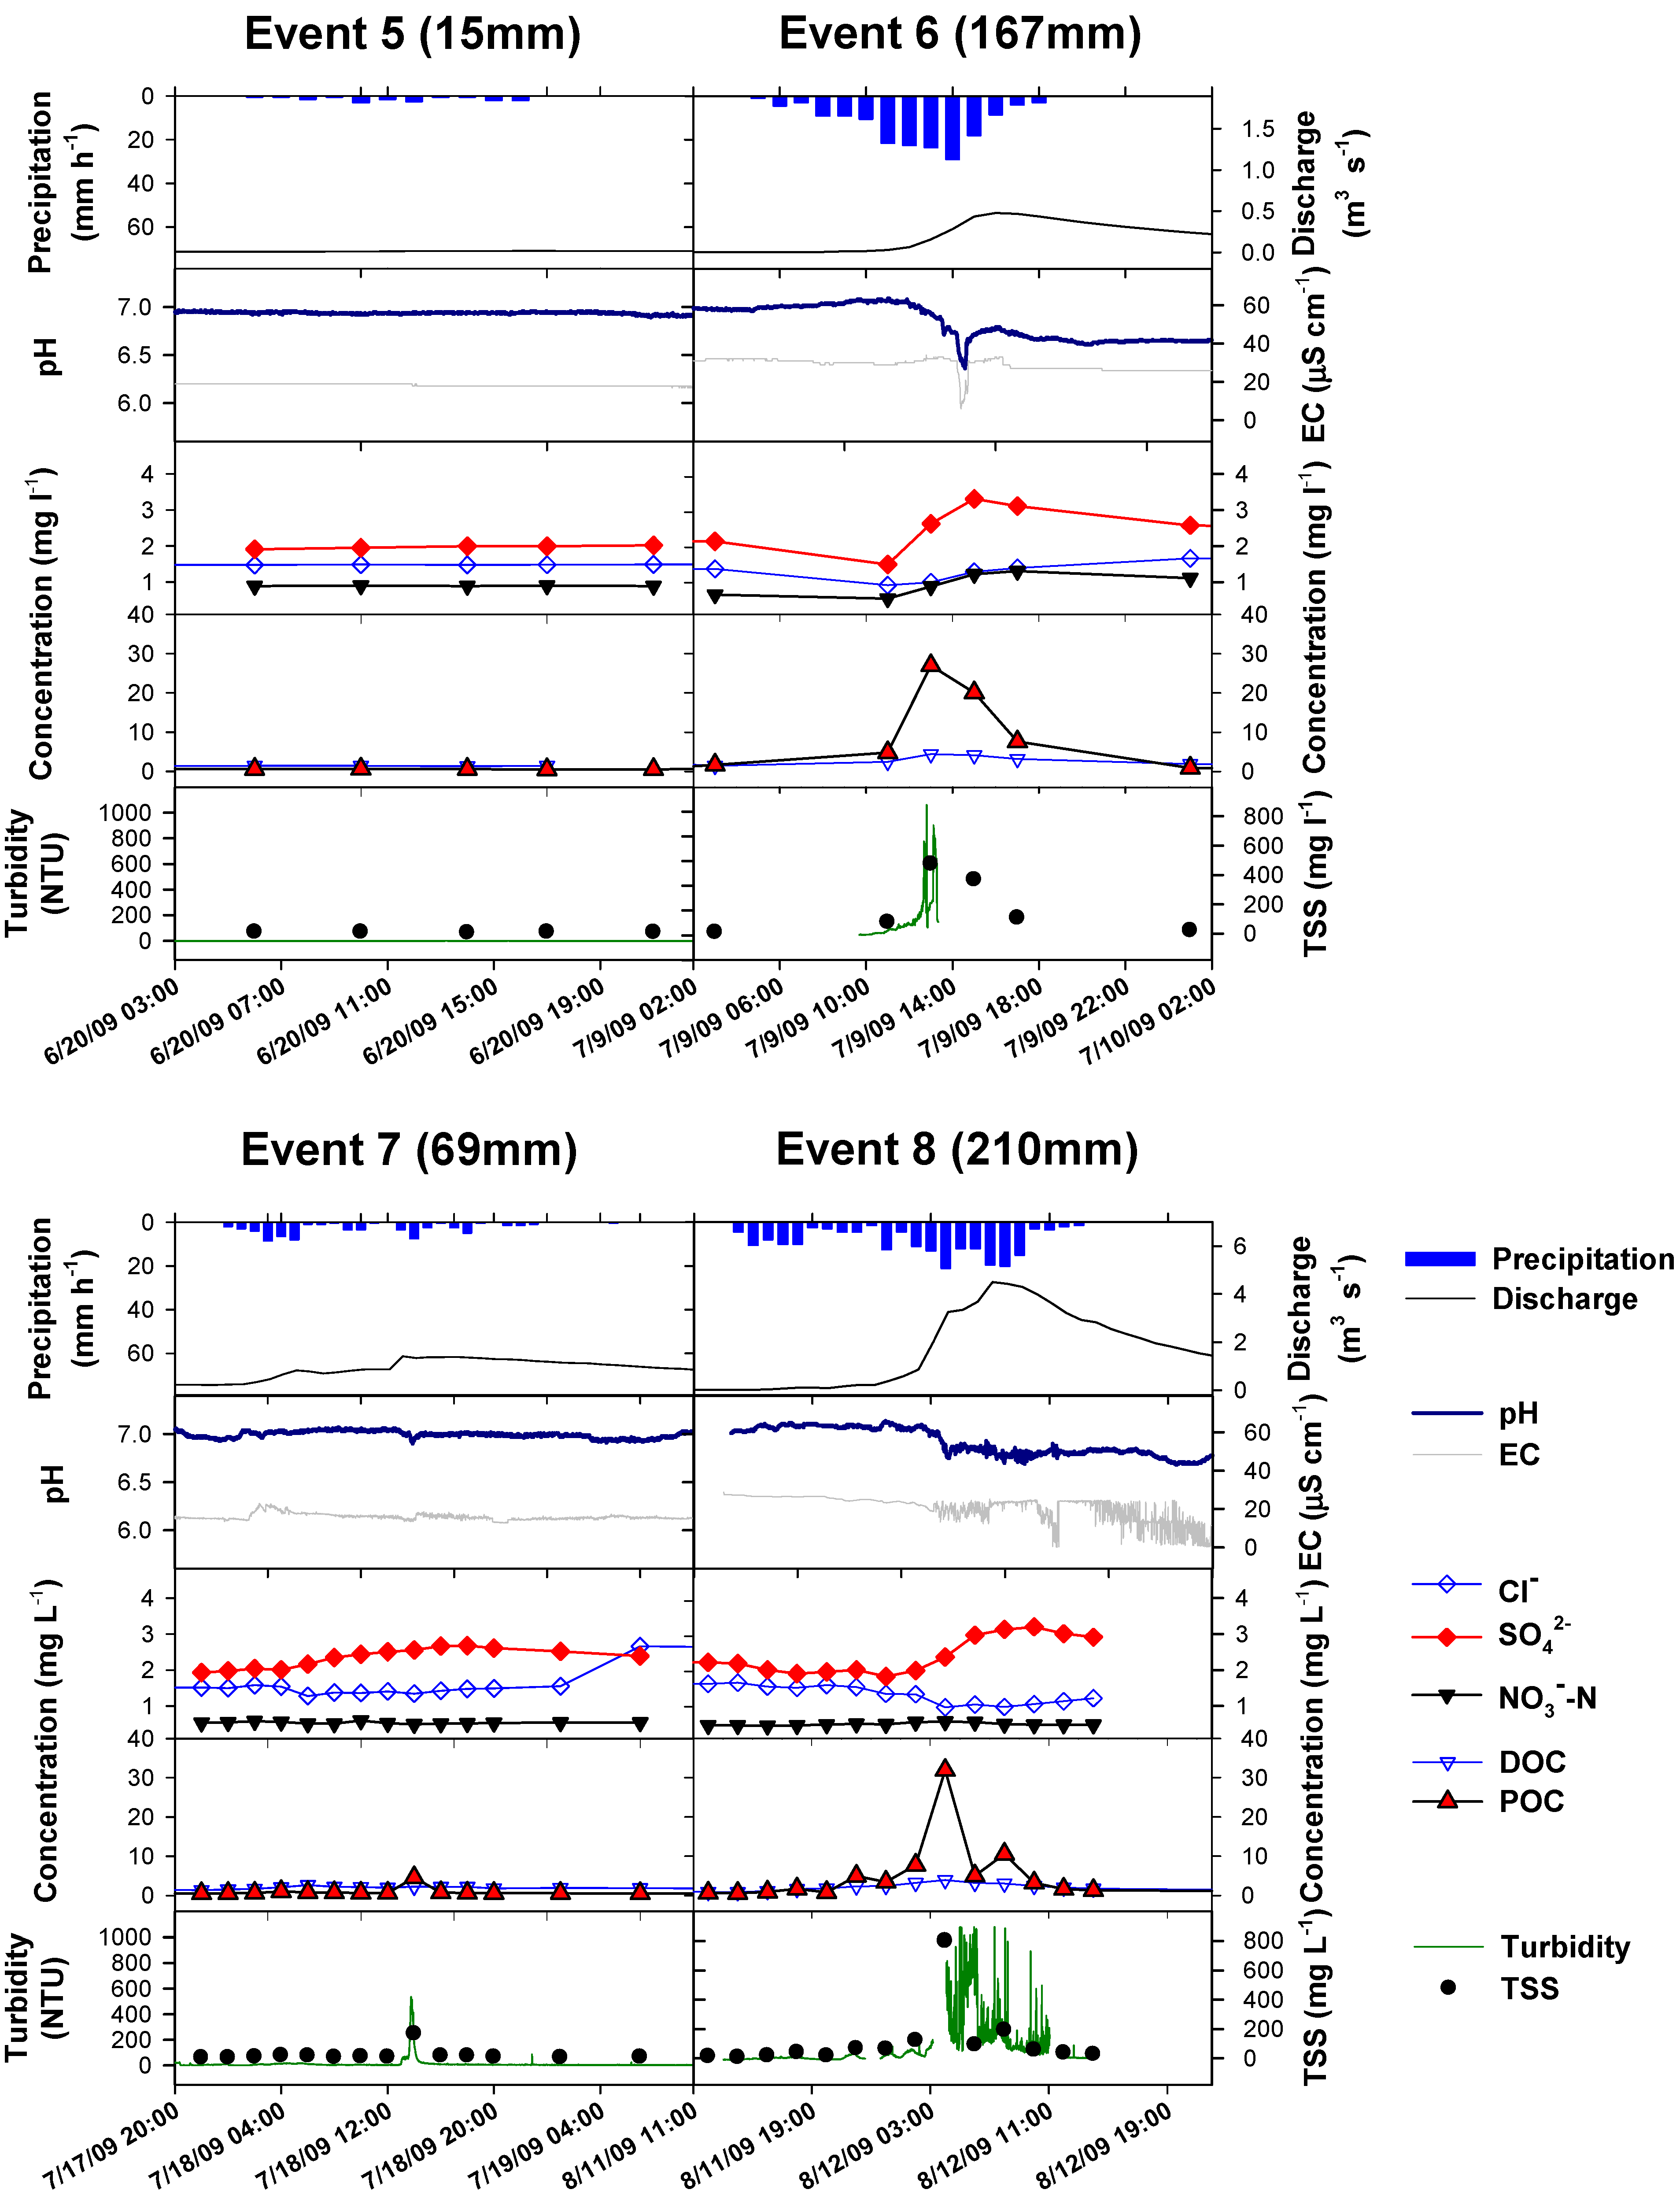
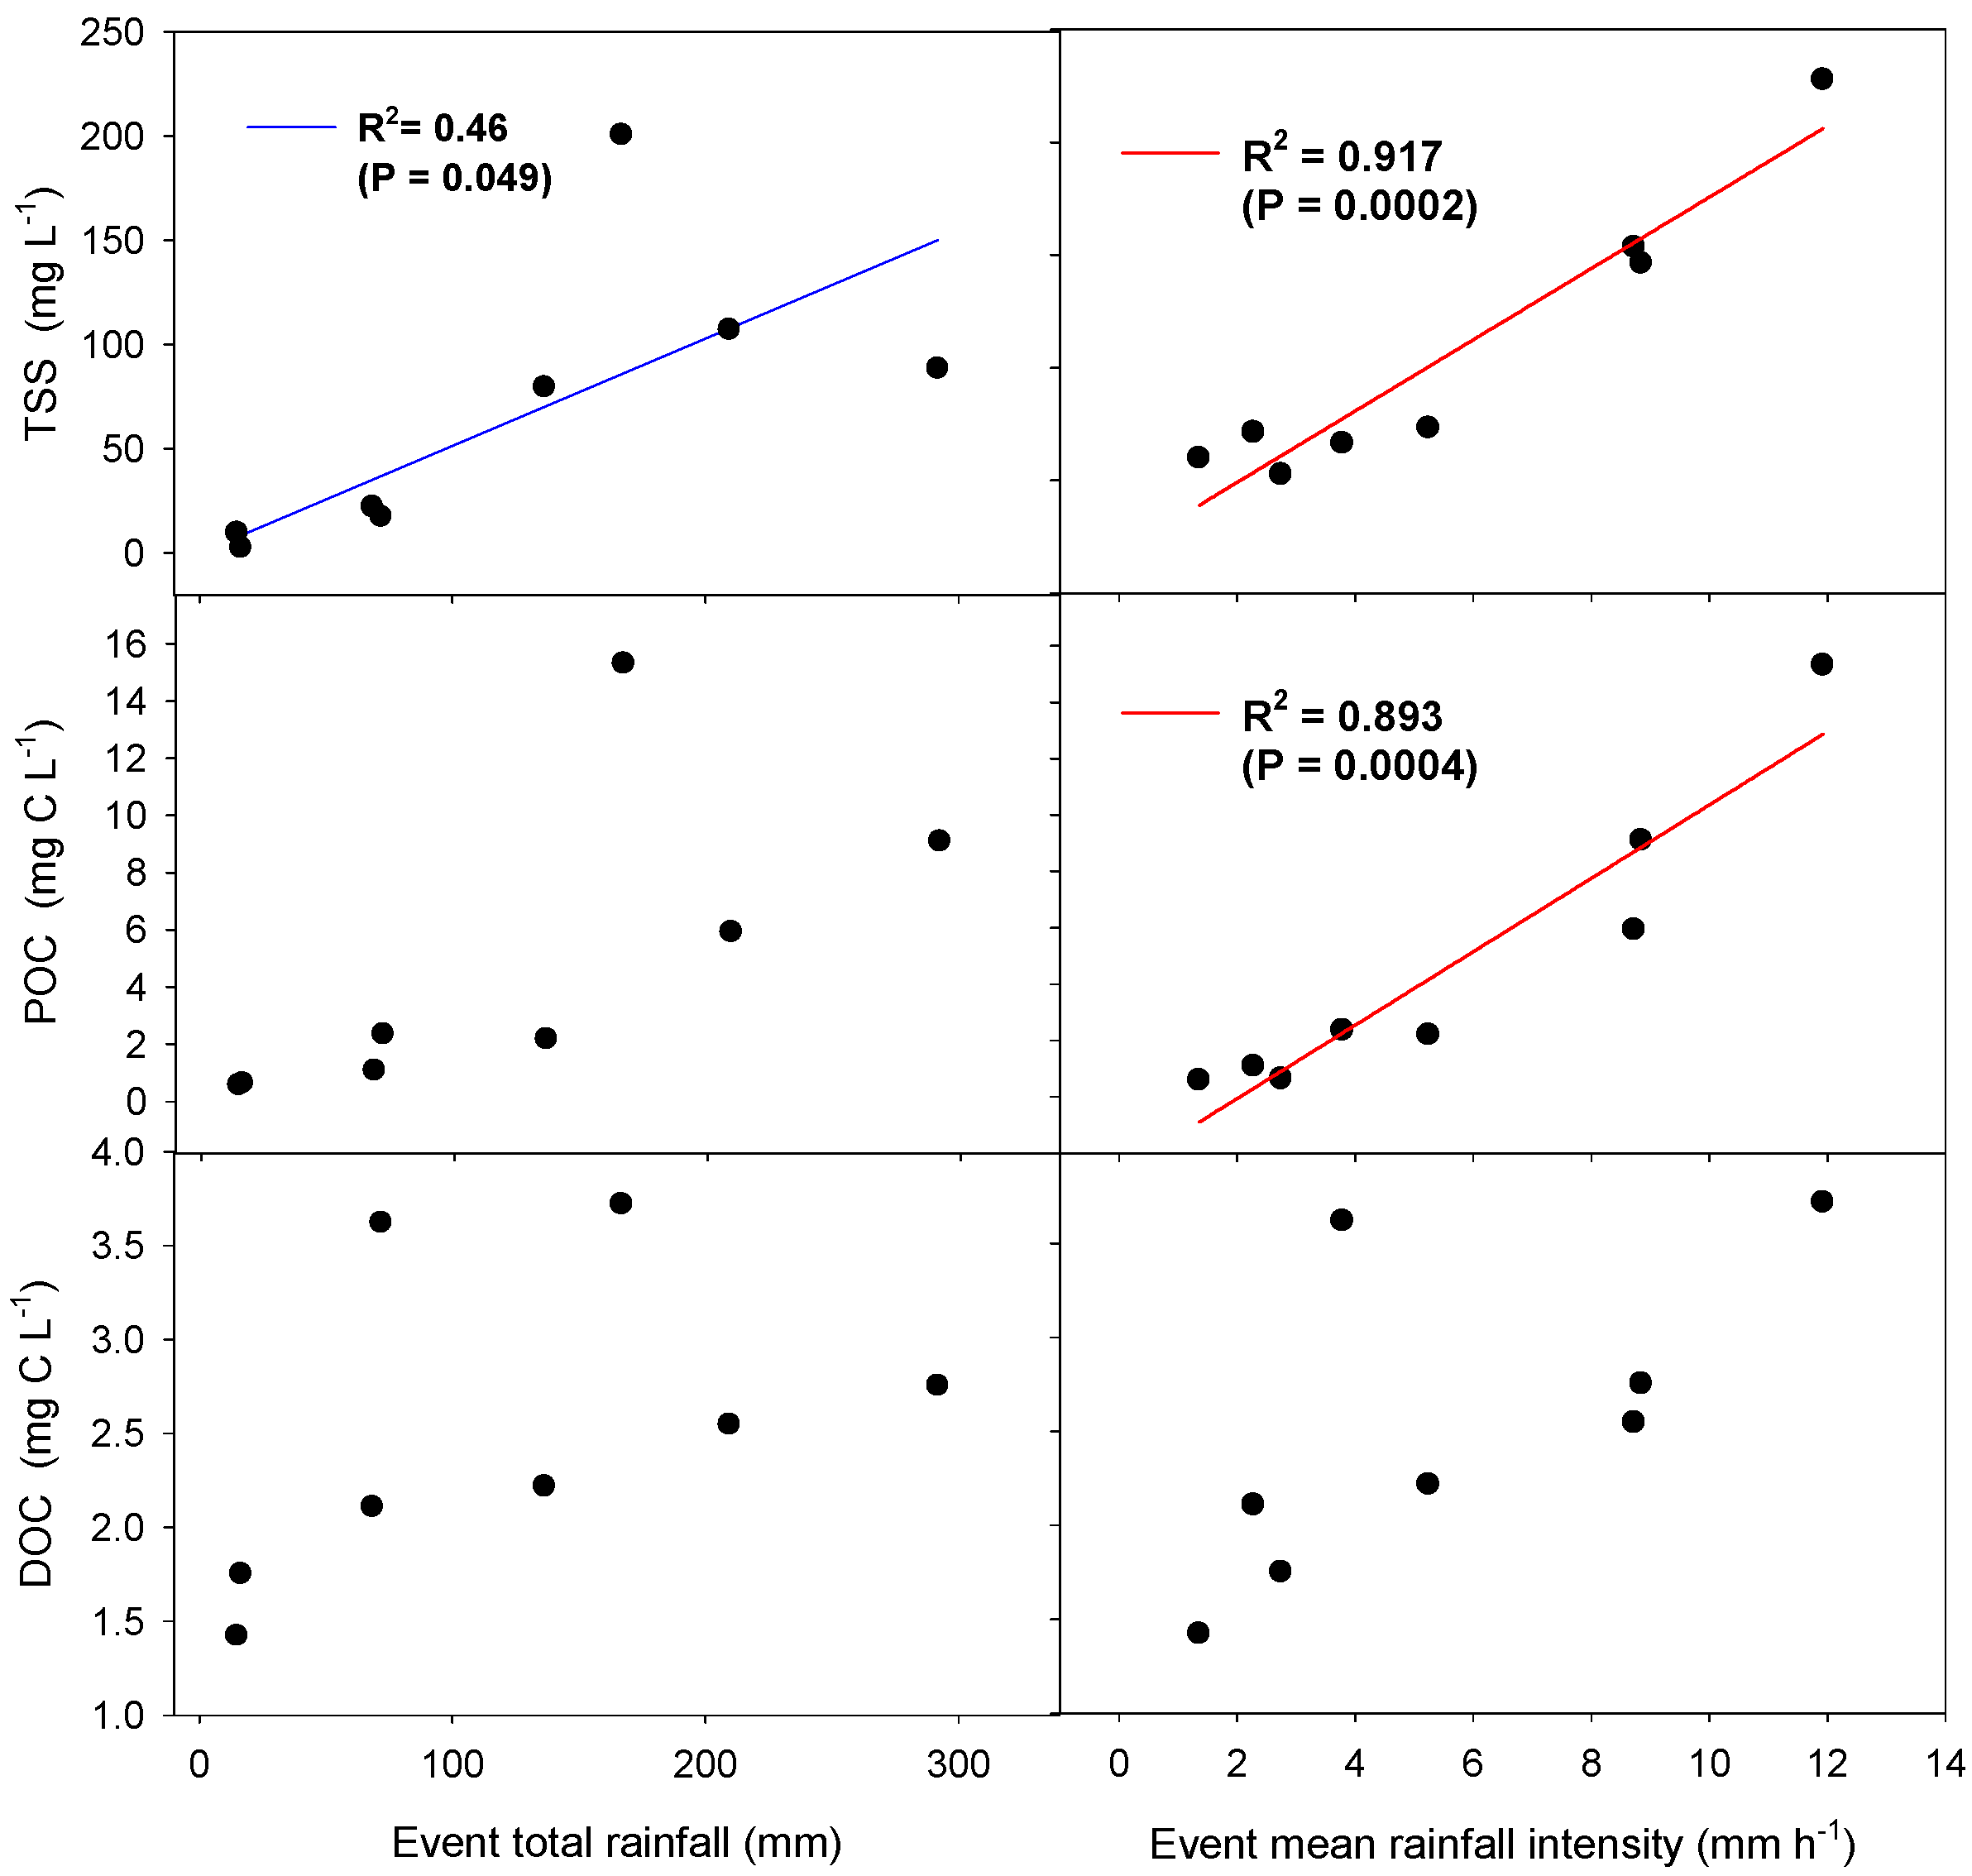
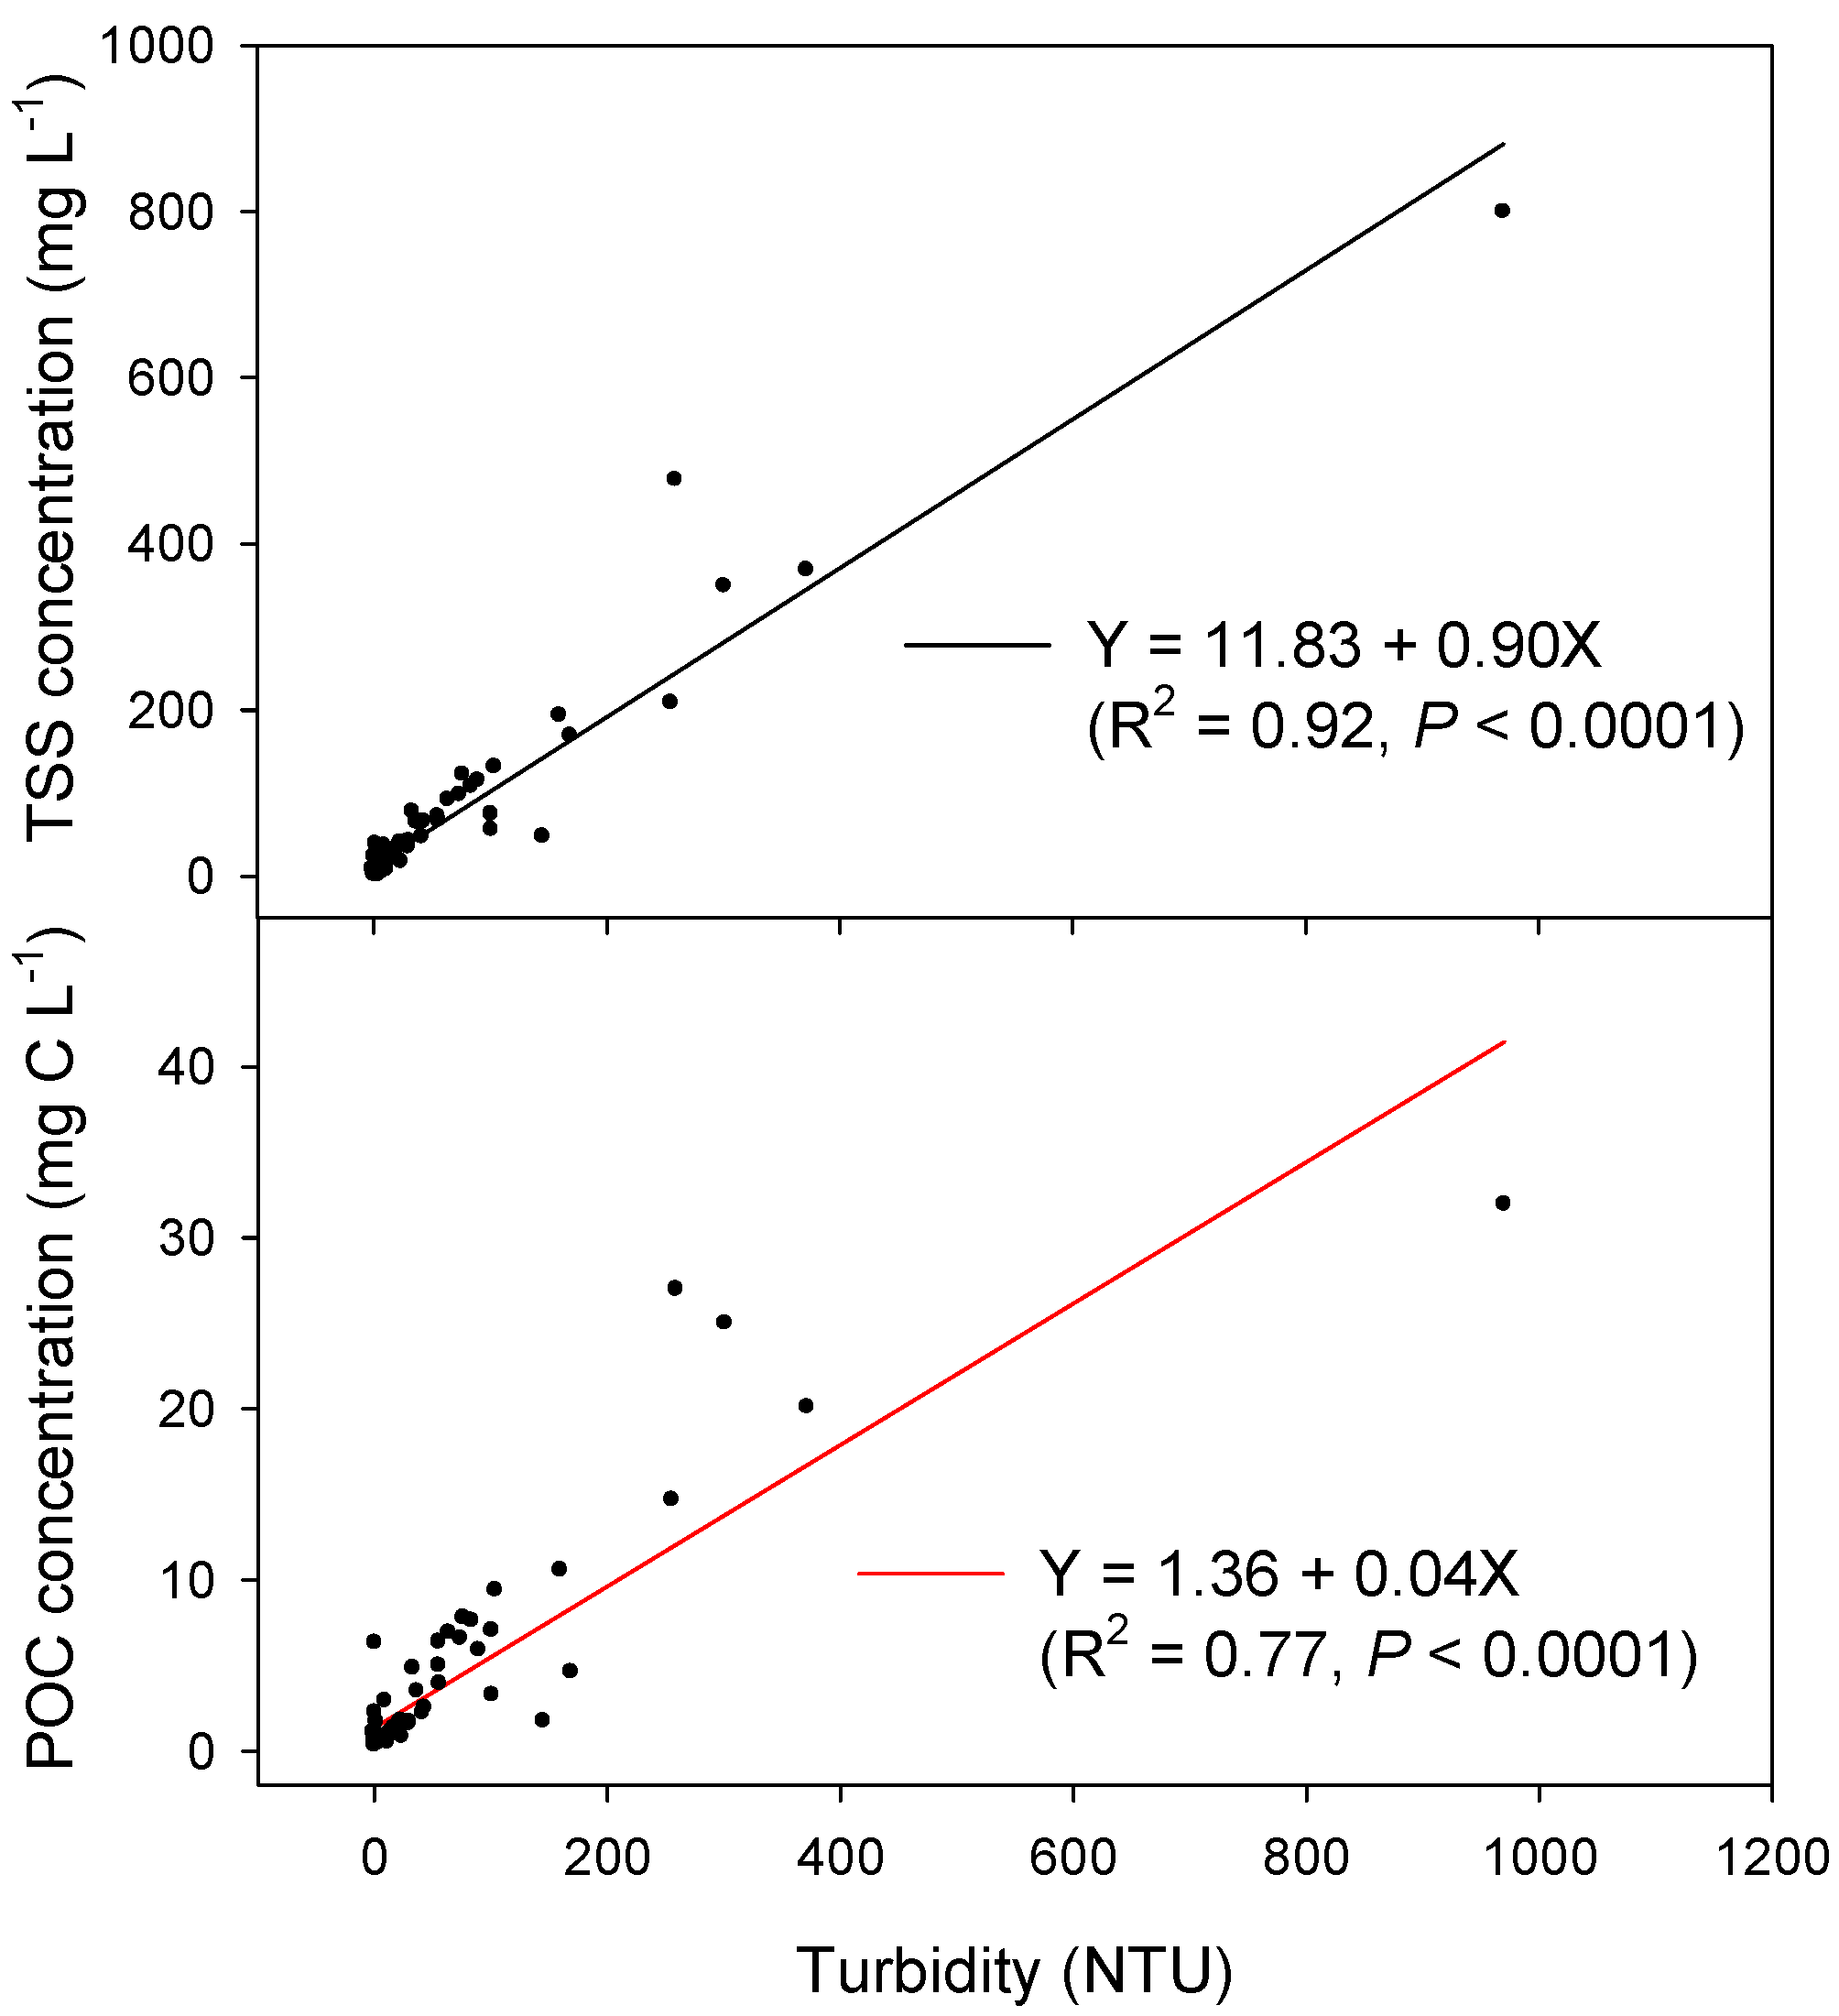
3.2. Intensive Storm Event Sampling and Continuous Instrumental Measurements

Intensive storm event sampling was carried out at 2 h intervals during eight rainfall events of various duration and intensity (Table 3). The bi-hourly measurements of anion and TSS concentrations showed large changes only during the intense events exceeding a threshold precipitation (total rainfall >100 mm and mean hourly rainfall >5 mm·h−1 during Events 3, 4, 6, and 8; Figure 3 and Figure 4). Dissolved anion concentrations tended to decrease upon initiation of the rainfall event during some rainfall events and often exhibited inconsistent patterns depending on ion species. By comparison, TSS concentrations always increased rapidly in response to rising discharge during the peak flow periods of intense rainfall events. POC concentrations were lower than DOC concentrations during baseflow and low-intensity rainfall events, but rapidly increased and exceeded DOC concentrations during the short peak periods of intense rainfall (Event 3, 4 in Figure 3; Event 6, 8 in Figure 4).
Table 3. Summary of hydroclimatic conditions that characterize the eight described rainfall events. Ppt indicates precipitation.
EventStart TimeDuration (h)Total ppt (mm)Maximum Hourly ppt (mm)Mean Rainfall Intensity (mm·h−1)Antecedent ppt (mm)
3-Day5-Day7-Day14-Day
103:00 18 June 2008197212.53.800030
213:00 16 July 200861711.02.804040106
302:00 24 July 20083329233.58.937686143
404:00 26 July 20082613726.55.3292294378435
506:00 20 June 200911152.51.432955105
605:00 09 July 20091416723.511.9181415
700:00 18 July 200930697.52.361178285459
814:00 11 August 20092421019.58.70667
Discharge-weighted event mean concentrations of TSS had a strong positive relationship with the mean rainfall intensity levels (R2 = 0.92, p = 0.0002), but only a weak positive relationship with the total rainfall amounts (R2 = 0.46, p = 0.049; Figure 5). While the discharge-weighted event mean concentrations of DOC did not have any significant relationship with both rainfall indices, POC concentrations exhibited a strong positive relationship with the mean rainfall intensity (R2 = 0.89, p = 0.0004).
Continuous in situ measurements of pH, EC, and turbidity at 5 min intervals exhibited very rapid changes in stream water quality during intense rainfall events (Figure 3 and Figure 4). EC and pH changed little during small rainfall events when the total precipitation was less than 100 mm, but showed large decreases during the peak flow periods of larger rainfall events. In contrast, turbidity rapidly increased in response to increasing rainfall intensity (Figure 3 and Figure 4). During three intensive rainfall events (Events 3, 6, and 8), turbidity levels showed much larger fluctuations than those for TSS measurements and exceeded the upper detection limit (1000 NTU) during several short peak flow periods. When all data collected during the eight rainfall events were combined, turbidity measurements exhibited significant positive relationships with the concentrations of TSS (R2 = 0.92, p < 0.0001) and POC (R2 = 0.77, p < 0.0001) (Figure 6).
Figure 3. Temporal variations in hourly precipitation (mm), discharge (m3·s−1), pH, EC (μS·cm−1), concentrations (mg·L−1) of dissolved ions, DOC, and POC, turbidity (NTU), and TSS concentration (mg·L−1) during four rainfall events in 2008. DOC and POC data of the four storm events have been published in a previous report [19].
Water 07 06117 g003
Figure 4. Temporal variations in hourly precipitation (mm), discharge (m3·s−1), pH, EC (μS·cm−1), concentrations (mg·L−1) of dissolved ions, DOC, and POC, turbidity (NTU) and TSS concentration (mg·L−1) during four rainfall events in 2009. DOC and POC data of Event 8 have been published in a previous report [11].
Water 07 06117 g004
Figure 5. Relationships between event total precipitation (mm) or mean rainfall intensity (mm·h−1) and event discharge-weighted mean concentration (mg·L−1) of TSS, POC, and DOC. Significant relationships at p < 0.05 were indicated by drawing a regression line through the plot.
Water 07 06117 g005
Figure 6. Relationships between turbidity (NTU) and the concentrations (mg·L−1) of TSS (n = 75) or POC (n = 74) measured during eight rainfall events.
Water 07 06117 g006

4. Discussion

The comparisons of stream water chemistry data collected on different timescales suggest that conventional routine monitoring at weekly to monthly intervals can adequately describe seasonality and long-lasting or slowly changing patterns of the stream water chemistry, but its low-resolution data are limited in providing accurate estimates of chemical fluxes pulsing during storm events. While bi-weekly monitoring data showed only marginal temporal variations for many parameters, intensive storm event sampling at 2 h intervals and continuous in situ measurements at 5 min intervals allowed us to capture rapid storm-induced changes in stream water chemistry at finer temporal resolutions. High-frequency monitoring data are essential in understanding short-term dynamics in both the hydroclimatic conditions and the watershed hydro-biogeochemical responses to rainfall events [10,22,41]. For example, Nagorski et al. [41] detected short-duration metal toxicity increases in mining-impacted streams in western Montana during high-flow periods of the spring runoff events by increasing the sampling frequency.
The results from both the routine (Figure 2) and storm event samplings (Figure 3 and Figure 4) indicated potential water quality deterioration during extreme climatic events including intense monsoon rainfalls and extended droughts from the winter to spring. While DO was generally low during the summer, owing to decreased oxygen solubility with increasing temperature as indicated by the significantly negative correlations between temperature and DO (Table 2), an unusually low level of DO (4.6 mg·L−1 on 28 March 2009) occurred during the extended spring drought in 2009 (Figure 2), degrading the stream water quality to a highly contaminated level (“Grade 4”) according to Korean river water quality standards [42]. This very low level of DO could not be explained solely by the temperature-DO relationship, because the observed DO level on the sampling day with a relatively low water temperature (4.6 °C) accounted for 39.7% of the saturation level determined by the temperature. EC and dissolved ion concentrations tended to be higher during droughts than during wetter periods, but usually within the range of uncontaminated streams (Figure 2). However, eutrophication could significantly degrade drinking water quality in downstream rivers and reservoirs, if increased concentrations of dissolved nutrients should persist over a prolonged period coupled with unusually high temperatures. This condition occurred in December 2011 in Lake Paldang, which receives water from both the North and South Han Rivers and provides drinking water resources to the metropolitan population of Seoul.
Compared to large storm-induced changes in TSS and POC concentrations, the concentrations of dissolved ions showed relatively small changes during rainfall events, often exhibiting ion-specific fluctuations with changing rainfall intensity and discharge (Figure 3 and Figure 4). As with the lowered EC and dissolved ion concentrations during the summer monsoon period (Figure 2), rainfall-induced initial decreases in EC and dissolved ion concentrations can be explained by rainfall-induced dilution [43]. This rainfall-induced dilution might also explain the significantly negative correlations between hydroclimatic variables and dissolved anion concentrations measured biweekly at the four streams (Table 2). Although correlations should not be equated to any causal relationship, the consistent patterns of lower EC and anion concentrations under wetter conditions point to storm-induced dilution overriding flushing of major anions from soil pools of limited size. Compared to consistent decreases in EC with increasing hourly rainfalls, concentrations of different dissolved ion species exhibited different response timing and durations during intense rainfall events (Figure 3 and Figure 4). As previous studies have suggested, rainfall-induced dilution of dissolved ions can be complicated by the flushing of soil-derived chemicals [43] and temporal variations in biogeochemical exports from different sources depending on the rising or falling limbs of the hydrograph [44,45].
Drastic increases in both the TSS concentration and turbidity during monsoon rainfall events (Figure 3 and Figure 4) represent the most outstanding, climate-related water quality issue among all of the monitored water chemistry components. Considering that high levels of suspended sediment cause a suite of water quality deterioration effects, including siltation and sorption of hazardous materials [16], transient but recurrent surges of suspended sediment export during intense rainfall events should be taken into account in preparing climate change adaptation strategies for drinking water facilities that use stream water from mountainous watersheds. In another study conducted at the same watershed, Jo and Park [20] found that during extreme rainfall events, suspended sediment in the forest stream (site A) contained substantial amounts of lead (Pb) that otherwise would have been retained in the forest soil for a long period. At an outlet of a highly turbid agricultural stream downstream of the forest stream, the peak concentrations of both suspended sediment and Pb during storm events exceeded those observed for the forest stream by an order of magnitude [20]. This agricultural stream loaded with suspended sediments contributed to several occasions of serious downstream siltation in a local river during a series of exceptionally intense storm events in 2006, resulting in the construction of a new drinking water facility taking source water from an upstream reach rather than more vulnerable downstream reach.
Although bi-weekly monitoring at the four streams showed slightly higher TSS concentrations during the summer monsoon period than during the other period, as shown by the positive relationships between hydroclimatic variables and TSS (Table 2), only intensive stream sampling and high-frequency turbidity measurements could capture the extraordinary increases in suspended sediment during the intense rainfall events (Events 3, 6, and 8; Figure 3 and Figure 4). Some mismatches between storm magnitude and peak concentrations of TSS and turbidity (e.g., Event 3 in 2008 vs. Event 8 in 2009) might reflect differences in the response of discharge and solute export to the varying intensity of the monitored rainfall event and the amount of antecedent rainfalls. For example, more intense rainfall occurring during a very short period following a relatively dry condition might have resulted in more intense responses of both discharge and sediment export during Event 8 compared to Event 3. The positive relationships between the event mean rainfall intensity and discharge-weighted mean concentrations of TSS and POC (Figure 5) suggest that suspended sediments from various soil sources within the watershed can be exported rapidly when a threshold level of rainfall intensity is passed. In addition, these sediments transport large amounts of soil organic carbon to the streams. Large differences in the POC concentrations between low- and high-flow conditions relative to the small range of DOC concentrations correlated with discharge (Figure 3 and Figure 4) were also observed in another study that employed high-frequency, in-stream DOC and POC measurements [11]. Steeper increases in POC export compared to the gradual increase in DOC leaching were attributed to the relatively high threshold energy required to initiate erosion of soil and organic matter particles from potential sediment sources [11]. Storm pulses of POC can represent a transient but dominant pathway of hydrologic export of soil organic carbon, which can increase disproportionately during short peak flow periods in response to more frequent occurrences of extreme rainfall events [19].
During the intense rainfall events when rainfall intensity exceeded a threshold level, the event mean concentrations of TSS exceeded 100 mg·L−1, a high contamination level according to the local water quality standard [42]. In accordance with the increasing occurrence of extreme rainfall events observed over a large part of the Northern Hemisphere as a consequence of global climate change [8,34], the occurrence of extreme rainfall events has increased, along with summer precipitation, across South Korea [35]. Using daily precipitation data averaged across 61 weather stations, Choi et al. [35] showed that the cumulative amount of precipitation on extremely wet days (those above the 99th percentile) had increased 36.1 mm per decade over the period from 1973 to 2007, with many of the significant very-wet-day precipitation events observed around the mountain regions. If monsoon rainfalls in East Asia continue to intensify in the coming decades, as predicted for tropical precipitation regimes by model simulations combined with satellite observations [34], we can expect more frequent occurrences of intense rainfall events. Intense rainfalls which exceed the threshold rainfall intensity level for initiating the export of erodible soils and associated organic carbon can result in siltation and large organic carbon inputs in receiving waters, until repeated storm-induced flushing processes reduce or deplete soil pools exceeding the capacity of soils to replenish organic matter [11,32].
In a review on forested watersheds in North America, Binkley and Brown [6] found that most forest streams have relatively low annual mean concentrations of suspended sediment (<5 mg·L−1, with stormflow peaks reaching up to 100 mg·L−1), although there were some rare studies reporting unusually high outliers exceeding 1000 mg·L−1 even in undisturbed forests. Much wider variations of suspended sediment concentrations ranging from less than 1 mg·L−1 to 5000 mg·L−1 have been observed in large river systems globally [46]. Large increases in suspended sediment concentrations have also been observed following disturbances caused by forest management activities such as harvesting and road construction [6,47]. The exceptionally high TSS concentrations observed during the peak flow periods of some of the intensive rainfall events we monitored suggest that soil erosion in steep mountainous watersheds can be vulnerable to extreme rainfall events, even without any disturbances over recent years. Similar high rates of sediment export during intense storm events have been observed in steep mountainous watersheds in Japan [12,48,49]. In a Korean natural forest dominated by 80–200-year old trees of similar species to the study site, Kim et al. [50] also observed high export rates of suspended sediment (measured as POC) during intense storm events.
Potential sources of suspended sediment in mountainous forested watersheds include the forest floors, trails, streambanks, and streambeds [7,48]. Other studies that have traced sediment sources in the Haean watershed using Pb stable isotopes [20] or C and N stable isotopes [19] suggested streambanks and bare surfaces as major sources of sediments. In a study that traced sediment sources using 137Cs and 210Pb in a Japanese cypress plantation, Mizugaki et al. [48] found that suspended sediment was derived from a mixture of sources including interrills on the forest floor, truck trails, and streambanks. Relatively high contributions of suspended sediment from the forest floor during heavy rainfalls were attributed to overland flow and interrill erosion due to low organic matter accumulation and understory vegetation coverage on the forest floor under the dense cover of cypress canopies [48].
High-frequency turbidity measurements on the timescale of minutes had several advantages over the lower temporal resolution of intense hourly storm event sampling, which often did not indicate rapid changes in suspended sediment transport during intense rainfall events (Figure 3 and Figure 4). Care should be taken when turbidity is used as a surrogate of suspended sediment, because turbidity represents the light scattering properties of all the suspended matter unlike TSS that represents the mass of suspended sediment per unit volume [16]. However, there are some advantages of high-resolution time series data of turbidity including the application potential of real-time turbidity measurements as early warning signals of suspended sediment and organic carbon surges in drinking water facilities and their source areas. If we can establish empirical relationships between turbidity levels and the concentrations of TSS or POC, as shown in Figure 6, the relatively cost-effective and robust turbidity measurement system can be employed as a surrogate to estimate the concentrations and fluxes of suspended sediment or organic carbon in streams and rivers. While turbidity time series data have been widely used to estimate suspended sediment loads in polluted waters (e.g., [51]), this study provided a rare empirical relationship between turbidity and the concentrations of POC. Sediment surges in drinking water source areas during extreme rainfall events can have devastating impacts on drinking water facilities and aquatic ecosystems. This occurred in 2006 in the Lake Soyang Watershed where our study site is located. Early warning signals from real-time turbidity measurements in headwater streams can facilitate proactive protection of waterways and water treatment facilities. For example, early warning signals can allow water treatment operators to add treatment modules or shut down the intake valves until “slugs” of suspended sediment pass by. These signals can also help predict potential increases in disinfection byproducts during rainfall events based on the well-established relationship between the amount of organic substances (particularly humic substances) and disinfection byproduct formation potentials [38,39,52].

5. Conclusions

While bi-weekly monitoring data captured long-lasting, substantial decreases in DO and large increases in dissolved nutrients during extended droughts from winter to spring, very rapid, drastic increases in TSS concentrations and turbidity during intense monsoon rainfall events might represent a key climate-related water quality issue in the studied mountainous watersheds. Given the potential of suspended sediment to transport heavy metals and other toxic contaminants, rainfall-induced pulses of suspended sediment can pose further risks to downstream water quality, particularly in mountainous areas under poor forest growth conditions or dotted with abandoned mines.
Comparing stream water chemistry data collected at different timescales allowed us to evaluate the importance of sampling frequency in assessing climate-induced risks to stream water quality arising from either intense monsoon rainfalls or large seasonal variations in rainfall. Based on the comparison of intensive rainfall event sampling at 2 h intervals, in situ instrumental measurements at 5 min intervals, and bi-weekly monitoring data, we suggest that routine monitoring based on weekly to monthly sampling should be supplemented with high-frequency sampling or continuous instrumental measurements to provide more accurate estimates of material transport, particularly those related to suspended sediment, during periods when hydrologic conditions vary very rapidly due to frequent occurrence of storm events. In particular, high-frequency, in situ measurements of turbidity can provide high-resolution time series data that can be used to estimate the transport of suspended sediment and POC based on the empirical relationships established for several rainfall events of various duration and intensity. These data can also be used as early warning signals for suspended sediment and POC surges during intense rainfall events and to identify potential increases in disinfection byproduct formation by natural organic matter in drinking water source areas based on some empirical relationships between suspended sediment (or POC) and disinfection byproduct formation potentials that were established in a previous study conducted at the same watershed [39]. The positive relationships between the concentrations of suspended sediment and metals (Pb) reported from the same study site [20] might be used to predict the potential range of metal fluxes carried by suspended sediment.
In summary, we propose that high-frequency instrumental monitoring, such as continuous turbidity measurements, should be complemented to the conventional routine monitoring to capture rapid water quality changes in headwater streams draining mountainous watersheds during rainfall events. Within this proposed multiple time-scale monitoring scheme, low-frequency routine monitoring data can be used to establish long-term or seasonal patterns for chemical constituents showing strong seasonal trends, including DO and dissolved ion concentrations.

Acknowledgments

This research was supported by the National Research Foundation of Korea, funded by the Ministry of Education, Science and Technology (2014R1A2A2A01006577; ERC 2009-0083527). We appreciate all the students who were involved in the multi-year projects, including Kyeong-Won Jo, Jong-Jin Jeong, and Byung-Joon Jeong just to name the most important contributors. We also thank two anonymous reviewers for their constructive comments that helped us improve an earlier version of the manuscript.

Author Contributions

Ji-Hyung Park conceived and designed the experiments; Hyun-Ju Lee and Ji-Hyung Park performed the experiments, analyzed the data, and wrote the manuscript; Kun-Woo Chun and Christopher L. Shope contributed additional data and provided comments on the manuscript.

Conflicts of Interest

The authors declare no conflict of interest.

References

  1. Gomi, T.; Sidle, R.C.; Richardson, J.S. Understanding processes and downstream linkages of headwater systems. BioScience 2002, 52, 905–916. [Google Scholar] [CrossRef]
  2. Postel, S.L.; Thompson, B.H., Jr. Watershed protection: Capturing the benefits of nature’s water supply services. Nat. Resour. Forum 2005, 29, 98–108. [Google Scholar] [CrossRef]
  3. Viviroli, D.; Weingartner, R.; Messerli, B. Assessing the hydrological significance of the world’s mountains. Mt. Res. Dev. 2003, 23, 32–40. [Google Scholar] [CrossRef]
  4. Bradshaw, C.J.A.; Sodhi, N.S.; Peh, K.S.H.; Brook, B.W. Global evidence that deforestation amplifies flood risk and severity in the developing world. Glob. Chang. Biol. 2007, 13, 2379–2395. [Google Scholar] [CrossRef]
  5. Eisenbies, M.H.; Aust, W.M.; Burger, J.A.; Adams, M.B. Forest operations, extreme flooding events, and considerations for hydrologic modeling in the Appalachians—A review. For. Ecol. Manag. 2007, 242, 77–98. [Google Scholar] [CrossRef]
  6. Binkley, D.; Brown, T.C. Forest practices as nonpoint sources of pollution in North America. Water Resour. Bull. 1993, 29, 729–740. [Google Scholar] [CrossRef]
  7. Sidle, R.C.; Ziegler, A.D.; Negishi, J.N.; Nik, A.R.; Siew, R.; Turkelboom, F. Erosion processes in steep terrain—Truths, myths, and uncertainties related to forest management in Southeast Asia. For. Ecol. Manag. 2006, 224, 199–225. [Google Scholar] [CrossRef]
  8. Min, S.-K.; Zhang, X.; Zwiers, F.W.; Hegerl, G.C. Human contribution to more-intense precipitation extremes. Nature 2011, 470, 378–381. [Google Scholar] [CrossRef] [PubMed]
  9. Park, J.-H.; Duan, L.; Kim, B.; Mitchell, M.J.; Shibata, H. Potential effects of climate change and variability on watershed biogeochemical processes and water quality in Northeast Asia. Environ. Int. 2010, 36, 212–225. [Google Scholar] [CrossRef] [PubMed]
  10. Kaushal, S.S.; Pace, M.L.; Groffman, P.M.; Band, L.E.; Belt, K.T.; Mayer, P.M.; Welty, C. Land use and climate variability amplify contaminant pulses. Eos 2010, 91, 221–228. [Google Scholar] [CrossRef]
  11. Jeong, J.-J.; Bartsch, S.; Fleckenstein, J.; Matzner, E.; Tenhunen, J.; Lee, S.D.; Park, S.-K.; Park, J.-H. Differential storm responses of dissolved and particulate organic carbon in a mountainous headwater stream, investigated by high-frequency in-situ optical measurements. J. Geophys. Res. 2012, 117. [Google Scholar] [CrossRef]
  12. Fukuyama, T.; Onda, Y.; Gomi, T.; Yamamoto, K.; Kondo, N.; Miyata, S.; Kosugi, K.; Mizugaki, S.; Tsubonuma, N. Quantifying the impact of forest management practice on the runoff of the surface-derived suspended sediment using fallout radionuclides. Hydrol. Process. 2010, 24, 596–607. [Google Scholar] [CrossRef]
  13. Zhang, Z.; Fukushima, T.; Onda, Y.; Gomi, T.; Fukuyama, T.; Sidle, R.; Kosugi, K.; Matsushige, K. Nutrient runoff from forested watersheds in central Japan during typhoon storms: Implications for understanding runoff mechanisms during storm events. Hydrol. Process. 2007, 21, 1167–1178. [Google Scholar] [CrossRef]
  14. Goldsmith, S.T.; Carey, A.E.; Lyons, W.B.; Kao, S.-J.; Lee, T.-Y.; Chen, J. Extreme storm events, landscape denudation, and carbon sequestration: Typhoon Mindulle, Choshui River, Taiwan. Geology 2008, 36, 483–486. [Google Scholar] [CrossRef]
  15. Tsai, C.-J.; Lin, T.-C.; Hwong, J.-L.; Lin, N.-H.; Wang, C.-P.; Hamburg, S. Typhoon impacts on stream water chemistry in a plantation and an adjacent natural forest in central Taiwan. J. Hydrol. 2009, 378, 290–298. [Google Scholar] [CrossRef]
  16. Bilotta, G.S.; Brazier, R.E. Understanding the influence of suspended solids on water quality and aquatic biota. Water Res. 2008, 42, 2849–2861. [Google Scholar] [CrossRef] [PubMed]
  17. Ide, J.; Haga, H.; Chiwa, M.; Otsuki, K. Effects of antecedent rain history on particulate phosphorus loss from a small forested watershed of Japanese cypress (Chamaecyparis obtuse). J. Hydrol. 2008, 352, 322–335. [Google Scholar] [CrossRef]
  18. Hilton, R.G.; Galy, A.; Hovius, N.; Chen, M.C.; Horng, M.J.; Chen, H. Tropical-cyclone-driven erosion of the terrestrial biosphere from mountains. Nat. Geosci. 2008, 1, 759–762. [Google Scholar] [CrossRef] [Green Version]
  19. Jung, B.-J.; Lee, H.-J.; Jeong, J.-J.; Owen, J.S.; Kim, B.; Meusburger, K.; Alewell, C.; Gebauer, G.; Shope, C.; Park, J.-H. Storm pulses and varying sources of hydrologic carbon export from a mountainous watershed. J. Hydrol. 2012. [Google Scholar] [CrossRef]
  20. Jo, K.-W.; Park, J.-H. Rapid release and changing sources of Pb in a mountainous watershed during extreme rainfall events. Environ. Sci. Technol. 2010, 44, 9324–9329. [Google Scholar] [CrossRef] [PubMed]
  21. Bormann, F.H.; Likens, G.E. Nutrient cycling. Science 1967, 155, 424–429. [Google Scholar] [CrossRef] [PubMed]
  22. Peterson, D.; Smith, R.; Hager, S.; Hicke, J.; Dettinger, M.; Huber, K. River chemistry as a monitor of Yosemite Park mountain hydroclimates. Eos 2005, 86, 285–292. [Google Scholar] [CrossRef]
  23. Likens, G.E.; Driscoll, C.T.; Buso, D.C. Long-term effects of acid rain: Response and recovery of a forest ecosystem. Science 1996, 272, 244–246. [Google Scholar] [CrossRef]
  24. Park, J.-H.; Mitchell, M.J.; McHale, P.J.; Christopher, S.F.; Myers, T.P. Impacts of changing climate and atmospheric deposition on N and S drainage losses from a forested watershed of the Adirondack Mountains, New York State. Glob. Chang. Biol. 2003, 9, 1602–1619. [Google Scholar] [CrossRef]
  25. Murdoch, P.S.; Baron, J.S.; Miller, T.L. Potential effects of climate change on surface-water quality in North America. J. Am. Water Resour. Assoc. 2000, 36, 347–366. [Google Scholar] [CrossRef]
  26. Campbell, J.L.; Rustad, L.E.; Boyer, E.W.; Christopher, S.F.; Driscoll, C.T.; Fernandez, I.J.; Groffman, P.M.; Houle, D.; Kiekbusch, J.; Magill, A.H.; et al. Consequences of climate change for biogeochemical cycling in forests of northeastern North America. Can. J. For. Res. 2009, 39, 264–284. [Google Scholar] [CrossRef]
  27. Van Verseveld, W.J.; McDonnell, J.J.; Lajtha, K. The role of hillslope hydrology in controlling nutrient loss. J. Hydrol. 2009, 367, 177–187. [Google Scholar] [CrossRef]
  28. Hornberger, G.M.; Bencala, K.E.; McKnight, D.M. Hydrological controls on dissolved organic carbon during snowmelt in the Snake River near Montezuma, Colorado. Biogeochemistry 1994, 25, 147–165. [Google Scholar] [CrossRef]
  29. Inamdar, S.P.; Christopher, S.F.; Mitchell, M.J. Export mechanisms for dissolved organic carbon and nitrate during summer storm events in a glaciated forested catchment in New York, USA. Hydrol. Process. 2004, 18, 2651–2661. [Google Scholar] [CrossRef]
  30. Inamdar, S.P.; Mitchell, M.J. Hydrologic and topographic controls on storm-event exports of dissolved organic carbon (DOC) and nitrate across catchment scales. Water Resour. Res. 2006, 42. [Google Scholar] [CrossRef]
  31. Butturini, A.; Alvarez, M.; Bernal, S.; Vazquez, E.; Sabater, F. Diversity and temporal sequences of forms of DOC and NO3 discharge responses in an intermittent stream: Predictable or random succession? J. Geophys. Res. Biogeosci. 2008, 113. [Google Scholar] [CrossRef]
  32. Dhillon, G.S.; Inamdar, S. Extreme storms and changes in particulate and dissolved organic carbon in runoff: Entering uncharted waters? Geophys. Res. Lett. 2013, 40, 1322–1327. [Google Scholar] [CrossRef]
  33. Choi, G.; Collins, D.; Ren, G.; Trewin, B.; Baldi, M.; Fukuda, Y.; Afzaal, M.; Pianmana, T.; Gomboluudev, P.; Huong, P.T.T.H.; et al. Changes in means and extreme events of temperature and precipitation in the Asia-Pacific Network region, 1955–2007. Int. J. Climatol. 2009, 29, 1906–1925. [Google Scholar] [CrossRef]
  34. Allan, R.P.; Soden, B.J. Atmospheric warming and the amplification of precipitation extremes. Science 2008, 321, 1481–1484. [Google Scholar] [CrossRef] [PubMed]
  35. Choi, K.; Kwon, W.-T.; Boo, K.-O.; Cha, Y.-M. Recent spatial and temporal changes in means and extreme events of temperature and precipitation across the Republic of Korea. J. Korean Geogr. Soc. 2008, 43, 681–700. [Google Scholar]
  36. Baborowski, M.; von Tümpling, W.; Friese, K., Jr. Behavior of suspended particulate matter (SPM) and selected trace metals during the 2002summer flood in the River Elbe (Germany) and Magdeburg monitoring station. Hydrol. Earth Syst. Sci. 2004, 8, 135–150. [Google Scholar] [CrossRef]
  37. Presley, S.M.; Rainwater, T.R.; Austin, G.P.; Platt, S.G.; Zak, J.C.; Cobb, G.P.; Marsland, E.J.; Tian, K.; Zhang, B.; Anderson, T.A.; et al. Assessment of pathogens and toxicants in New Orleans, LA following Hurricane Katrina. Environ. Sci. Technol. 2006, 40, 468–474. [Google Scholar] [CrossRef] [PubMed]
  38. Nguyen, H.V.M.; Lee, M.H.; Hur, J.; Schlautman, M.A. Variations in spectroscopic characteristics and disinfection byproduct formation potentials of dissolved organic matter for two contrasting storm events. J. Hydrol. 2013, 481, 132–142. [Google Scholar] [CrossRef]
  39. Jung, B.-J.; Lee, J.-K.; Kim, H.; Park, J.-H. Export, biodegradation, and disinfection byproduct formation of dissolved and particulate organic carbon in a forested headwater stream during extreme rainfall events. Biogeosciences 2014, 11, 6119–6129. [Google Scholar] [CrossRef]
  40. Seibert, J.; Stendahl, J.; Sørensen, R. Topographical influences on soil properties in boreal forests. Geoderma 2007, 141, 139–148. [Google Scholar] [CrossRef]
  41. Nagorski, S.A.; Moore, J.N.; McKinnon, T.E. Geochemical response to variable streamflow conditions in contaminated and uncontaminated streams. Water Resour. Res. 2003, 39, 1044. [Google Scholar] [CrossRef]
  42. Korea Ministry of Environment. White Paper of Environment 2010. Available online: http://library.me.go.kr/search/DetailView.Popup.ax?cid=5256302 (accessed on 1 September 2015).
  43. Walling, D.E.; Foster, I.D.L. Variations in the natural chemical concentration of river water during flood flows, and the lag effect: Some further comments. J. Hydrol. 1975, 26, 237–244. [Google Scholar] [CrossRef]
  44. Whitfield, P.H.; Schreier, H. Hysteresis in relationship between discharge and water chemistry in the Fraser River basin, British Columbia. Limnol. Oceanogr. 1981, 26, 1179–1182. [Google Scholar] [CrossRef]
  45. Butturini, A.; Gallart, F.; Latron, J.; Vazquez, E.; Sabater, F. Cross-site comparison of variability of DOC and nitrate c-q hysteresis during the autumn-winter period in three Mediterranean headwater streams: A synthetic approach. Biogeochemistry 2006, 77, 327–349. [Google Scholar] [CrossRef]
  46. Meybeck, M. Carbon, nitrogen, and phosphorus transport by world rivers. Am. J. Sci. 1982, 282, 401–450. [Google Scholar] [CrossRef]
  47. Nisbet, T.R. The role of forest management in controlling diffuse pollution in UK forestry. For. Ecol. Manag. 2001, 143, 215–226. [Google Scholar] [CrossRef]
  48. Mizugaki, S.; Onda, Y.; Fukuyama, T.; Koga, S.; Asai, H.; Hiramatsu, S. Estimation of suspended sediment sources using 137Cs and 210Pbex in unmanaged Japanese cypress plantation watersheds in southern Japan. Hydrol. Process. 2008, 22, 4519–4531. [Google Scholar] [CrossRef]
  49. Ide, J.; Kume, T.; Wakiyama, Y.; Higashi, N.; Chiwa, M.; Otsuki, K. Estimation of annual suspended sediment yield from a Japanese cypress (Chamaecyparis obtuse) plantation considering antecedent rainfalls. For.Ecol. Manag. 2009, 257, 1955–1965. [Google Scholar] [CrossRef]
  50. Kim, S.J.; Kim, J.; Kim, K. Organic carbon efflux from a deciduous forest catchment in Korea. Biogeosciences 2010, 7, 1323–1334. [Google Scholar] [CrossRef]
  51. Lacour, C.; Joannis, C.; Chebbo, G. Assessment of annual pollutant loads in combined sewers from continuous turbidity measurements: Sensitivity to calibration data. Water Res. 2009, 43, 2179–2190. [Google Scholar] [CrossRef] [PubMed]
  52. Chow, A.T.; Dahlgren, R.A.; Harrison, J.A. Watershed sources of disinfection byproduct precursors in the Sacramento and San Joaquin Rivers, California. Environ. Sci. Technol. 2007, 41, 7645–7652. [Google Scholar] [CrossRef] [PubMed]

