Article

Quantifying the Fecal Coliform Loads in Urban Watersheds by Hydrologic/Hydraulic Modeling: Case Study of the Beauport River Watershed in Quebec

by
Amélie Thériault
1 and
Sophie Duchesne
2,*
1
Instititut National de la Recherche Scientifique—Centre Eau Terre Environnement (INRS-ETE) (National Institute of Scientific Research—Centre on Water, Earth, and the Environment), 490 de la Couronne, Québec G1K 9A9, QC, Canada
2
Instititut National de la Recherche Scientifique—Centre Eau Terre Environnement (INRS-ETE) (National Institute of Scientific Research—Centre on Water, Earth, and the Environment, 490 de la Couronne, Québec G1K 9A9, QC, Canada
*
Author to whom correspondence should be addressed.
Water 2015, 7(2), 615-633; https://doi.org/10.3390/w7020615
Submission received: 4 December 2014 / Accepted: 16 January 2015 / Published: 9 February 2015
(This article belongs to the Special Issue Sustainable Drainage Systems)

Abstract

:
A three-step method for the identification of the main sources of fecal coliforms (FC) in urban waters and for the analysis of remedial actions is proposed. The method is based on (1) The statistical analysis of the relationship between rainfall and FC concentrations in urban rivers; (2) The simulation of hydrology and hydraulics; and (3) Scenario analysis. The proposed method was applied to the Beauport River watershed, in Canada, covering an area of 28.7 km2. FC loads and concentrations in the river, during and following rainfall events, were computed using the Storm Water Management Model (SWMM) hydrological/hydraulic simulation model combined with event mean concentrations. It was found that combined sewer overflows (CSOs) are the main FC sources, and that FC from stormwater runoff could still impair recreational activities in the Beauport River even if retention tanks were built to contain CSOs. Thus, intervention measures should be applied in order to reduce the concentration of FC in stormwater outfalls. The proposed method could be applied to water quality components other than FC, provided that they are present in stormwater runoff and/or CSOs, and that the time of concentration of the watershed is significantly lower than their persistence in urban waters.

1. Introduction

Fecal coliforms (FC) in urban waters are indicators of recent fecal contamination, and thus of a potential pathogen contamination [1]. This is why FC concentrations are often used in water quality standards for recreational activities, such as bathing, canoeing and fishing, especially since they are relatively easy to monitor. Sources of FC in urban areas are numerous and often difficult to track [1]. For example, point sources include wastewater treatment plant effluents and combined sewer overflows (CSOs), while nonpoint sources include stormwater runoff. Nonpoint sources have been demonstrated to be more important sources of contamination than point sources in many studies conducted in urban areas (e.g., [1]). Indeed, high concentrations of FC can be found in stormwater runoff [2,3,4,5].
Due to the numerous and varied potential FC sources in urban areas, modeling is useful to identify the main origins of FC contamination in urban watercourses before the proposal of remedial actions. Many different mathematical models exist to simulate water quality in urban areas. Some are based on linear regressions and correlations with explanatory variables [6,7,8], while others are less difficult to apply, like the Schueler’s simple method [9] or the annual load method proposed by Shaver et al. [10]. Other models are based on the simulation of hydrology and hydraulics, such as DR3M—QUAL (Multi-Event Urban Runoff Quality Model) [11], HSPF (Hydrological Simulation Program-Fortran) [12], MIKE [13], HEC-RAS (Hydrologic Engineering Centers River Analysis System) [14] and SWMM (Storm Water Management Model) [15]. With these models, water quality can be estimated by specific build-up/wash-off models, or by event mean concentrations (EMC).
Modeling studies focusing on the estimation of FC are less common than for other pollutants. Studies on the estimation of FC include Servais et al. [16], Bougeard et al. [17], Manache and Melching [18], Smith [19] and ADEC [20]. Recently, McCarthy et al. [21] developed a model designed specifically for the simulation of microorganisms in urban stormwater (Micro-Organism Prediction in Urban Stormwater (MOPUS)).
In this paper, we propose a three-step method for the identification and quantification of the main FC sources in urban areas and for the analysis of remedial actions, based on the simulation of hydrology and hydraulics. The three steps include preliminary statistical analysis, computation of FC loads from various potential sources and analysis of remedial scenarios. The methodology is applied, as an example, to the Beauport River watershed (Canada), an urban watershed where high FC concentrations often impair aquatic recreational activities.

2. Materials and Methods

2.1. Study Area

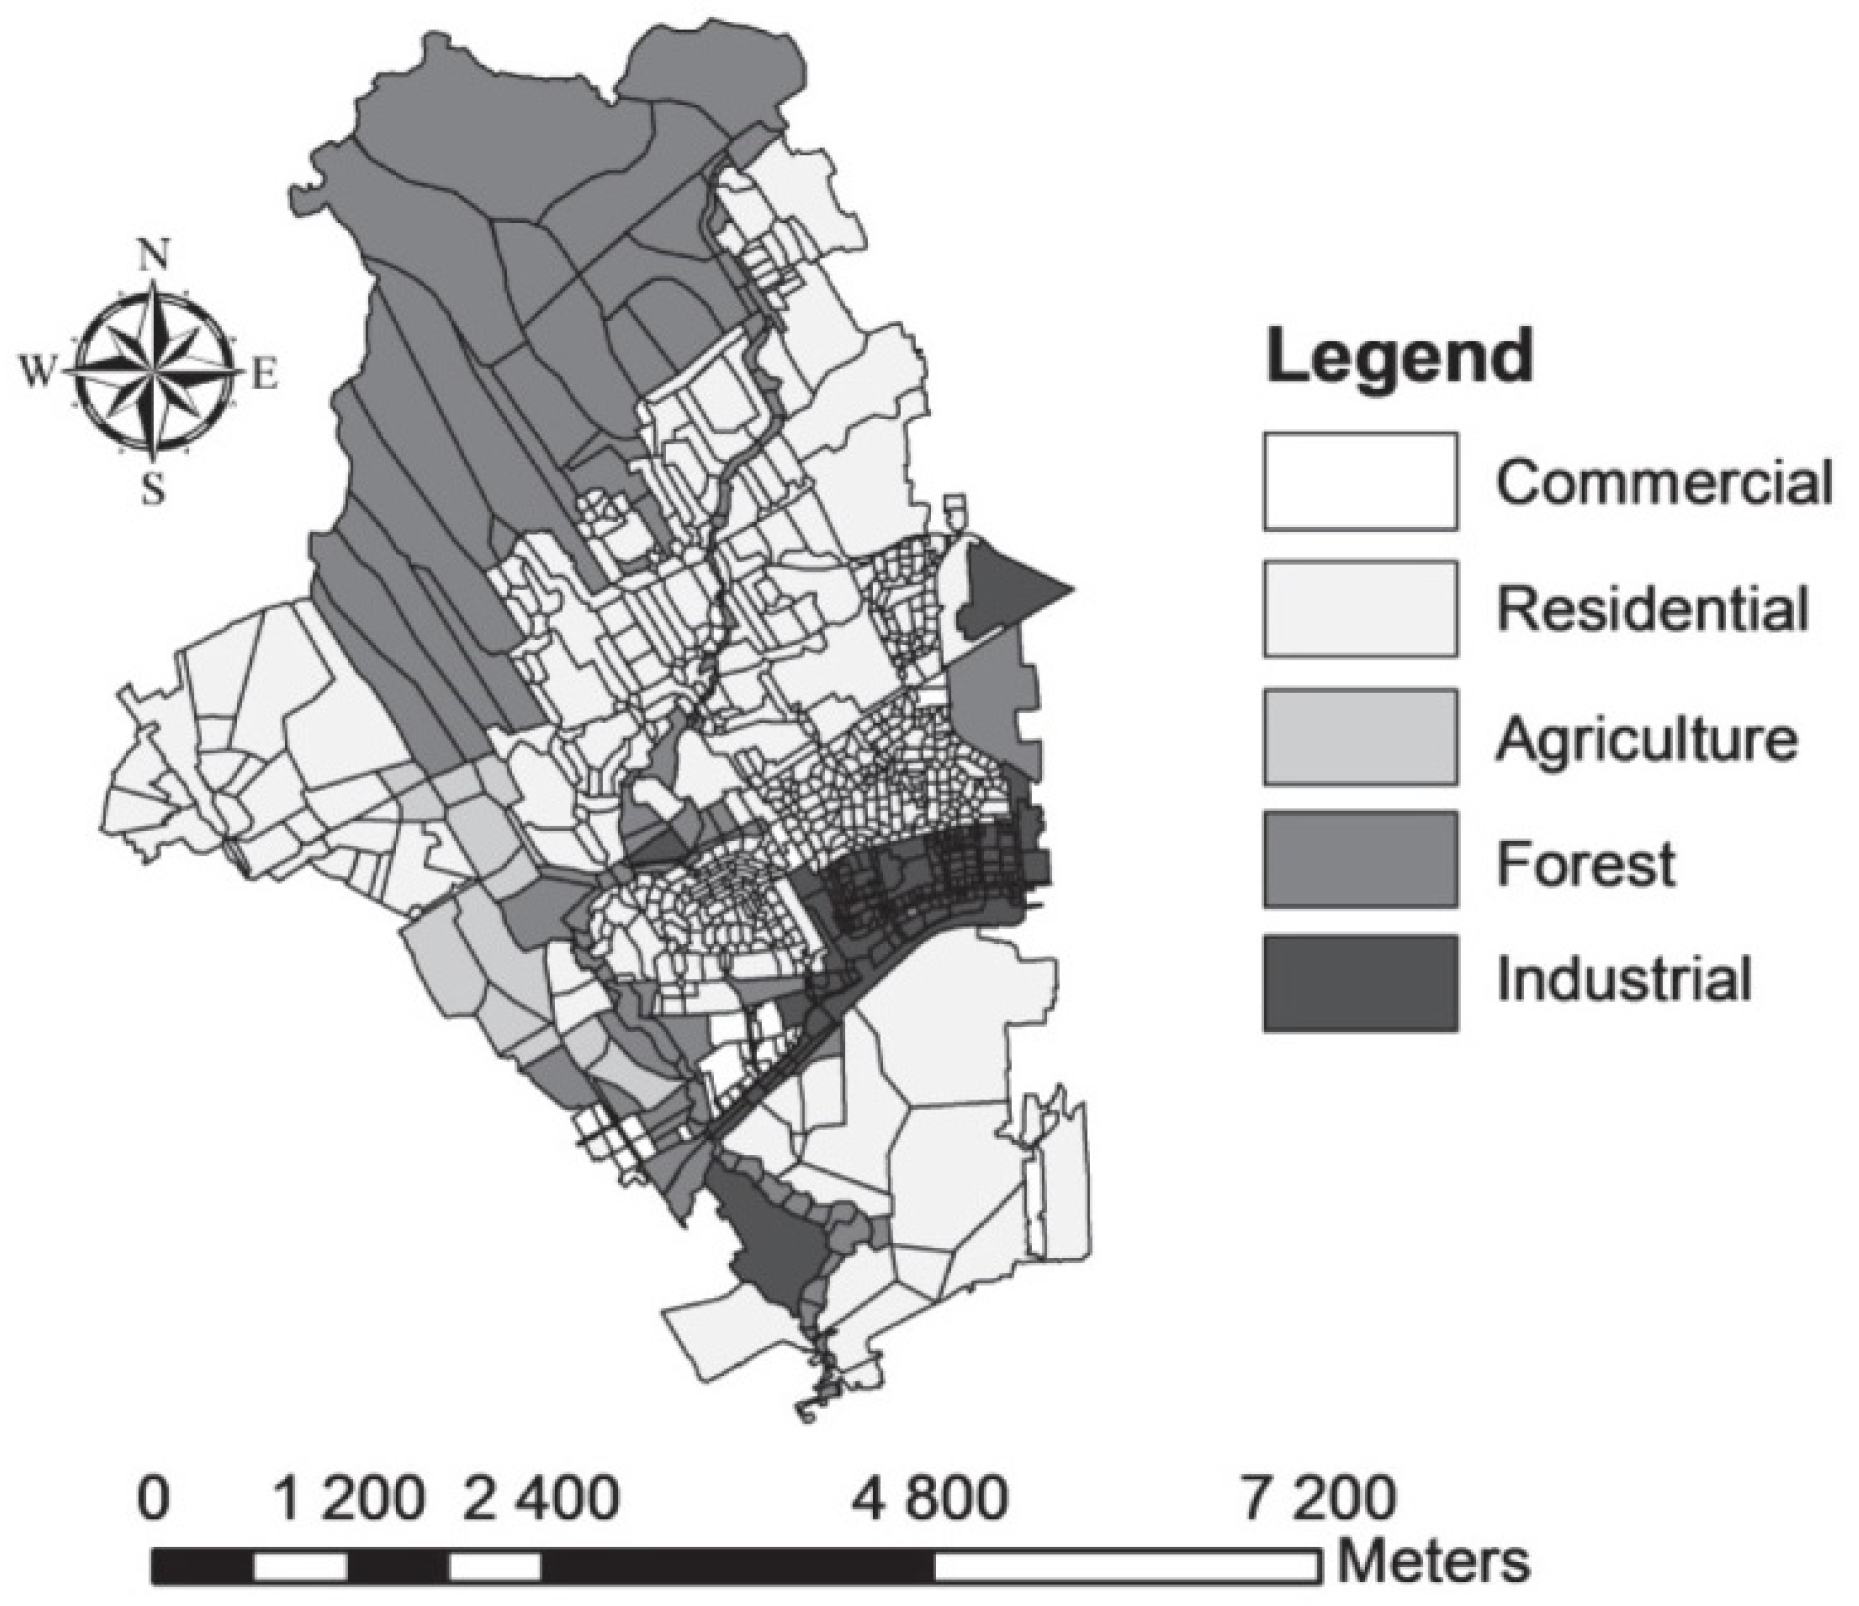
The Beauport River watershed is located in the Quebec City region (Canada) and covers an area of 28.7 km². The Beauport River flows through the watershed over a length of 22 km. The outlet of the river is situated in the Beauport Bay, a favored location for swimming and other secondary contact activities, such as fishing, kite surfing and kayaking. The area is divided into five large occupational classes: Residential, commercial, industrial, agricultural and undeveloped, which represent, respectively, 51%, 2%, 6%, 4% and 36% of the total area, as shown in 
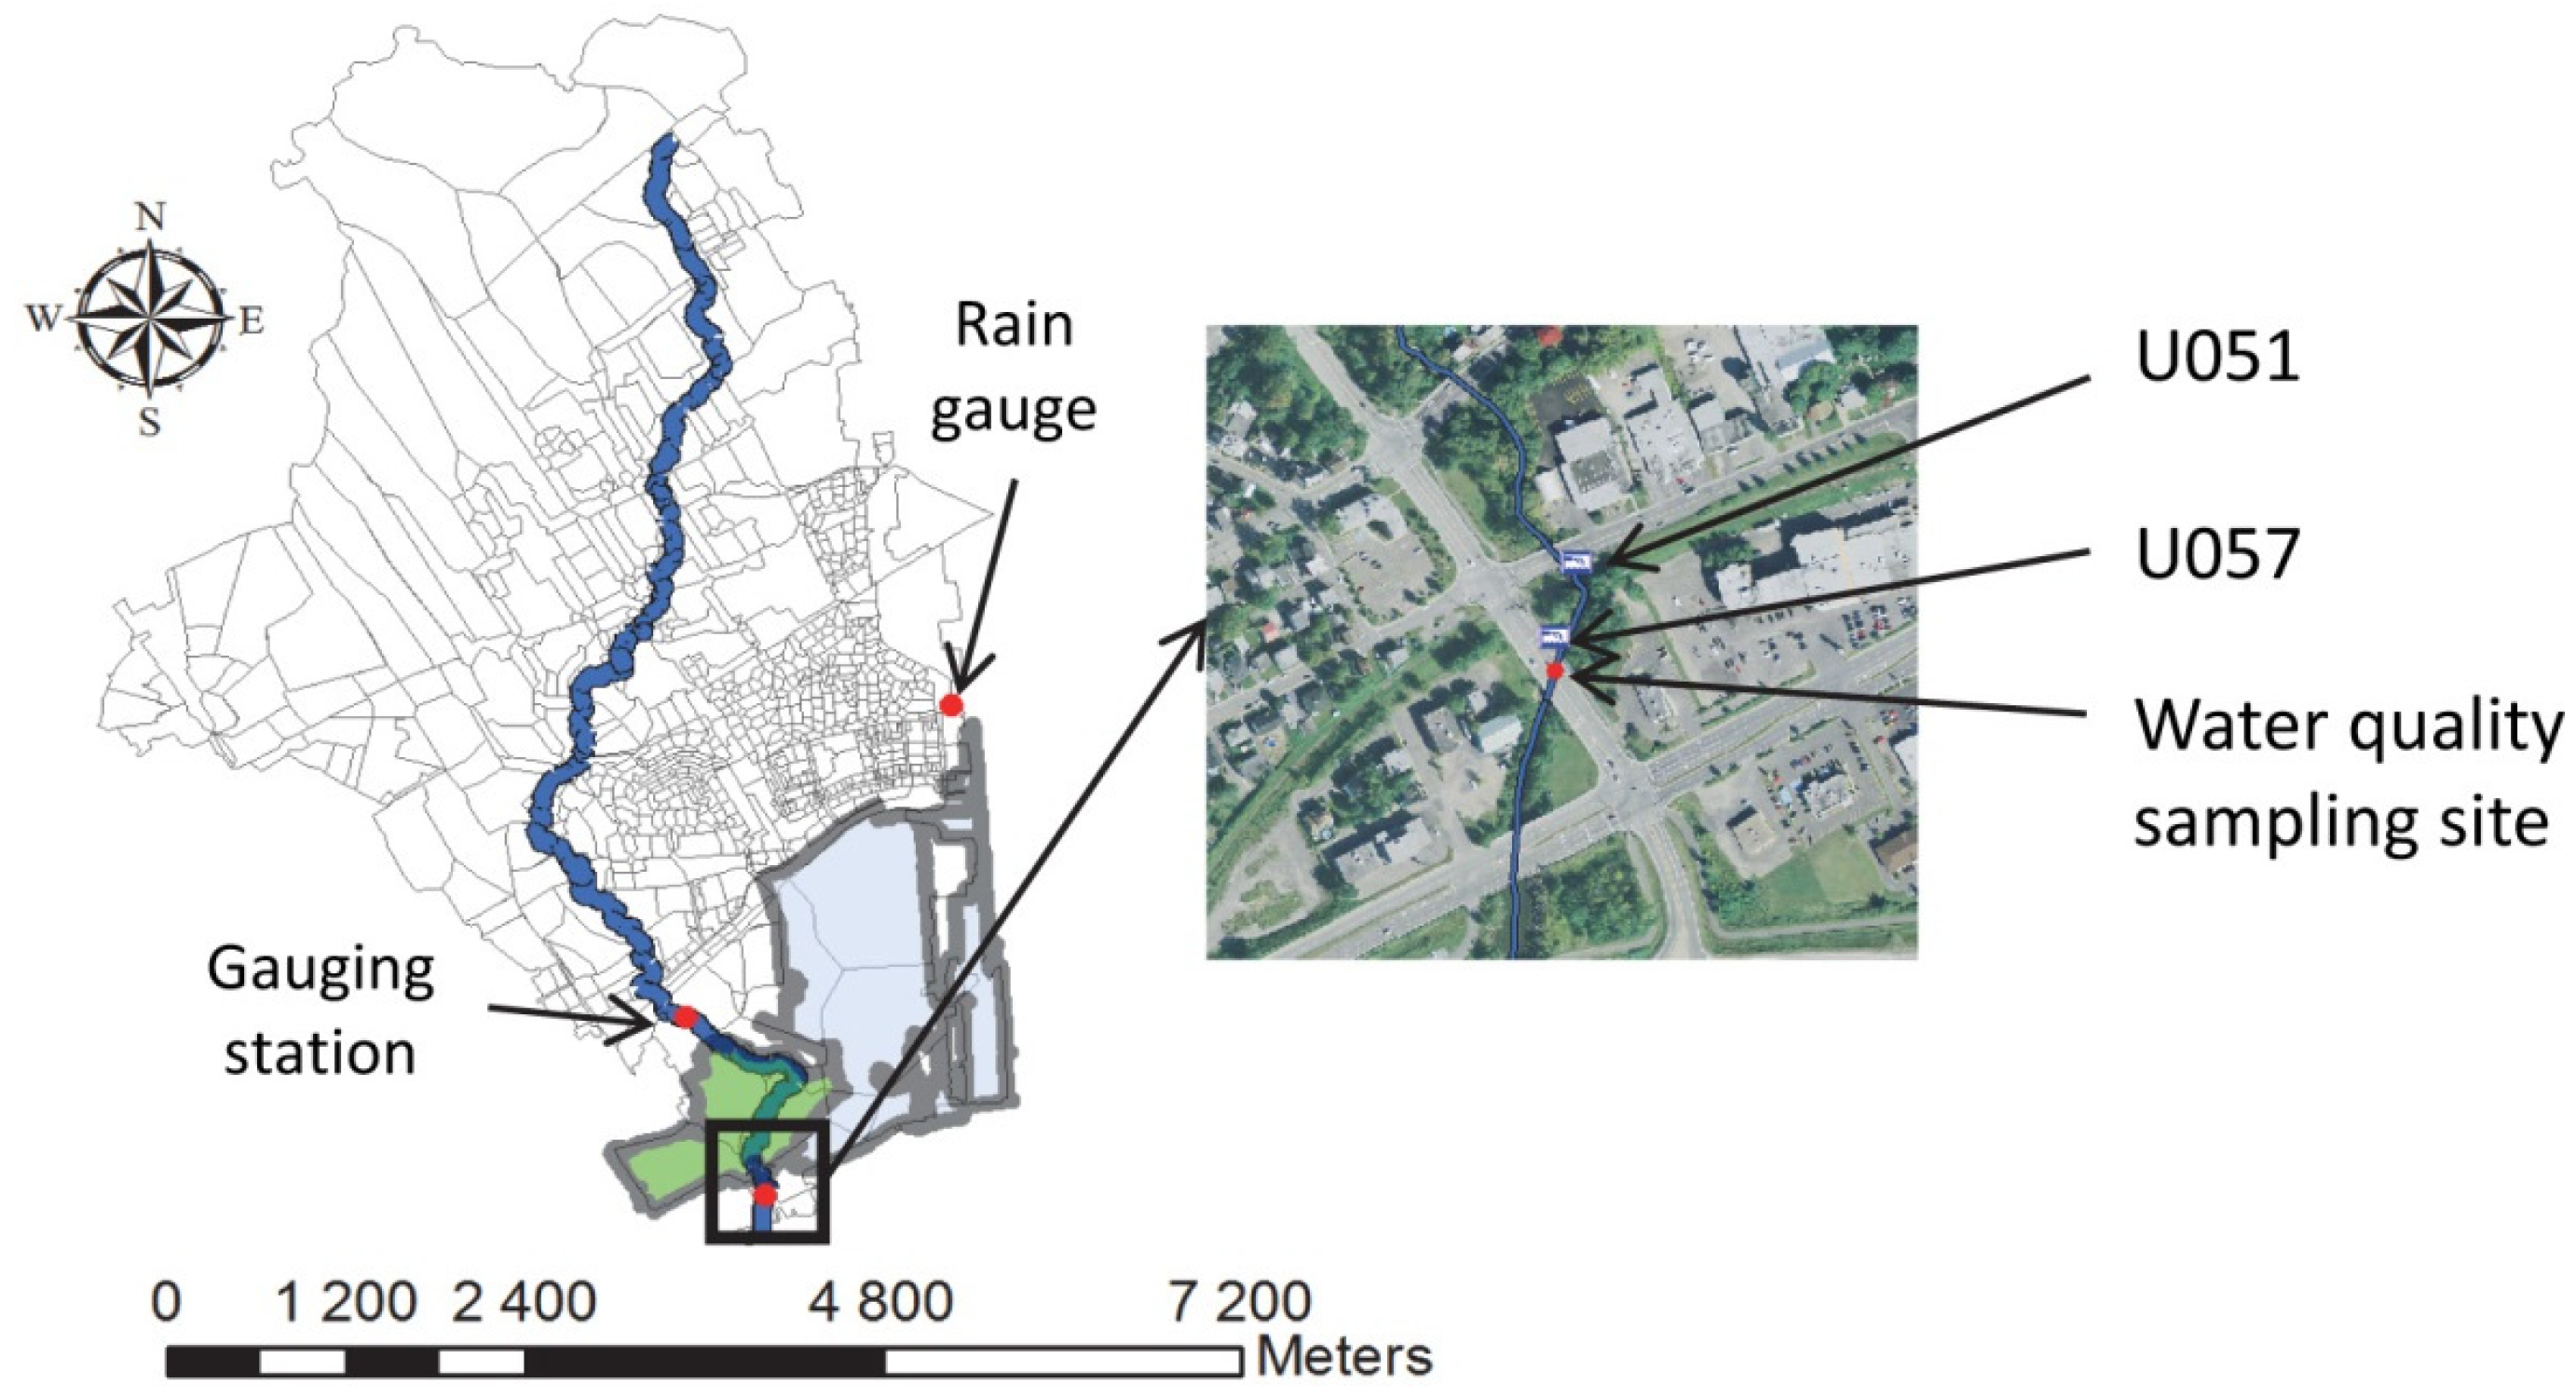
Figure 1. The different drainage systems and facilities are shown in 
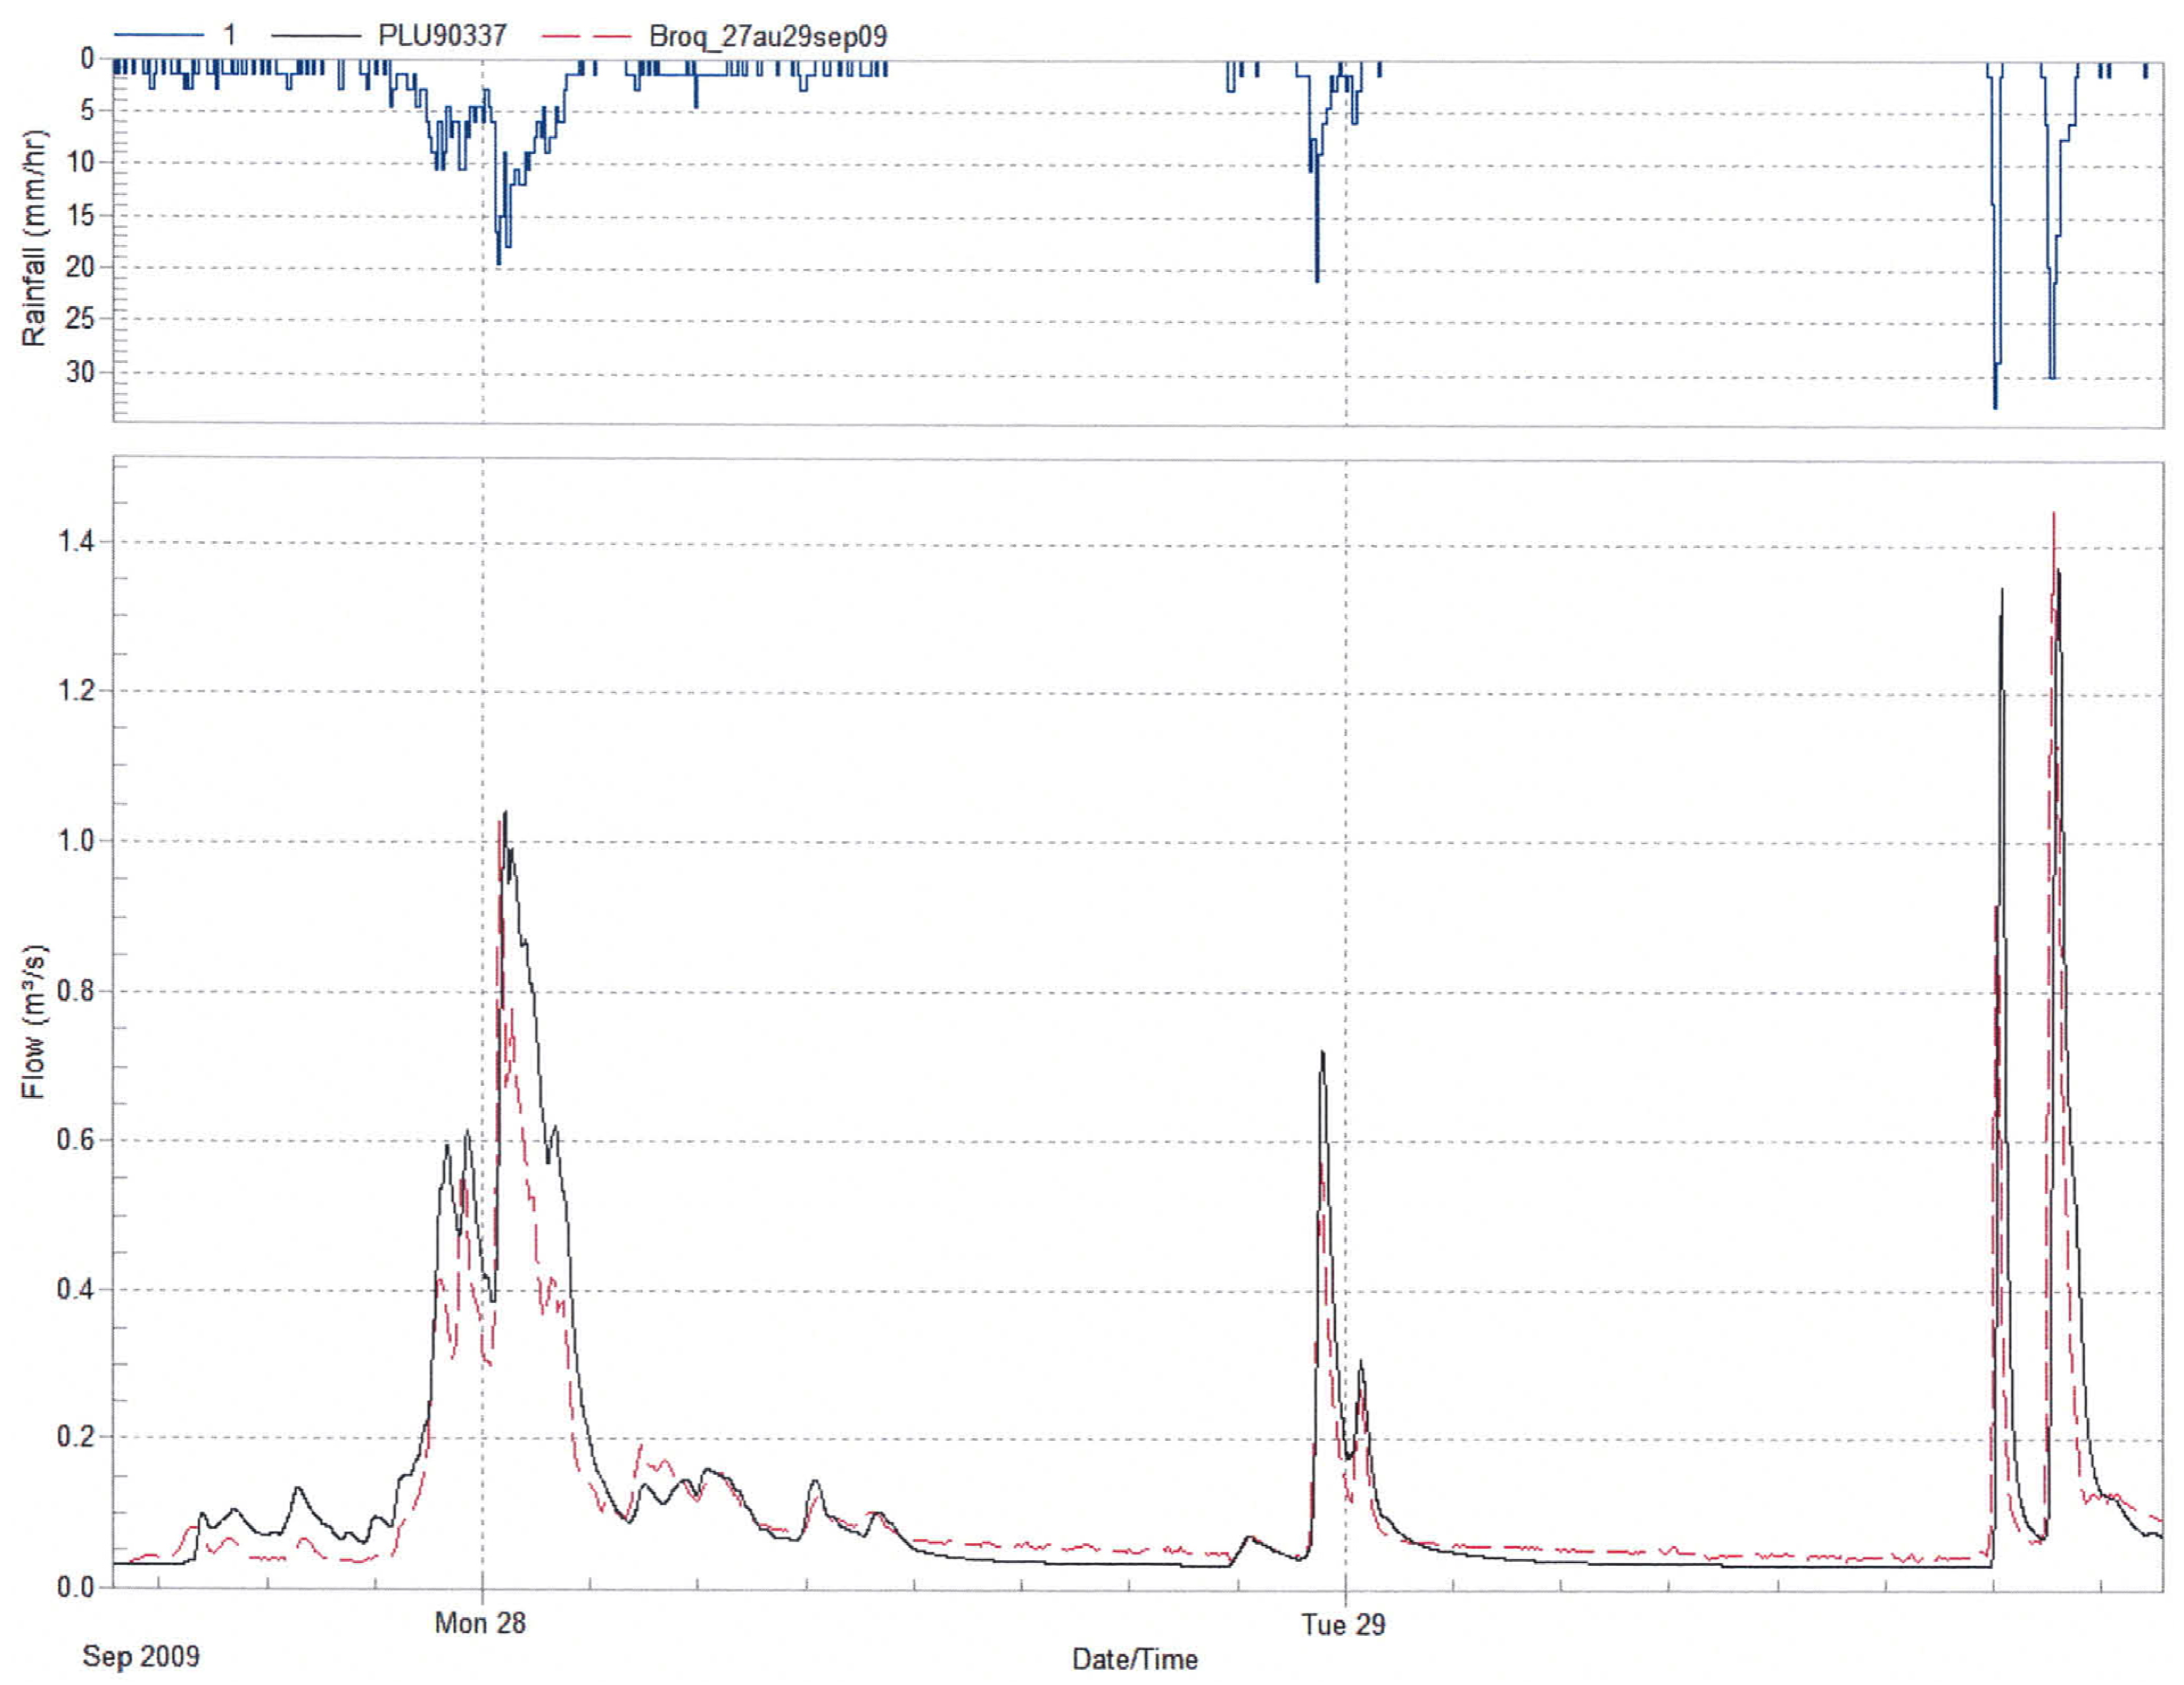
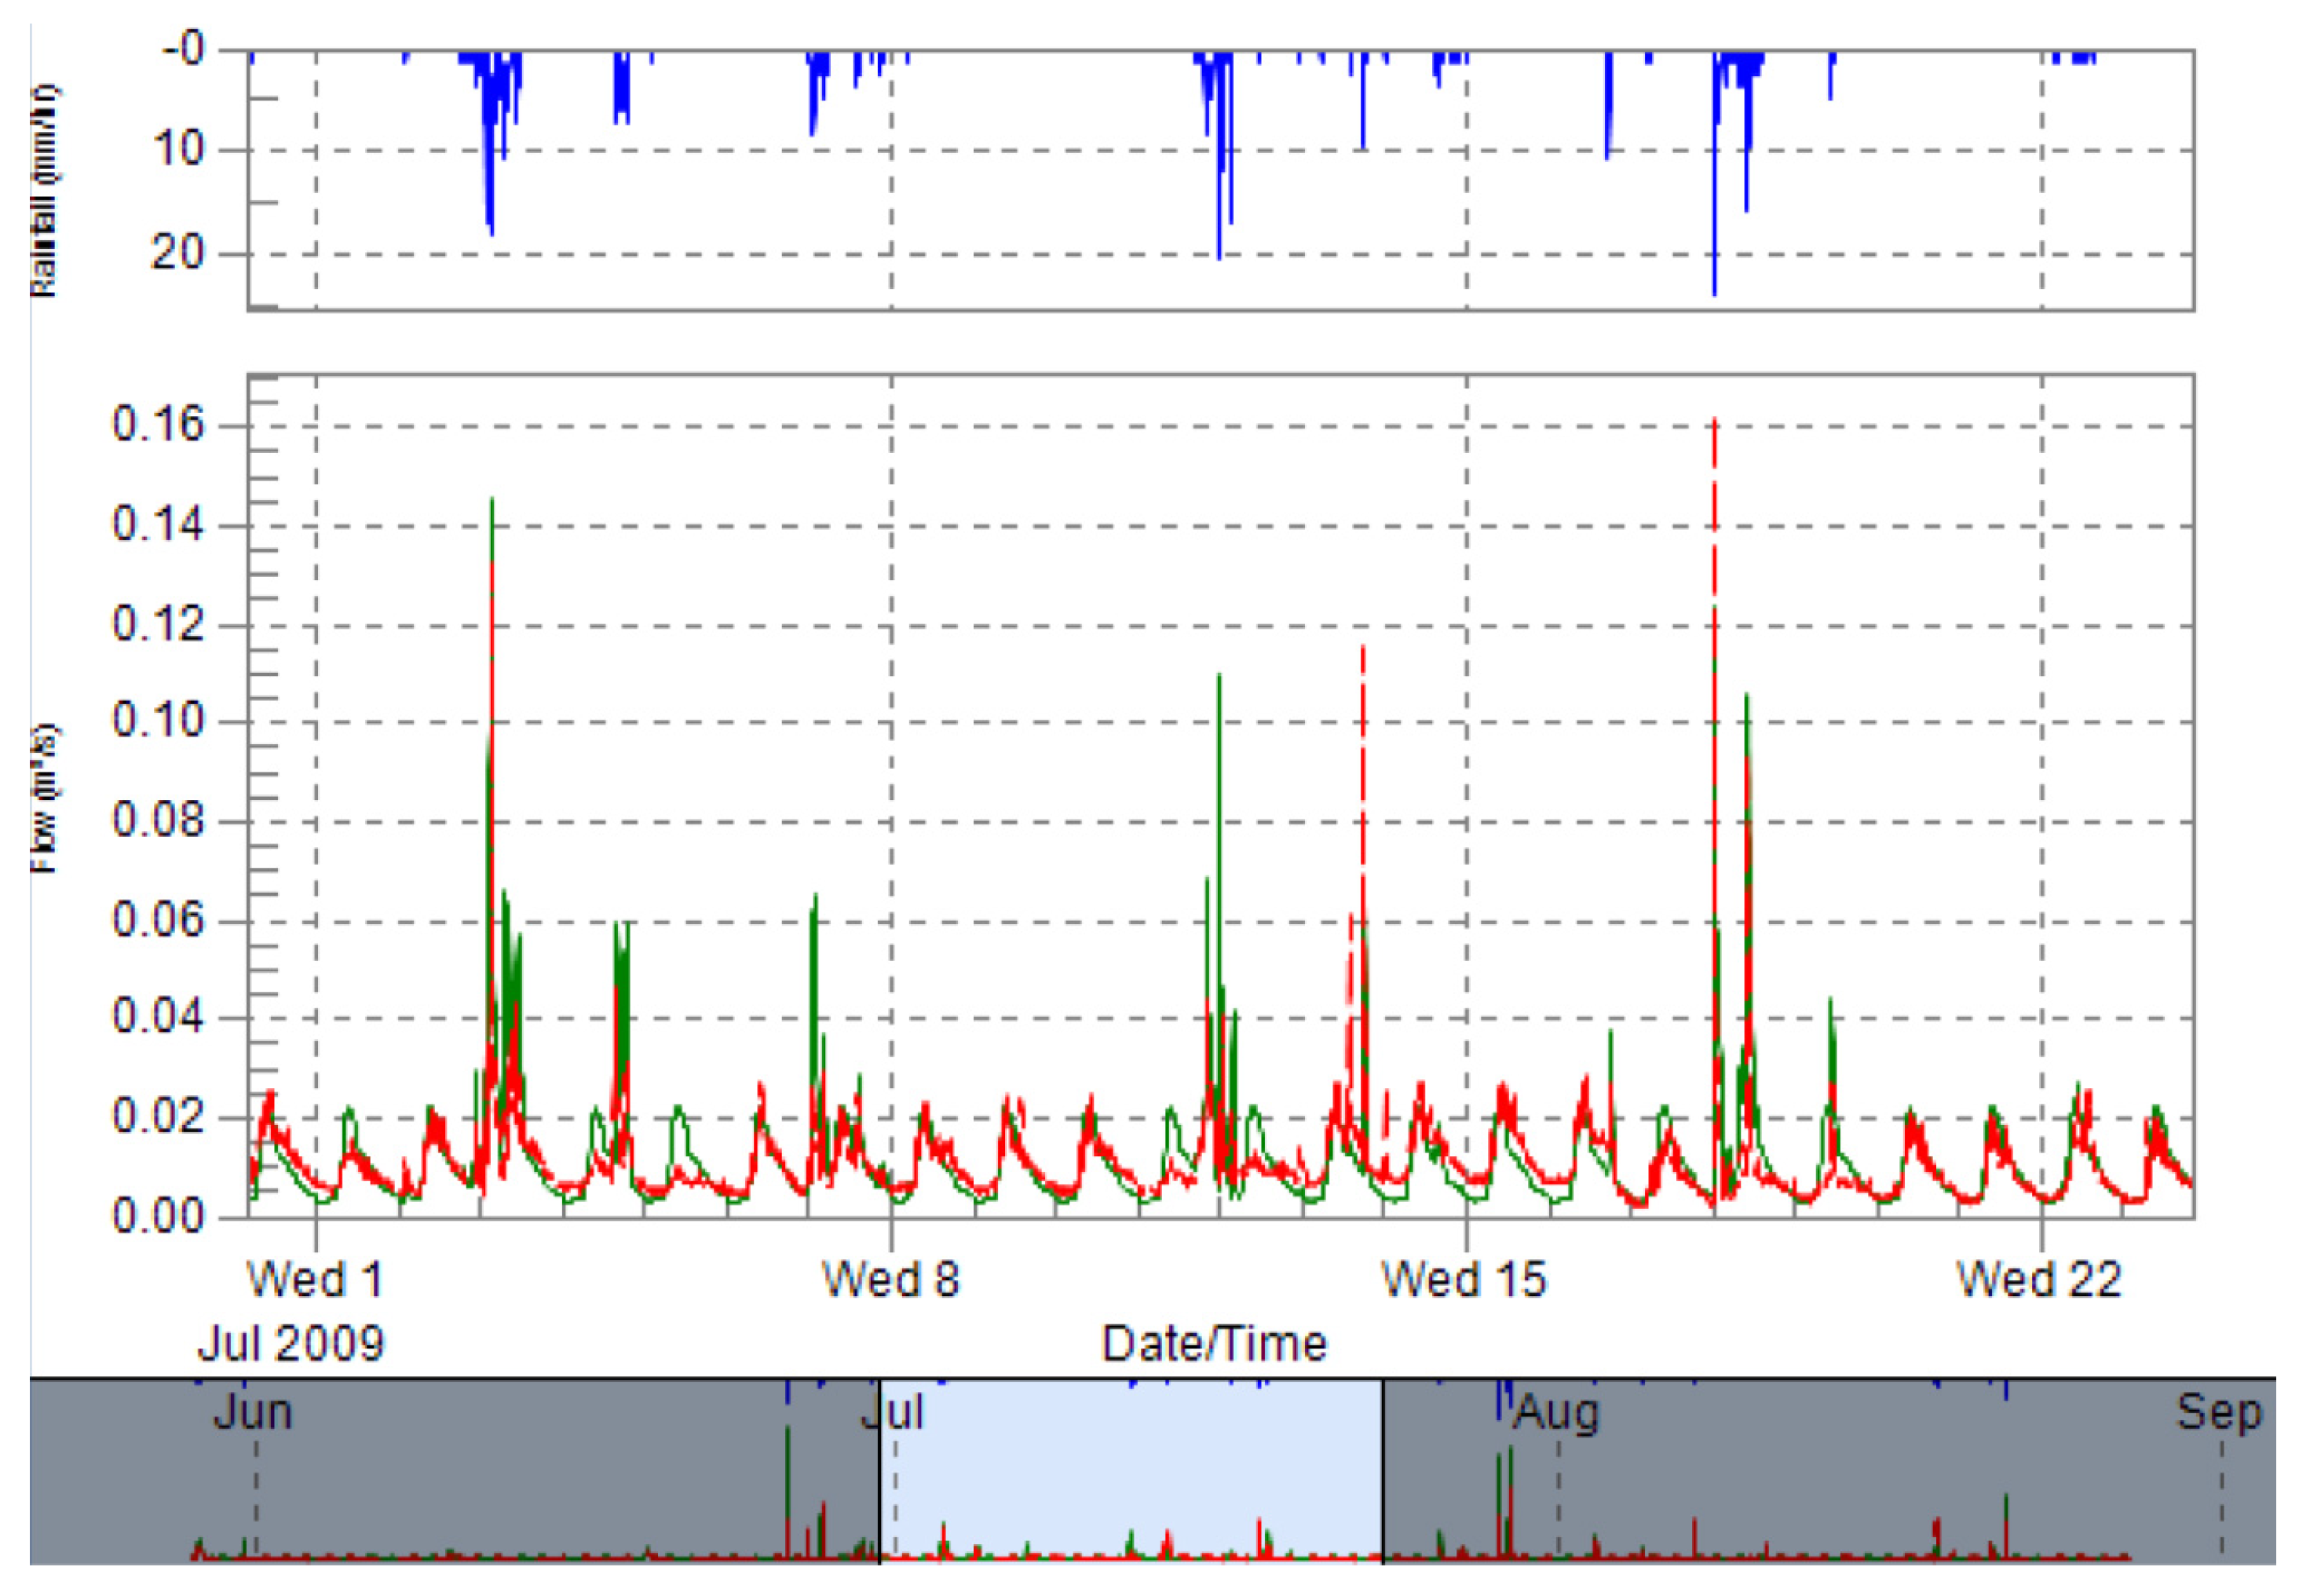
Figure 2. Precipitations were recorded every 5 min at the location shown in Figure 2. Data concerning flow rates were available in the form of daily averages. The daily average flow rate from 2006 to 2011 was 0.74 m3/s and the minimum recorded for those years was 0.18 m3/s. Two types of drainage networks exist in the watershed. First, from the upstream to the center of the watershed, runoff is drained trough ditches and stormwater pipes that conduct flow to various watercourses, among which the Beauport River is the principal. Fifteen retention basins are located in this area of the watershed. Second, in the downstream part of the watershed (i.e., in the subwatersheds illustrated in blue and green in Figure 2), runoff is drained through combined sewer pipes. Combined sewer overflows (CSOs) can occur in this area during rainfall, as detailed in Section 2.2.2.
Figure 1. Land use in the Beauport River watershed.
Water 07 00615 g001
Figure 2. Separate (hollow) and combined (colored) subcatchments superposed with the location of the rain gauge, the river gauging station, the water quality sampling site and the combined sewer overflows (U051 and U057).
Water 07 00615 g002

2.2. Available Data

2.2.1. Fecal Coliform Concentrations

Since water-related activities in the Quebec region occur mainly during the summer period, FC concentrations are tracked in the Beauport River from May to August. Data from 2008 to 2011 were analyzed. In Quebec, quality standards for FC are 200 CFU/100 mL for bathing and 1000 CFU/100 mL for secondary contact activities [22]. Measurements of FC concentrations were provided by the Quebec City’s Environmental Services department. A total of 148 daily measurements were available for the four years analyzed. The dispersion of measurements is represented in Figure 3 in the form of boxplots. All of the concentration medians were below the 1000 CFU/100 mL standard, for secondary contact activities. However, we observed a high variability in concentrations for a given year.
Figure 3. Boxplots of fecal coliforms (FC) concentrations for summer 2008 to 2011. The dashed line represents the 200 CFU/100 mL water quality standard and the line composed of mixed dashes and dots represents the 1000 CFU/100 mL standard.
Water 07 00615 g003

2.2.2. Rainfall and Combined Sewer Overflows Observations

Table 1 presents the total rainfall from May to August for the four years analyzed, as measured by the rain gauge illustrated in Figure 2. Precipitations were recorded every 5 min. The 2009 measurements were the closest to the 1971 to 2000 precipitation average for the same months, which corresponds to 465 mm according to Environment Canada [23].
Data related to the CSOs were taken from the SOMAE database (Suivi des Ouvrages Municipaux d’Assainissement des Eaux, Monitoring of Municipal Water Drainage Structures). This program was started by the Ministère des Affaires municipales et de l’occupation du territoire (Quebec Ministry of Municipal Affairs and Land Use), with a main objective to conduct follow-ups of all CSO facilities in the province of Quebec. Four of the overflow facilities from the studied watershed are listed in SOMAE. From these four, only two overflowed during rainy periods in the monitored period, namely unit U051 and unit U057. The structure U051 tends to overflow less often than the structure U057. In fact, by applying the Schroeder’s method [24], the critical daily rainfall height causing overflow is 1.4 mm for U057 and 4.4 mm for U051. The SOMAE database lists the date and duration of each CSO. No information on CSO volume or discharge is recorded in the database. Consequently, as specified in the next section, it was necessary to estimate the overflow volumes by simulation. The number of CSOs recorded at each facility is presented in Table 1.
Table 1. Number of combined sewer overflows (CSOs) for the two combined overflow units and rainfall data for each season (from 1 May to 31 August).
YearNumber of CSOs Caused by RainfallRainfall (mm) May to AugustNumber of Rainfall Events May to August
U051U057>0.1 mm>5 mm
20082555560.06431
20093441507.86126
20101330243.25416
20111550627.46125

2.2.3. River Flow

The hydrometric gauging station on the Beauport River is located more than one kilometer upstream of the river outfall, where it is not affected by tides. Flows at this location are recorded by the Centre d’expertise hydrique du Québec (CEHQ, Quebec Water Expertise Center) every fifteen minutes and the data are made available as mean daily values. CSOs do not affect the recorded flows since the overflow structures are located downstream from the hydrometric station. Table 2 presents the maximal, minimal, median and mean monthly flow rates for years 2006 to 2010, for the May to August period.
Table 2. Historical flow rates on Beauport River (from 2006 to 2010).
Flow Rate (m3/s)MayJuneJulyAugust
Maximal2.9503.2254.5786.708
Minimal0.2170.2070.1620.119
Median0.6280.3150.3390.270
Mean0.7410.6360.6180.543

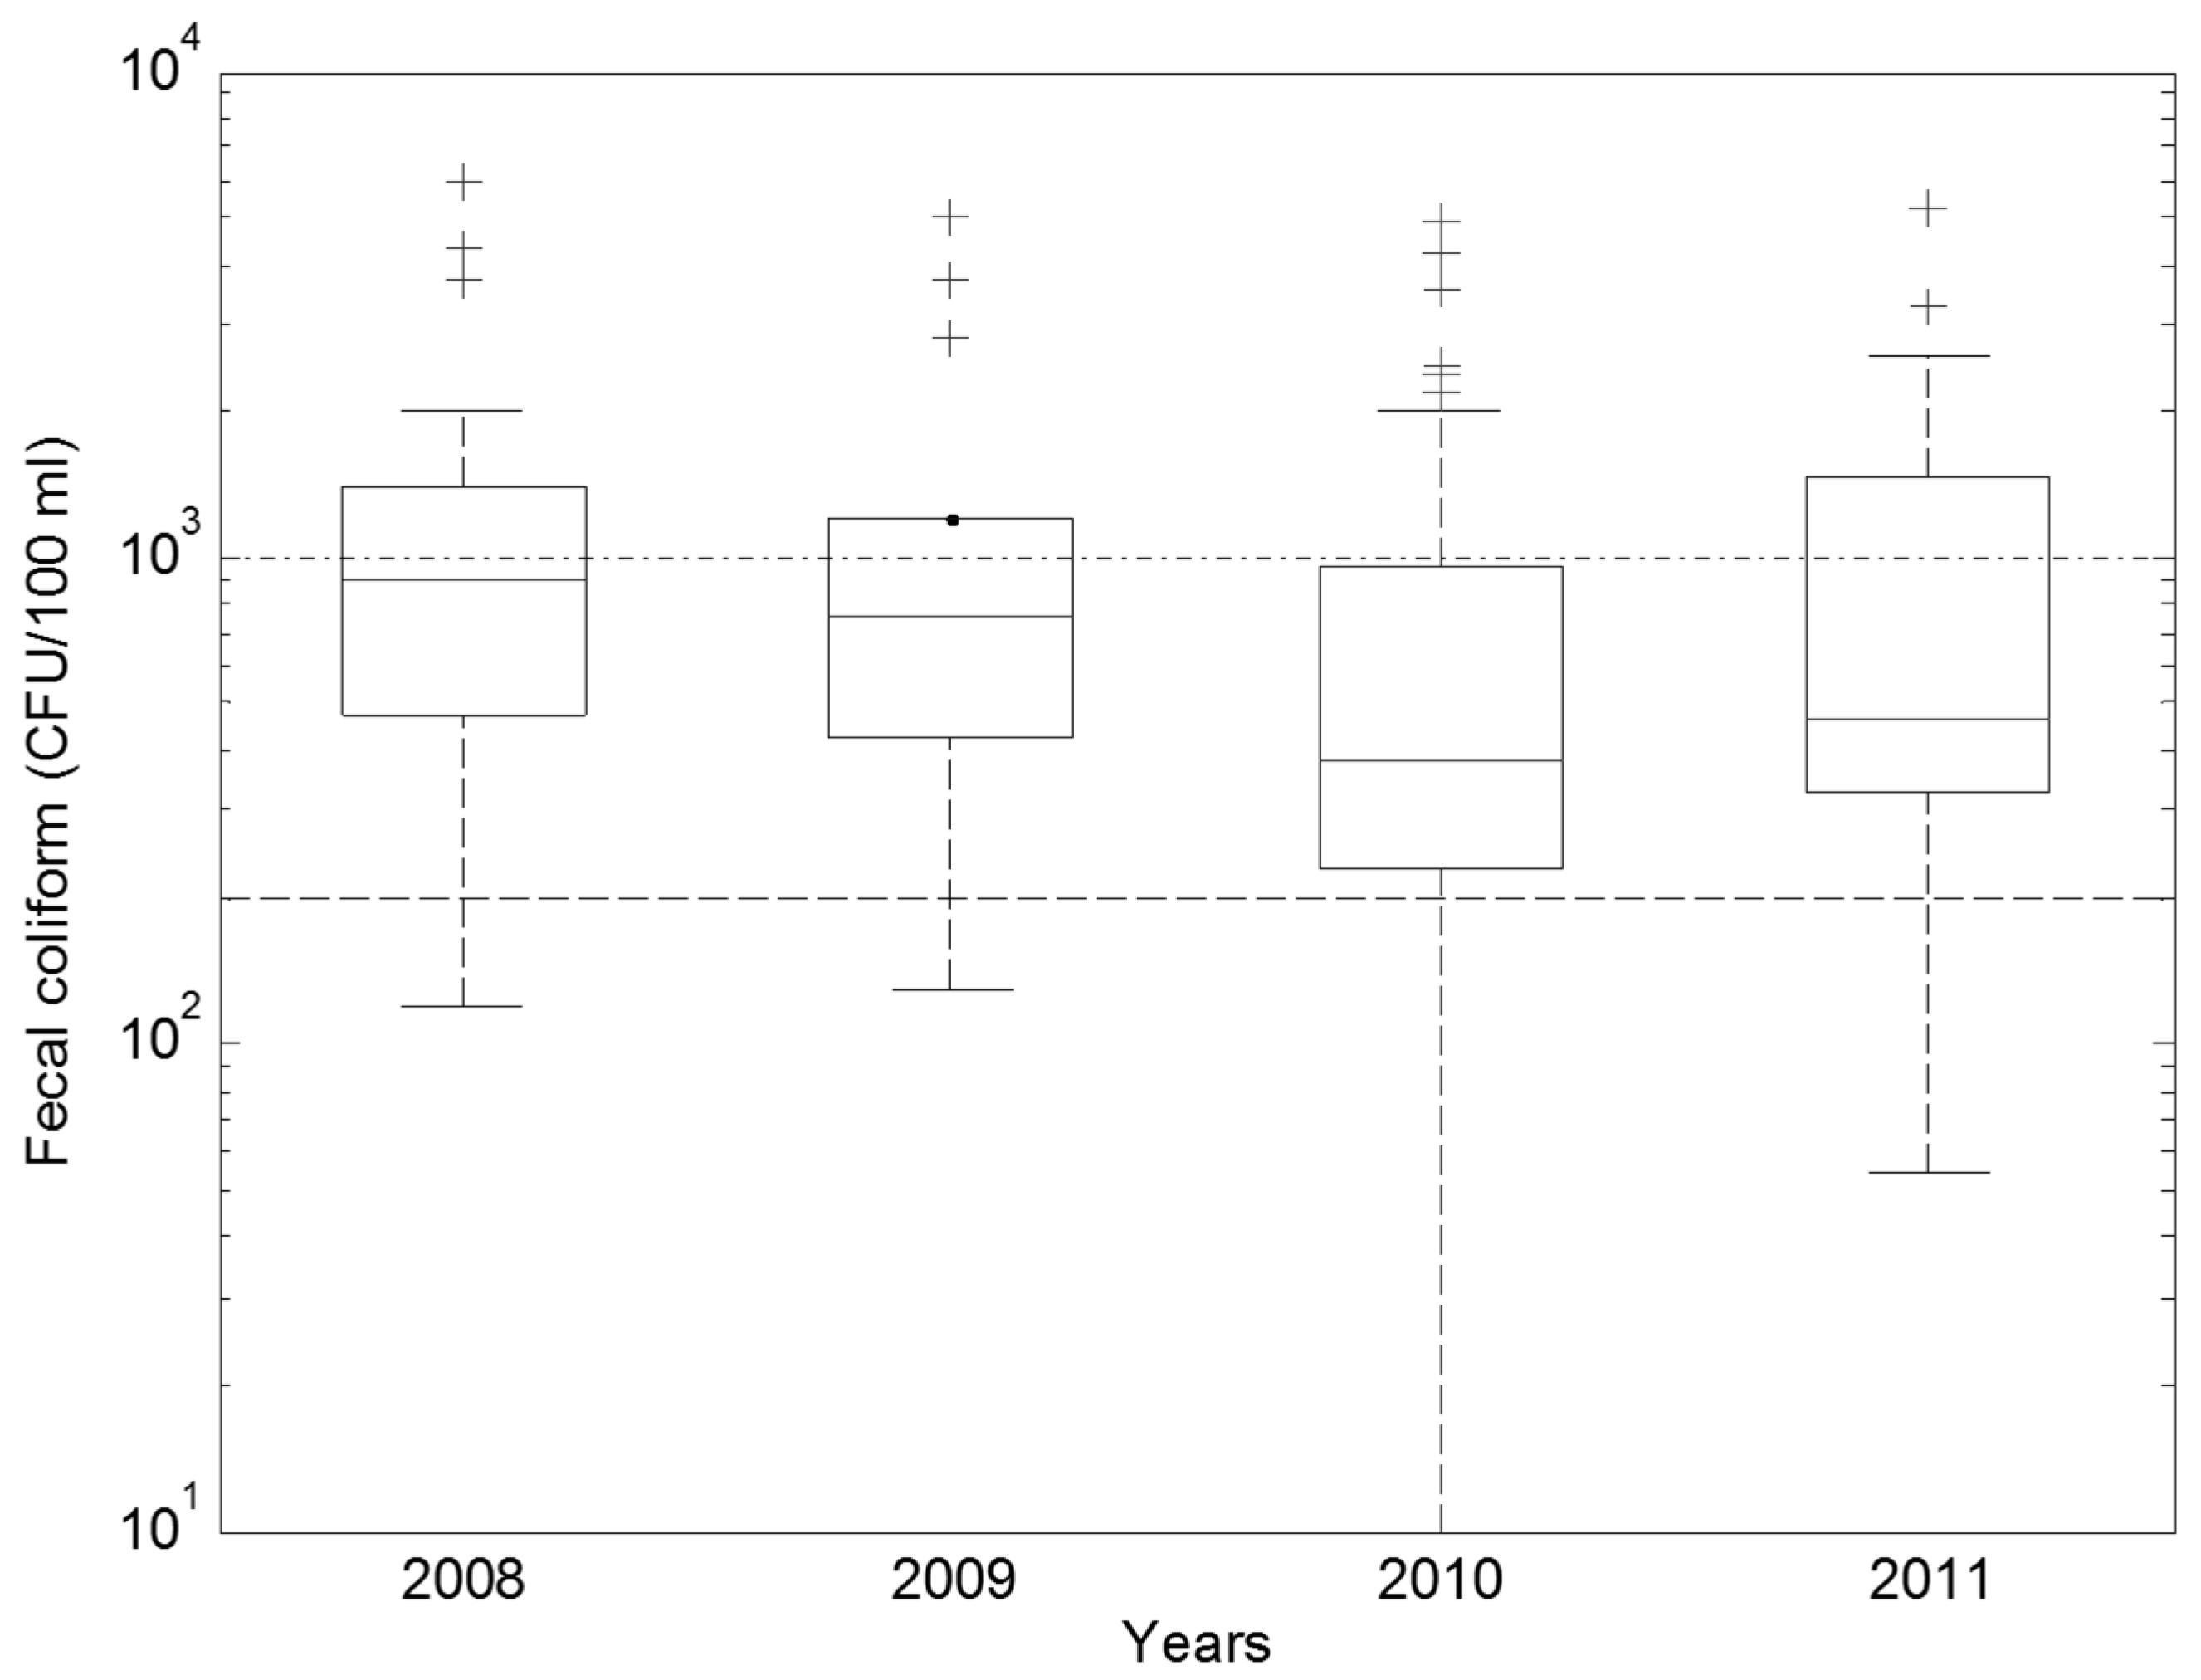
2.3. Preliminary Statistical Analysis

To verify if a relationship existed between rainfall and FC concentrations in the Beauport River watershed, concentration data were divided into groups according to the total rainfall observed on the same day (day0) as the FC measurement, the day before (day−1) and two days before (day−2). An ANOVA test was performed to compare the geometric mean (GM) of FC concentrations observed on days with rainfall and without rainfall, at day0, day−1 and day−2. Days with and without rainfall were defined using two different thresholds, which are 0.1 and 5 mm. This means that, in a first analysis, days during which less than 0.1 mm of rainfall was recorded were considered without rainfall and, in second analysis, days were considered without rainfall if less than 5 mm of rainfall was recorded.

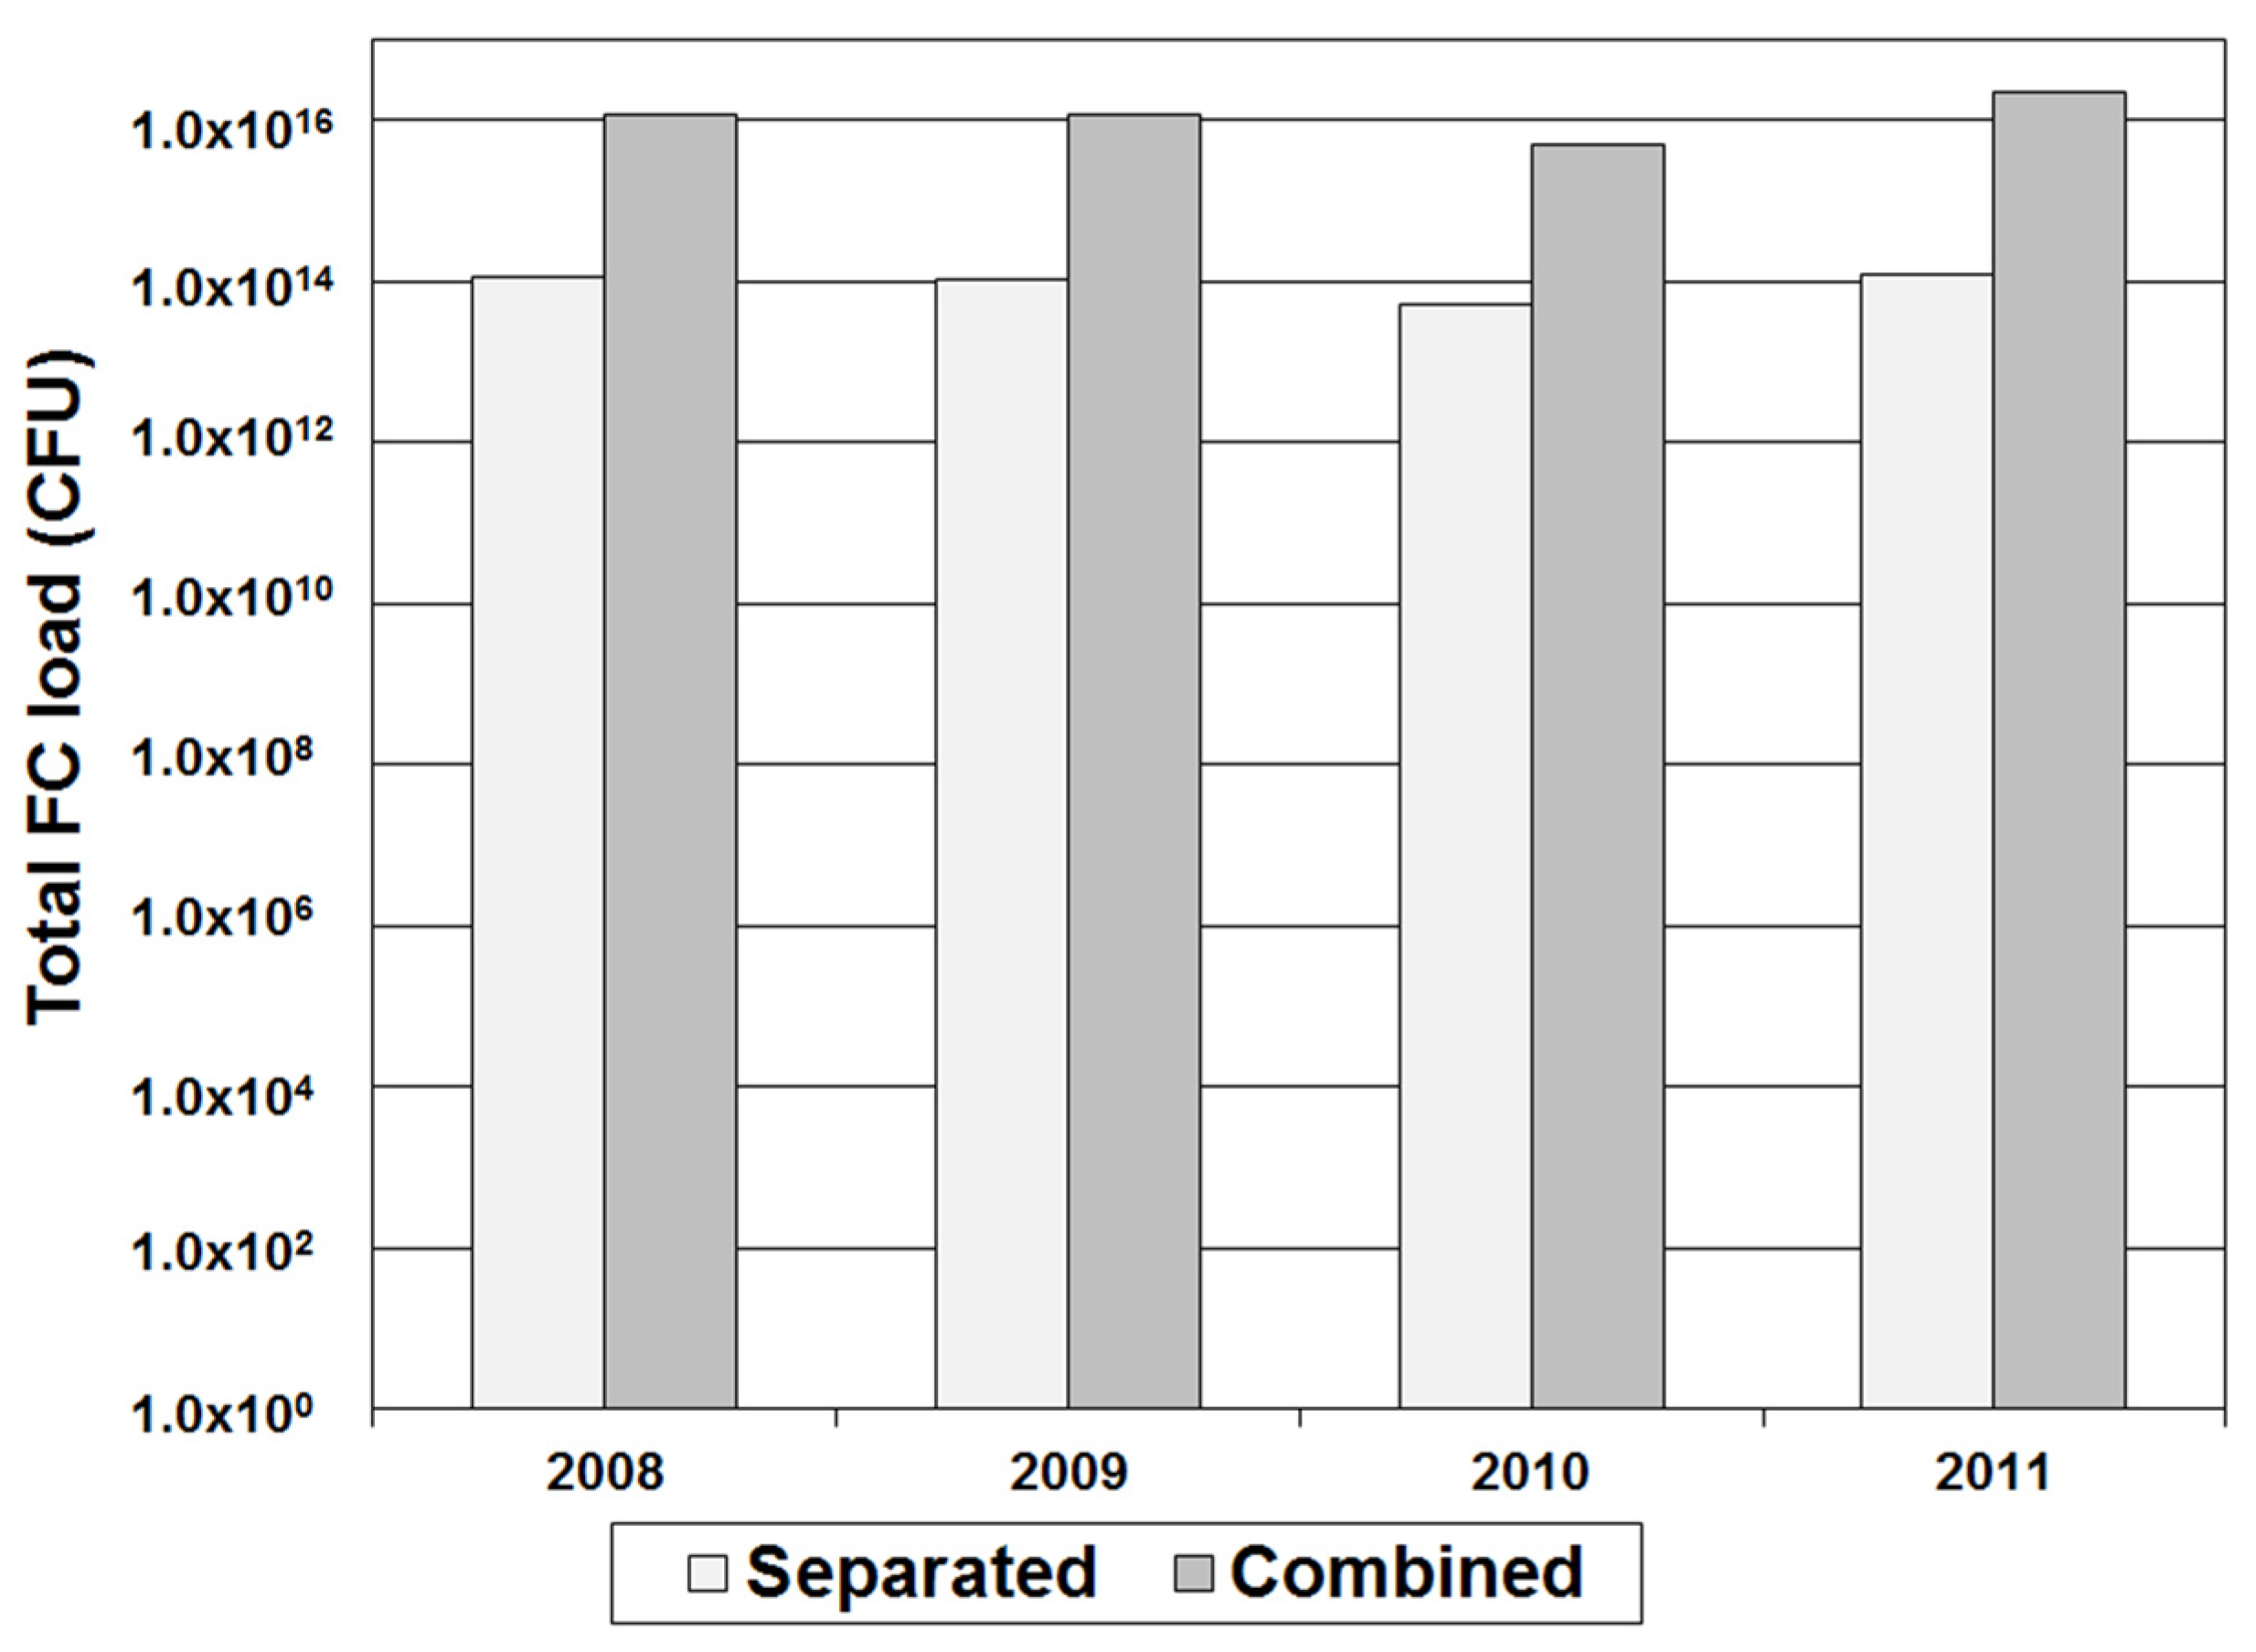
2.4. Comparison of Load Estimation Methods

FC loads coming from the Beauport River subwatersheds were computed using two different methods, namely the simple method and a method based on the simulation of hydrology and hydraulics. The first method, as stated by its name, has the advantage of being very simple to apply, but cannot be used in the area drained by a combined sewer network. Indeed, in this kind of network, a part of runoff is drained to the wastewater treatment plant, and this cannot be taken into account by the simple method. Also, as opposed to the second method, the simple method cannot be used to assess the impact of various intervention scenarios on the FC loads discharged to the Beauport River. For both methods, the fecal coliform loads were computed for the summer period, from 1 May to 31 August, for the four years under study.
The simple method (developed by Schueler [9] and also used, among others, by the Center for Watershed Protection [25]) provides and estimation of the order of magnitude of the pollutant loads produced by rainfall runoff in an urban area over a year. The total load for a given pollutant is computed using:
L = R × C × A
where: L = annual load (M); R = annual total runoff (L); C = mean concentration (M/L3); A = drained area (L2).
In the work presented here, the annual runoff (R) was assessed with:
R = P × R C
where: P = annual precipitation (L); RC = runoff coefficient.
The RC values vary according to land use. For the Beauport River watershed, the values proposed by Brière [26] were used (see Table 3).
Table 3. Runoff coefficients applied to the Beauport River watershed (from [26]).
Land UseRunoff Coefficient (RC)
Residential0.40
Commercial0.70
Industrial0.75
Undeveloped0.10
Agriculture0.15
As for the second method, the water volumes discharged to the river, from the separated and combined sewer networks, were computed using the USEPA SWMM model [15]. For both methods, loads were then estimated by multiplying the discharged water volumes by the event mean concentrations (EMC) presented in Table 4. For the stormwater outfalls, the selected EMCs are the median values proposed in [27], except for the agricultural land use. For this land use as well as for the CSOs, the EMCs are the mean order of magnitudes issued from a broad literature review, including [27,28,29,30,31,32,33].
Table 4. Event Mean Concentrations (EMC) values for the different land uses.
SourceEMC (CFU/100 mL)
StormwaterResidential7,750
Commercial4,500
Industrial2,500
Undeveloped3,100
Agriculture10,000
CSOs1,000,000
SWMM is a dynamic rainfall-runoff simulation model used for single events or long-term continuous simulation of runoff quantity and quality, primarily from urban areas. For the purpose of this study, the separate stormwater and combined sewer systems were modeled distinctly. Both of these SWMM models were previously calibrated and validated by the Quebec City’s Engineering Services department [34,35]. Some minor adjustments have also been brought to the models by the authors. More details are given in Section 3.2.
Both SWMM models solve the St-Venant’s equations by dynamic wave routing and use Horton’s formula for infiltration. The different parameters of the models, established by the Quebec City’s Engineering Services department [34,35], are listed in Table 5 and Table 6.
Table 5. Characteristics of the subcatchments in the SWMM models.
Physical CharacteristicsStormwater ModelCombined ModelUnit
Total area25.53.2km²
Number of subcatchments91452
Average slope of subcatchments2.02.0%
Average imperviousness3176%
Conduit length9123km
Beauport River length21.4km
Table 6. Parameters of the SWMM models.
Infiltration Model (Horton)
Maximal infiltration rate75–150 mm/h
Minimal infiltration rate2–15 mm/h
Infiltration rate decay0.001–4 h−1
Manning Roughness Coefficient
Pervious surfaces0.25–0.28
Impervious surfaces0.013–0.016
Pipes0.013–0.3

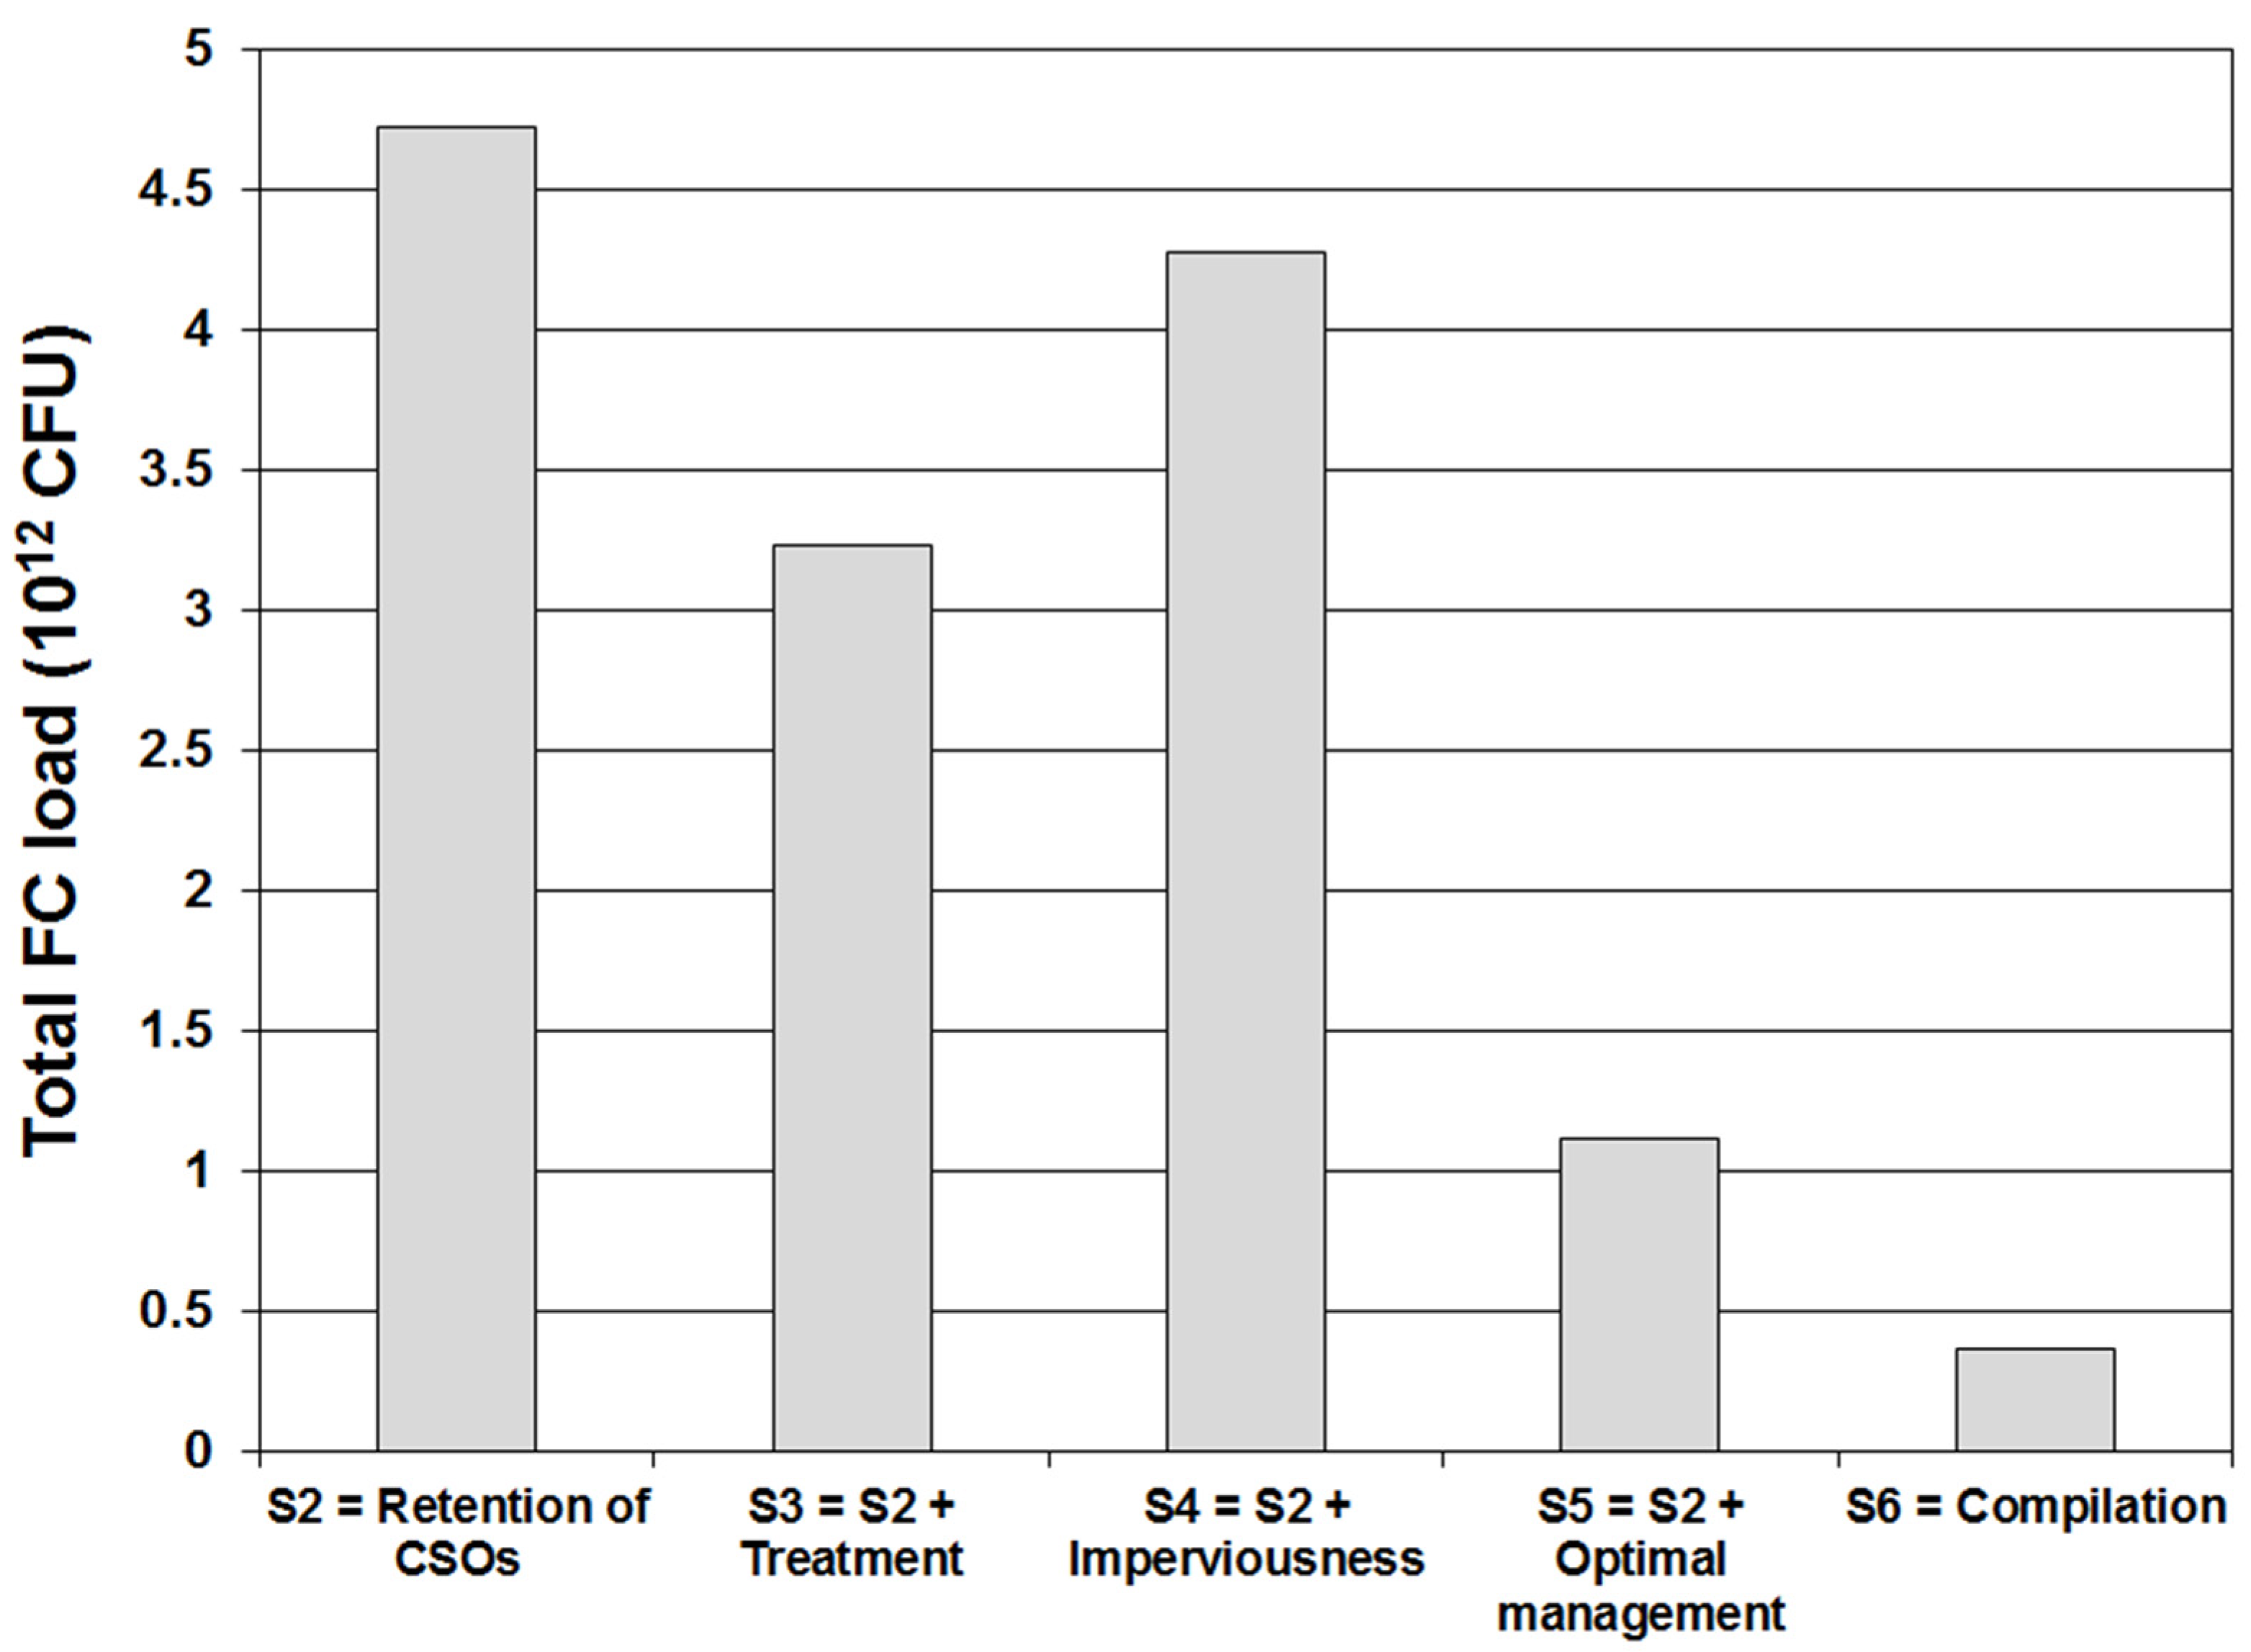
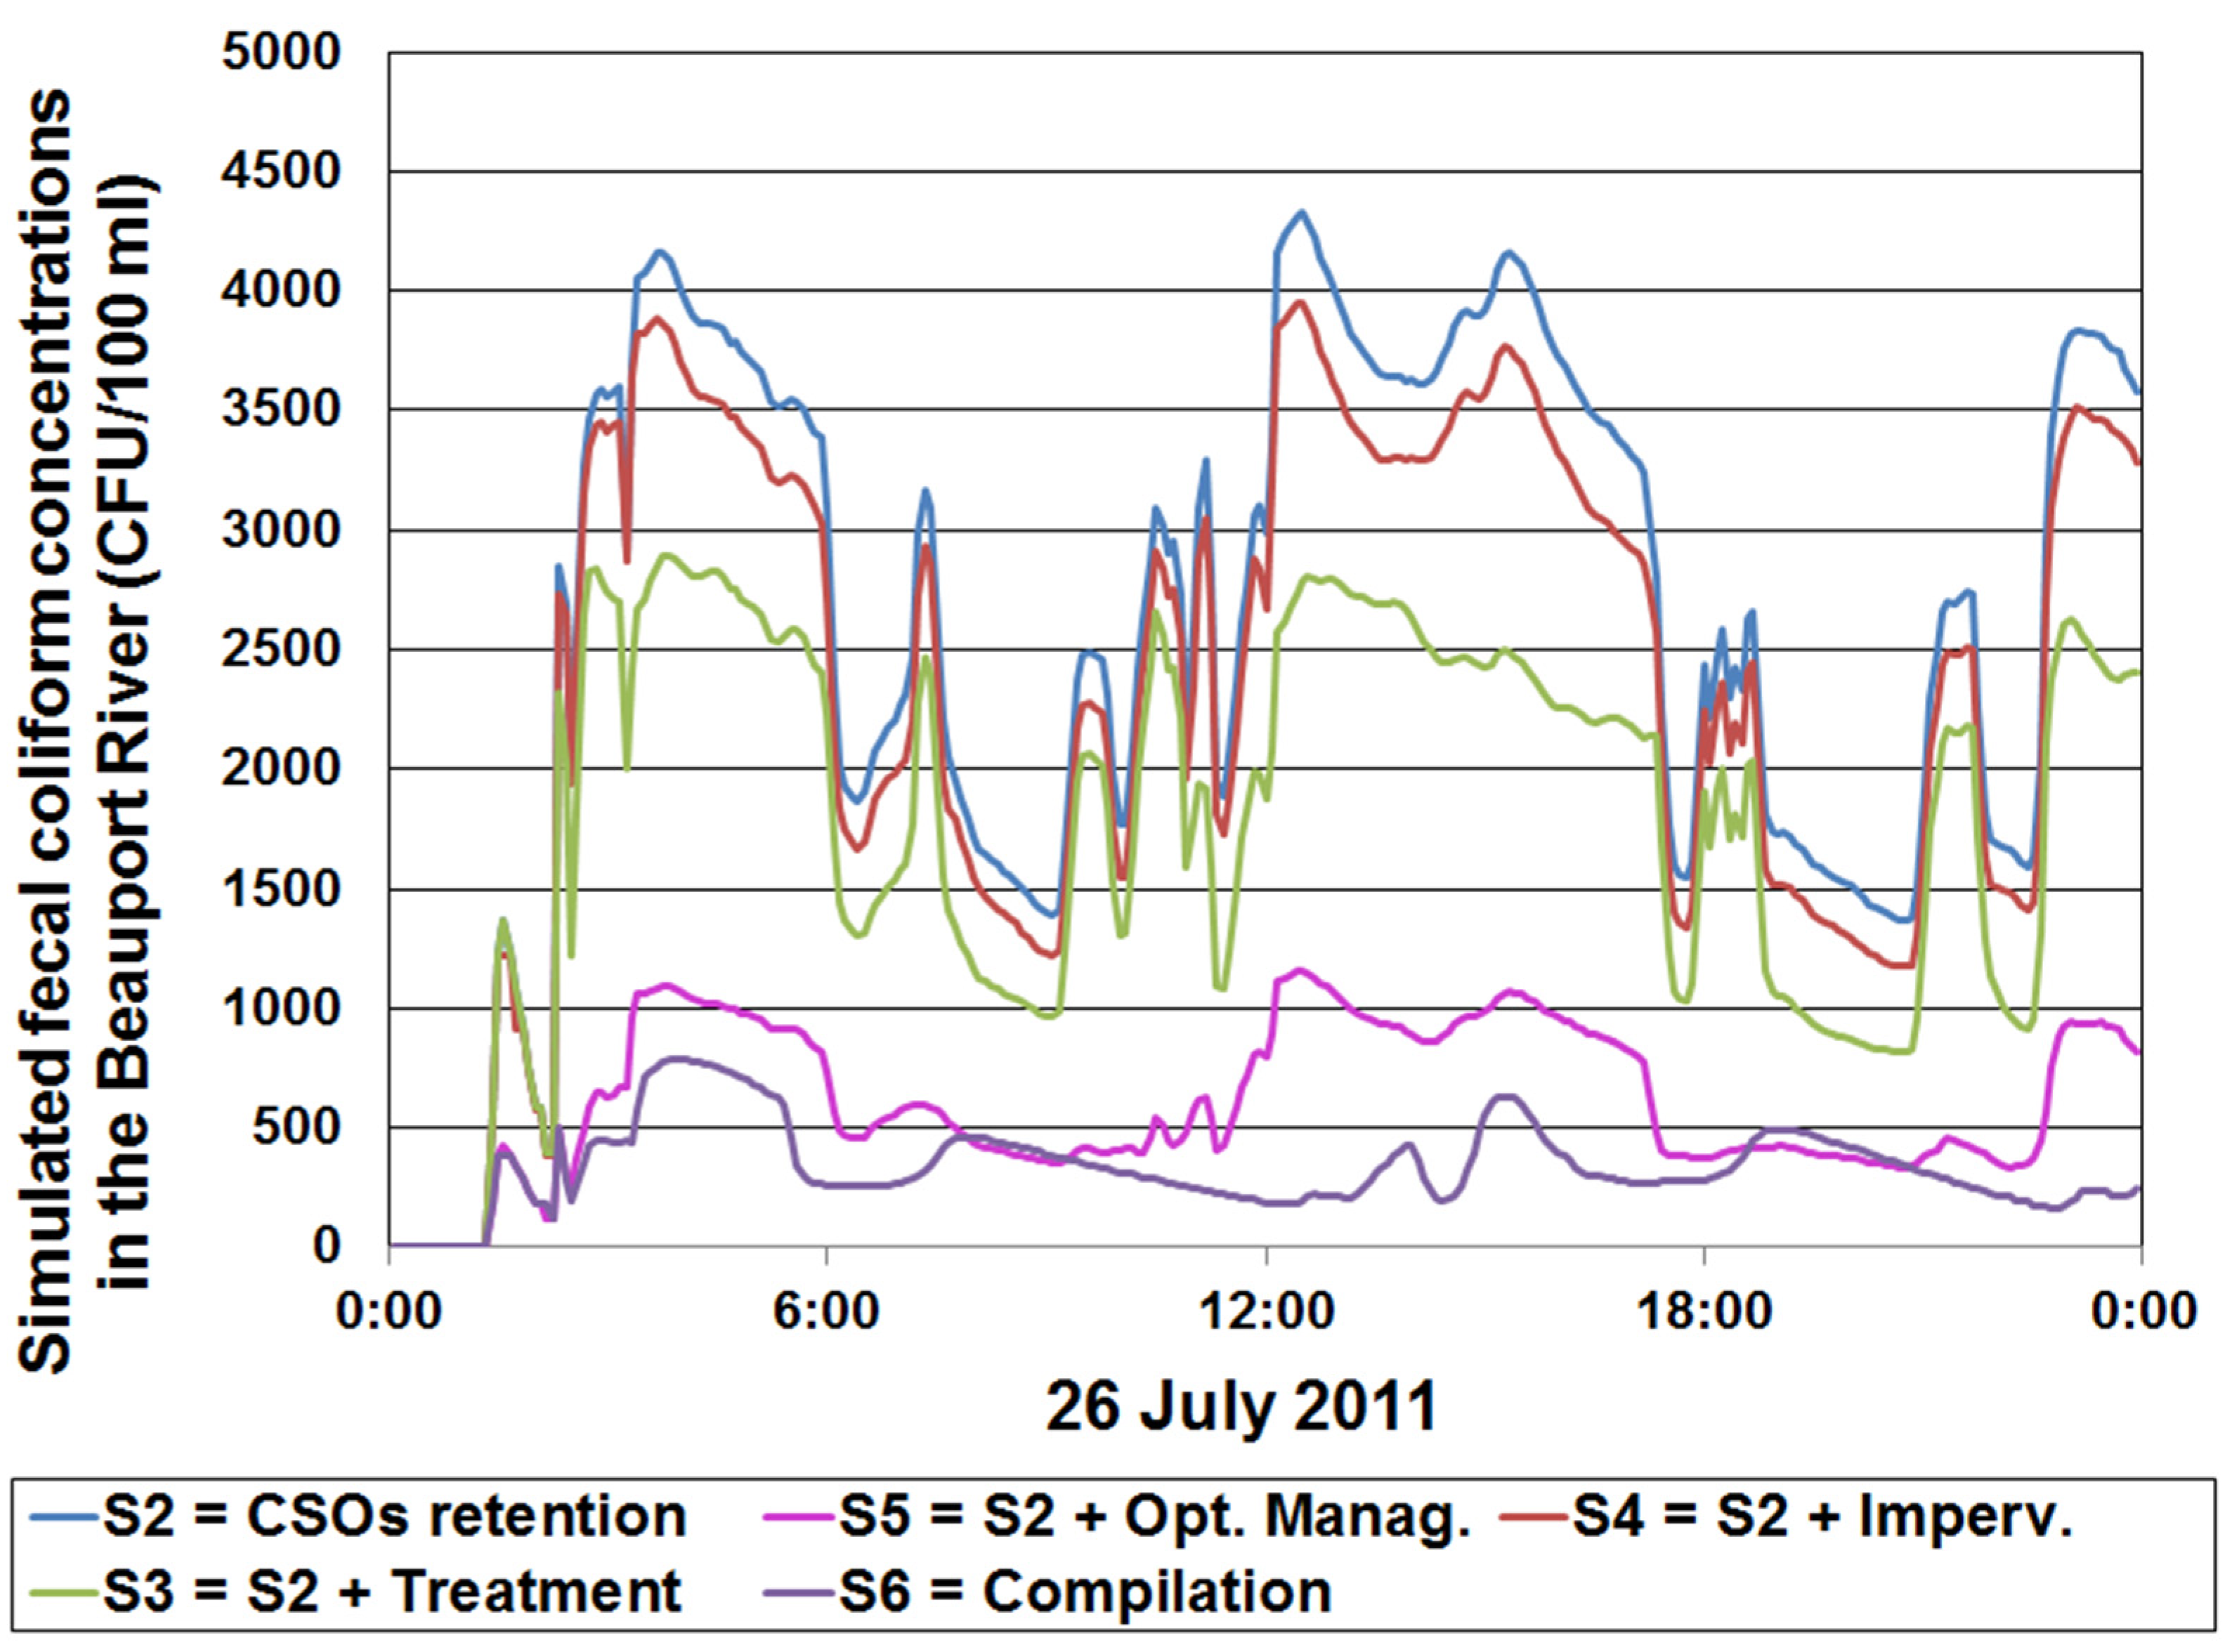
2.5. Analysis of Scenarios

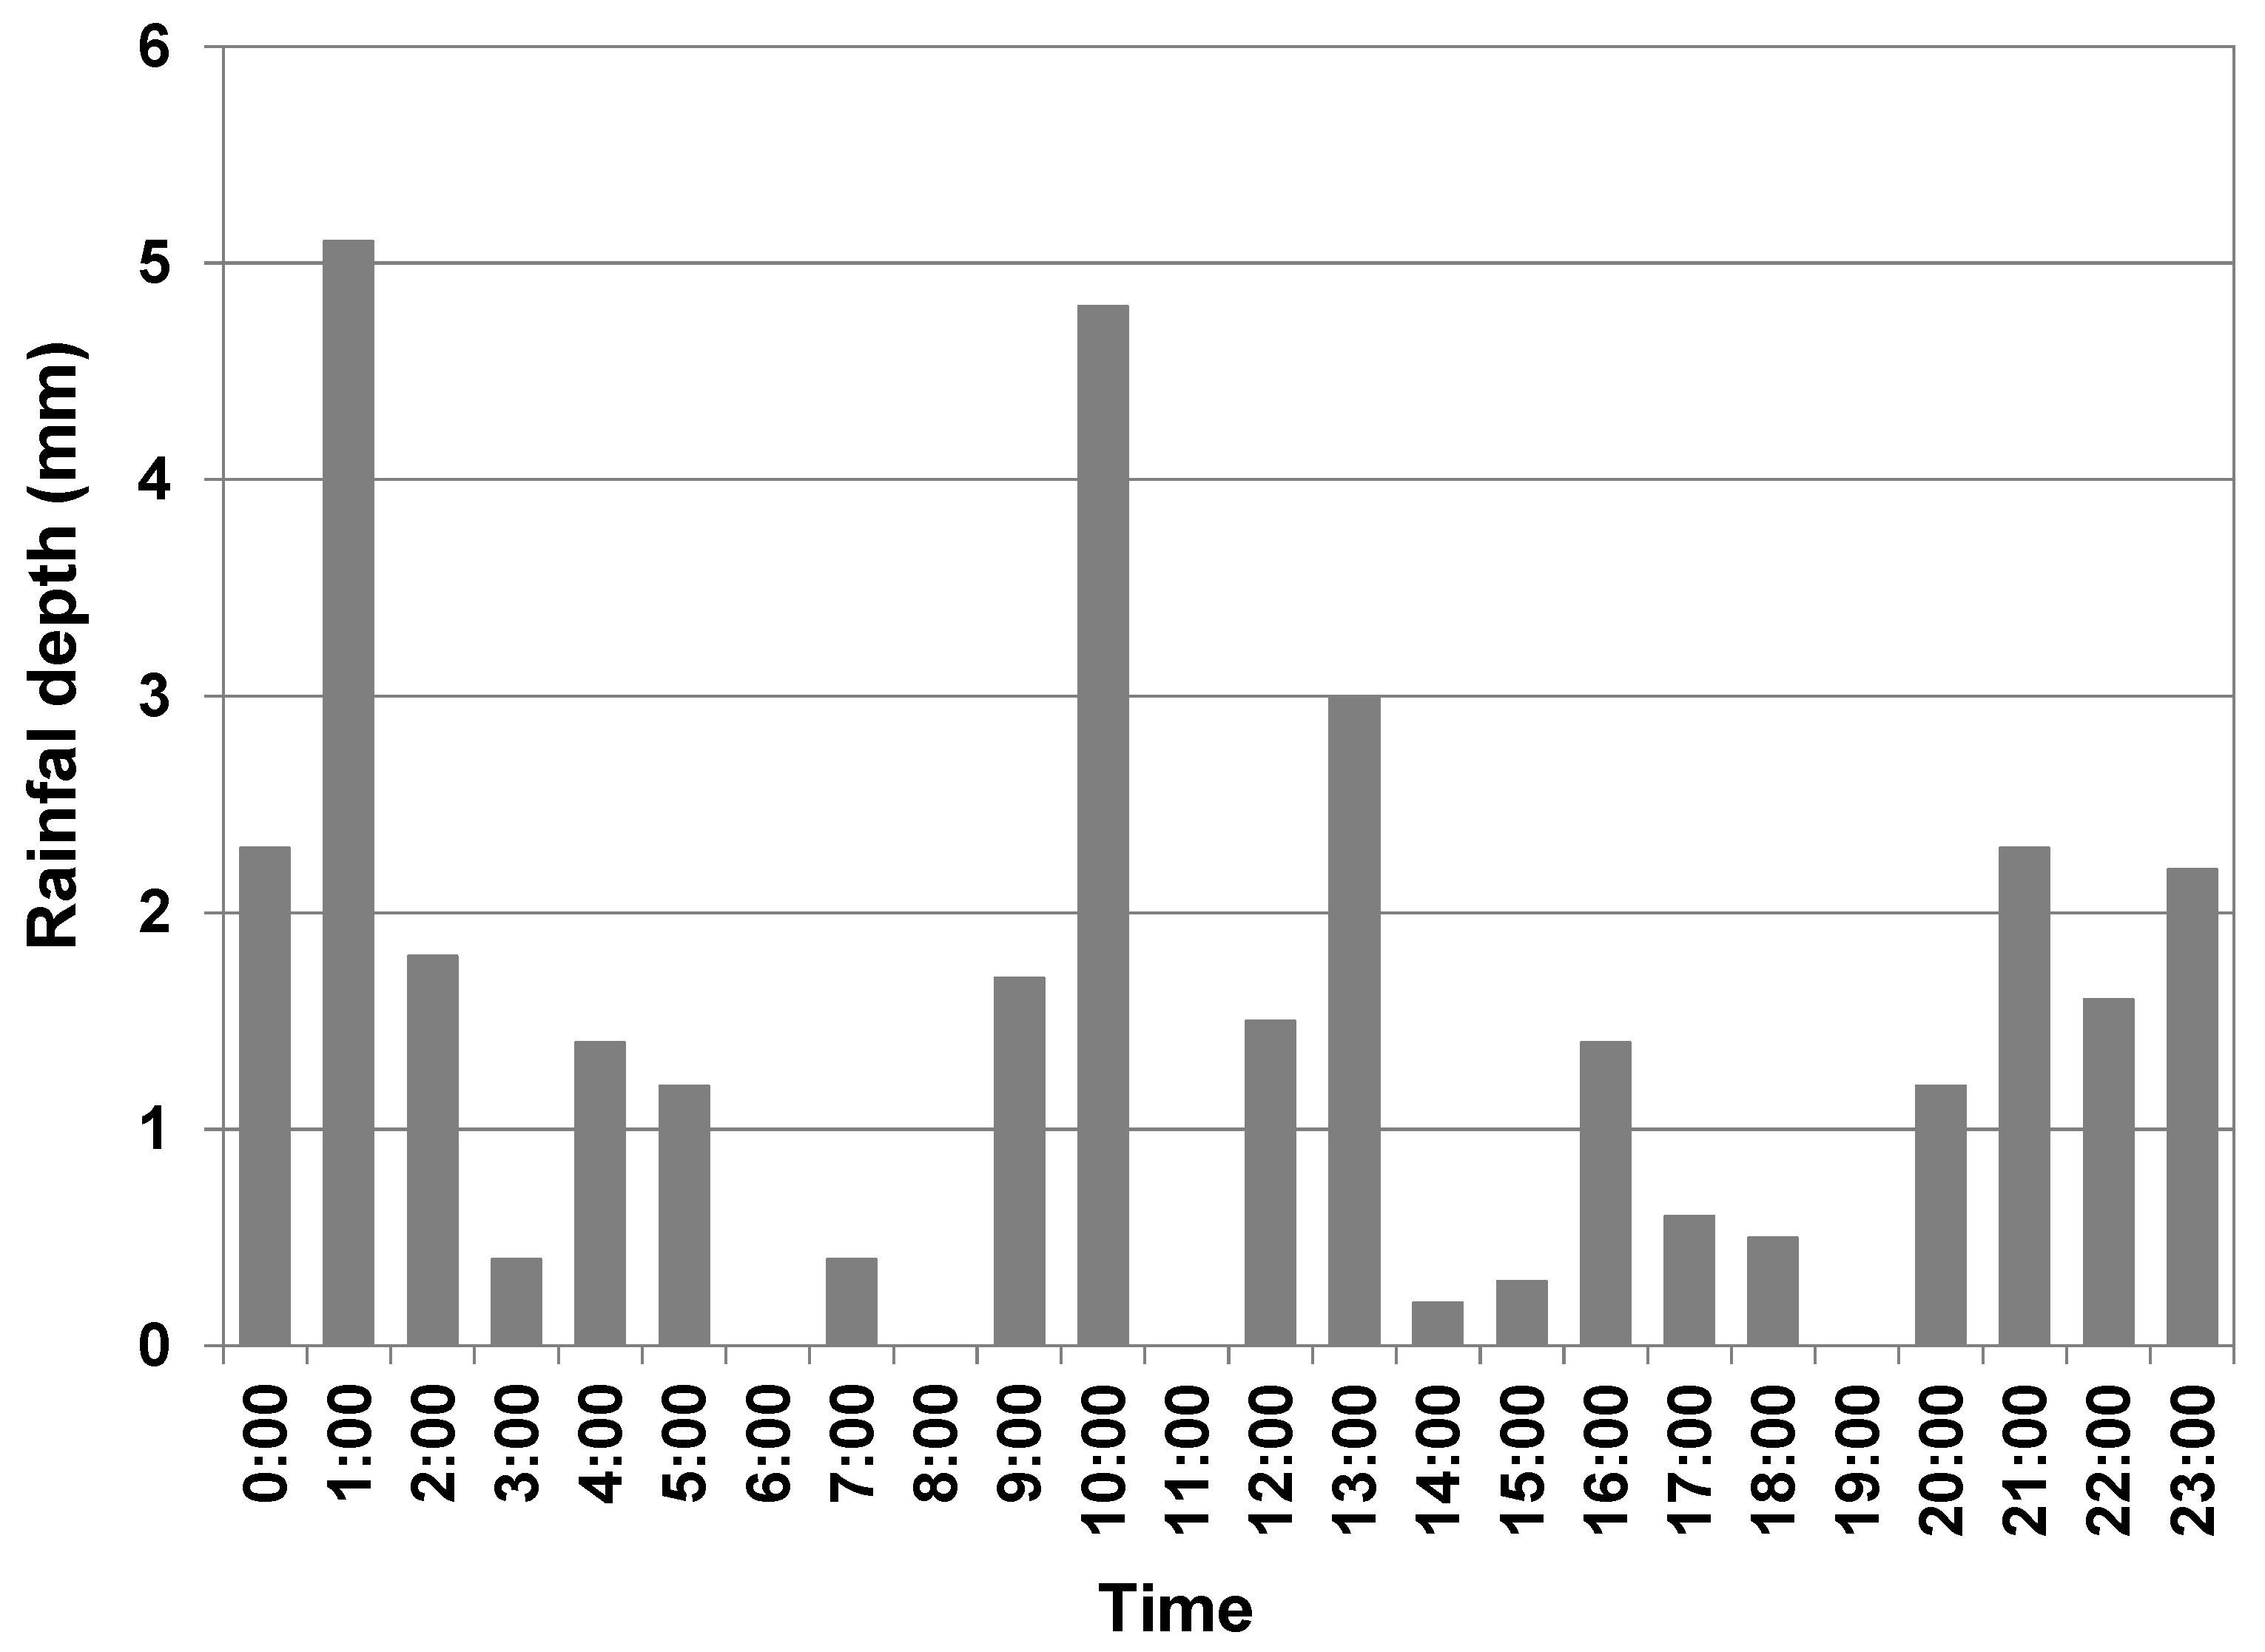
The objective of this analysis was to identify more efficient intervention methods to reduce the FC loads discharged to the Beauport River during and after rainfall events. To do so, the discharged FC loads were simulated according to six different scenarios, described below, for the 26 July 2011 rainfall event (from 0:00 to 23:55). Simulation of one day instead of a whole season allowed for a more precise analysis of the impacts of each scenario on the discharged FC loads, and the FC concentrations in the Beauport River. On 26 July 2011, a total of 33.9 mm of rainfall was recorded, with a maximal 5-min intensity of 25.2 mm/h (see hyetograph in Figure 4). This event was chosen as it was the 21st in importance, in terms of total runoff as simulated with SWMM, for the 2008 to 2011 summers. This means that there were, on average, five events each summer that provided more FC loads to the Beauport River than the 26 July 2011 event.
Figure 4. Recorded hyetograph on 26 July 2011.
Water 07 00615 g004
To assess the FC concentrations in the Beauport River, a 0.36 m3/s base flow was added to the flow simulated by the SWMM stormwater model, since this model was elaborated, calibrated and validated to properly simulate urban drainage only; consequently, it does not integrate groundwater flow nor headwater lakes, that provide water to the Beauport River during the periods without rain. The selected value of 0.36 m3/s corresponds to the mean daily flow in the river the day before the simulated event, namely 25 July 2011, a day during which no rainfall occurred.
The six scenarios that were simulated are the following:
(1)
Reference scenario (S1): Simulation of the watershed and drainage networks as they were in 2011.
(2)
Retention scenario (S2): Similar to scenario 1, but with the addition of CSO retention tanks with sufficient capacities to contain all CSOs that occurred on 26 July 2011 (1935 m3 for unit U051 and 2772 m3 for unit U057, as simulated with SWMM).
(3)
Primary treatment at some stormwater outfalls (S3): Similar to scenario 2, but with a proper retention time in the 15 stormwater retention basins already in place in the watershed, in order to achieve a 60% FC removal rate.
(4)
Reduction of imperviousness (S4): Similar to scenario 2, but with a 1% decrease in the percentage of imperviousness for each subwatershed (meaning that the imperviousness of each subwatershed was multiplied by 0.99).
(5)
Optimal management of stormwater (S5): Similar to scenario 2, but with a reduction in the EMC values for stormwater outfalls (respectively, 2500, 200, 500, 1.5 and 4.5 CFU/100 mL for the residential, commercial, industrial, agricultural and undeveloped land uses). These values are the minimal values observed by Wong ([36], cited in [27]). They correspond to EMCs that could be obtained with a very rigorous management of the urban surfaces and stormwater network, including correction of sewer cross connections, frequent road sweeping, regular cleaning of stormwater pipes, increase and promotion of infiltration, etc.
(6)
Compilation (S6): Compilation of all scenarios presented above.

3. Results and Discussion

3.1. Preliminary Statistical Analysis

Results of the ANOVA tests comparing the FC concentrations in the Beauport River for days with and without rainfall (for the day of FC measurement, day0, the day before the measurement, day−1, or two days before the measurement, day−2) are presented in Table 7. The ANOVA test confirmed that the geometric mean (GM) of FC concentrations observed on days with rainfall was significantly different from those observed during days without rainfall (day0). Also, the GM of FC concentrations were different between days with and without rain the day before (day−1). However, this difference was not observed for day−2.
Table 7. Geometric mean of FC concentrations as of function of rainfall height for day0, day−1 and day−2 and results of the ANOVA test (the given p-values are valid for both thresholds, i.e., > 0.1 and > 5 mm).
Rainfall DayGeometric Mean [FC] (CFU/100 mL)Geometric Mean [FC] (CFU/100 mL)ANOVA (p-Value)
Daily RainfallDaily Rainfall
<0.1 mm≥0.1 mm<5 mm≥5 mm
day04457815021030<0.001
day−14367674931061<0.05
day−2539640432771>0.05
These analyses demonstrate the influence of rainfall on the FC concentrations in the Beauport River (influence that is still noticeable up to one day after the rainfall occurred). This demonstrates that runoff has a major influence on FC concentrations in the river and supports the comparison of FC loads for different scenarios using a hydrological/hydraulic model conceived for the simulation of the rainfall-runoff processes (such as SWMM in our case).

3.2. Calibration of the SWMM Models

As stated previously, the SWMM models were previously calibrated by the Quebec City’s Engineering Services department and afterwards slightly modified by the authors. Some partial results are presented here; more details can be found in [34,35,37].

3.2.1. Calibration of the Model for the Separate Stormwater System

To calibrate this model, flow rates were measured at four points in the separate sewer system and at two points in the river, from 17 August to 31 October 2009. Data from the CEHQ river gauging station (shown in Figure 2) were also used for calibration and validation of the model. Four rainfall events were selected to calibrate the model. Figure 5 shows an example of calibration results for a measuring point located in the separate sewer system.
Figure 5. Example of calibration results at the Broqueville measuring point (black line = measured flow rate; red dashed line = simulated flow rate) (taken from [35]).
Water 07 00615 g005
Since the SWMM model was conceived, calibrated and validated specifically for the modeling of urban runoff drainage, a base flow was added in the river by the authors in order to take into account the contribution of groundwater flow and headwater lakes. River flows simulated by the model were then compared to river flows measured at the CEHQ river gauging station using the Nash-Sutcliffe coefficient [38]:
N S = 1 i = 1 n ( O i S i ) 2 i = 1 n ( O i O ¯ ) 2
where: Oi = observation at time step i; Si = simulated value at time step i; O ¯ = mean value of all observations; n = total number of time steps (NS may vary from −∞ to 1 and is considered better when it gets closer to 1). Results of this comparison are summarized in Table 8.
Table 8. Nash-Sutcliff coefficient for the separate stormwater system at the CEHQ gauging station for the 1 May to 30 September period.
YearNash‑Sutcliffe Coefficient
20080.63
20090.74
20100.89
20110.68

3.2.2. Calibration of the Model for the Combined Sewer System

As detailed in [34], the combined system model was calibrated based on flow rate measurement at 19 points in the sewer system from 29 May to 27 August 2009. Figure 6 shows an example of validation results.
Figure 6. Example of validation results at the Giffard measuring point (red line = measured flow rate; green line = simulated flow rate) (taken from [34]).
Water 07 00615 g006
The average absolute difference between simulated and observed flow at the 19 measurement points during the summer of 2009 was 18%. However, for the purpose of the analysis presented here, the model output that should be better calibrated is the total volume of CSOs that is discharged to the river. Consequently, some water level thresholds triggering overflows in the model were adjusted by the authors in order to match as closely as possible the number of simulated CSOs with the number of observed CSOs (recall that the volumes of CSOs were not recorded). Results are presented in Table 9.
Table 9. Comparison of the number of simulated CSOs with the number of observed CSOs for the 1 May to 30 September period.
YearNumber of CSOs
U051U057
SimulatedObservedSimulatedObserved
200830286462
200926335550
201017154847
20113817 *6563
Note: * Errors are suspected in the number of observed overflows for the summer of 2011 based on a comparison with observed rainfall (see Table 1).

3.3. Comparison of Load Estimation Methods

The FC loads discharged to the Beauport River from the subwatersheds drained by the combined and separated sewer networks, as computed with the hydrologic/hydraulic simulation model, are illustrated in Figure 7. In this figure, it can be seen that the estimated contributions of the separate stormwater systems varied between 6.0 × 10¹³ and close to 1.6 × 10¹⁴ CFU per season. The contribution of the combined sewer system was higher, and varied from 5.1 × 10¹⁵ to 2.3 × 10¹⁶ CFU per season. From 2008 to 2011, the FC contribution from CSOs was as much as 100 times greater than the contribution from the stormwater drainage system, even though the total area drained by the combined sewer network (3.2 km2) is much smaller than that covered by the separate stormwater drainage system (25.5 km2). This means that priority intervention measures should be directed to the reduction of CSOs.
Figure 7. Estimated FC loads from the separate stormwater and combined sewer systems, for the May to August period.
Water 07 00615 g007
As stated before, the Schueler’s simple method [9] cannot be used in areas drained by a combined sewer network. Consequently, the loads evaluated by the two evaluation methods were compared only for the most upstream subwatersheds (illustrated in white in Figure 2 and covering a total area of 25.5 km²). Results of this comparison are given in Table 10.
Table 10. FC loads estimated by two methods for the 1 May to 31 August period.
Evaluation MethodLoads (CFU/Season)
2008200920102011
Simple method2.95 × 10142.67 × 10141.28 × 10143.42 × 1014
Hydrological/hydraulic model (SWMM)1.14 × 10141.07 × 10145.05 × 10131.26 × 1014
Results in the previous table show that the FC loads estimated by the two methods are of the same order of magnitude. The simple method overestimates the loads by a factor of about 2.5 as compared with the hydrological/hydraulic modeling method (meaning that the runoff was overestimated in the simple method since the same EMCs were used with both methods). This demonstrates that the simple method is appropriate for a rapid estimation of the FC loads discharged by an urban drainage stormwater network. Indeed, one should recall that FC concentrations in urban waters commonly vary by many orders of magnitudes, and thus the computation of the same order of magnitude with the two methods is satisfactory, especially since the simple method is very easy and rapid to apply. However, the simple method cannot be used to evaluate intervention scenarios, as was done with the hydrological/hydraulic modeling method in the next section.

3.4. Analysis of Scenarios

Results presented in the previous section show that the FC discharged to the Beauport River mostly come from the combined sewer network (CSOs), but that the separate drainage network also contributes a significant quantity of FC to the river. The first step, to improve the water quality of the Beauport River to a level acceptable for recreational activities, should be the construction of retention tanks to reduce CSOs. However, this change may not be sufficient to reduce the FC concentrations below 1000 FCU/100 mL in the Beauport River during and after rainfall events. For this reason various stormwater management scenarios should be considered.
Figure 8 provides a visual comparison of the simulated FC loads discharged to the Beauport River on 26 July 2011 for scenarios S2 to S6. The contribution of scenario S1, not shown in Figure 8, is 5.18 × 10¹³ CFU (51.8 × 10¹² CFU).
In decreasing order of total FC loads discharged to the river, the scenarios are ranked as follows: (1) The status quo (S1); (2) The retention of CSOs alone (S2); (3) the reduction in imperviousness (S4); (4) The primary treatment at some stormwater outfalls (S3); (5) The optimal management of stormwater (S5); and finally, (6) the compilation of all these intervention methods (S6). The last scenario reduced the total FC loads discharged to the river by a factor of 100 as compared with the reference scenario (S1) and by a factor of 10 for the reference scenario with the construction of retention tanks for CSOs (S2).
The simulated impacts of scenarios S2 to S6 on the FC concentrations in the Beauport River are illustrated in Figure 9. This figure shows that the compilation of all intervention methods (S6) is the only scenario to have reduced the FC concentrations below 1000 FCU/100 mL for 26 July 2011. The implementation of optimal measures for the management of stormwater combined with the construction of CSO retention tanks (S5) also reduced concentrations to near the 1000 FCU/100 mL objective.
Figure 8. Comparison of the FC loads discharged to the Beauport River on 26 July 2011 according to various scenarios.
Water 07 00615 g008
Figure 9. Simulation of water quality in the Beauport River on 26 July 2011 according to various scenarios.
Water 07 00615 g009
These results demonstrate that although the construction of retention tanks for CSOs would be a major improvement, it alone would not be sufficient to guarantee suitable FC concentrations in the Beauport River during and after rainfall events. Many different best management practices should be combined and implemented in the watershed in order to reduce FC concentrations, as evidenced by the reduction provided by scenario S6.
It is important to note that the estimated FC loads and concentrations for scenario S3 are probably optimistic, since a 60% removal rate is assumed for FC in the stormwater retention basins, and this removal rate has been found to be null and even negative for FC in dry stormwater retention basins by many authors (e.g., [39]). Also, since EMCs may vary by many orders of magnitude for the same type of land use, the loads and concentrations that are estimated in this paper are subject to a high level of uncertainty and should be used only as a basis for comparisons between the various scenarios.

4. Conclusions

A three-step method for the identification of the main sources of fecal coliforms (FC) in urban waters and for the analysis of remedial actions was proposed. This method is based on the statistical analysis of the relationship between rainfall and FC concentrations in urban rivers, on the simulation of hydrology and hydraulics and on scenario analysis. The proposed method was applied, as an example, to the Beauport River watershed in Canada. Stormwater runoff in this watershed is drained by a separate sewer system in the upstream region and by a combined sewer system downstream. From this application we determined:
(1)
In this watershed, there is a significant statistical relationship between the FC concentrations in the river and the amount of rainfall observed for the same day of the FC measurement and for the day before.
(2)
Application of the Schueler’s simple method [9] to the upstream part of the watershed led to seasonal FC loads of the same order of magnitude as those computed with a hydrological/hydraulic model combined with event mean concentrations (EMC).
(3)
Combined sewer overflows (CSOs) are the main sources of discharged FC to the river.
(4)
If retention tanks were built to contain CSOs on the watershed, FC from stormwater runoff would still impair recreational activities in the Beauport River.
(5)
According to the scenario analysis, the major improvement that should be applied in the watershed to reduce FC concentrations in the Beauport River is the construction of retention tanks to contain CSOs (as planned by the City of Quebec).
(6)
Optimal management of stormwater runoff, in order to reduce EMC at stormwater outfalls (e.g., correction of sewer cross connections, frequent road sweeping, regular cleaning of stormwater pipes, etc.) would provide the highest reduction in FC loads discharged to the river among the analyzed scenarios (including reduction of imperviousness and primary treatment at some stormwater outfalls). However, various intervention measures should be combined in order to reduce FC concentrations to a level acceptable for recreational activities in the Beauport River during and after rainfall events.
These conclusions were obtained using simulation models to compute FC loads and concentrations in the watershed. An important limit of these evaluations is that no FC concentrations were available in the Beauport River watershed other than in the river itself, in its downstream region. Consequently, EMC taken from the literature were used. Since EMC in urban runoff can vary by many orders of magnitude for the same type of land use, high uncertainties are linked to the FC loads and concentrations that were computed. Despite these uncertainties, main FC sources in the watershed could be identified, and the efficiency of various intervention measures could be compared. Installation of one or more additional monitoring stations in the river and at some stormwater outfalls would provide more accurate EMC and better estimates of the contribution of FC from stormwater runoff. The three step method proposed here could be applied with water quality components other than FC, provided that they are present in stormwater runoff and/or CSOs, and that the time of concentration of the watershed is significantly lower than their persistence in urban waters.

Acknowledgments

This research was funded by the City of Quebec. The authors greatly acknowledge the support of this organization and also thank the City of Quebec for providing the raw data and the SWMM models used in this study.

Author Contributions

Sophie Duchesne and Amélie Thériault conceived and designed the methodology; Amélie Thériault performed the calculations and models simulations; Amélie Thériault and Sophie Duchesne analyzed the data; Amélie Thériault produced most of the figures and tables; Amélie Thériault and Sophie Duchesne wrote the paper together.

Conflicts of Interest

The authors declare no conflict of interest.

References

  1. O’Neill, S.; Adhikari, A.R.; Gautam, M.R.; Acharya, K. Bacterial contamination due to point and nonpoint source pollution in a rapidly growing urban center in an arid region. Urban Water J. 2013, 10, 411–421. [Google Scholar] [CrossRef]
  2. Arora, A.S.; Reddy, A.S. Multivariate analysis for assessing the quality of stormwater from different Urban surfaces of the Patiala city, Punjab (India). Urban Water J. 2013, 10, 422–433. [Google Scholar] [CrossRef]
  3. Dickenson, J.A.; Sansalone, J.J. Distribution and disinfection of bacterial loadings associated with particulate matter fractions transported in urban wet weather flows. Water Res. 2012, 46, 6704–6714. [Google Scholar] [CrossRef] [PubMed]
  4. Hathaway, J.M.; Hunt, W.F. Evaluation of first flush for indicator bacteria and total suspended solids in urban stormwater runoff. Water Air Soil Pollut. 2011, 217, 135–147. [Google Scholar] [CrossRef]
  5. McCarthy, D.T.; Hathaway, J.M.; Hunt, W.F.; Deletic, A. Intra-event variability of Escherichia coli and total suspended solids in urban stormwater runoff. Water Res. 2012, 46, 6661–6670. [Google Scholar] [CrossRef] [PubMed]
  6. Eleria, A.; Vogel, R.M. Predicting fecal coliform bacteria levels in the Charles River, Massachusetts, USA. J. Am. Water Resour. Assoc. 2005, 41, 1195–1209. [Google Scholar] [CrossRef]
  7. Stumpf, C.H.; Piehler, M.F.; Thompson, S.; Noble, R.T. Loading of fecal indicator bacteria in North Carolina tidal creek headwaters: hydrographic patterns and terrestrial runoff relationships. Water Res. 2010, 44, 4704–4715. [Google Scholar] [CrossRef] [PubMed]
  8. Hébert, S. Modélisation de la qualité bactériologique d'un site potentiel de baignade à la Baie de Beauport; (in French, Modeling the Bacteriological Quality of a Swimming Potential Site at the Beauport Bay); Direction du suivi de l’environnement (Direction of Environmental Monitoring), Ministère de l’Environnement du Québec (Quebec Ministry of the Environment): Quebec city, QC, Canada, 2002. [Google Scholar]
  9. Schueler, T.R. Controlling Urban Runoff: A Practical Manual for Planning and Designing Urban BMPs; Report No 87703; Metropolitan Washington Council of Government: Washington, DC, USA, 1987. [Google Scholar]
  10. Shaver, E.; Horner, R.; Skupien, J.; May, C.; Ridley, G. Fundamentals of Urban Runoff Management—Technical and Institutional Issues, 2nd ed.; North American Lake Management Society: Madison, WI, USA, 2007. [Google Scholar]
  11. Alley, W.M.; Smith, P.E. Multi-Event Urban Runoff Quality Model (DR3M-QUAL); Open File Report 82–724; US Geological Survey: Reston, VA, USA, 1982. [Google Scholar]
  12. Bicknell, B.R.; Imhoff, J.C.; Kittle, J.L., Jr.; Donigian, A.S., Jr.; Johanson, R.C. Hydrological Simulation Program—Fortran; User’s Manual for Version 11; US Environmental Protection Agency, National Exposure Research Laboratory: Research Triangle Park, NC, USA, 1997. [Google Scholar]
  13. MIKE 11—A Modelling System for Rivers and Channels—Reference Manual; DHI Software: Helsingør, Denmark, 2011.
  14. Brunner, G.W. HEC-RAS River Analysis System, Hydraulic Reference Manual, Version 4.1; US Army Corps of Engineers, Hydrologic Engineering Center: Davis, CA, USA, 2010. [Google Scholar]
  15. Huber, W.; Dickinson, R. Stormwater Management Model (SWMM) User’s Manual, Version 4.0; United States Environmental Protection Agency: Athens, GA, USA, 1988. [Google Scholar]
  16. Servais, P.; Garcia-Armisen, T.; George, I.; Billen, G. Fecal bacteria in the rivers of the Seine drainage network (France): Sources, fate and modelling. Sci. Total Environ. 2007, 375, 152–167. [Google Scholar] [CrossRef] [PubMed]
  17. Bougeard, M.; Le Saux, J.; Gnouma, R.; Dupont, S.; Pommepuy, M. Modélisation des flux de contamination fécale et de leur impact sur la zone littorale (conséquences sur la qualité des eaux conchylicoles)—Partie 1; (Modeling of Fecal Contamination Flows and their Impact on the Coastal Zone (Impact on the Quality of Shellfish Waters)—Part 1); IFREMER: Plouzané, France, 2008. (In French) [Google Scholar]
  18. Manache, G.; Melching, C. Simulation of Fecal Coliform Concentrations in the Chicago Waterway System under Unsteady Flow Conditions; Rep. 2005–9; Department of Research and Development, Metropolitan Water Reclamation District of Greater Chicago: Chicago, IL, USA, 2005. [Google Scholar]
  19. Smith, R.F. Total Maximum Daily Load (TMDL) for Fecal Coliform Bacteria in the Waters of Duck Creek in Mendenhall Valley, Alaska; US EPA: Seattle, WA, USA, 2000. [Google Scholar]
  20. Total Maximum Daily Load for Fecal Coliform in Chester Creek, University Lake, and Westchester Lagoon, Anchorage, Alaska; Alaska Department of Environmental Conservation: Anchorage, AK, USA, 2005.
  21. McCarthy, D.T.; Deletic, A.; Mitchell, V.G.; Diaper, C. Development and testing of a model for Micro-Organism Prediction in Urban Stormwater (MOPUS). J. Hydrol. 2011, 409, 236–247. [Google Scholar] [CrossRef]
  22. MDDEP, Ministère du Développement Durable, de l'Environnement et des Parcs (Ministry of Sustainable Development, Environment and Parks). Critères de qualité de l’eau de surface. (Quality Criteria for Surface Water). 2012. Available online: http://www.mddep.gouv.qc.ca/eau/criteres_eau/index.asp (accessed on 18 February 2013). (In French)
  23. Environnement Canada. National Climate Data and Information Archive. Available online: www.climat.meteo.gc.ca (accessed on 18 February 2013).
  24. Schroeder, K.; Riechel, M.; Matzinger, A.; Rouault, P.; Sonnenberg, H.; Pawlowsky-Reusing, E.; Gnirss, R. Evaluation of effectiveness of combined sewer overflow control measured by operational data. Water Sci. Technol. 2011, 63, 325–330. [Google Scholar] [CrossRef] [PubMed]
  25. Impacts of Impervious Cover on Aquatic Systems (Watershed Protection Research Monograph No.1); Center for Watershed Protection: Ellicott City, MD, USA, 2003.
  26. Brière, F.G. Distribution et collecte des eaux; (Water Distribution and Collection); Presses internationales Polytechnique: Montréal, Canada, 2000. (In French) [Google Scholar]
  27. MDDEFP and MAMROT, Ministère du Développement durable, de l’Environnement et des Parcs (MDDEFP) and Ministère des Affaires municipales, des Régions et de l’Occupation du territoire (MAMROT) (Ministry of Sustainable Development, Environment and Parks and Ministry of Municipal Affairs, Regions and Land Occupancy). Guide de gestion des eaux pluviales. (Stormwater Management Guide). 2011. Available online: http://www.mddep.gouv.qc.ca/eau/pluviales/guide.htm (accessed on 18 February 2013).
  28. Water Environnement Federation. Prevention and Control of Sewer System Overflows; Federation Manual of Practice FD-17, 2nd ed.; WEF: Alexandria, VA, USA, 1999. [Google Scholar]
  29. Marsalek, J.; Ng, H. Evaluation of pollution loadings from urban nonpoint sources: Methodology and applications. J. Great Lakes Res. 1989, 15, 444–451. [Google Scholar] [CrossRef]
  30. Tchobanoglous, G.; Burton, F.; Stensel, H.D. Wastewater Engineering: Treatment, Disposal and Reuse, 3rd ed.; McGraw-Hill: New York, NY, USA, 1991. [Google Scholar]
  31. Ellis, J.B. Pollutional aspects of urban runoff. Urban Runoff Pollut. 1986, 10, 1–38. [Google Scholar]
  32. Passerat, J.; Ouattara, N.K.; Mouchel, J.M.; Rocher, V.; Servais, P. Impact of an intense combined sewer overflow event on the microbiological water quality of the Seine River. Water Res. 2011, 45, 893–903. [Google Scholar] [CrossRef] [PubMed]
  33. Geosyntech Consultants. A User’s Guide for the Structural BMP Prioritization and Analysis Tool (SBPAT v1.0). 2008. Available online: http://www.sbpat.net/downloads/SBPAT_UserGuide_FINAL.pdf (accessed on 27 February 2013).
  34. Roche. Contrôle des débordements des eaux usées—Phase 4 Tome 1; (Control of Wastewater Overflow —Phase 4 Volume 1); Publisher: Roche Consulting Engineers, Quebec city, QC, Canada, 2011. (In French) [Google Scholar]
  35. Dessau—Aquapraxis. Mise à jour du plan directeur de gestion des eaux pluviales—Rivière Beauport—Analyses hydrologique et hydraulique—état actuel; (Updated Stormwater Management Master Plan - Beauport River - Hydrological and Hydraulic Analyses - Current State); Publisher: Dessau, Quebec city, QC, Canada, 2010. (In French) [Google Scholar]
  36. Wong, T. Australian Runoff Quality: A Guide to Water Sensitive Urban Design; Engineers Australia: Canberra, Australia, 2006. [Google Scholar]
  37. Thériault, A. Quantification des apports en coliformes fécaux en milieu urbain par modélisation hydrologique/hydraulique : le cas du bassin versant de la rivière Beauport (Quantification of Fecal Coliform Sources by Urban Hydrologic/Hydraulic Modeling: Case Study the Beauport River Watershed). Master Thesis, Université du Québec (University of Quebec), INRS-ETE, Quebec city, QC, Canada, 2013. [Google Scholar]
  38. Nash, J.E.; Sutcliffe, J.V. River flow forecasting through conceptual models part I—A discussion of principles. J. Hydrol. 1970, 10, 282–290. [Google Scholar] [CrossRef]
  39. Hathaway, J.M.; Hunt, W.F.; Wright, J.D.; Jadlocki, S. Indicator bacteria removal in storm-water best management practices in Charlotte, North Carolina. J. Environ. Eng.-ASCE 2009, 135, 1275–1285. [Google Scholar] [CrossRef]

