1. Introduction
Sustainable urban drainage systems (SuDS) are designed to control and treat surface water flow and pollution from the increasing impervious development of urban environs [
1]. SuDS form part of a blue-green drainage network, the conveyance of stormwater through the urban environment via a network of ponding (blue) and ephemeral (green) vegetated stormwater treatment elements. Urban pollution is comprised of hydrocarbons, elevated nutrient levels, heavy metals, gross pollutants and sediment. Up to 85% of nutrients and heavy metal pollutants are conveyed from urban surfaces adsorbed to fine sediment, ranging from 1 µm to 2 cm [
2]. The conveyance and detention of fine sediment is therefore a key indicator of SuDS efficiency, illustrating the transport and detention process of urban pollutants through the blue-green drainage network.
The efficiency of SuDS, including vegetated swales, has been investigated by leading SuDS researchers within the laboratory and in the field under single runoff event conditions. Both simulated and naturally occurring runoff events have been monitored during research completed by Sabourin and Wilson (2008) [
3], and single runoff event specific pollutant removal efficiencies have been defined through analysis of this work. Deletic (2001) [
4] reported that swale total suspended solid reduction in initial event flows range between 78% and 86%. However, methodological limitations associated with long term source-pathway-sink monitoring of sediment movement through SuDS assets has resulted in limited extended case study research and analysis.
Current best practice employs an arbitrary swale design life of 25–30 years. Understanding of maintenance requirements for a swale beyond litter removal and grass cutting is limited. The long-term effects of multiple rainfall-runoff events through a swale on temporary or long term sediment deposition and removal is not clearly understood. This has led to uncertainty in defining maintenance needs, long-term design efficiencies and best practice.
To address this knowledge gap, field research was undertaken to identify the quantity of sediment from a single release that remains within a vegetated swale over an extended time period. To calculate this, it is necessary to define whether sediment deposited with a swale remains stationary or if it becomes re-suspended and transported due to subsequent runoff events. To create this sediment transport dataset, an effective sediment tracing method was identified and used to illustrate the long-term process of sediment transport in an established urban swale. The trace methodology was required to define the movement of a single sediment release within the total mass transport within the swale.
To ensure the movement of a single sediment release could be monitored over time within the swale, it was necessary to identify a trace that had long-term field resilience, was not lost from the system through sunlight exposure, plant uptake and was not transported through the vegetated environment other than by adsorption to sediment. The trace required multiple unique identifiers, supporting monitoring of multiple individual sediment releases over time.
The selected trace methodology was used on an established vegetated swale in Edinburgh, Scotland. Event and extended field sample analysis identifies the temporary and extended detention efficiency of this established urban swale. The research findings presented in this paper provide recommendations on the resulting efficiency and may be used in defining the assets maintenance needs over the life of the swale.
2. Sediment Tracing Methods
Sediment tracing has traditionally been used in agricultural research settings, investigating field and bank erosion source and processes. River banks and sand bar deposition monitoring use a range of natural sediment tracing techniques, including fingerprinting. There is an extensive range of sediment tracing methods available, from invasive chemical or physical tagging to passive photographic monitoring. The benefits and constraints of the more frequently employed techniques are listed in
Table 1.
The blue-green drainage network, into which tagged sediment is released, has environmental value and importance. It is necessary that the trace used in long term monitoring not only be effective in mimicking natural sediment movement but also result in no detrimental impact on the receiving environment.
In conjunction with environmental impact considerations, the key requirement of the sediment trace method for this research was to clearly define the movement of a single sediment release within the total mass transport of a swale over an extended period of time. It was important that the trace not only stay adsorbed to the sediment for months without concentration degradation by environmental influence, but that it be available in several unique forms. These would provide unique trace signatures enabling individual sediment releases to be monitored over time within a single swale, and therefore repetition of the field experiment. Monitoring of a single sediment release over extended time periods through a SuDS is novel, and comparative datasets are not yet published. Therefore, to create this sediment transport dataset a sediment trace methodology specific for this purpose had to be created.
Of the sediment trace methods outlined in
Table 1, several do not easily provide multiple unique trace signatures (total suspended solid/PSD analysis; synthetic and magnetic particles). Pollen and magnetic fluorescent material tracers are limited in availability, pollen by the natural availability and fluorescent particles by the artificial fluorescent colours available. Painted natural particles have limited field resilience, and radionuclide [
3,
4] tracers have been recorded to move both adsorbed and without adsorption to sediment across natural surfaces [
5]. Furthermore, the use of radionuclides requires environmental agency permission in many locations, limiting the ease of method availability. Fingerprinting is an effective watershed erosion and sediment [
6,
7] transport tracing method. It uses the multiple naturally occurring periodic element concentrations and particle size distribution to determine a sediment source. Where the range of sediment sources have distinctly different signatures, for example forestry erosion
versus agricultural wash-off or urban sediment, the fingerprinting method is effective. However, sediment entering an urban swale derives from road, car park and roof surfaces within the developed area. While the particle size and heavy metal concentrations differ between these sources, the source specific signatures are not easily discernable. Therefore, it is more difficult to employ the fingerprint method within the urban environment.
Table 1.
Overview of sediment tagging methods.
Table 1.
Overview of sediment tagging methods.
| Trace Method | Number of Identifiers | Activity Period in Natural Environment | Recorded Use | Potential for Utilization in Urban Environment | Source |
|---|
| Radionuclides | numerous | 30–40 years | Study of erosion and deposition in the landscape, chronometer for sediment deposition in ponds, lakes and floodplains, agricultural sediment erosion, catchment erosion and deposition in lakes. | Effective.
Long activity time results in potential difficulty in replicability.
High resource requirement. | [5,8,9,10,11] |
| Fingerprinting | numerous | Natural particle life cycle | Watershed/ catchment scale sediment budget analysis.
Sediment source analysis. | Effective but requires chemical signatures to be significantly different between sediment sources.
Requires technical support and laboratory equipment (AAS) and sampling for numerous chemical concentrations. | [11,12,13,14,15] |
| Painted/coated natural particles | numerous | Limited time frame due to low trace adhesion/adsorption to sediment particle.
Solar degradation may shorten field activity period. | River bank erosion, sediment transport though fluvial networks, larger sediment, pebble and gravel tracing. | Highly visible.
Difficulty in separating coated material from remaining sample sediment. | [16,17,18] |
| Magnetic particles | 1 | Extended dependent on synthetic material (coating) chosen or natural magnetism | Soil erosion within a watershed.
Sediment loss and detachment from source. | Artificial material limiting natural assimilation or breakdown.
Natural magnetism has limited unique signatures. | [19,20,21] |
| Magnetic fluorescent material | 4 | Extended dependent on the particle material. Fluorescent activity is extended due to the particle coating and design | River sediment transport.
Piped network sediment transport. | Supports monitoring without loss of material from the field environment.
Easily separated from total sample sediment.
Highly visible. | [16,22,23] |
| REO | 17 (15 readily analysed) | Extended (months–years) | Particle translocation.
Surface erosion, due to rainfall-runoff, overland flow, sediment transport from multiple sources.
Agricultural erosion.
Solute/suspended sediment redistribution in snow, ice, urban, agricultural and rural environments. | Not visible.
Limited environmental impact.
Significant identifiers.
Shown to be effective in alternative conditions.
Untested in the urban environment but meets urban monitoring requirements. | [24,25,26] |
| Pollen | Limited to natural vegetation pollen availability | Annual time frame (not event specific) to decades | Vegetation and land use histories (chronometer).
Pollen peak correlation with annual sediment erosion and deposition.
Ability to trace sediment to source, when source is from natural (vegetated) surfaces. | Limited due to activity period limitations.
Complexities relating to urban surface type, urban source and grassed/vegetated areas that comprise the SuDS. | [27,28] |
| Synthetic/ artificial particulates | limited | Extended (similar to natural particles) | Mass transport flux, TSS concentration and bed load change. | Difficult to consider source to sink movement unless limited to a single source within the network under consideration, due to limited identifiers. Replicability difficulty may not effectively mimic natural sediment characteristics. | [16,18] |
| Total Suspended Solid balancing and PSD analysis | limited | Extended (similar to natural particles) | Mass transport flux, suspended solid concentration change, PSD change related to influence of rainfall and source contribution (high level). | Limited to flux and balance analysis.
Difficult to identify source from PSD and mass change alone. | [29,30,31] |
Rare earth oxides (REO) provide an alternative to the above sediment trace methods, providing 17 clearly identified trace signatures. REO adsorb easily to natural sediment and have shown limited field detachment in laboratory testing [
6,
7]. REO tracing has been used in agricultural scour and erosion research and is therefore untested in the urban SuDS environment. However, given the trace properties, it was selected for this research. The trace methodology, previously used predominantly within the laboratory, was modified to achieve single sediment release field monitoring within a swale during multiple runoff events.
3. Rare Earth Oxides
Rare earth oxides are elements naturally found within soil and bed material. They form the lanthanide group of elements within the periodic table and are classified as rare due to their very low concentration within the shallow layers of the earth’s crust. The rare earth element group is comprised of lanthanides, scandium, and yttrium. As rare earths occur naturally in soil at very low concentrations, parts per billion, the analysis of natural rare earth concentrations requires strong acid digestion and assessment by inductively coupled plasma mass spectrometer (ICPMS) [
32].
Rare earths have been used in agricultural scour and erosion research to monitor sediment movement [
24,
30]. Zhang
et al. (2001) [
6] first published rare earth tracer methodology in 2001, illustrating rare earth elements strong binding capacity to soil and low mobility after attachment due to leaching. Rare earth elements have been successfully used as unique, single signature sediment tracers to monitor soil movement through agricultural media in a laboratory setting [
25,
33]. The rare earth group have 15 easily analysed, unique, single element signatures that adsorb strongly to a wide variety of particle sizes (<0.01 to >4.75 mm). Adsorption of rare earth oxide (REO) occurs though preferential bonding [
34]. In the natural drainage and soil environment, there is no significant leaching or movement of REO from tagged sediment to surrounding material [
6]. REO are not taken up by vegetation, therefore, being appropriate for use within the blue-green drainage network, and do not naturally degrade in sunlight or de-stabalise over time [
27,
35]. Due to the extended field activity period (months to years), the high number of unique identifying signatures and the limited impact on the receiving natural environment, REO tracers have potential as highly effective urban sediment tracers.
Rare earth tracing, while noted to achieve effective integration with tag material, low or no solubility in water, limited plant uptake, no eco-environmental damage and to exist in very low natural concentrations [
7], there are several limitations to REO tracer use. Tracer enrichment may occur due to an increase in tracer mobility with increasing soil or runoff acidity [
7]. REO also preferentially bind to fine particulate material, silt and clay particles [
36]. Therefore, where a large particle size distribution (including coarse sediment, sand or gravel) is used in a trace experiment, there may be an over or underestimation of REO concentration due to REO tracer transference [
36]. Research in REO tracer enrichment due particle size re-distribution during erosion experiments suggests a potential error of 4% when considering a particle size range from 8 mm to below 0.9 mm [
25,
26,
33,
36].
4. Field Site and Experiment Methodology
An established, maintained, active urban swale was selected for the field trials. The swale is located within Heriot-Watt University grounds, Scotland. It is located parallel to a local road and collects runoff directly from this road network. The swale has a mild grade (less than 2%), is over 100 m in length, grassed and conveys stormwater runoff from a 500 m2, 40% impervious, urban developed area to a piped stormwater network. Runoff from the contributing area is conveyed to the road and enters the swale via curb inlets along the road. The road has a single camber, therefore, insuring all stormwater flows to this swale.
The field experiment was designed to allow one sediment release of REO tagged material at the commencement of the monitoring period. This sediment, equating to 1/4 of the annual average sediment loading, was released onto the impervious surface (road) upstream from the swale inlet. 10 kg of dry, tagged sediment was evenly spread across a 10-m long, 1-m wide strip of road upstream from the swale inlet. The tagged material was then washed off the road surface by a 30 min long, three-month return period runoff event. The runoff event was artificially created using a pressurized local water source (fire hydrant) and a level spreader was employed upstream from the sediment release location to allow runoff to sheet flow across the road towards the swale inlet.
Sediment was tagged following the detailed process described in Zhang
et al. (2001, 2003) [
6,
25]. Tagged sediment was designed to be representative of the known sediment occurrence on urban roads. Road sweeping collection and particle size analysis was completed at the field site, and this, in conjunction with literature review of urban road sediment particle size distribution and loading, defined a representative sediment sample characterization (d50 = 60 µm and 50 ton/km
2/year) [
37,
38]. There is limited guidance on the effective concentration of REO trace to sediment ratio, and REO tracing has been limited to agricultural sediment tracing conditions to date. Literature suggests that in an agricultural scour tests in laboratory environments a concentration of 5–100 g/kg may be appropriate for effective signature analysis [
26,
27,
35]. Deasy and Quinton (2010) [
26] undertook field tests using up to 500 g/kg of REO trace to ensure a clear trace signature was created in the field environment. The nature of a trace is to provide detailed sediment transport information without significant influence to the receiving environment or sediment dynamics. Therefore, it is important to identify the minimal concentration of sediment trace necessary to effectively monitor sediment transport activity in the field without compromising the results due to weak signature strength.
To identify the effective trace concentration necessary for swale sediment transport tracing, the experiment was replicated using two unique rare earths (La and Nd) at different trace concentrations (10 g/kg and 100 g/kg respectively). The assumption that sediment in both experiments sediment should move in a similar way, providing a similar trend pattern in REO concentration) allowed trace concentration influence on signature clarity and effective (minimum) trace concentration to be defined. It should be noted that background REO concentrations (of both artificial runoff and swale soil) were low, below ppm analysis levels.
Using a local water source the first runoff event was artificially created. Tagged sediment was placed upstream from the swale inlet prior to runoff event 1. Runoff event 1 then created flow over the sediment laden road surface and entered the swale. The event ceased after 30 min, and a one-hour drying period was provided.
A second artificial runoff event, of the same duration and intensity as runoff event 1, was then artificially created. No further sediment was placed on the upstream impervious area but surface flow was allowed to follow the same path as runoff event 1. After a one hour drying period, a third artificial runoff event was created, of the same duration and intensity at the previous two runoff events.
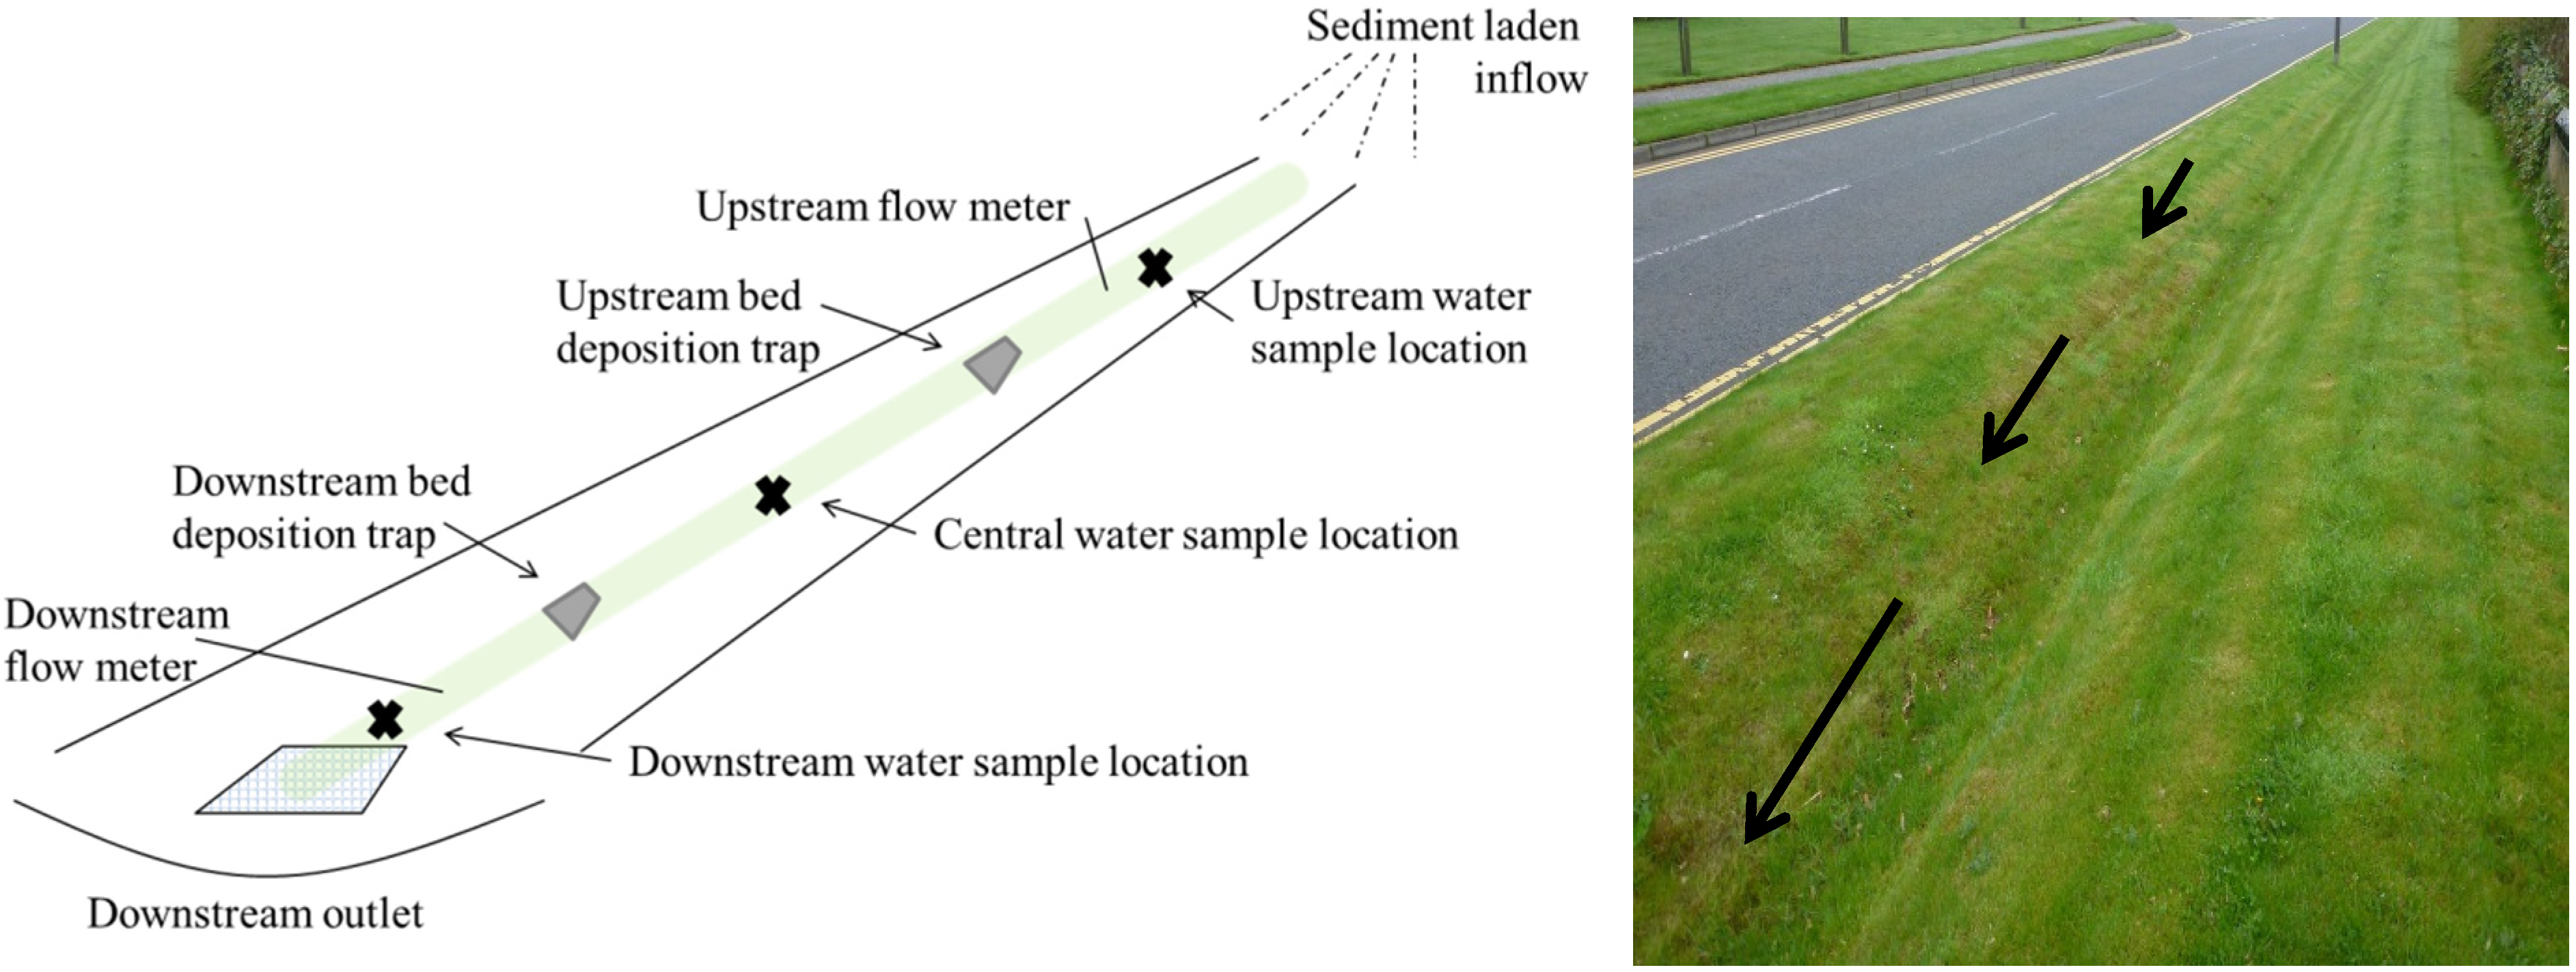
Figure 1 provides a schematic layout of the monitoring and sampling undertaken during and after each flow event. All sediment-laden runoff entered the swale 40 m upstream from the grated downstream outlet. During runoff events 1, 2, and 3 grab samples were collected from surface flow at three locations within the main flow path of the swale. It is acknowledged in selecting this sample method that surface sampling, in the form of grab samples, may not provide detailed accurate representation of suspended sediment concentrations where sediment particle size distribution is large. Swale surface samples were collected from 1 m downstream from the swale inlet (upstream location); 20 m downstream from the inlet (central section of the swale); and one meter upstream from the outlet (downstream location). Surface samples were collected at all three locations at 5 min intervals throughout the runoff events.
Figure 1.
Schematic swale diagram.
Figure 1.
Schematic swale diagram.
Between runoff event 1, 2, and 3 runoff was allowed to discharge from the swale. At the cessation of swale flow, sediment deposition samples were collected from gravel bed traps placed in the swale bed at two locations (corresponding with the upstream and downstream surface sample locations). The sediment traps were square collection trays inset into the swale bed, filled with gravel and sized to collect up to 2 mm sediment particles transported by rolling, saltation or deposited on cessation of runoff flow.
Flow depth and velocity were monitored at the upstream and downstream extent of the 40-m swale reach. Stingray ultrasonic sensors were anchored on the swale bed and continuously logged flow depth and velocity from the commencement of runoff event 1 until cessation of swale flow from runoff event 3. This recorded the inflow and outflow for each runoff event supporting flow relative comparison of sediment transport results.
Once the artificial runoff events were completed, core samples to 0.02 m depth were taken at five-m intervals down the central flow path of the swale. Core samples were taken immediately post experiment completion, one week, six months, and 12 months after the release of trace tagged sediment on the upstream road surface.
The REO concentration in all samples, runoff event surface samples, bed deposition and core samples, were analysed using an ICPMS. To detach REO trace material from sediment, samples must undergo strong acid digestion [
6,
25]. Surface and bed deposition samples were thoroughly shaken and 50 mL of suspended sample material was processed using strong acid digestion methodology. Core samples were dried at 105 °C for 24 h. Individual dried samples were mixed thoroughly and two grams of sample material was prepared for ICPMS analysis through strong acid digestion. Filtered digestion liquid was tested by ICPMS to define sample REO concentrations. It should be noted that runoff event water and background soil samples were also tested to provide background REO concentration levels.
5. REO Trace Results
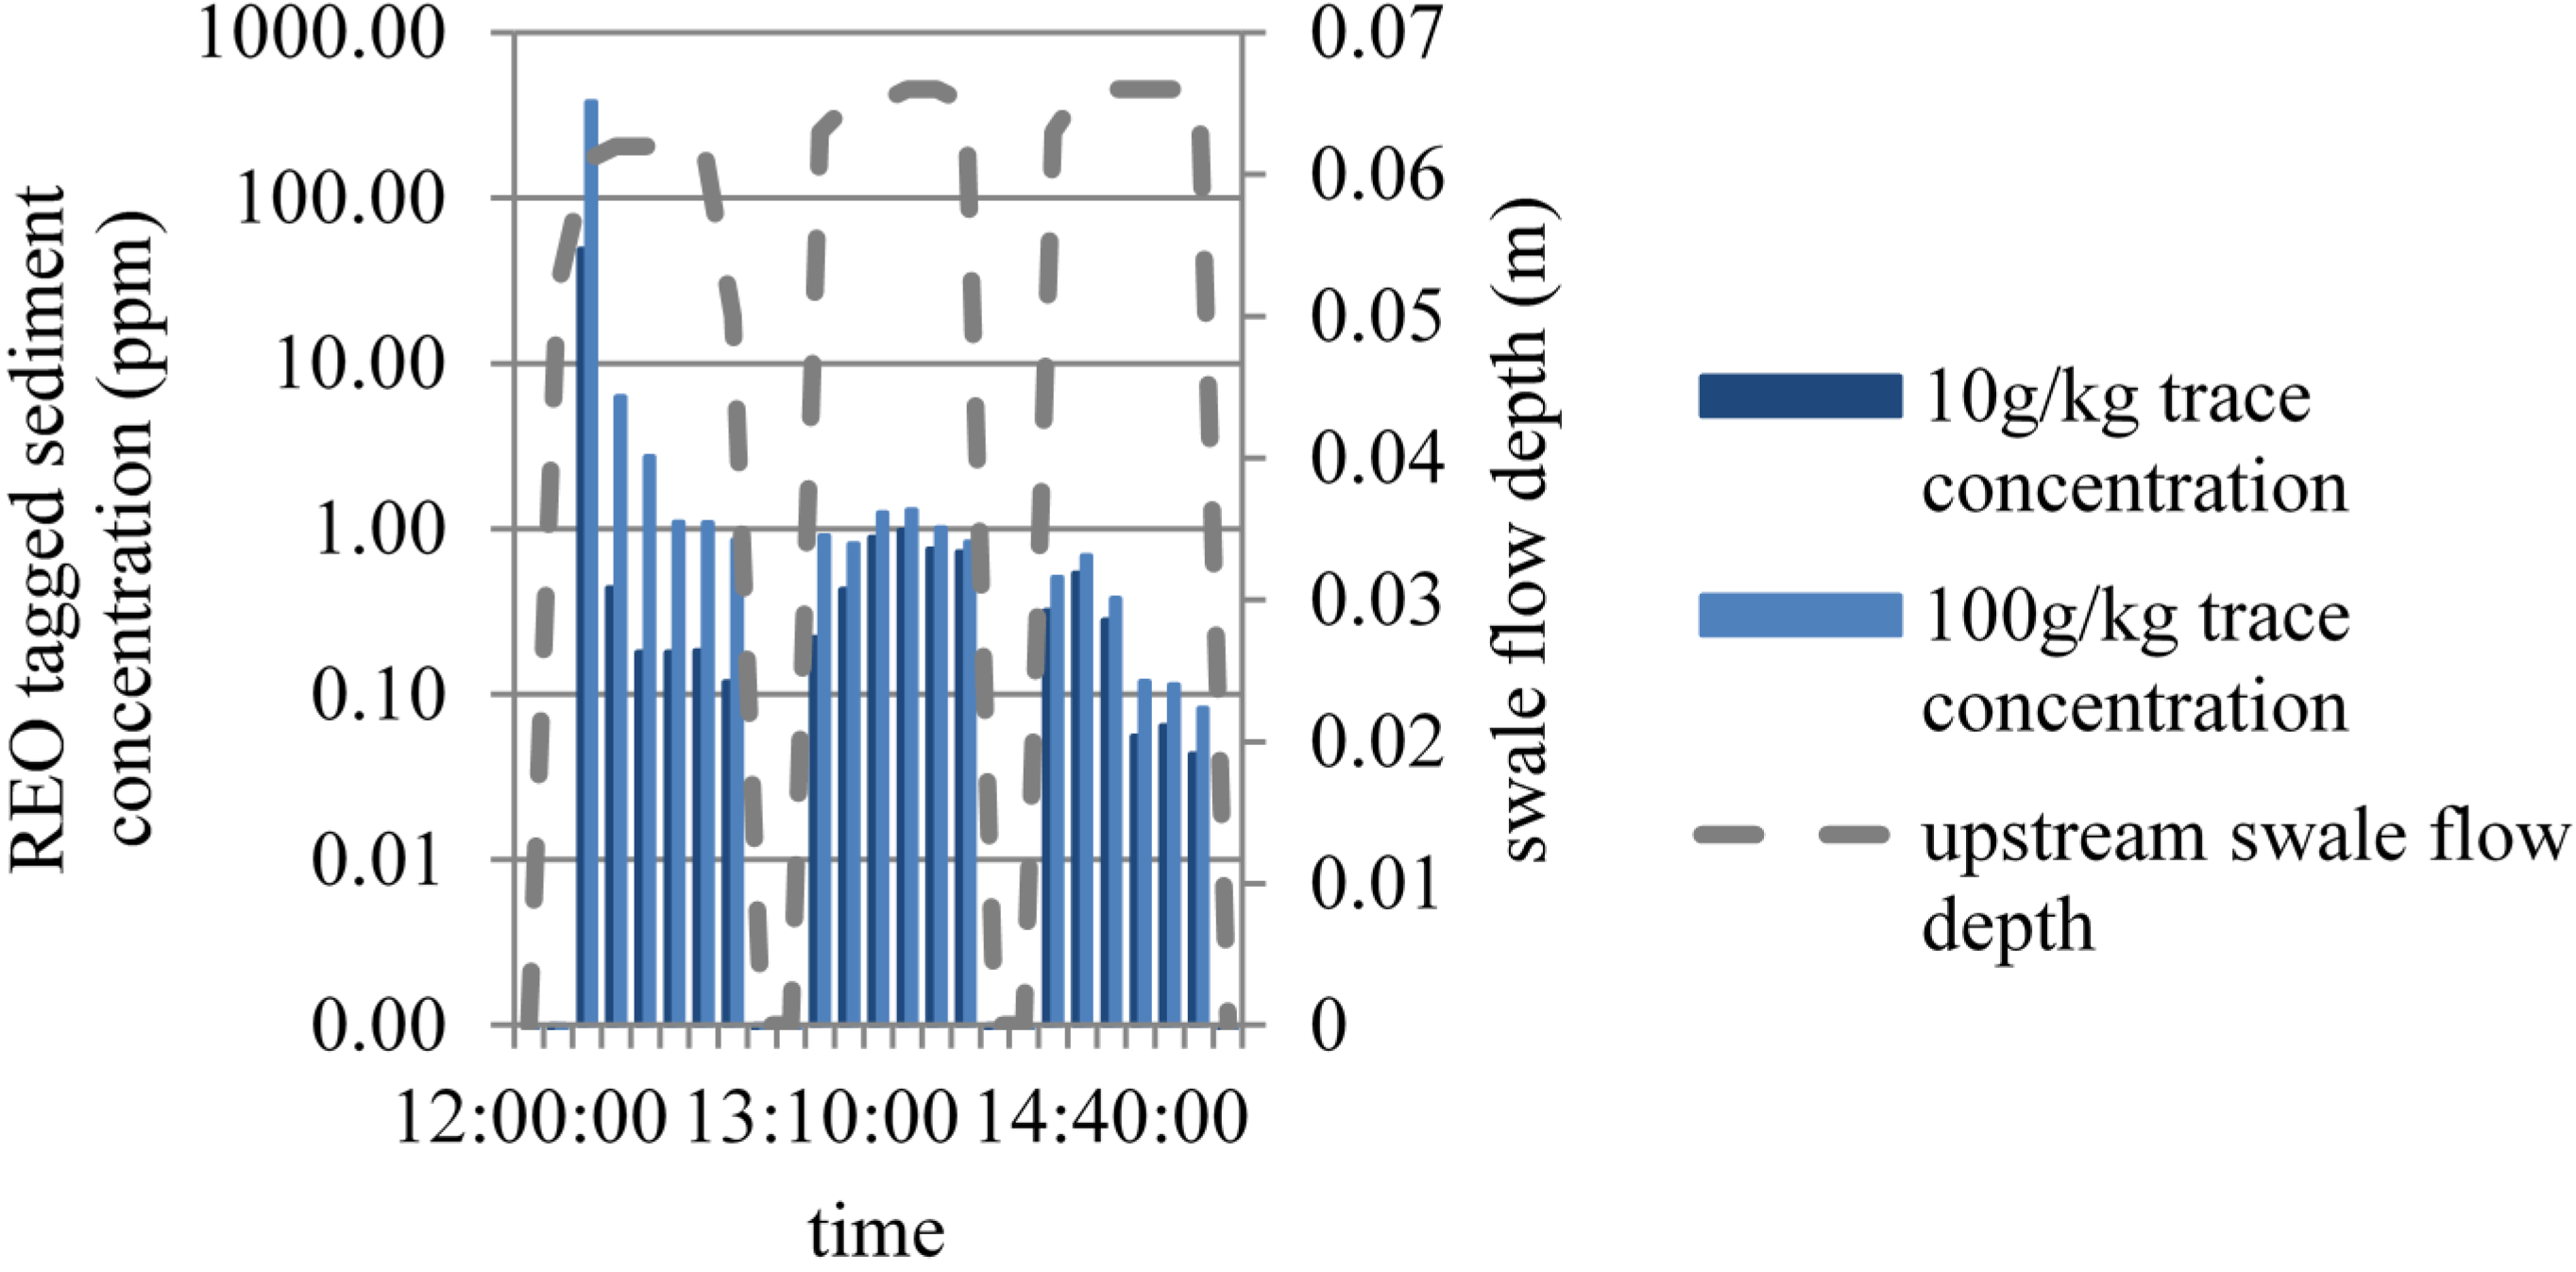
REO concentrations within runoff event flow, bed deposition and core samples taken over the six-month period were collated with swale flow depth, velocity and rainfall records. The REO trace provides a clear signature at both 10 g/kg and 100 g/kg trace concentrations throughout the 40 m monitored reach of the established swale.
Figure 2 presents trace concentrations during runoff events 1, 2, and 3 and demonstrates that the presented REO trace methodology is effective in illustrating sediment transport through an urban vegetated swale under ephemeral conditions.
Figure 2.
Tagged sediment concentrations at the upstream swale monitoring location.
Figure 2.
Tagged sediment concentrations at the upstream swale monitoring location.
REO tagged sediment of two selected tracer:sediment ratios were released.
Figure 2 illustrates that both the 10 and 100 g/kg REO to sediment ratios appear to function as effective tracers within a blue-green network. The two REO tagged sediment material show concentrations that follow a similar trend when analysed at part per million concentrations by an ICPMS. The concentration of sediment entering the swale during event one follows the same curve and results in tagged suspended sediment (TSS) concentrations of similar value.
There is a magnitude shift in the TSS concentration values seen in runoff event 1. The amount of 100 g/kg tagged sediment is 8 to 10 times greater than the 10 g/kg tagged material. However, runoff events 2 and 3 show a comparable quantity of tagged sediment in the samples, as would be expected. The cause of the elevated 100 g/kg tagged sediment results during runoff event 1 is due to the absorption maxima for the tagged soil composition being reached. The increased flush of REO trace during this first runoff event is a result of excess trace being transported through the swale in suspension. Within this field research, a range of particles sizes were used, with tag media comprised of both sand and clay. Laboratory analysis undertaken by Kreider (2012) [
39] suggests clay/silt material adsorption maxima to be 12,400 ppm while a range from 1900 to 43,000 mg/kg presented is in Spencer
et al. (2007) [
35]. While it is acknowledged that these adsorption maxima are not specific to the tag material used in this field research, the 100 g/kg REO concentration is noted to be significantly above these adsorption levels. Thus, while past REO trace research has used up to 100 g/kg trace to sediment tag rates, the flush of 100 g/kg REO trace in solution during the first runoff event highlights the sensitivity of tagged material composition to REO trace use.
Considering the REO signatures created by both 10 g/kg and 100 g/kg trace concentration, the lower concentration trace was selected for future sediment trace field research, minimizing the amount of material released into the environment and receiving waterway. It should be noted that concentration errors due to enrichment from the swale soil source are assumed to be insignificant, due to the low background REO concentrations.
Runoff event specific sediment detention for a swale is expected to be approximately 90% [
3,
4,
40]. Analysis of the REO concentrations for the initial (runoff event 1) 30 min event agreed with general sediment treatment expectations. The sediment detention within the swale as a result of runoff event 1 was between 90% and 98% for all experiment repetitions.
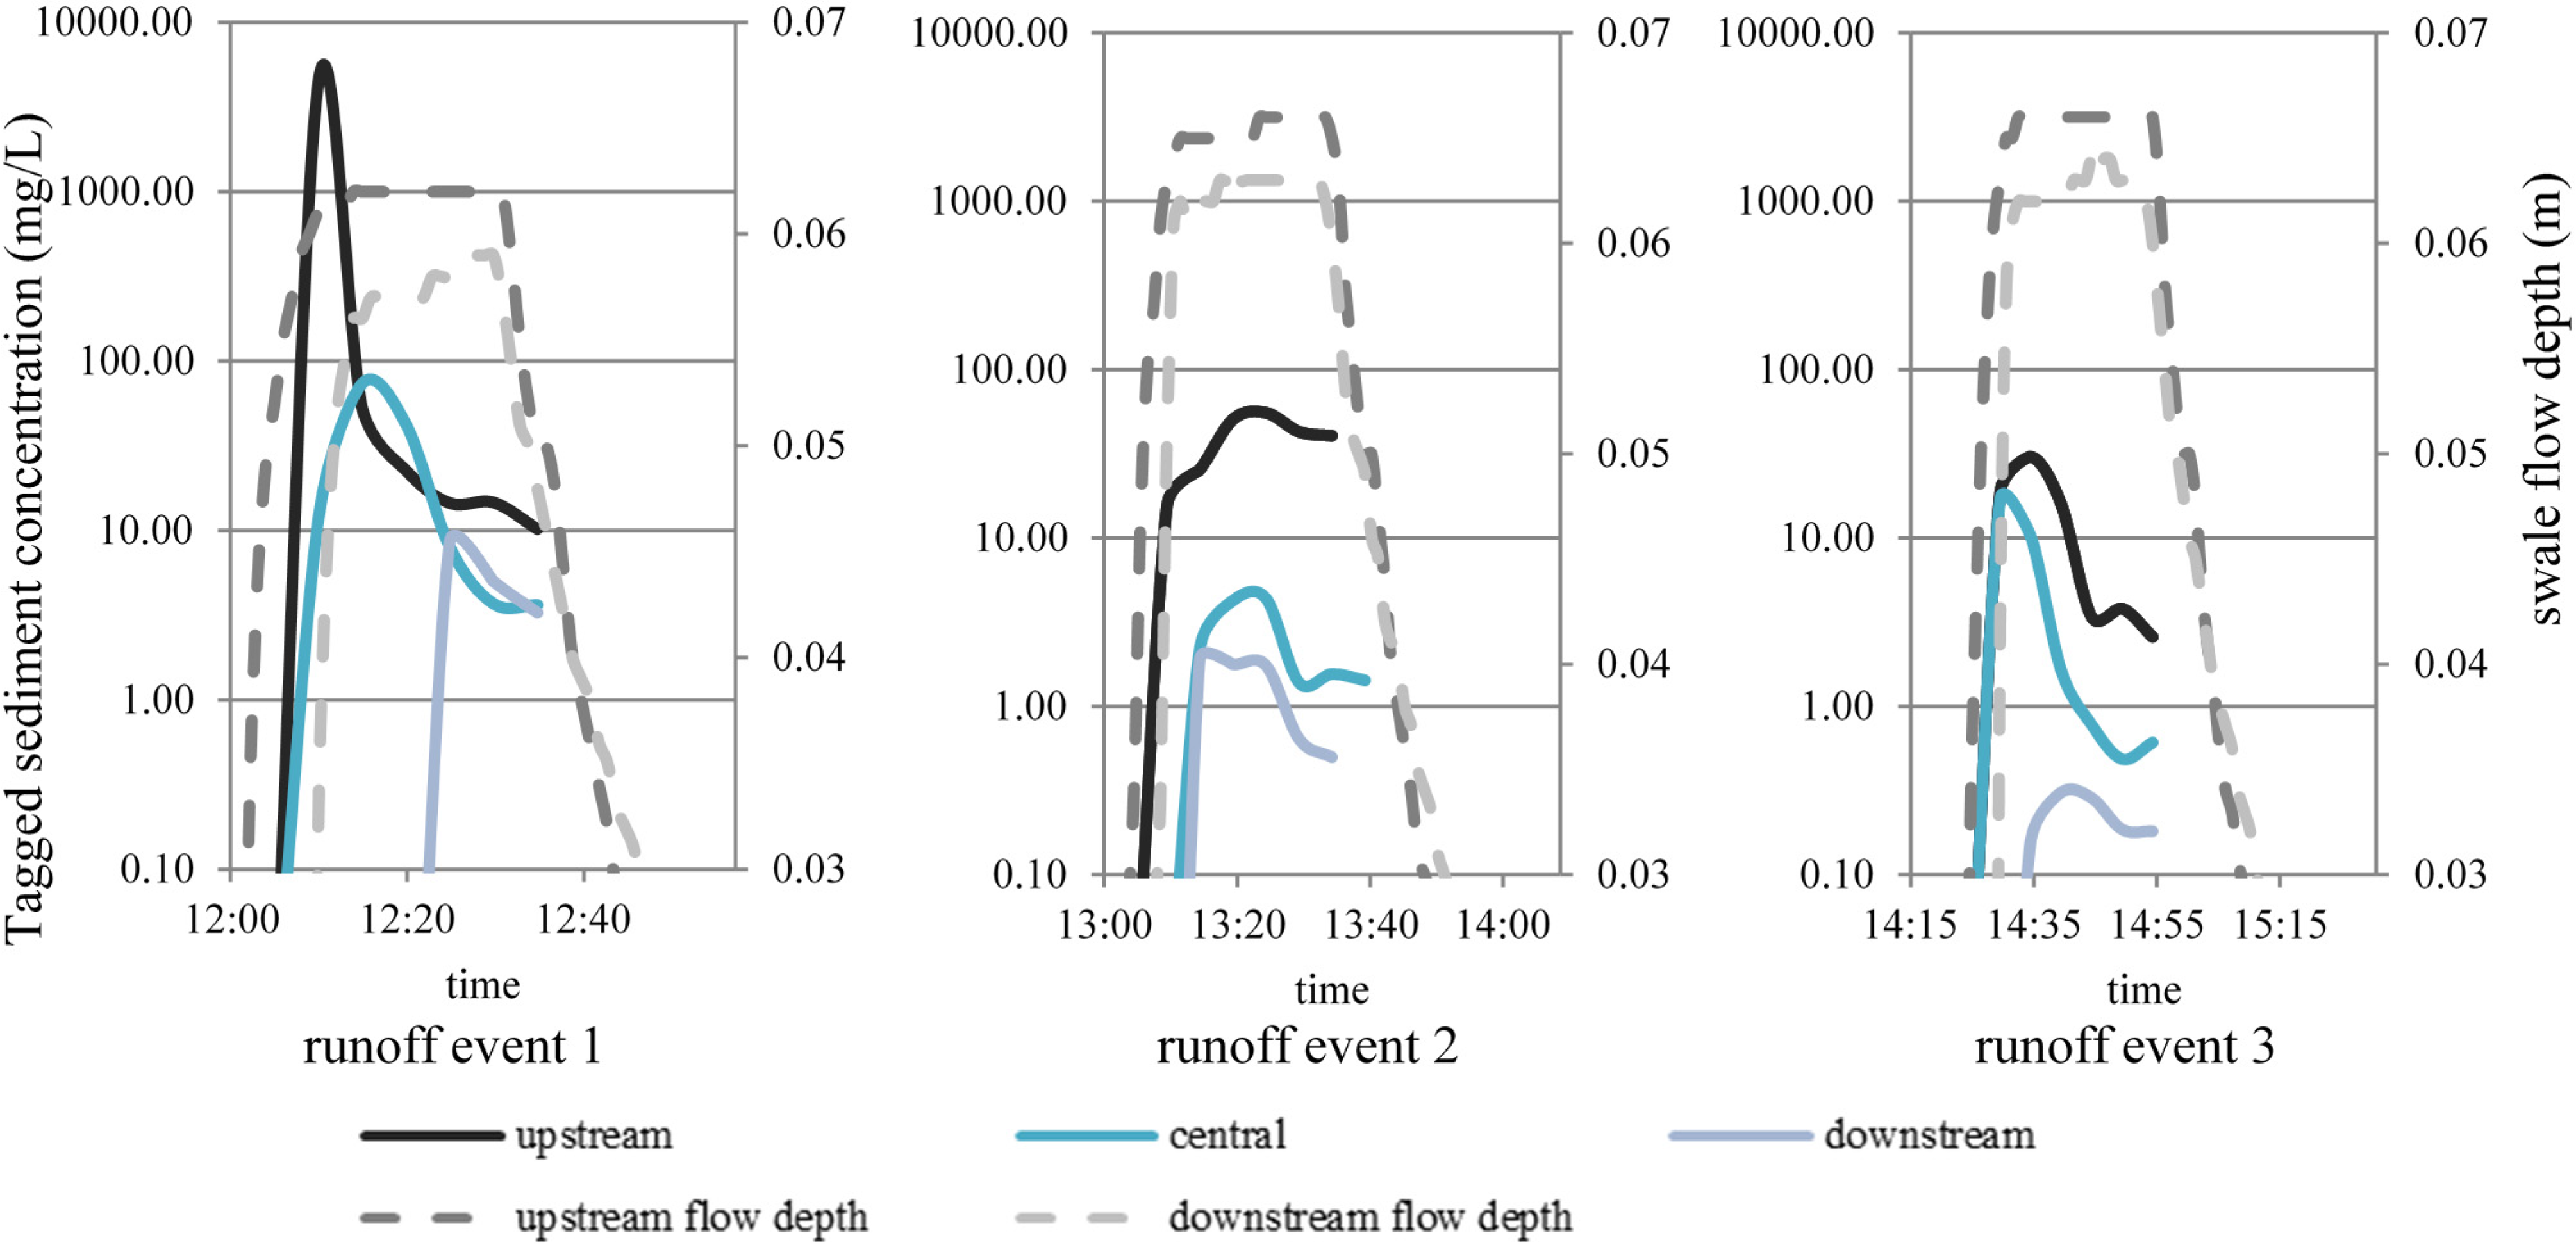
The three monitored runoff events provided tagged sediment transport concentrations respective to the runoff event (1, 2, or 3). As would be expected, the initial event (runoff event 1) showed elevated upstream concentrations and the highest concentration relative to subsequent events (
Figure 3, upstream). Within each single runoff event, the REO concentration decreased progressively down the swale (moving from the upstream to downstream sampling location); however, variance is illustrated between the extent of this decrease between each event.
Figure 3.
REO tagged sediment concentrations for artificial runoff events at the three surface runoff monitoring locations within the swale (upstream, central, and downstream locations)—Experiment 1 results.
Figure 3.
REO tagged sediment concentrations for artificial runoff events at the three surface runoff monitoring locations within the swale (upstream, central, and downstream locations)—Experiment 1 results.
Runoff event monitoring illustrated a rise in REO concentration occurring with the commencement of each flow event (
Figure 3). During runoff event 1, this peak was approximately five times the average event concentration. Cristina and Sansalone (2003) [
41] and Ellis (1996) [
37] considered the high fine sediment concentration in urban stormwater movement and the occurrence of elevated sediment concentrations initiated by stormwater flow (first flush principles). The peaks illustrated within these results show a sediment concentration increase as a result of runoff flow entering the swale, but the trace concentration peak occurs concurrent or after the runoff flow peak and therefore is not considered to be a first flush occurrence. The peak in sediment concentration within the sediment pollutograph is considered to occur as a result of runoff flow movement, the initiation of transport as a direct result of the introduction of flow to a dry flow path, where rainfall is greater than the loss to infiltration.
Of interest is the change in concentration at each specific monitoring location over the three flow events. It is anticipated that the upstream concentration decreases over time, as illustrated in
Figure 3. Small flow initiated concentration increases occur in events 2 and 3 at the upstream sampling location. No further sediment was applied to the upstream impervious area of the runoff flow path, thus the increase in upstream tagged sediment concentrations during runoff events 2 and 3 do not occur through continued introduction of tagged sediment from the road. Hussein
et al. (2007) [
42] undertook detailed experimental research to identify the dynamics of sediment transport from an impervious (low manning’s n, 0.016) surface into a vegetated flow path (manning’s n of 0.025–0.035). Their research findings illustrate a sediment deposition zone at the impervious/vegetated surface interface. This sediment deposition zone, occurring at the vegetation boundary where runoff enters the swale (within this field experiment) is found to act as a temporary sediment storage area. During runoff event 1, tagged sediment from the upstream impervious area became temporarily detained at this vegetated boundary. As successive runoff events occurred, runoff events 2 and 3, the sediment deposited at this vegetation boundary became entrained and entered the swale, therefore creating the upstream-tagged sediment concentration elevations within these runoff events (2 and 3).
The REO trace concentrations were found to generally decrease during the ongoing flow event. Concentrations decreased by 83%–99% of the inflow sediment concentration. The smaller REO concentration peaks associated with the commencement of runoff events 2 and 3 suggest resuspension or continued influx of REO tagged sediment within the monitored swale length. While no further sediment was introduced into the system during these following events, the upstream vegetation boundary was noted to have a potential influence over sediment inflow into the swale [
42,
43,
44]. The receiving swale vegetation edge appears to act as a temporary detention zone, supporting ongoing sediment release into the swale with additional events. The REO concentration peaks at the commencement of event 2 and 3 are notably smaller than in event 1, however the persistent occurrence of these flow initiated peaks supports the inclusion of vegetation boundary influence in swale sediment balance analysis.
The continued decrease of tagged sediment concentration during runoff events 2 and 3 illustrate a continued transport of sediment through the swale. Sediment entering the swale during runoff event 1 is shown to travel downstream (
Figure 3), while runoff events 2 and 3 illustrate a flow driven sediment pulse that is also shown to move to the downstream monitoring location. There is a general decreasing tagged sediment concentration trend for upstream and downstream monitoring locations over the three runoff events. While the overall average REO concentration over the three events decreases for the central monitoring location, there is a notable increase in peak concentration. This inconsistency in concentration flux may illustrate the influence of internal swale sediment resuspension resulting from subsequent flows.
The sediment trapping efficiency of the swale was calculated simply through comparison of the REO concentration entering and leaving the swale during each flow event. The tagged sediment concentrations shown in
Table 2 illustrate the decreasing tagged sediment trapping efficiency of the swale in runoff events 1, 2, and 3 for the single sediment release. The first and second repeat of the trace and artificial runoff event results are provided in
Table 2 to illustrate consistency in the tagged sediment trapping efficiency trend of the swale. REO tagged sediment continued to leave the swale during the second and third flow event, decreasing the quantity of sediment permanently detained within the swale. This supports the theory of continued sediment resuspension due to subsequent flows through a blue-green drainage system, and that the assumption that sediment detained within the initial event will remain within the swale in perpetuity is inaccurate.
Table 2.
Summary of sediment trapping efficiency (tagged sediment concentration leaving the swale-the total tagged concentration entering the swale) during artificial flow events (for two replicate artificial runoff experiment sets).
Table 2.
Summary of sediment trapping efficiency (tagged sediment concentration leaving the swale-the total tagged concentration entering the swale) during artificial flow events (for two replicate artificial runoff experiment sets).
| Experiment | Runoff Event | Sediment Trapping Efficiency (Retention of Tagged Material) |
|---|
| 1 | 1 | 98% |
| 2 | 97% |
| 3 | 84% |
| 2 | 1 | 95% |
| 2 | 75% |
| 3 | 67% |
Swale bed deposition was collected between each flow, using sunken sediment taps within the swale central flow path. Two sediment traps were set within the monitored swale reach. The REO concentration for each runoff event deposition is illustrated in
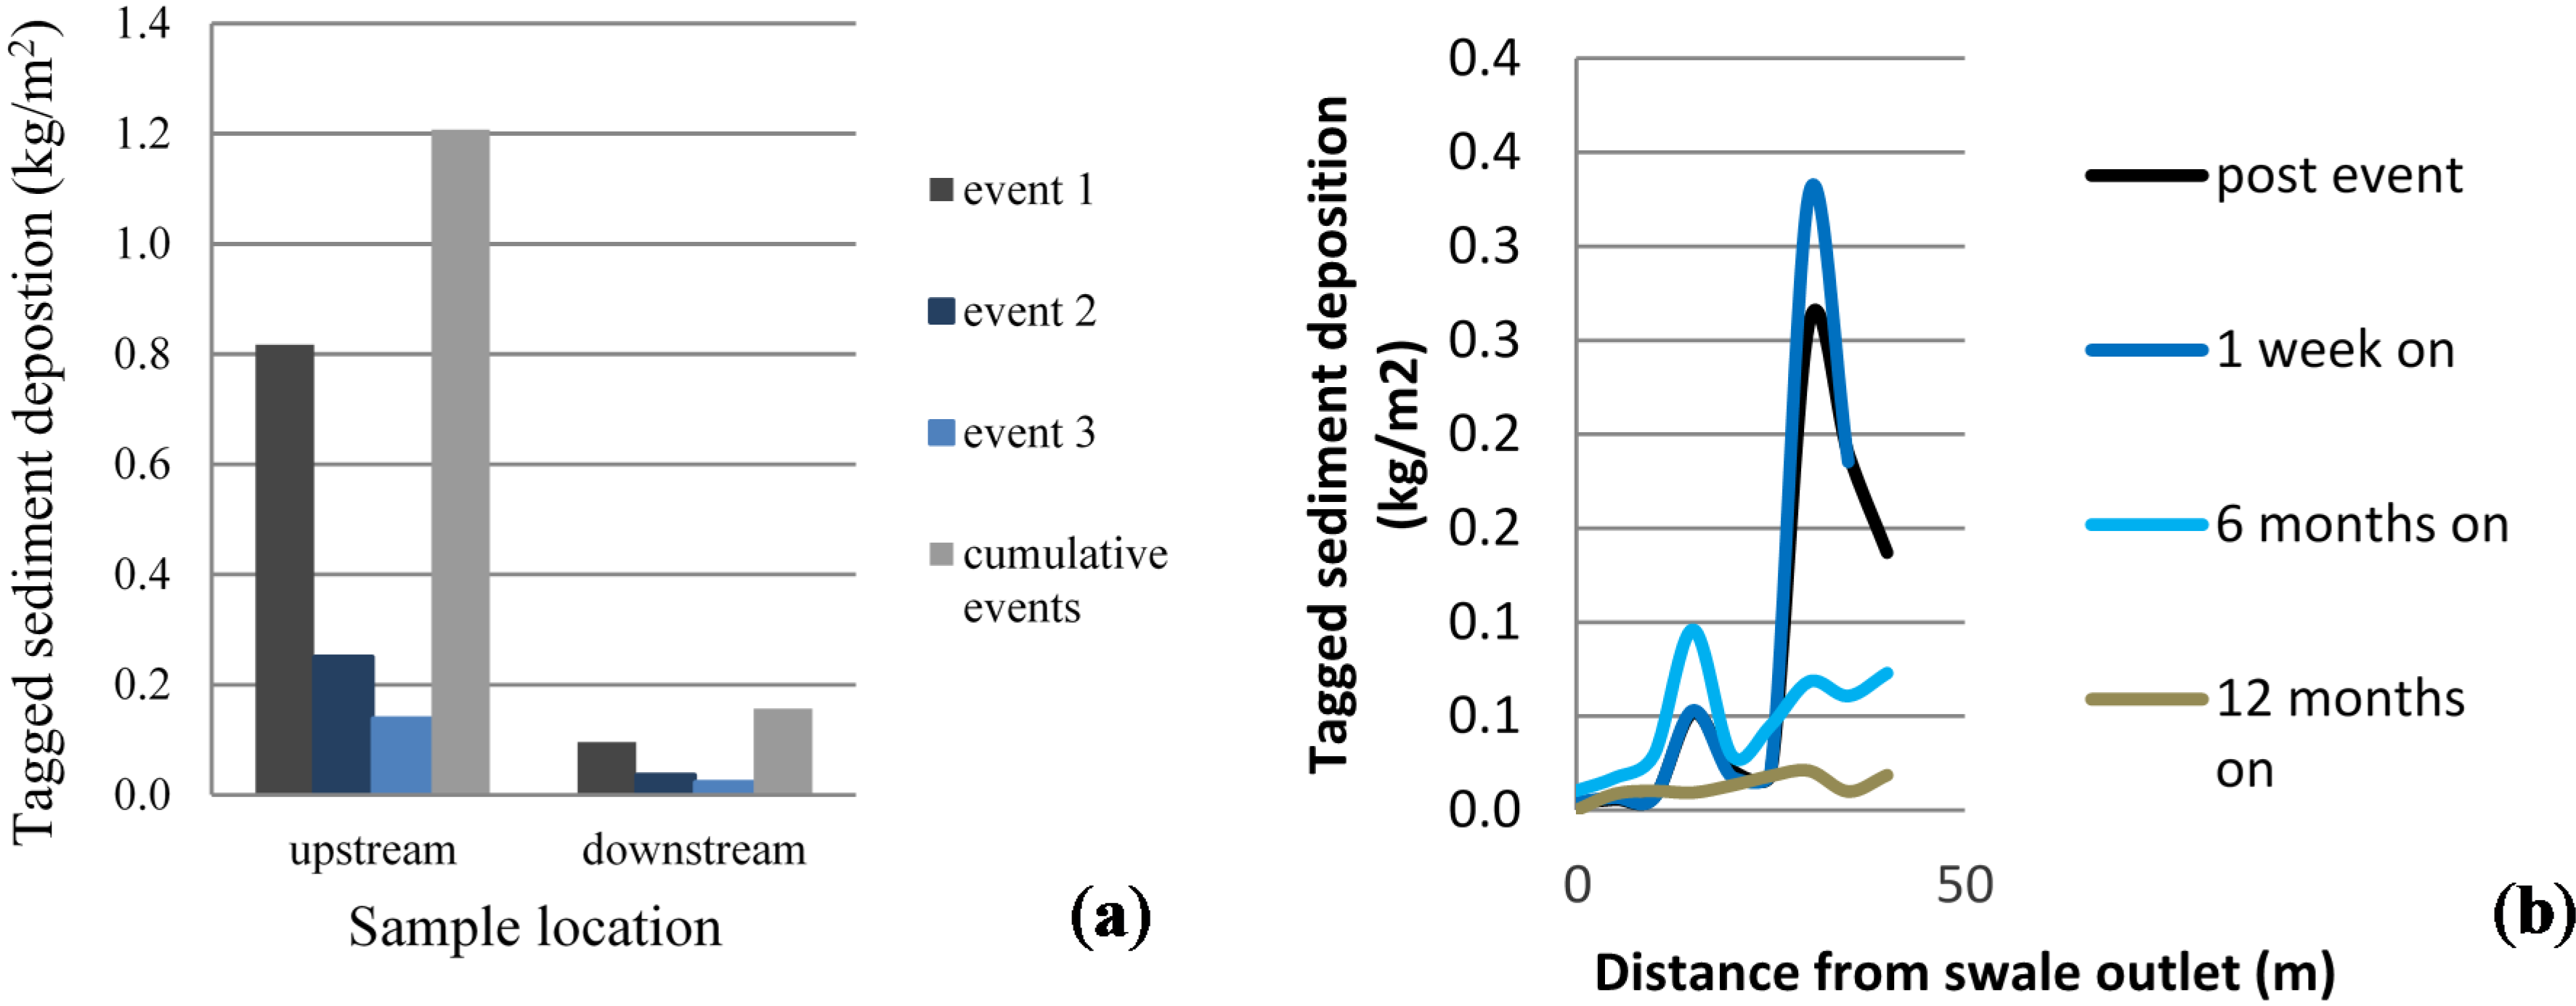
Figure 4a. Similar to the function of a vegetated filter strip, the upstream receiving vegetated flow path detains a more significant amount of sediment than further downstream [
31]. Deposition at the downstream extent is between 90% and 95% lower than upstream. Furthermore, the deposition decreases over subsequent events, supporting the theory of ongoing movement and deposition of REO tagged sediment material through the swale.
Figure 4.
Deposition of tagged sediment within sediment traps placed in the base of the swale: within the swale between runoff events (a); and over the following 12-month period (b).
Figure 4.
Deposition of tagged sediment within sediment traps placed in the base of the swale: within the swale between runoff events (a); and over the following 12-month period (b).
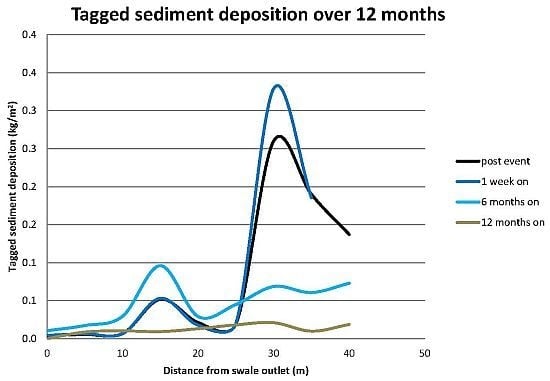
Core samples taken at five-m intervals across the centerline of the swale over a twelve month period indicated that re-suspension and deposition continued to occur. Over the monitoring period the quantity of REO tagged sediment within the swale flow path depletes within the upstream extent (70%–75%). The REO tagged sediment peak moves down the swale over time, from the upper 30–40 m swale point (30–40 m upstream of the outlet) to 10–20 m location over six months.
Figure 4b illustrates a slow continuous sediment resuspension and deposition process that moves sediment from the initial release consistently downstream over time. After six months, the concentration at the downstream extent of the swale was noted to be greater than immediately after the initial flow events. Of the REO tagged sediment initially deposited within the swale (0.8 kg/m
2), up to 0.1 kg/m
2 remained deposited after six months. Considering the area under each time stamped deposition curve in
Figure 4b, the net tagged sediment loss (REO tagged sediment mass balance loss) between post event samples and six months on is 38%. This indicates the quantity of tagged sediment that has been re-suspended and conveyed out of the swale during subsequent events during the six-month period, a continued decrease in detention efficiency due to ongoing flow events through the swale.
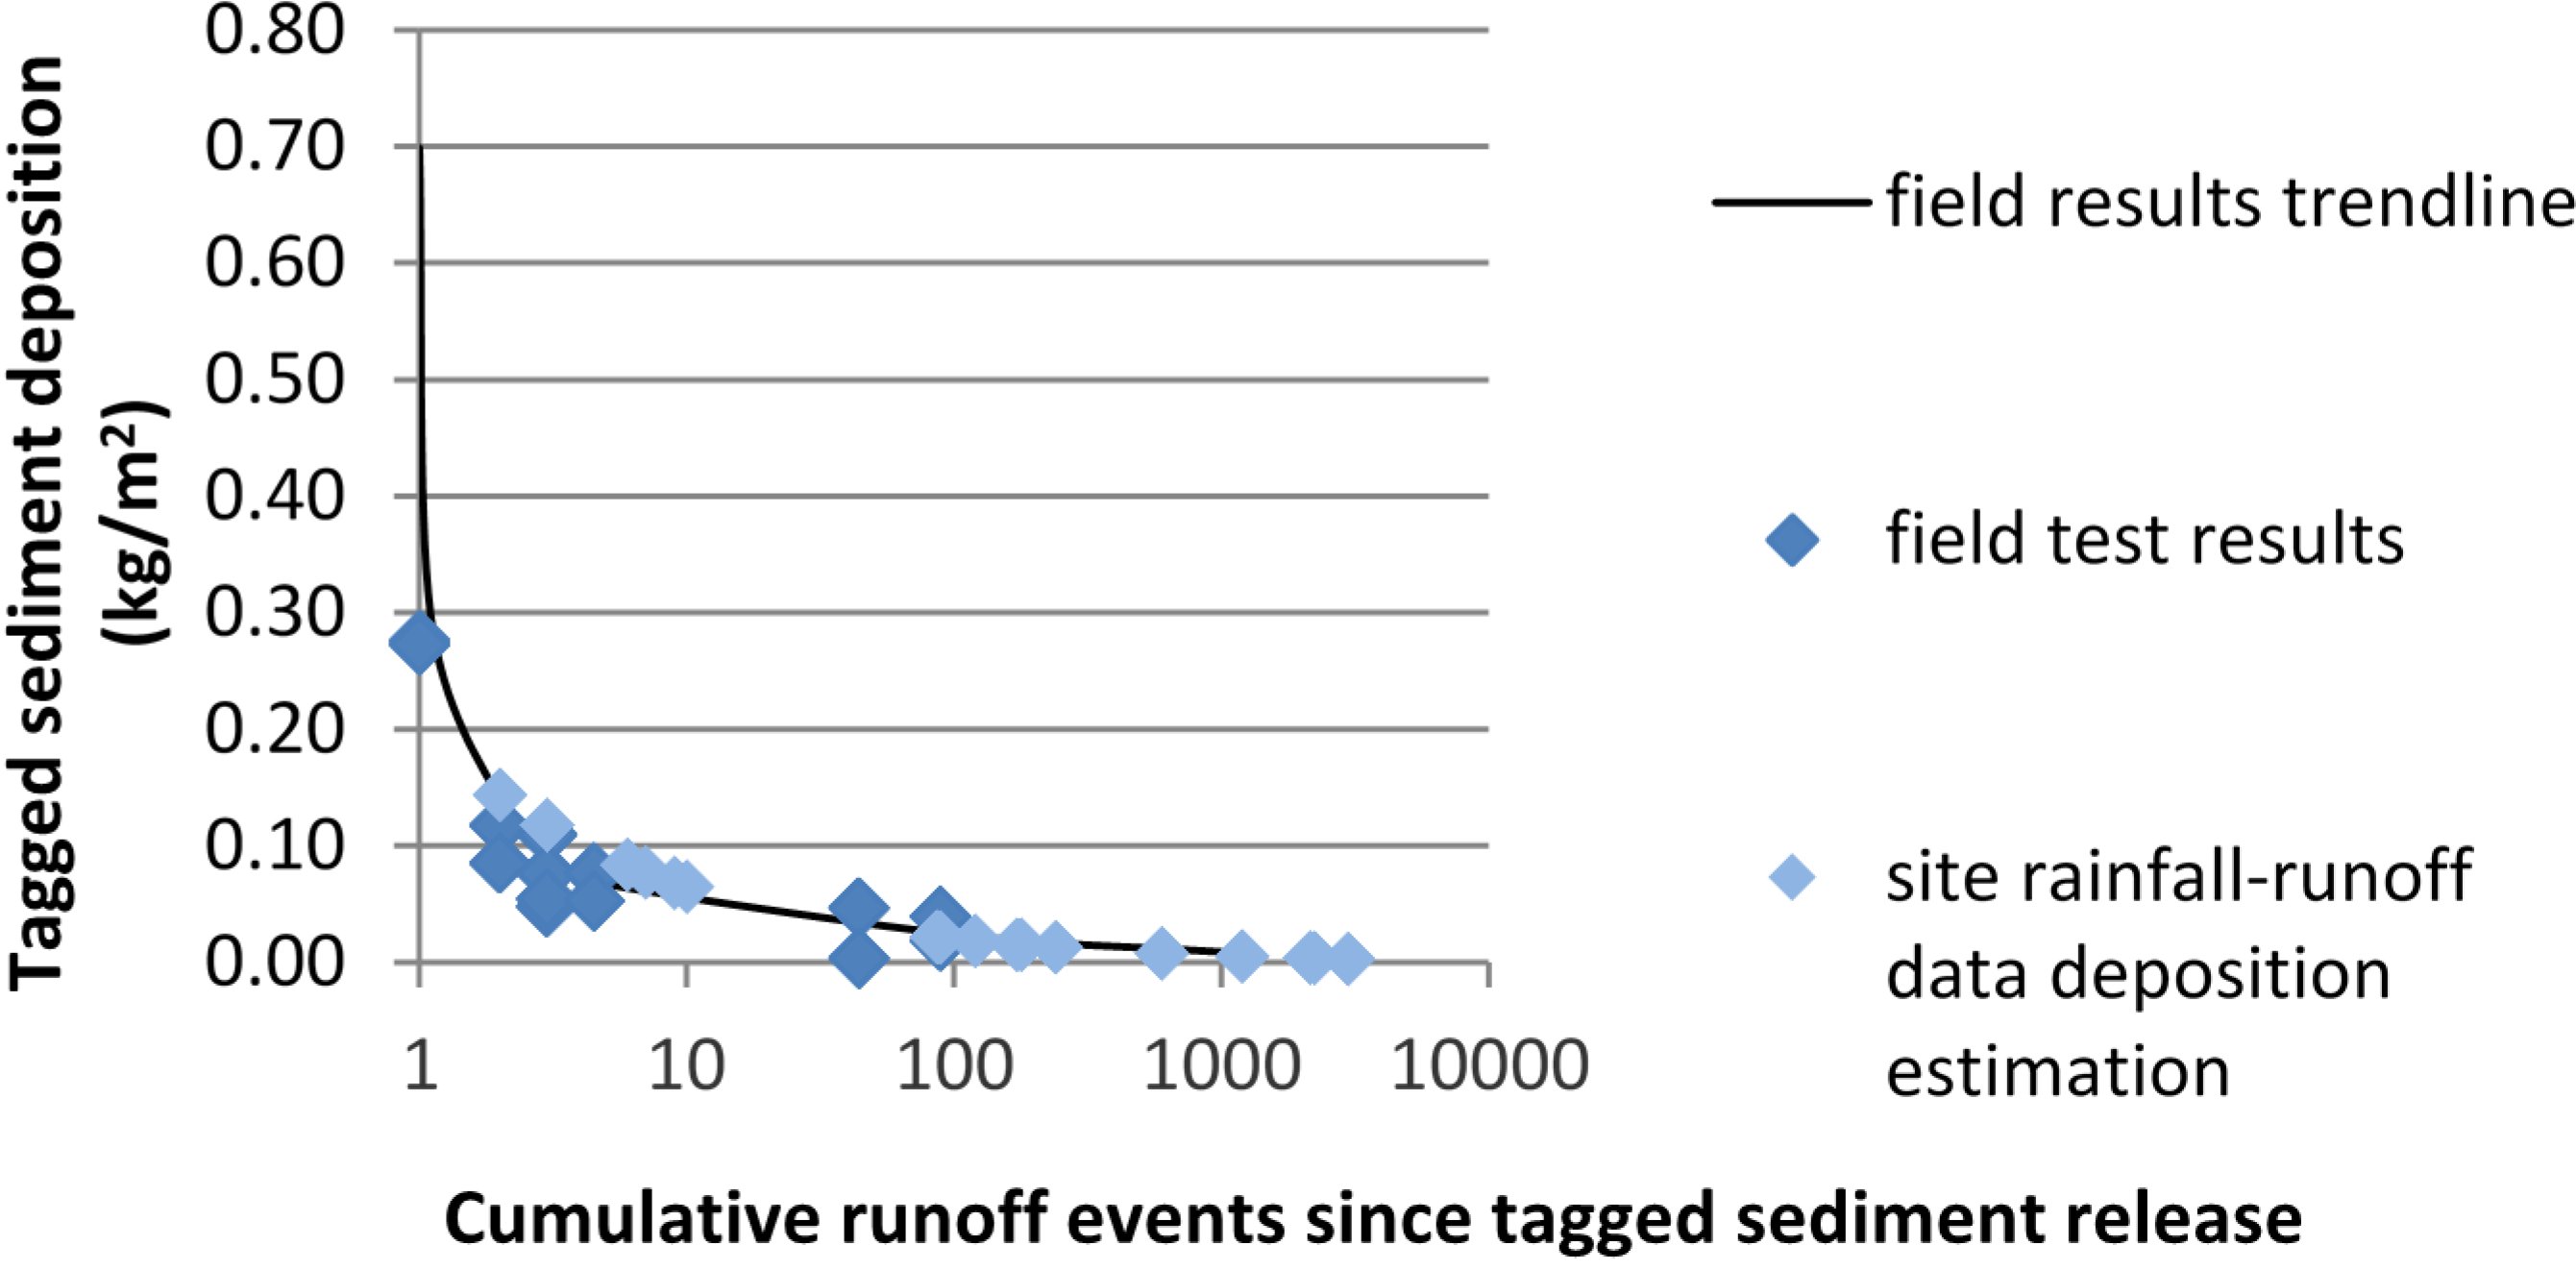
7. Conclusions
REO have been effectively used to trace urban sediment pollution through an ephemeral blue-green SuDS asset (swale). Rare earth tracing methodology, previously employed in agricultural and river bank erosion monitoring, has been implemented in an urban environment. An effective trace concentration has been identified through field trails, demonstrating the use of 10 g/kg REO trace to sediment ratio to be effective in the field. REO tracing has been monitored in these field tests over 12 months, providing an extended, multiple runoff event sediment transport dataset through an established swale that defines the intra event and extended time period sediment movement. REO methodology defined within this paper is effective for ephemeral vegetated stormwater sediment tracing, providing clear unique sediment tracing signatures over an extended field period, without significant degradation or loss to the receiving environment.
Intra-event REO monitoring highlights the occurrence of a flow initiated concentration peak in the initial and subsequent flow events through a swale. Extended field monitoring has proven that pollutant (tagged sediment) residency within the swale exceeds six months, although there is a continued depletion of the quantity of sediment detained within the swale as a result of continued runoff events through the swale over time. Using a single tagged sediment release methodology, the resuspension, deposition and loss through conveyance of sediment in the swale is shown to change. Bed deposition and trapping efficiency are found to decrease progressively over multiple runoff events. Extrapolating from the field results, a tentative estimation of 25-year swale detention efficiency is calculated to be 3% of the initial inflow deposition.
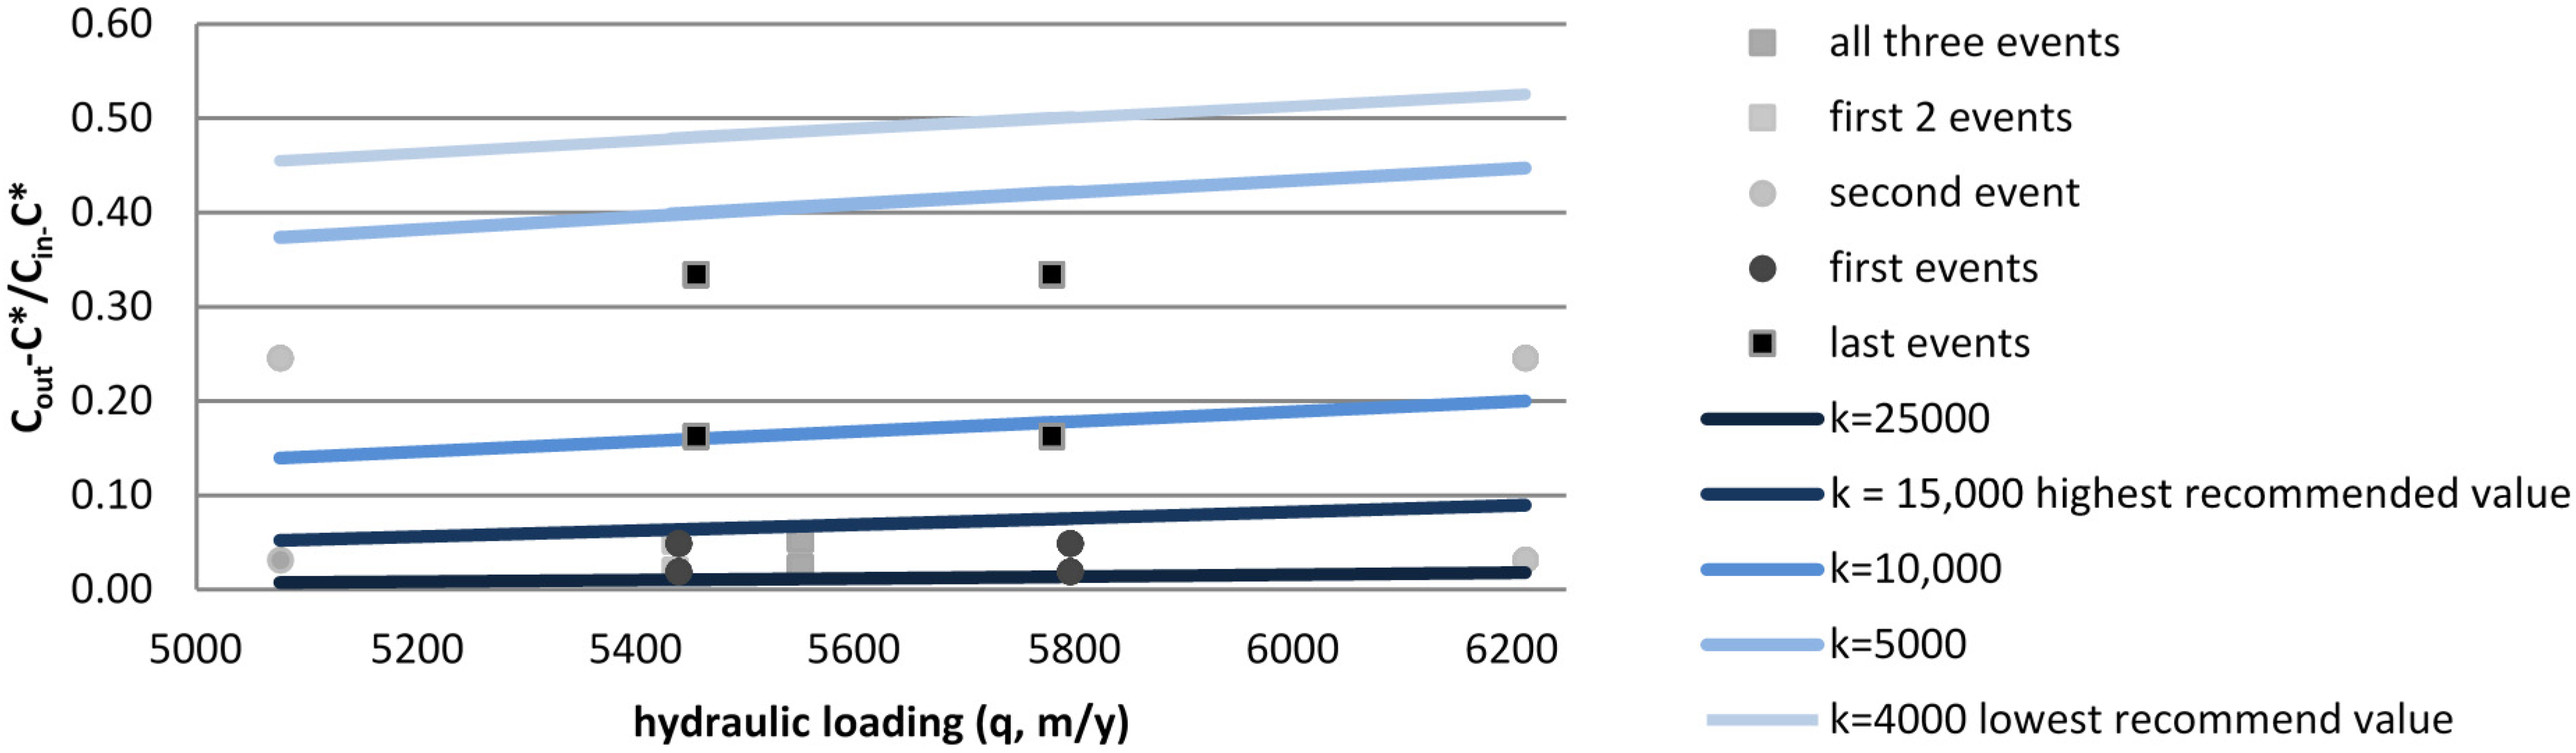
This analysis considers use of the first order decay model to calculate long-term deposition. Field results show that while initial event sediment trapping or detention can be reflected through the k-
C* model, inclusion of subsequent events results illustrates the constraint in implementing k as a constant. Using the trapping efficiency equation defined by Deletic (2005) [
49], the direct relationship between multiple event sediment concentration change and trapping efficiency has been proven. When multiple events are considered, k functions as a coefficient rather than a constant, supporting a positive change in trapping efficiency. The sediment trapping efficiency is influenced by event occurrence over time. This can be reflected through a decrease in k values over an extended, multiple runoff event analysis period of a single sediment release. While this field research illustrates a range of k values representative of this specific blue-green drainage assets within the local Scottish environment, the advancement of the first order decay model and definition of a novel and effective long term sediment SuDS analysis methodology have been demonstrated.


