
Urban Flood Mapping Based on Unmanned Aerial Vehicle Remote Sensing and Random Forest Classifier—A Case of Yuyao, China


Abstract
:
1. Introduction
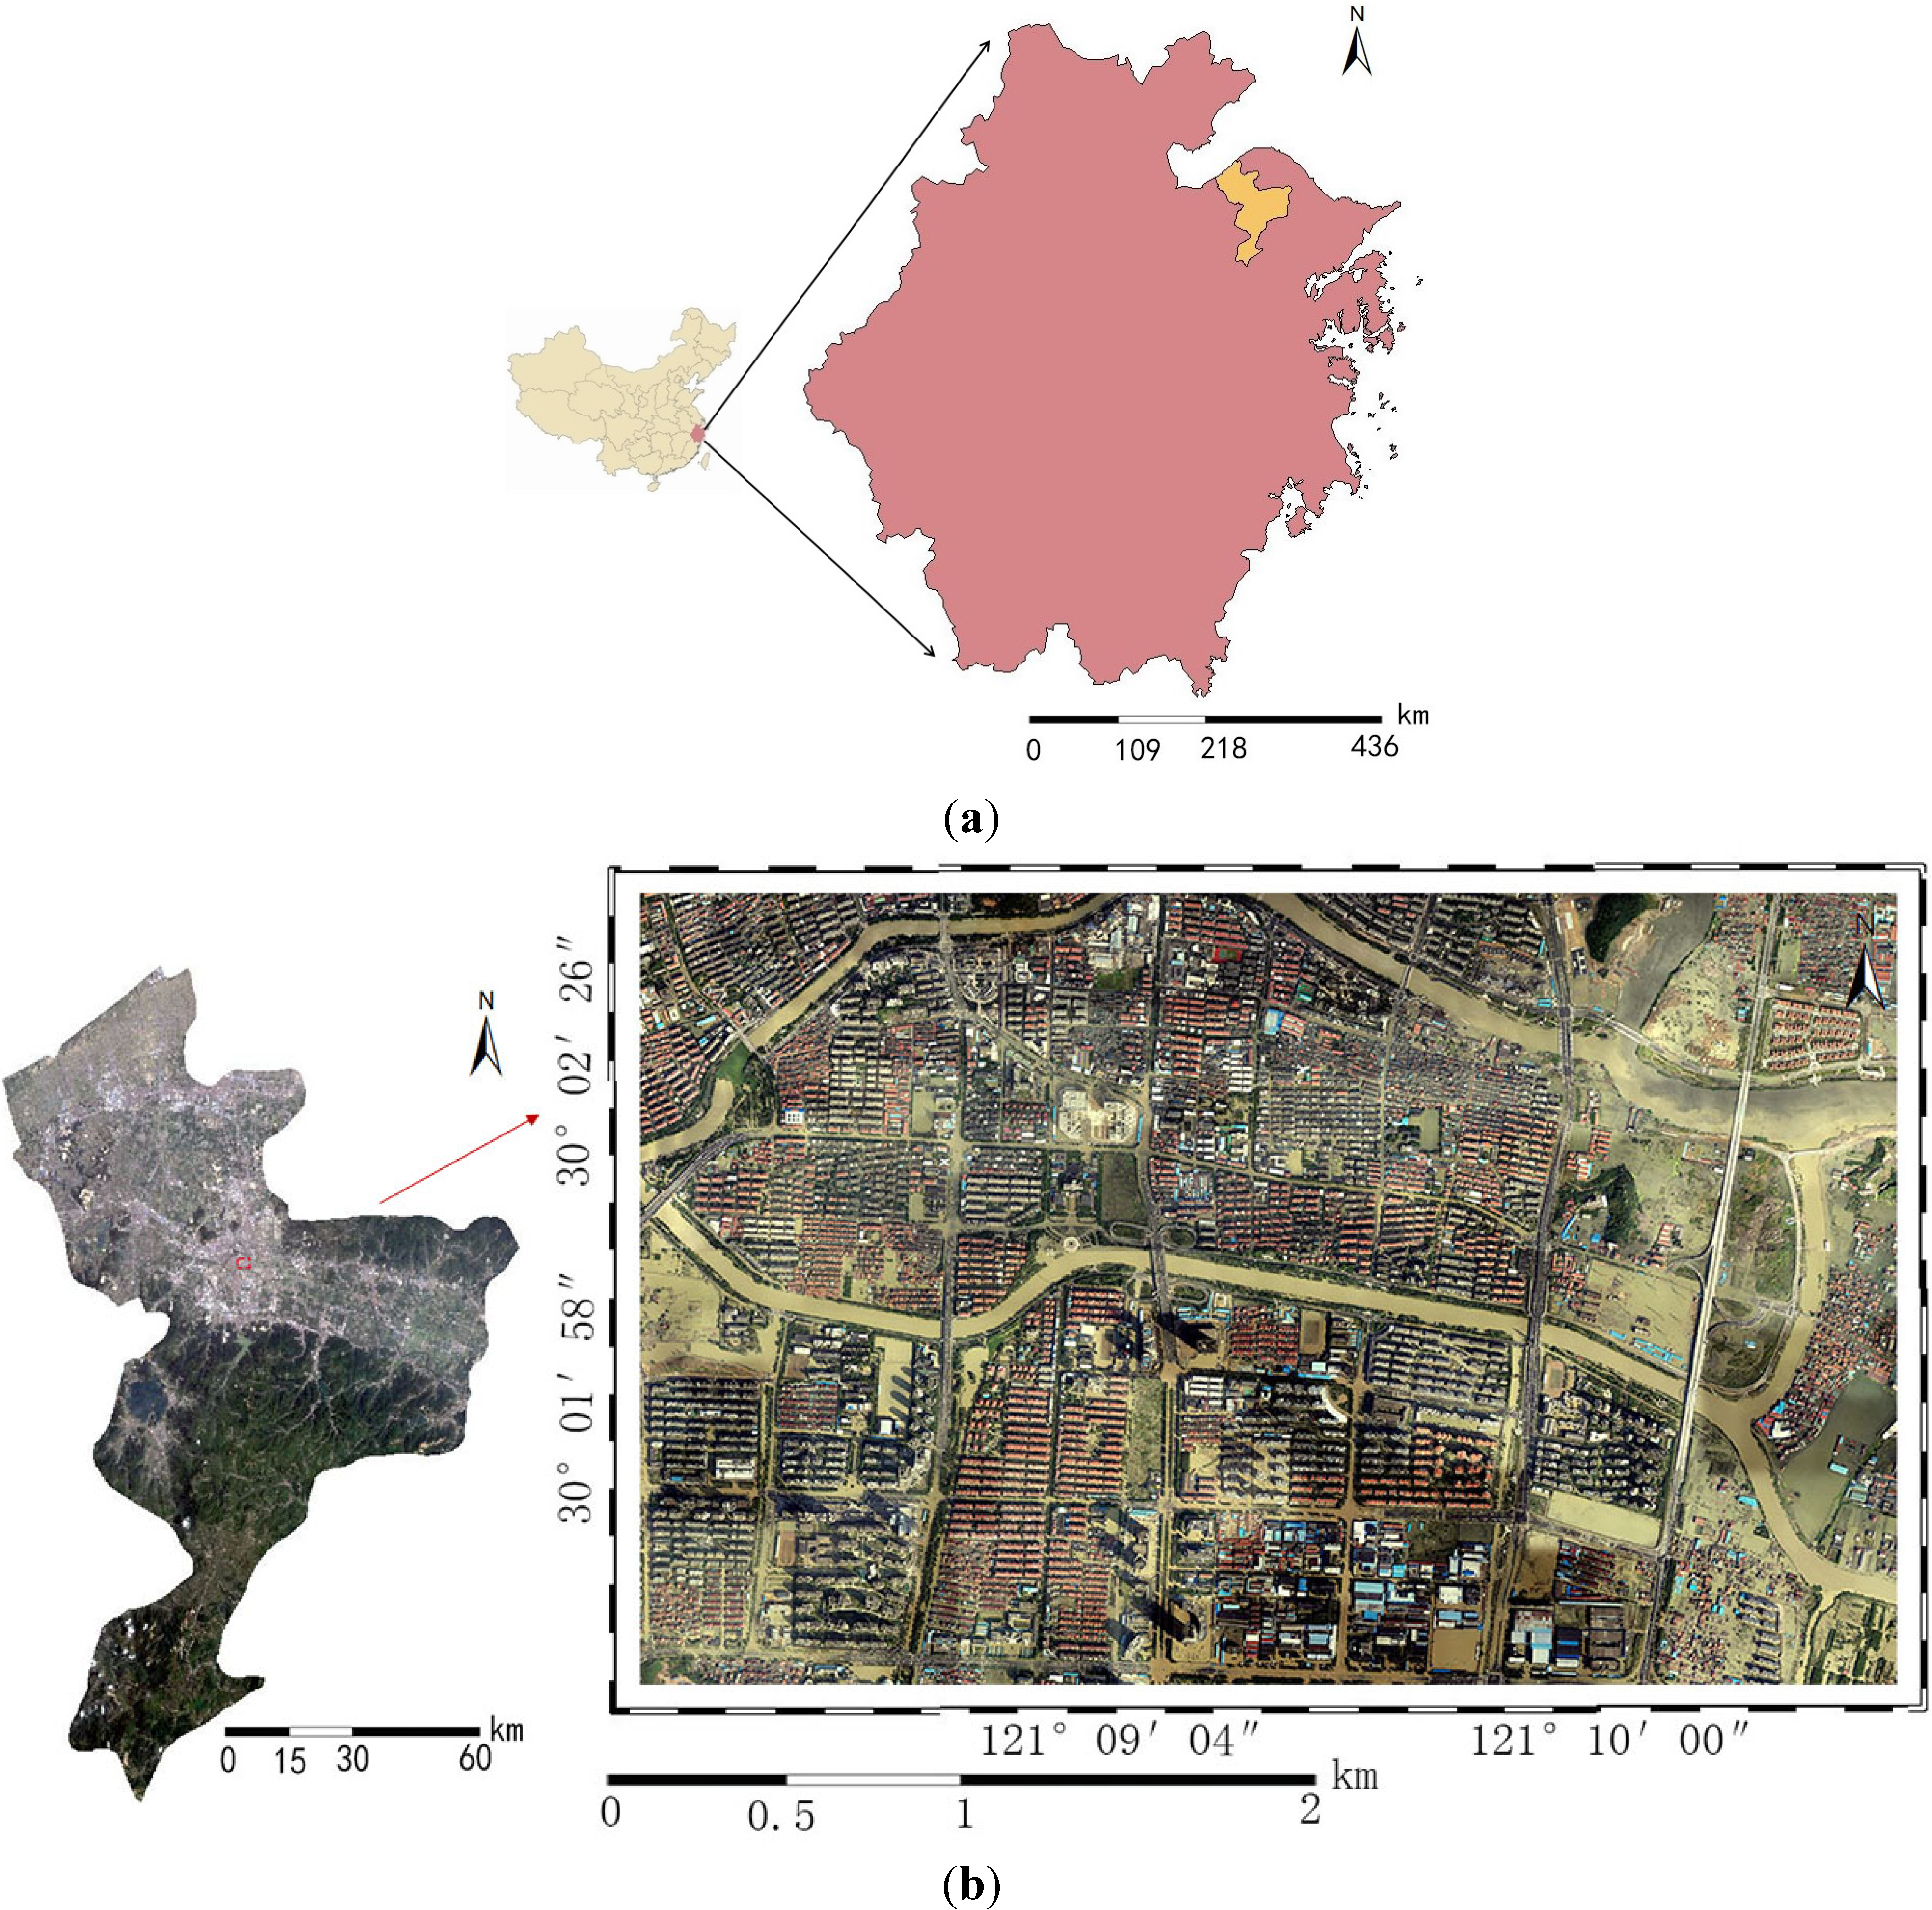
2. Study Area

3. Methods
3.1. Workflow

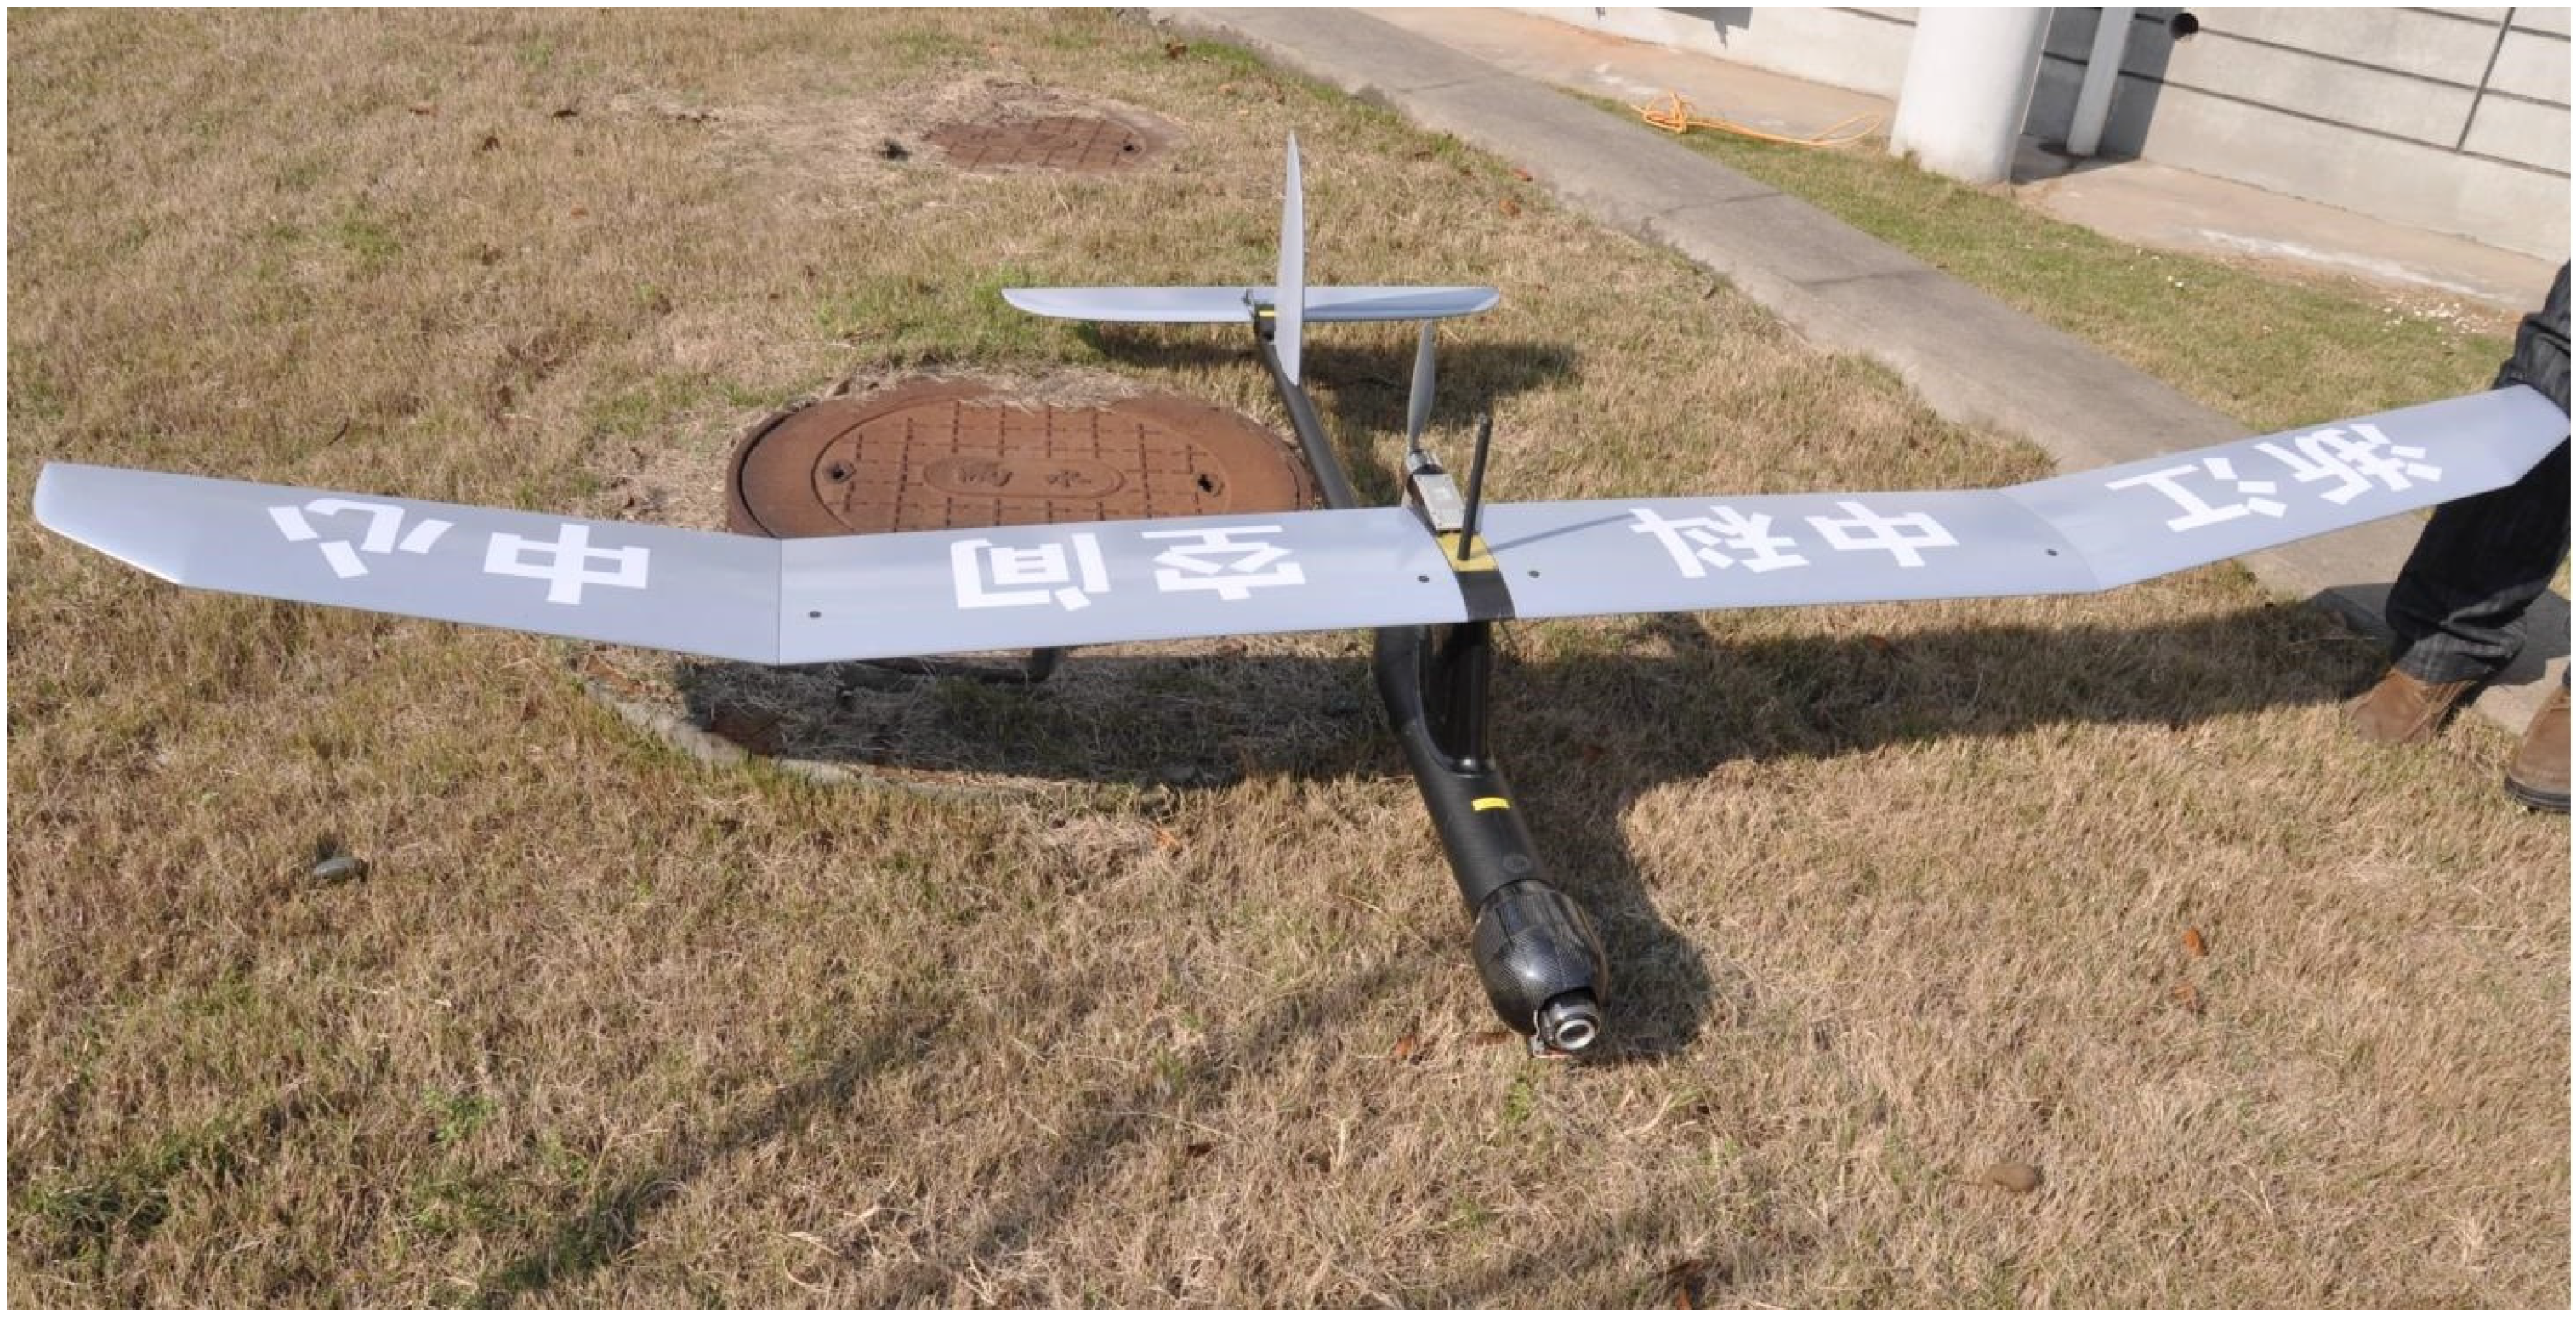
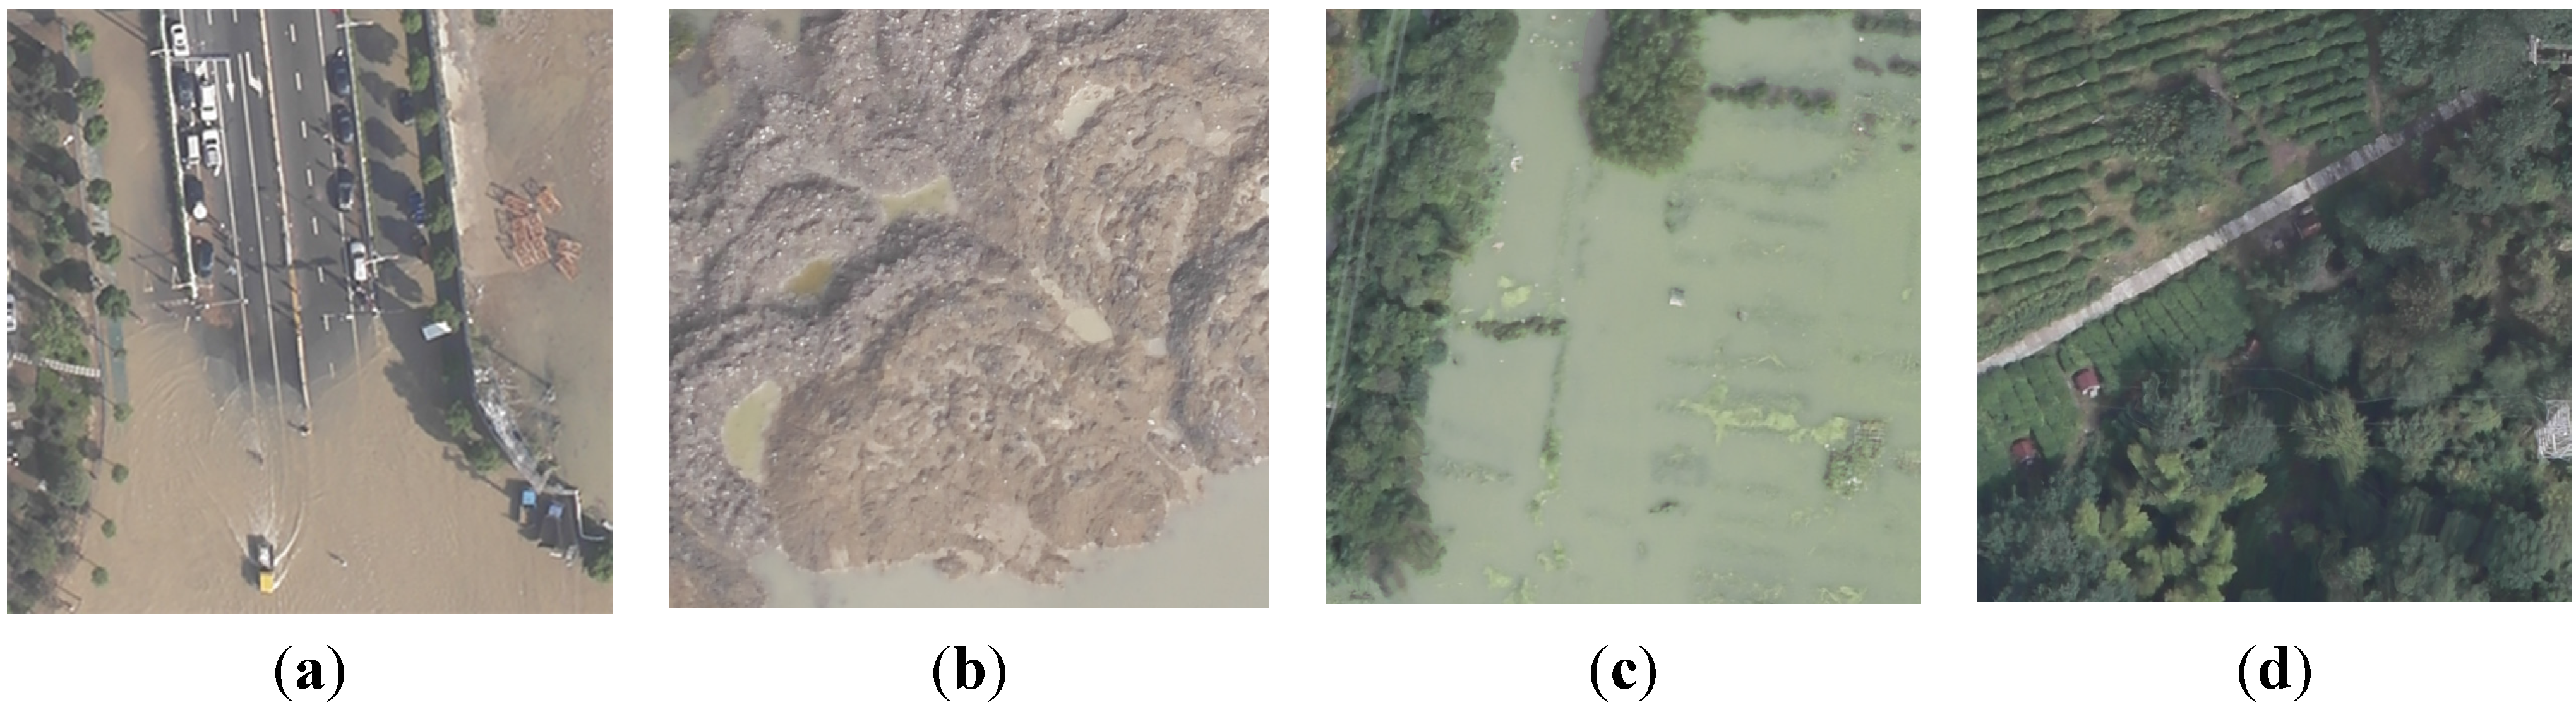
3.2. Data Acquisition and Preprocessing


3.3. Texture Analysis

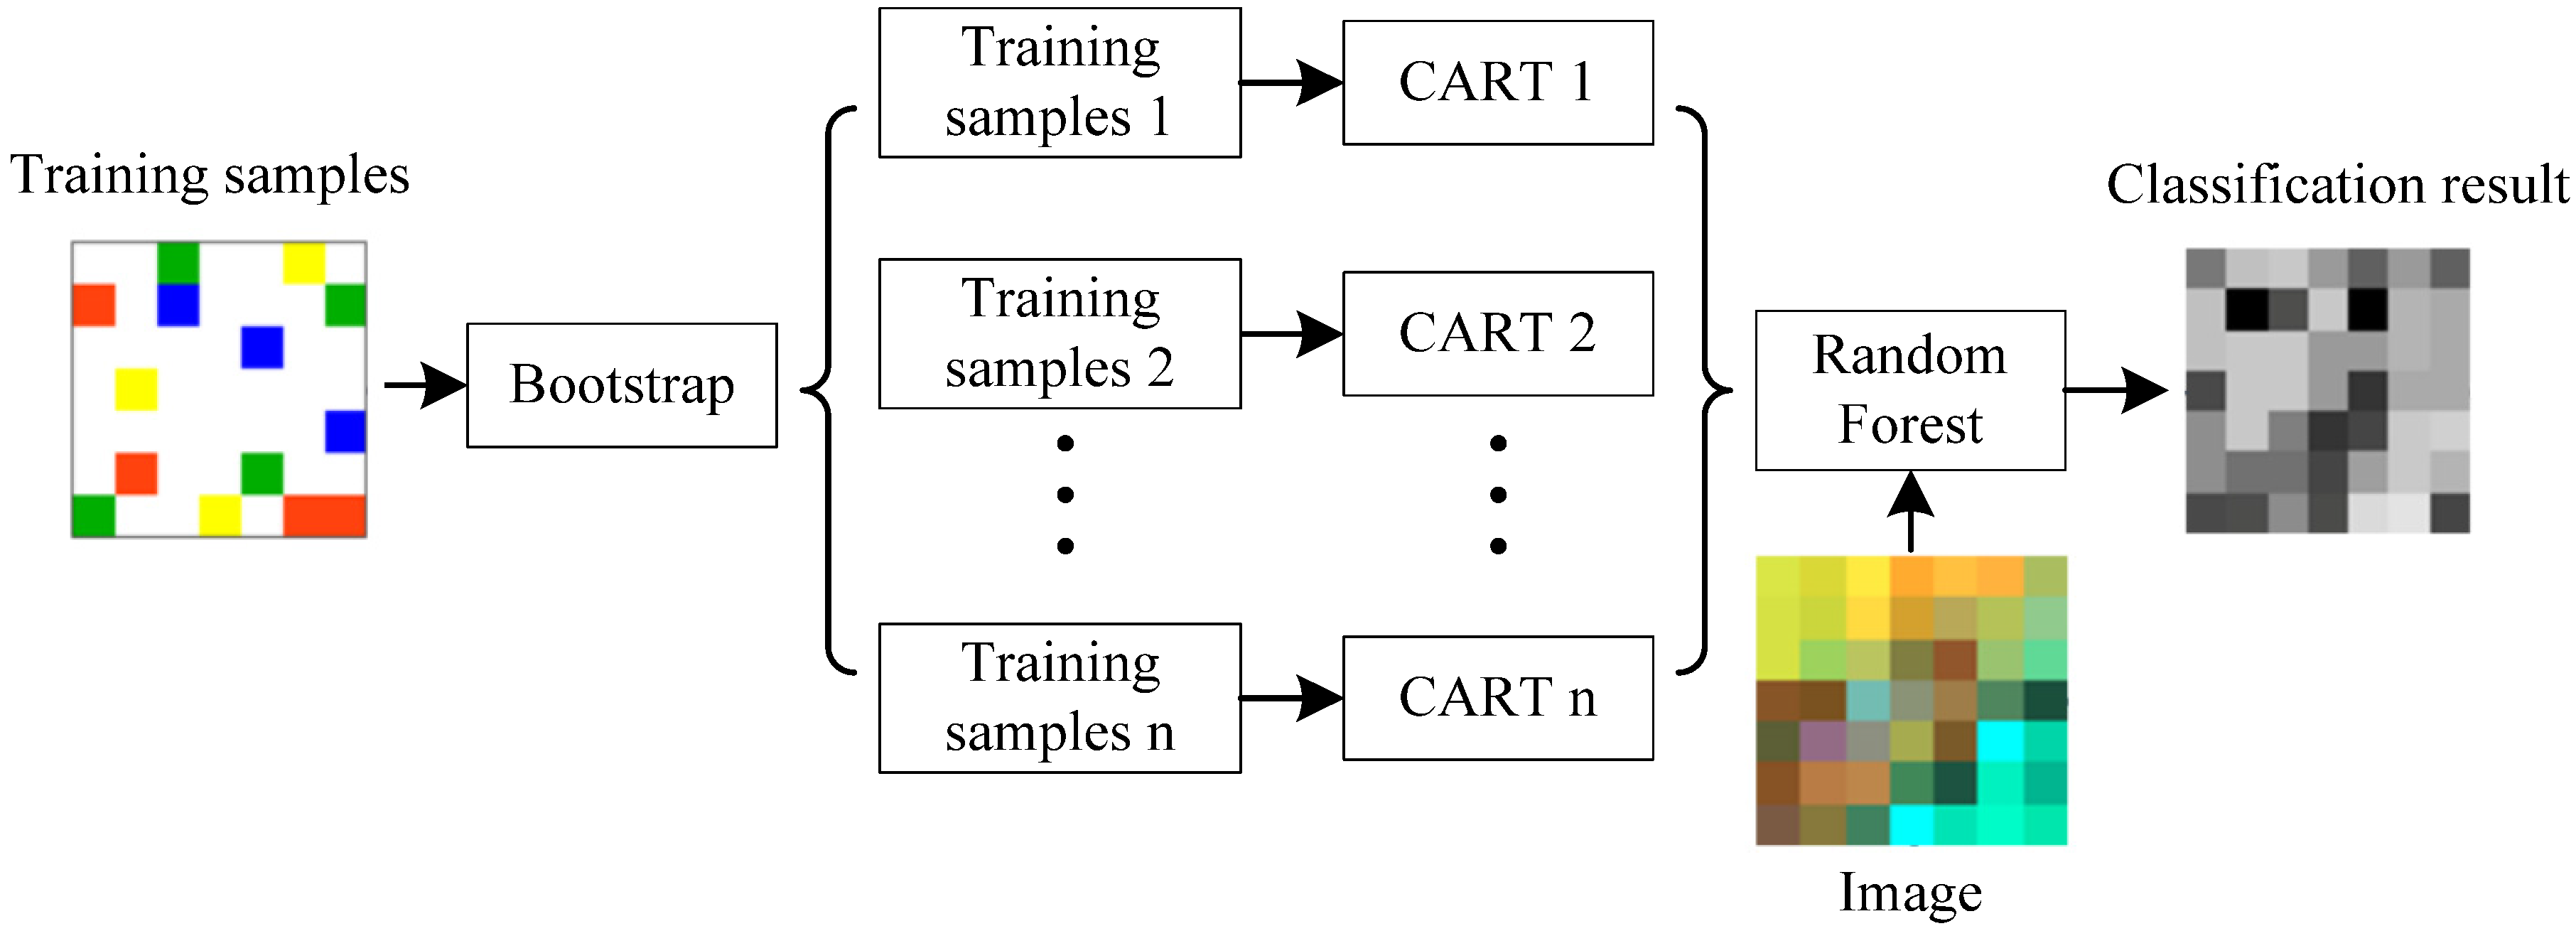
3.4. Random Forest Classifier

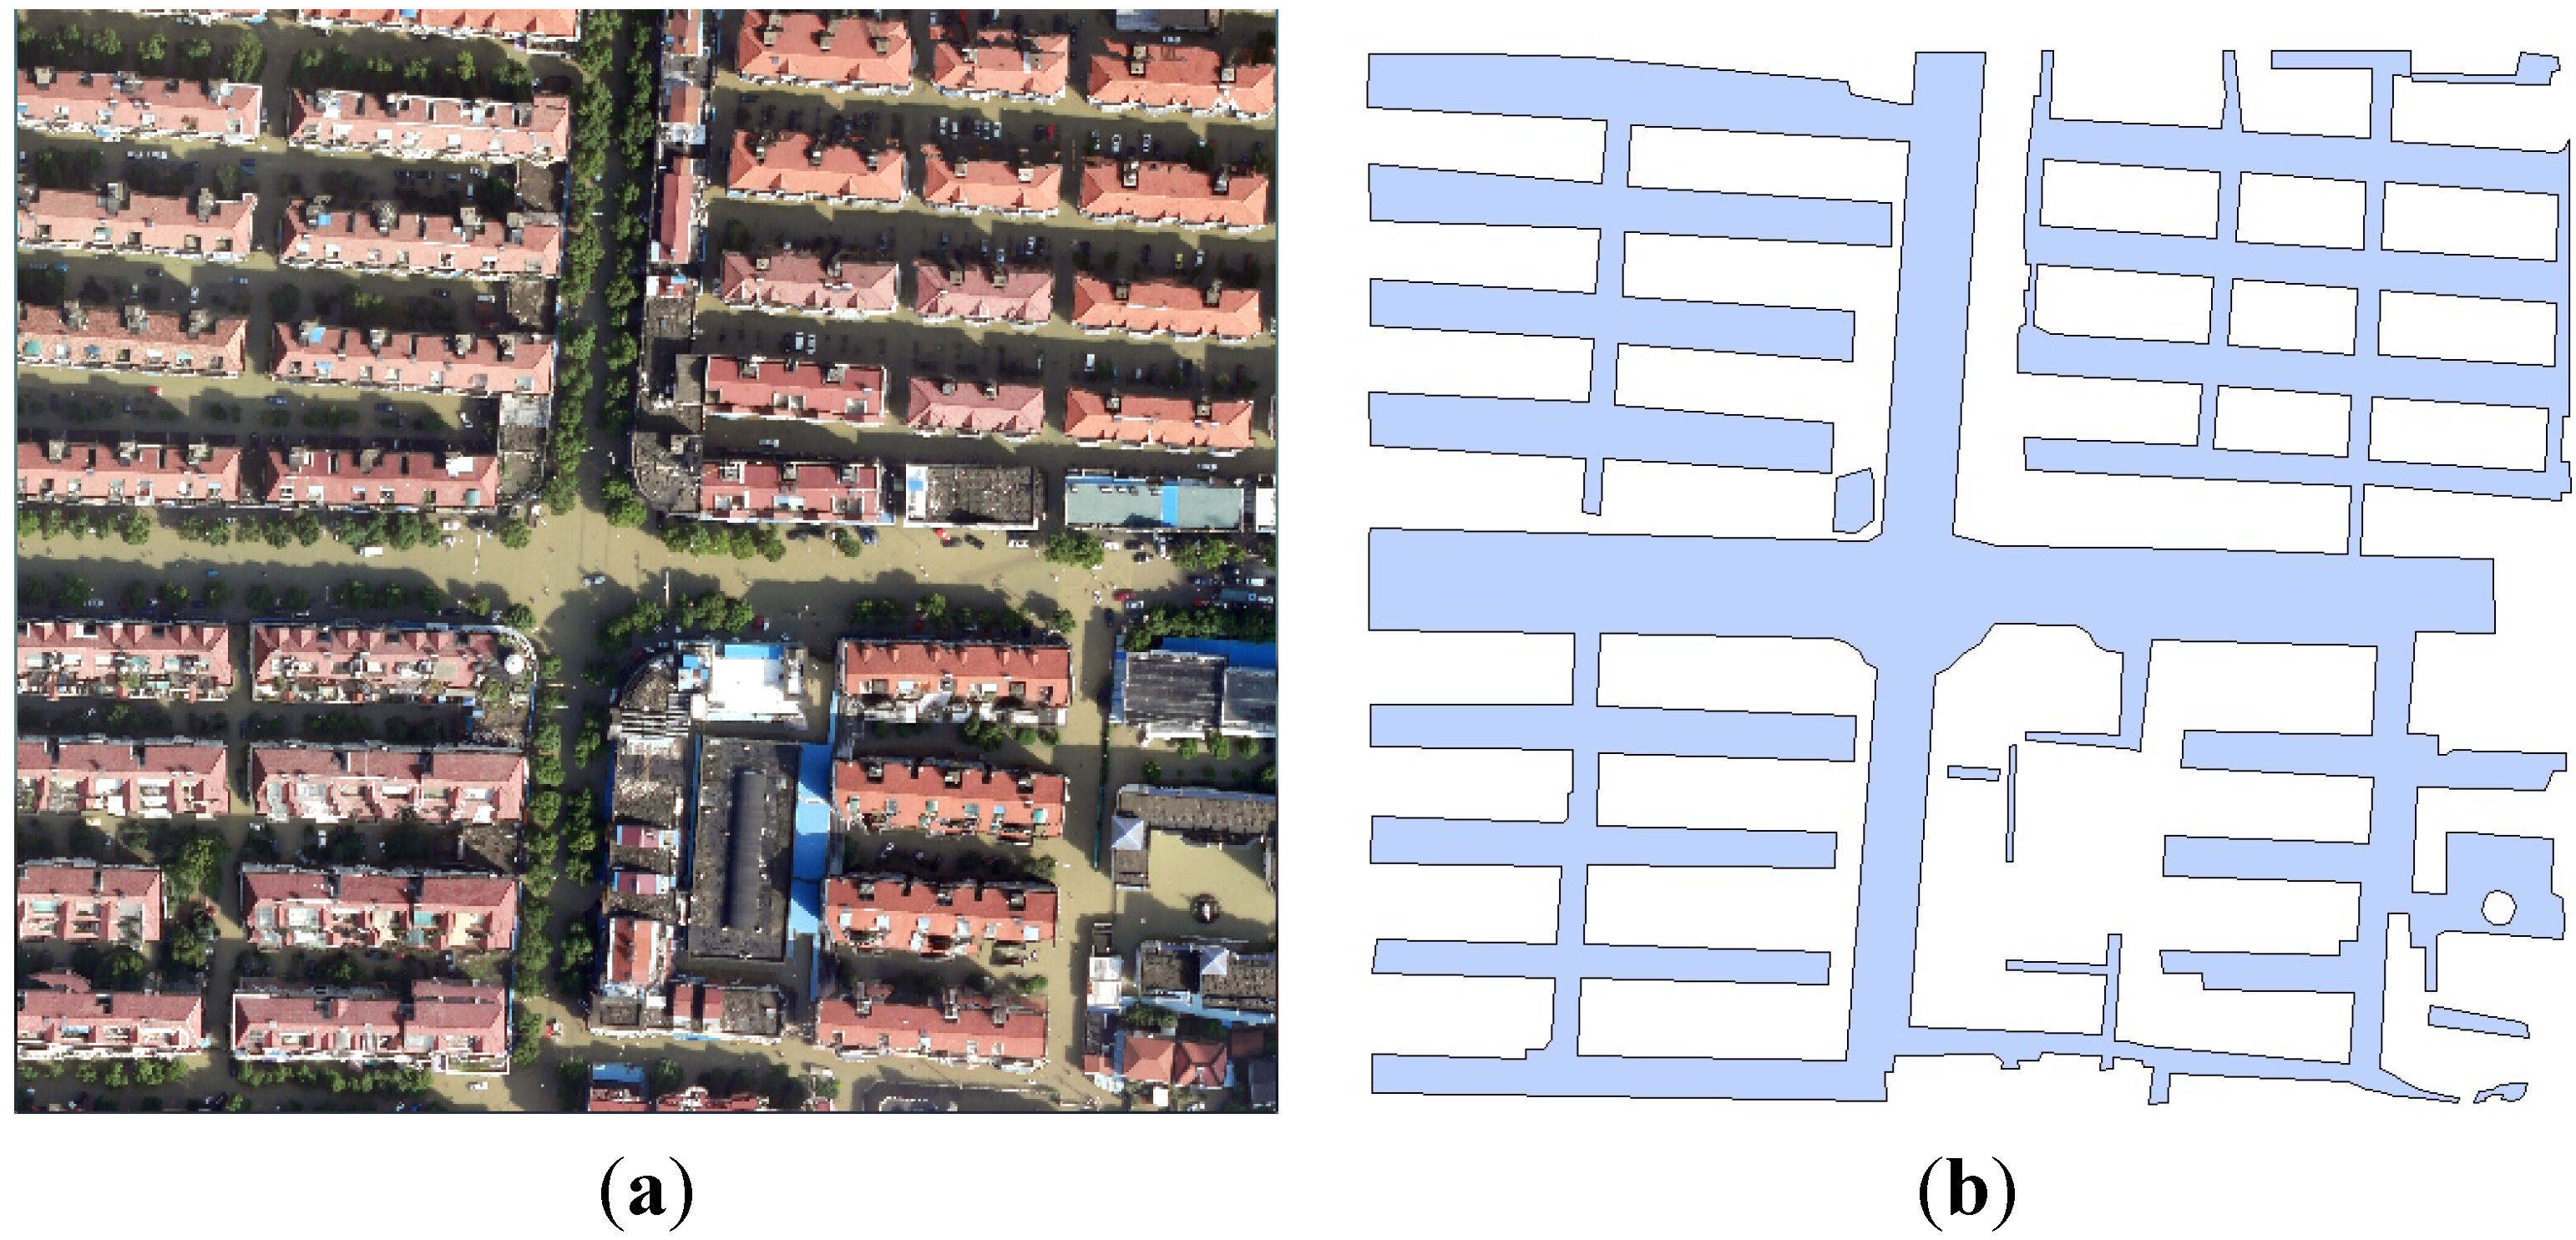
3.5. Accuracy Assessment
4. Results
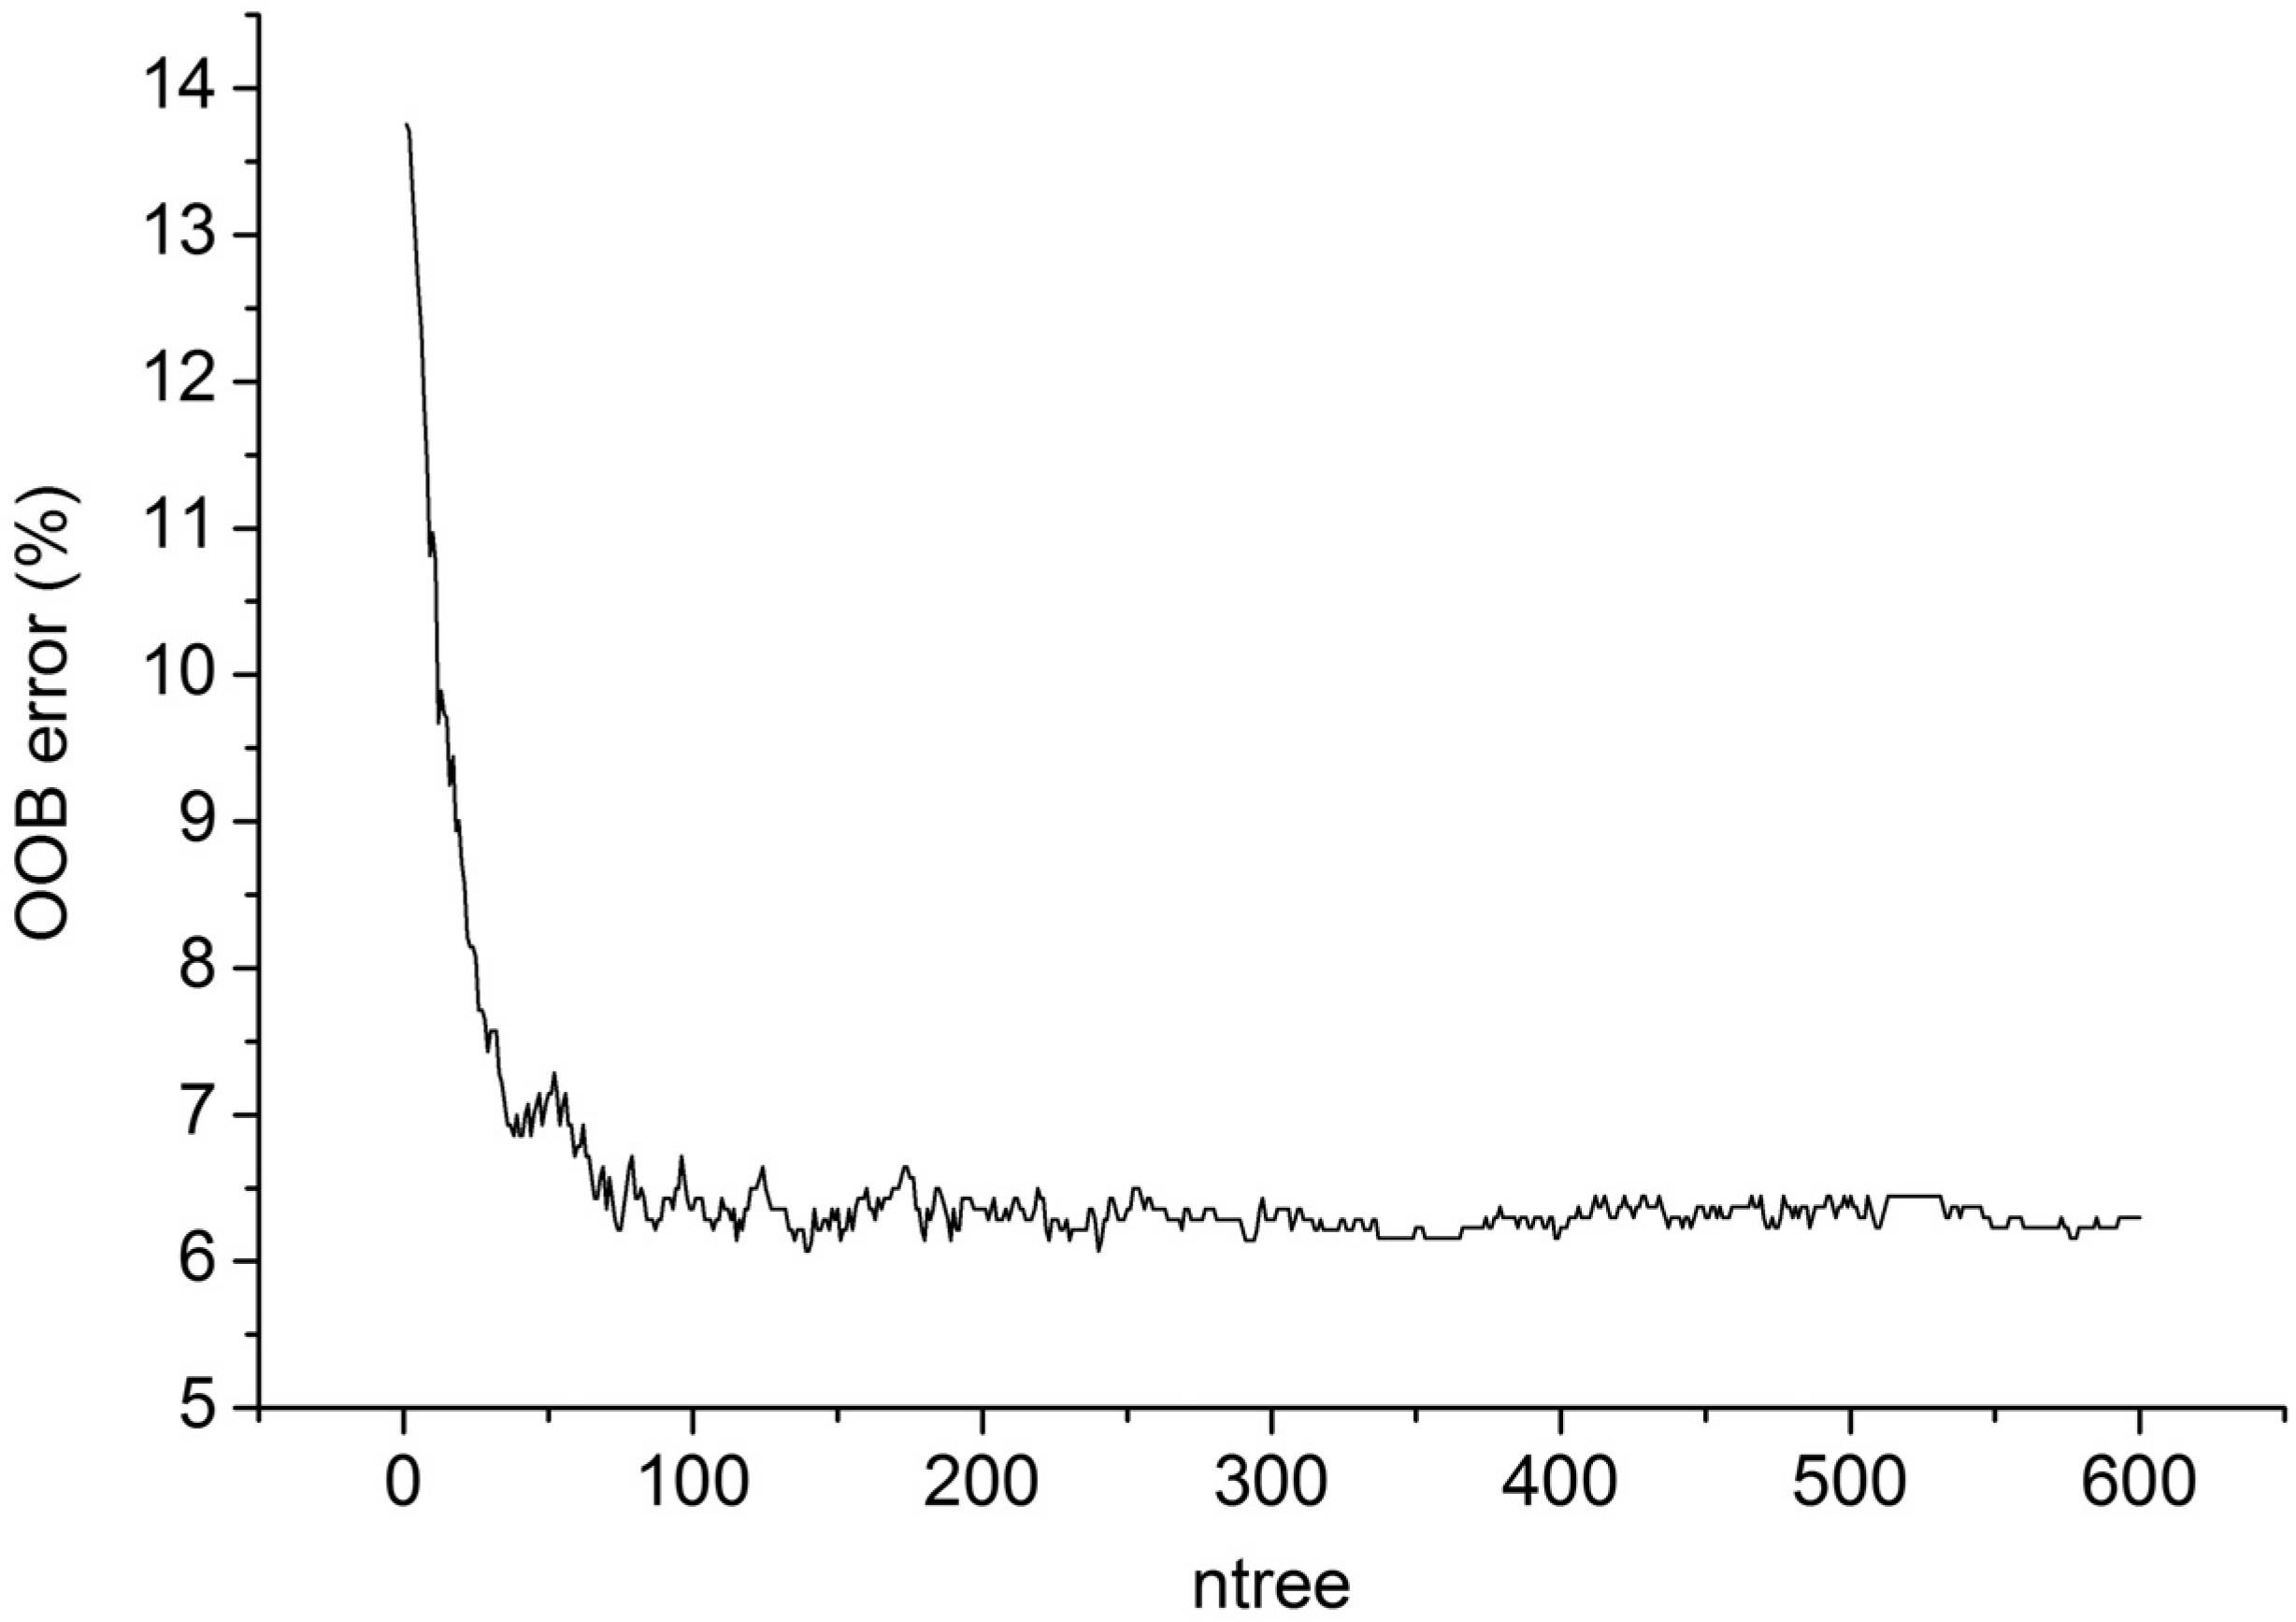
4.1. Parameterization of Random Forest

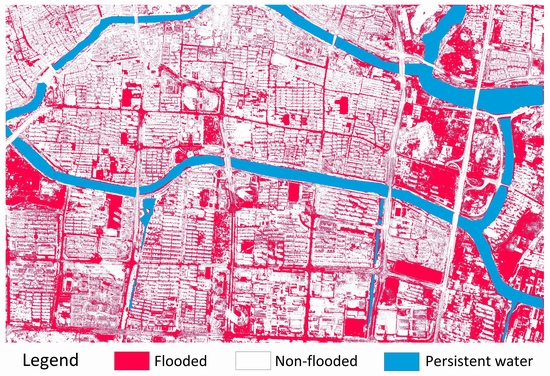
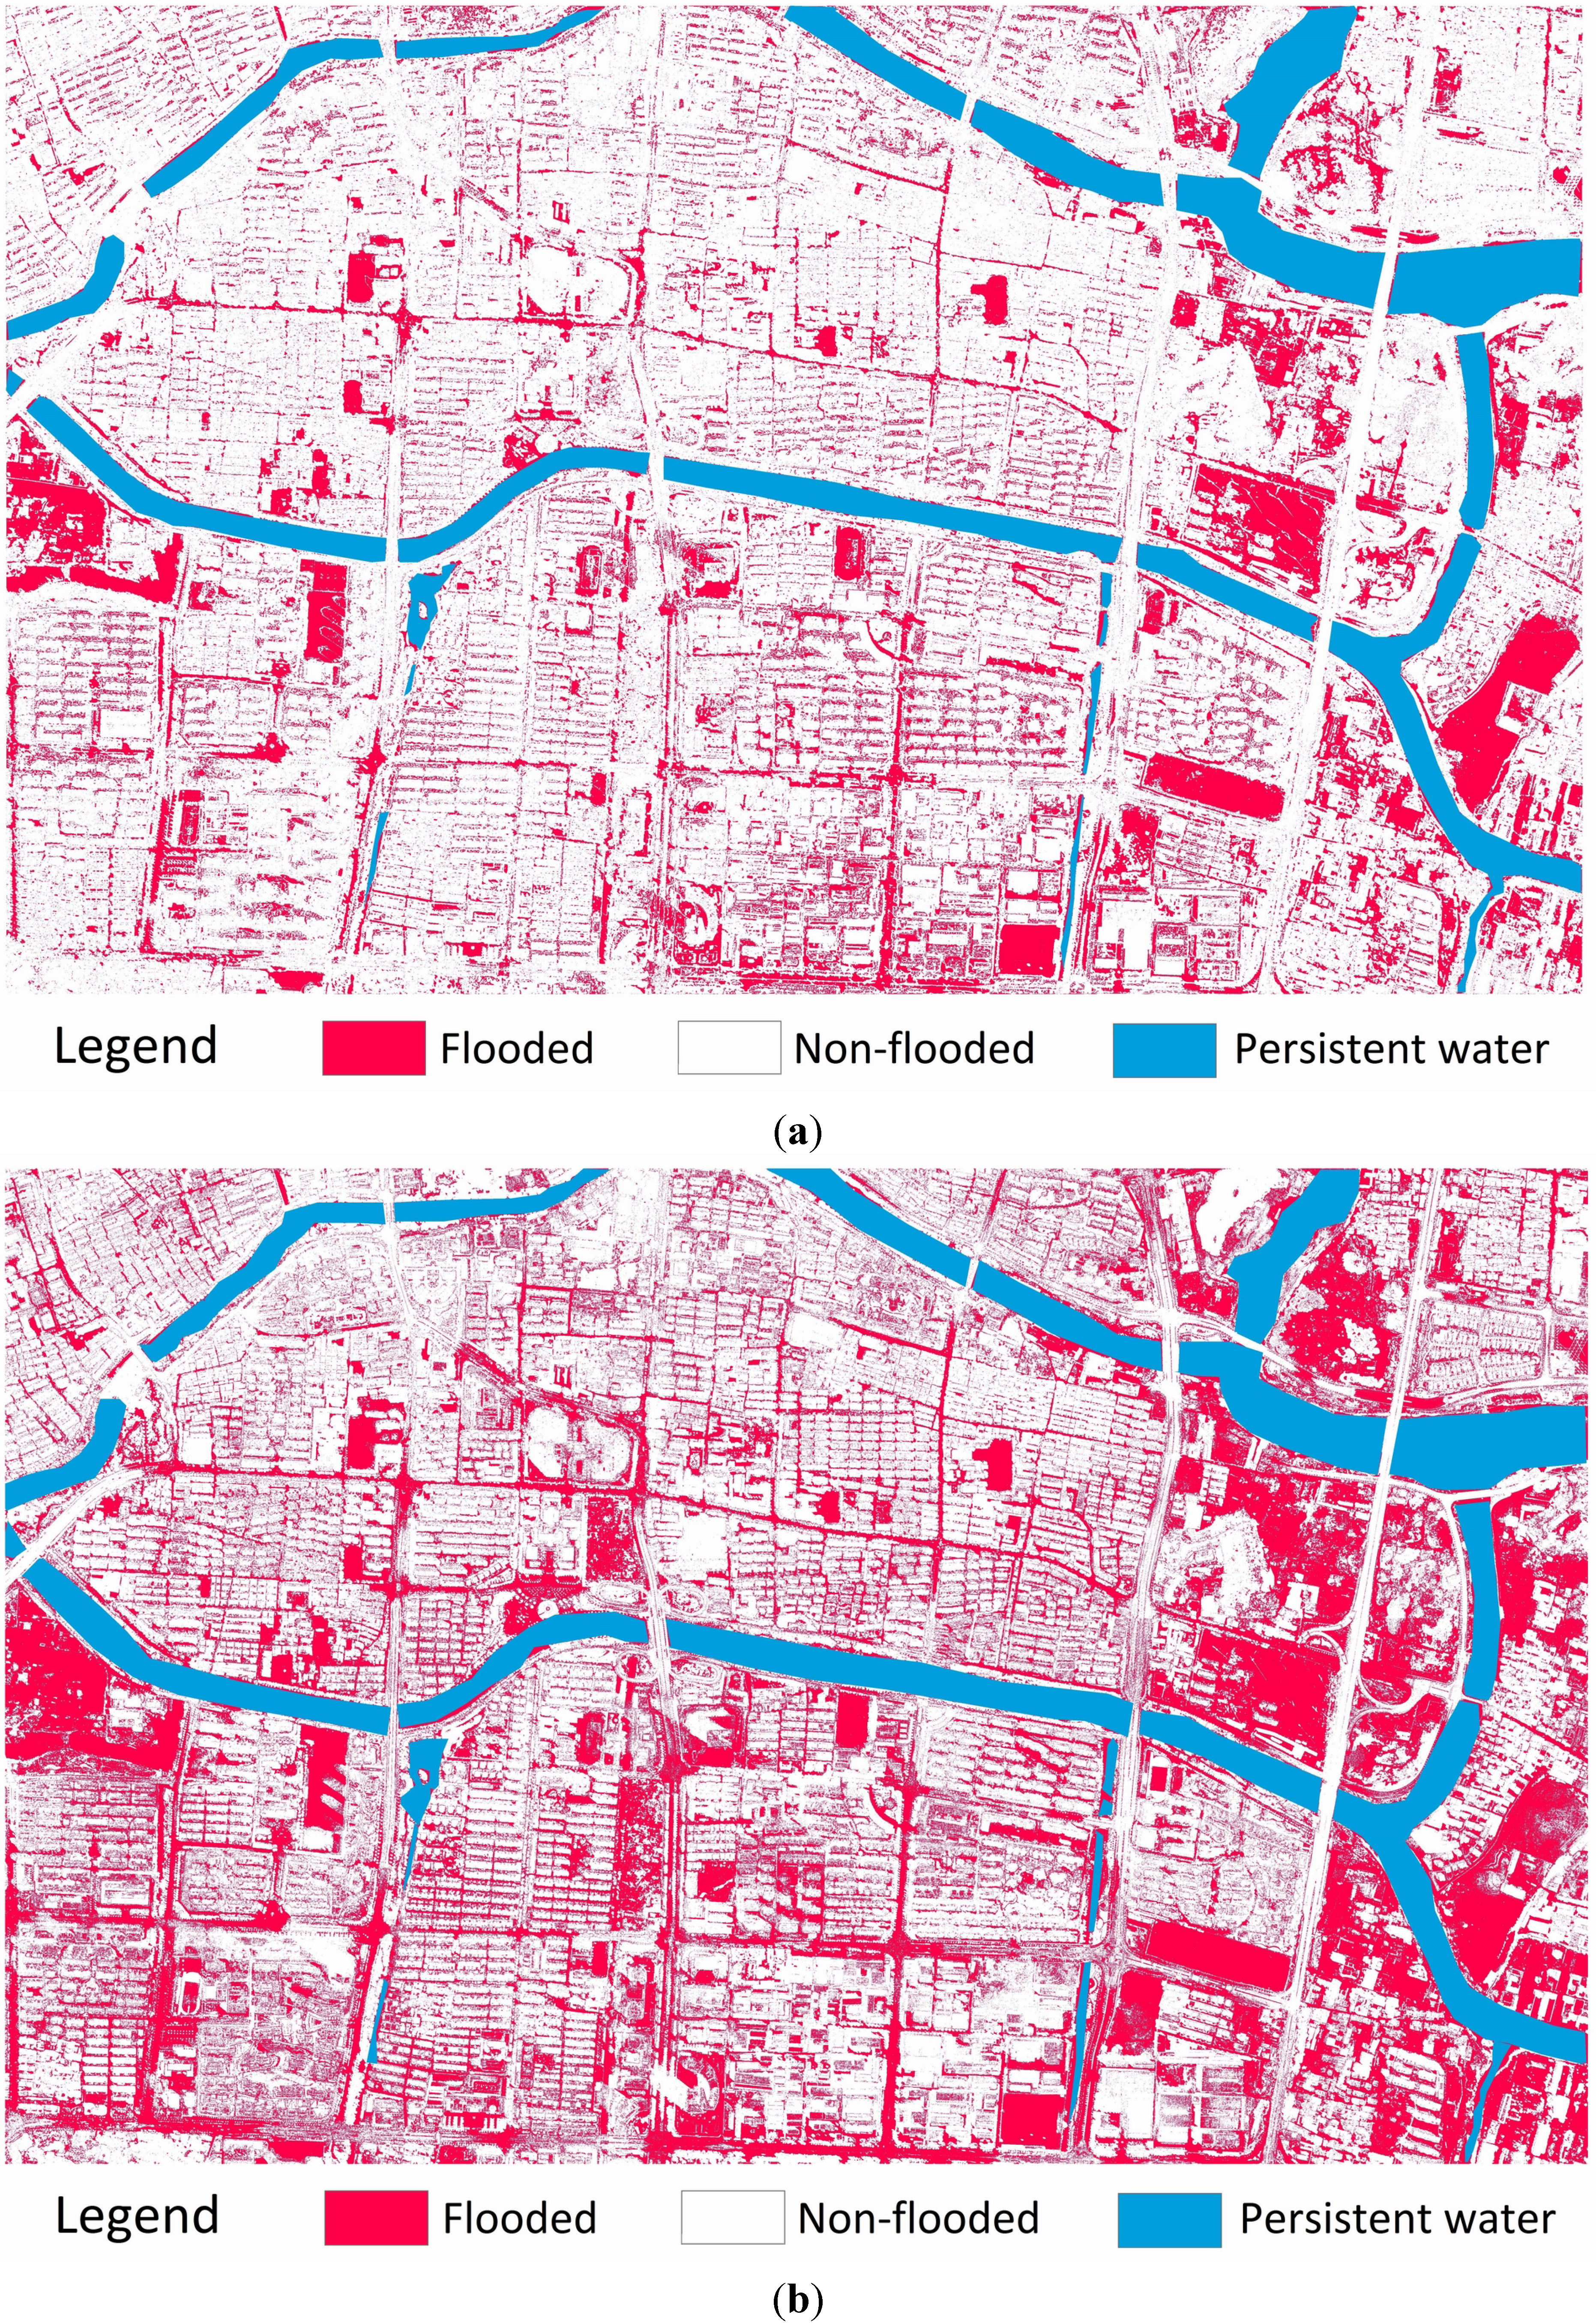
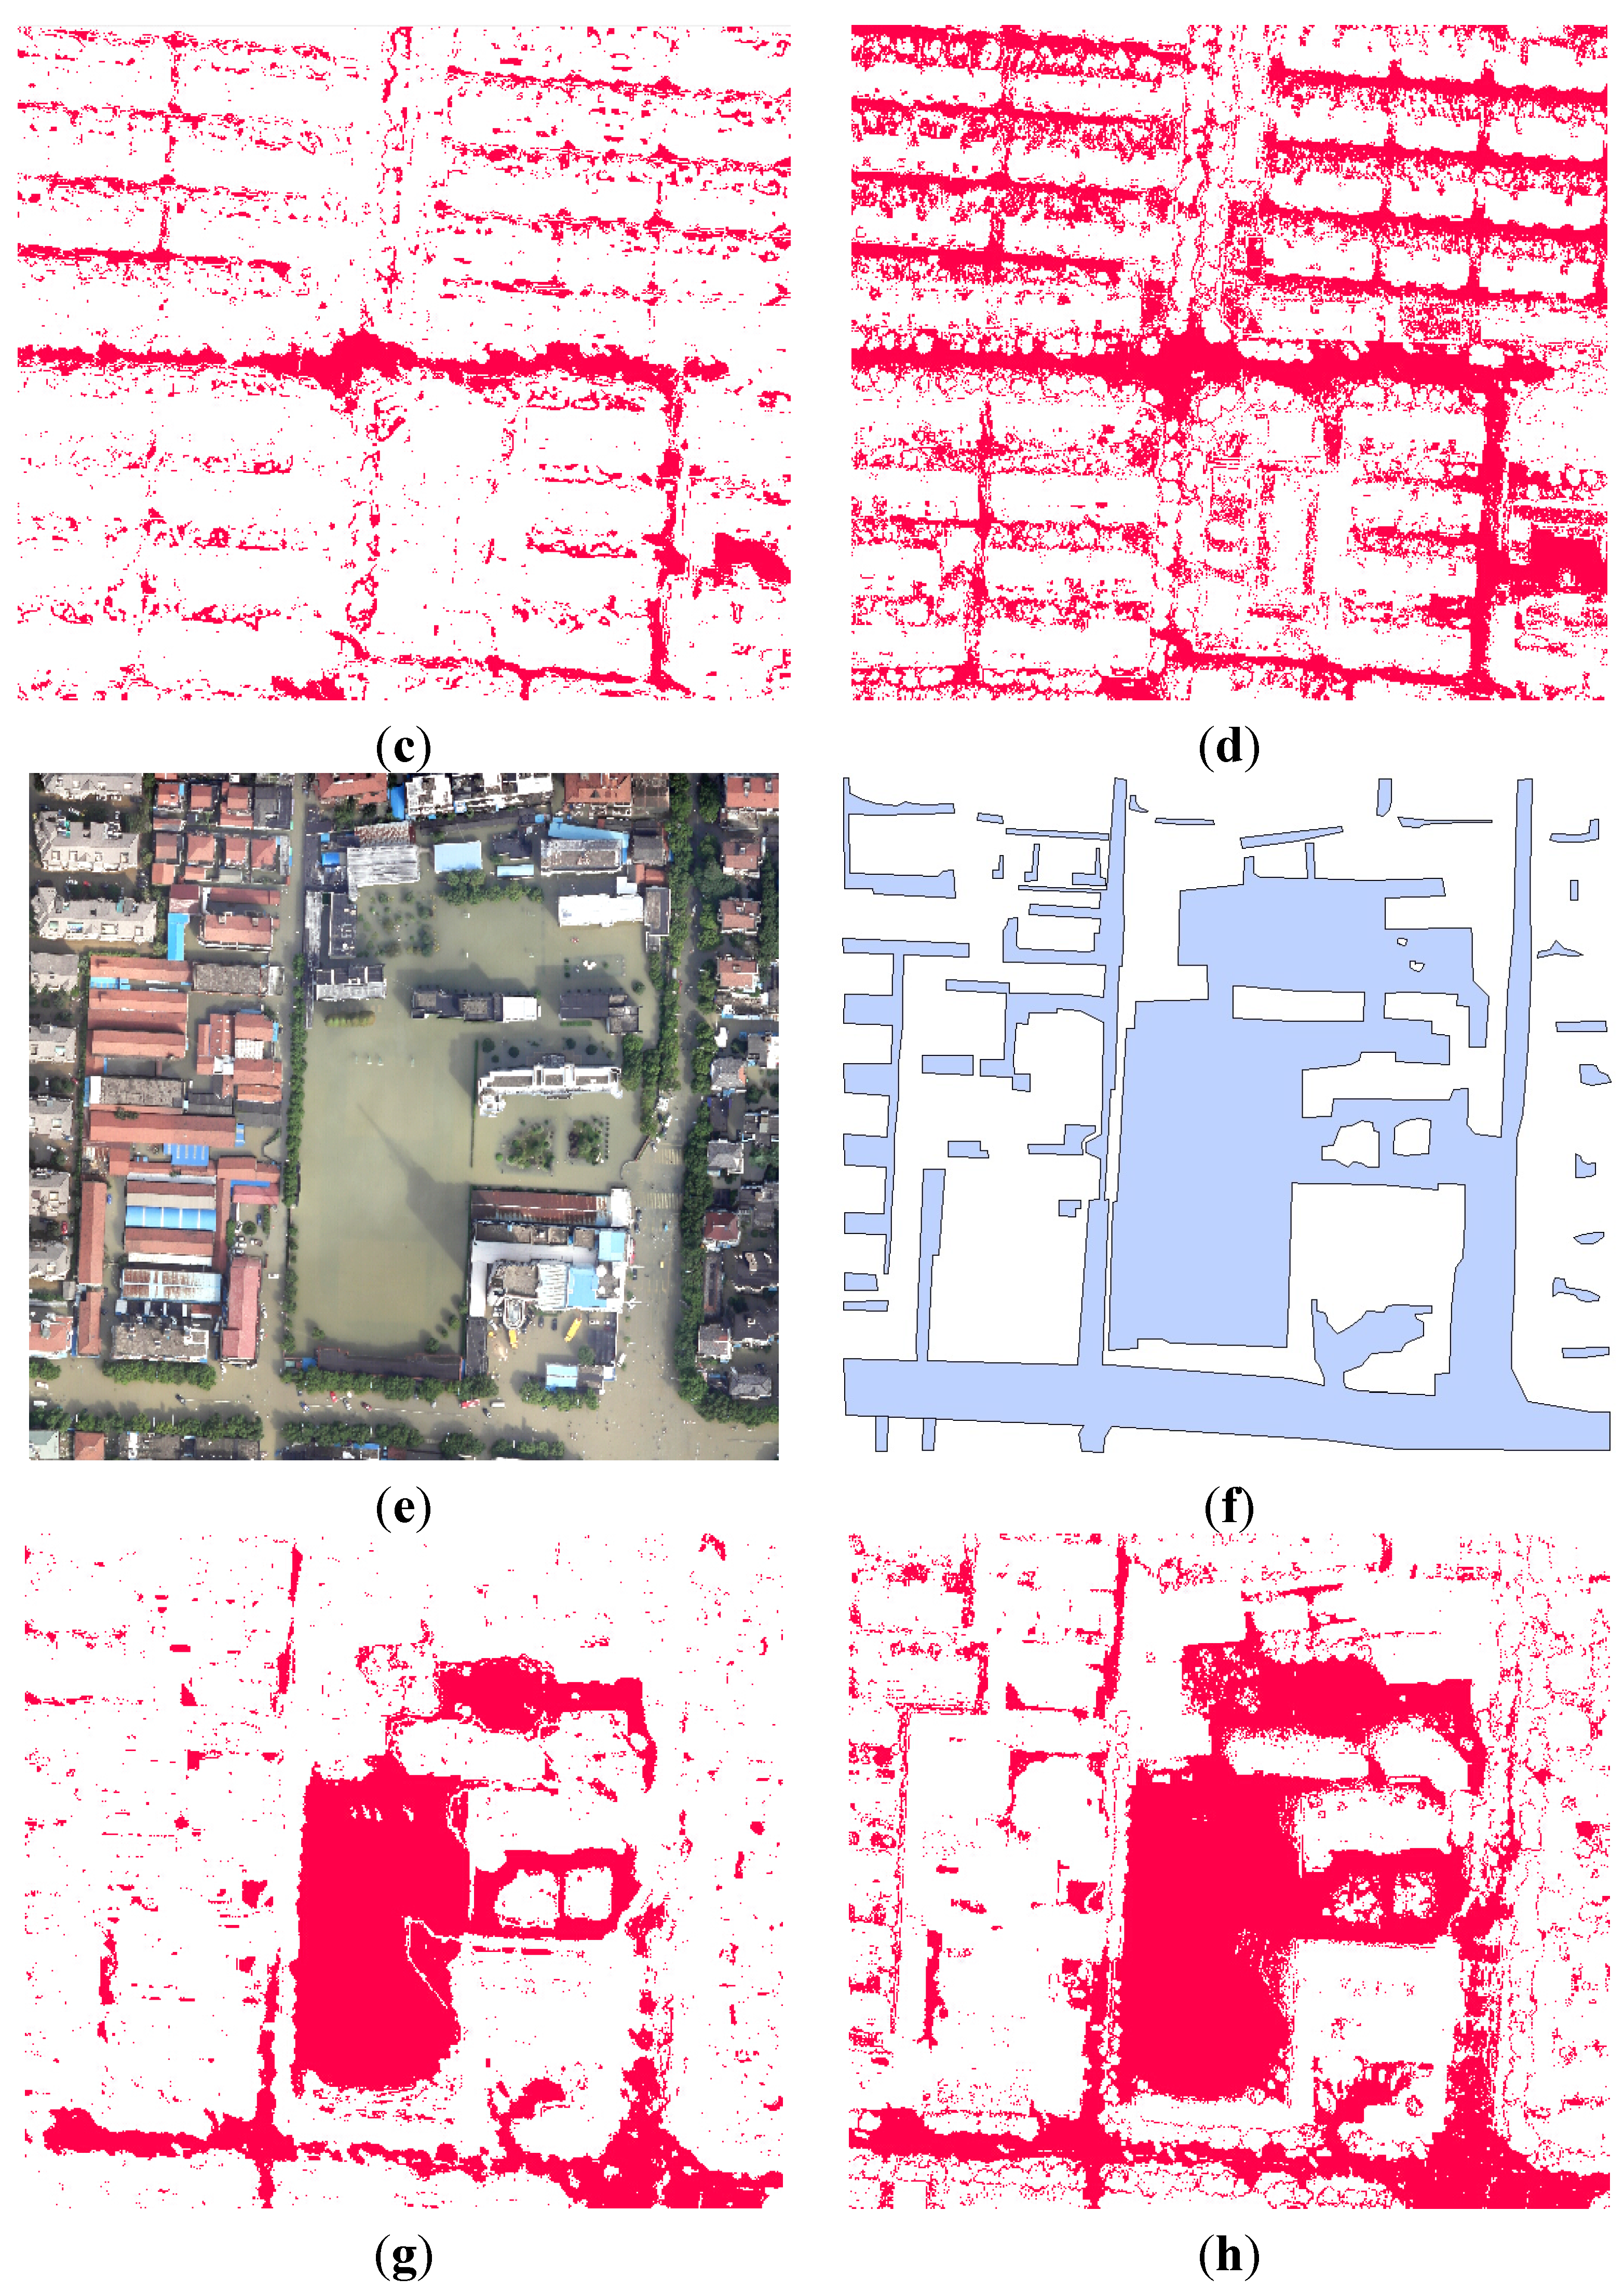
4.2. Classification Results of UAV Imagery


| Type | RGB-Only | RGB + Texture | ||
|---|---|---|---|---|
| Area (km2) | Area (%) | Area (km2) | Area (%) | |
| Flooded | 1.845 | 18.40 | 3.367 | 33.58 |
| Non-flooded | 7.444 | 74.26 | 5.922 | 59.07 |
| Persistent water | 0.737 | 7.34 | 0.737 | 7.34 |
| Total | 10.026 | 100 | 10.026 | 100 |


4.3. Results of Accuracy Assessment
| Classification Results | Ground Truth | UA | |
|---|---|---|---|
| Flooded | Non-flooded | - | |
| Flooded | 3321 | 713 | 82.3% |
| Non-flooded | 1679 | 4287 | 71.9% |
| PA | 66.4% | 85.7% | - |
| OA | 76.1% | Kappa index | 0.522 |
| Classification Results | Ground Truth | UA | |
|---|---|---|---|
| Flooded | Non-flooded | - | |
| Flooded | 3823 | 92 | 97.7% |
| Non-flooded | 1177 | 4908 | 80.7% |
| PA | 76.5% | 98.2% | - |
| OA | 87.3% | Kappa index | 0.746 |
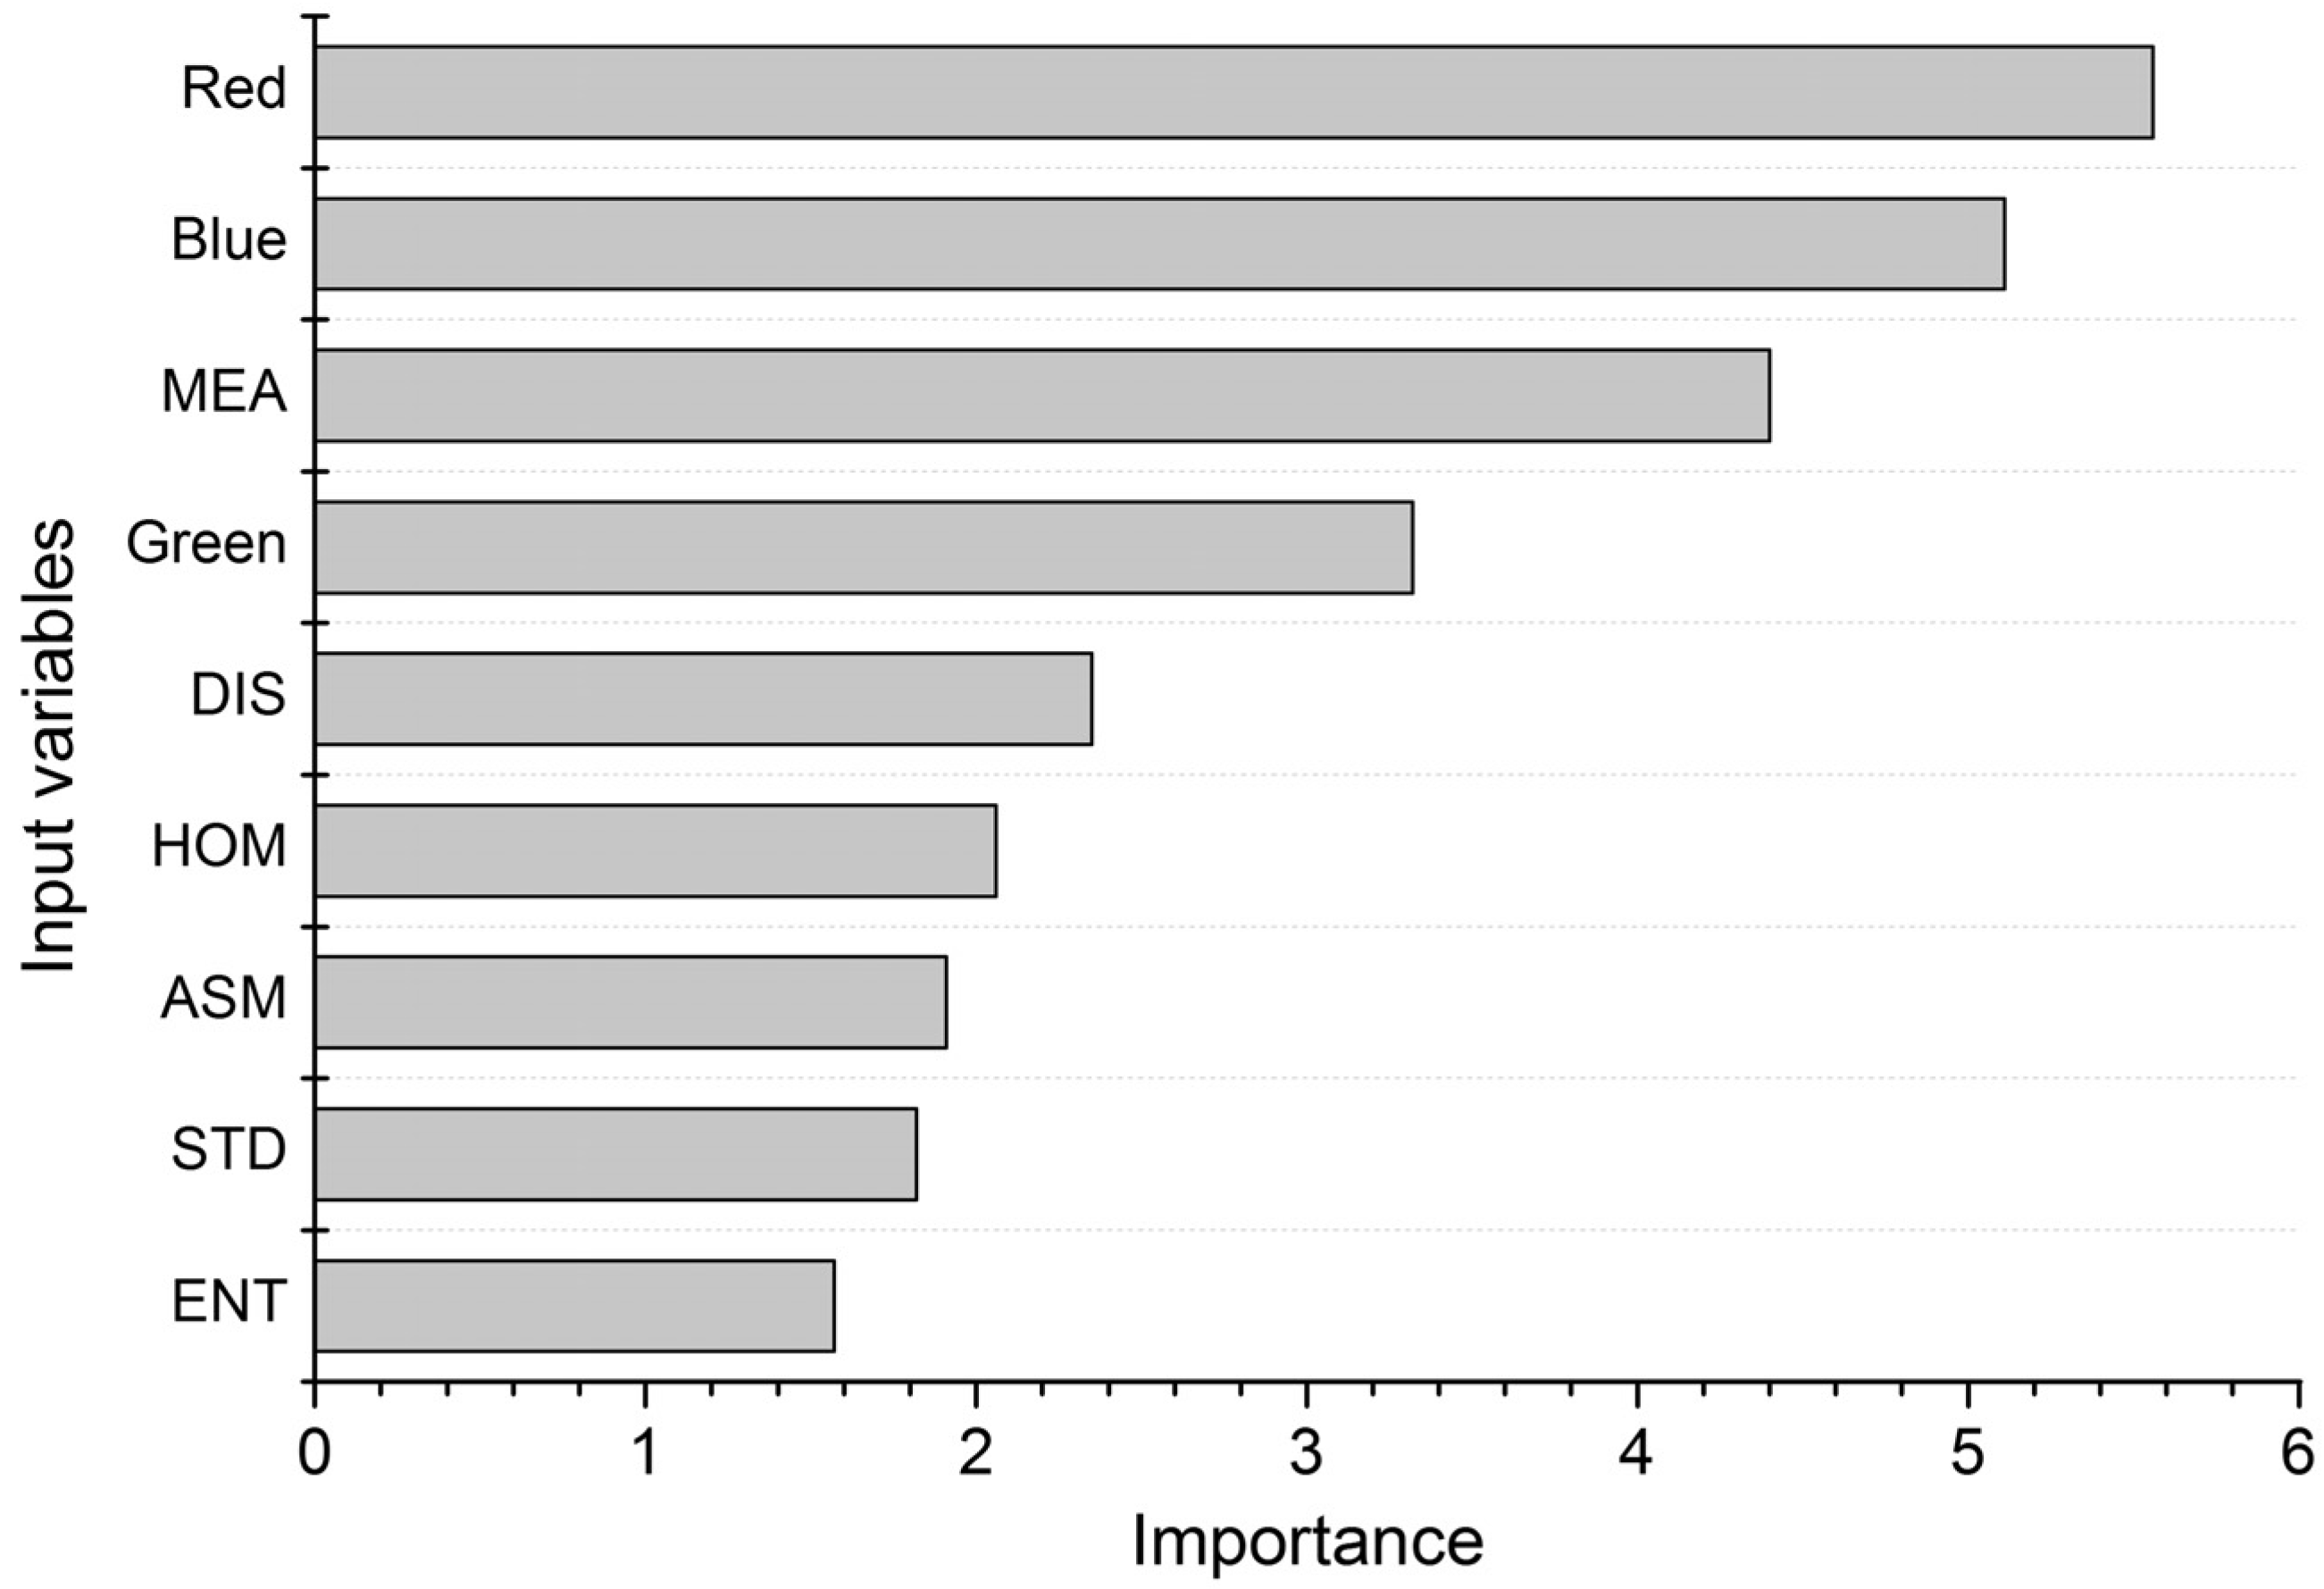
4.4. Variable Importance

4.5. Comparison with Other Classifiers
| Method | Overall Accuracy (%) | Kappa Index |
|---|---|---|
| ML | 81.2 | 0.624 |
| ANN | 83.6 | 0.672 |
| SVM | 87.8 | 0.756 |
| RF | 87.3 | 0.746 |
5. Discussion
6. Conclusions
Acknowledgments
Author Contributions
Conflicts of Interest
References
- Kuenzer, C.; Guo, H.; Huth, J.; Leinenkugel, P.; Li, X.; Dech, S. Flood mapping and flood dynamics of the Mekong delta: ENVISAT-ASAR-WSM based time series analyses. Remote Sens. 2013, 5, 687–715. [Google Scholar] [CrossRef] [Green Version]
- Smith, M.W.; Carrivick, J.L.; Hooke, J.; Kirkby, M.J. Reconstructing flash flood magnitudes using “Structure-from-Motion”: A rapid assessment tool. J. Hydrol. 2014, 519, 1914–1927. [Google Scholar] [CrossRef]
- Gianinetto, M.; Villa, P. Mapping Hurricane Katrina’s widespread destruction in New Orleans using multisensor data and the normalized difference change detection (NDCD) technique. Int. J. Remote Sens. 2011, 32, 1961–1982. [Google Scholar] [CrossRef]
- Wang, Y. Using Landsat 7 TM data acquired days after a flood event to delineate the maximum flood extent on a coastal floodplain. Int. J. Remote Sens. 2004, 25, 959–974. [Google Scholar] [CrossRef]
- Amini, J. A method for generating floodplain maps using IKONOS images and DEMs. Int. J. Remote Sens. 2010, 31, 2441–2456. [Google Scholar] [CrossRef]
- Mallinis, G.; Gitas, I.Z.; Giannakopoulos, V.; Maris, F.; Tsakiri-Strati, M. An object-based approach for flood area delineation in a transboundary area using ENVISAT ASAR and LANDSAT TM data. Int. J. Digit Earth. 2013, 6, 124–136. [Google Scholar]
- Gstaiger, V.; Huth, J.; Gebhardt, S.; Wehrmann, T.; Kuenzer, C. Multi-sensoral and automated derivation of inundated areas using TerraSAR-X and ENVISAT ASAR data. Int. J. Remote Sens. 2012, 33, 7291–7304. [Google Scholar] [CrossRef]
- Henry, J.B.; Chastanet, P.; Fellah, K.; Desnos, Y.L. Envisat multi-polarized ASAR data for flood mapping. Int. J. Remote Sens. 2006, 27, 1921–1929. [Google Scholar] [CrossRef]
- Wang, Y.; Colby, J.D.; Mulcahy, K.A. An efficient method for mapping flood extent in a coastal floodplain using Landsat TM and DEM data. Int. J. Remote Sens. 2002, 23, 3681–3696. [Google Scholar] [CrossRef]
- Osorio, J.D.G.; Galiano, S.G.G. Development of a sub-pixel analysis method applied to dynamic monitoring of floods. Int. J. Remote Sens. 2012, 33, 2277–2295. [Google Scholar] [CrossRef]
- White, L.; Brisco, B.; Pregitzer, M.; Tedford, B.; Boychuk, L. RADARSAT-2 beam mode selection for surface water and flooded vegetation mapping. Can. J. Remote Sens. 2014, 40, 135–151. [Google Scholar]
- Schnebele, E.; Cervone, G.; Kumar, S.; Waters, N. Real time estimation of the calgary floods using limited remote sensing data. Water 2014, 6, 381–398. [Google Scholar] [CrossRef]
- Gerl, T.; Bochow, M.; Kreibich, H. Flood damage modeling on the basis of urban structure mapping using high-resolution remote sensing data. Water 2014, 6, 2367–2393. [Google Scholar] [CrossRef]
- Colomina, I.; Molina, P. Unmanned aerial systems for photogrammetry and remote sensing: A review. ISPRS J. Photogramm. 2014, 92, 79–97. [Google Scholar] [CrossRef]
- Feng, Q.; Liu, J.; Gong, J. UAV Remote sensing for urban vegetation mapping using Random Forest and texture analysis. Remote Sens. 201 2015, 7, 1074–1094. [Google Scholar] [CrossRef]
- Gong, J.; Yue, Y.; Zhu, J.; Wen, Y.; Li, Y.; Zhou, J.; Wang, D.; Yu, C. Impacts of the Wenchuan Earthquake on the Chaping River upstream channel change. Int. J. Remote Sens. 2012, 33, 3907–3929. [Google Scholar] [CrossRef]
- Hunt, E.R.; Hively, W.D.; Fujikawa, S.J.; Linden, D.S.; Daughtry, C.S.T.; McCarty, G.W. Acquisition of NIR-Green-Blue digital photographs from unmanned aircraft for crop monitoring. Remote Sens. 2010, 2, 290–305. [Google Scholar] [CrossRef]
- Breiman, L. Random forests. Mach. Learn. 2001, 45, 5–32. [Google Scholar] [CrossRef]
- Rodriguez-Galiano, V.F.; Chica-Olmo, M.; Abarca-Hernandez, F.; Atkinson, P.M.; Jeganathan, C. Random Forest classification of Mediterranean land cover using multi-seasonal imagery and multi-seasonal texture. Remote Sens. Environ. 2012, 121, 93–107. [Google Scholar] [CrossRef]
- Rodriguez-Galiano, V.F.; Ghimire, B.; Chica-Olmo, M.; Rigol-Sanchez, J.P. An assessment of the effectiveness of a random forest classifier for land-cover classification. ISPRS J. Photogramm. 2012, 67, 93–104. [Google Scholar] [CrossRef]
- Immitzer, M.; Atzberger, C.; Koukal, T. Tree species classification with Random Forest using very high spatial resolution 8-band WorldView-2 Satellite data. Remote Sens. 2012, 4, 2661–2693. [Google Scholar] [CrossRef]
- Hayes, M.H.; Miller, S.N.; Murphy, M.A. High-resolution landcover classification using Random Forest. Remote Sens. Lett. 2014, 5, 112–121. [Google Scholar] [CrossRef]
- Xu, L.; Li, J.; Brenning, A. A comparative study of different classification techniques for marine oil spill identification using RADARSAT-1 imagery. Remote Sens. Environ. 2014, 141, 14–23. [Google Scholar] [CrossRef]
- Anys, H.; He, D.C. Evaluation of textural and multipolarization radar features for crop classification. IEEE Trans. Geosci. Remote Sens. 1995, 33, 1170–1181. [Google Scholar] [CrossRef]
- Szantoi, Z.; Escobedo, F.; Abd-Elrahman, A.; Smith, S.; Pearlstine, L. Analyzing fine-scale wetland composition using high resolution imagery and texture features. Int. J. Appl. Earth Obs. 2013, 23, 204–212. [Google Scholar] [CrossRef]
- Haralick, R.M.; Dinstein, I.; Shanmugam, K. Textural features for image classification. IEEE Trans. Syst. Man Cybern. 1973, 3, 610–621. [Google Scholar] [CrossRef]
- Laliberte, A.S.; Rango, A. Texture and Scale in Object-Based Analysis of Subdecimeter Resolution Unmanned Aerial Vehicle (UAV) Imagery. IEEE Trans. Geosci. Remote Sens. 2009, 47, 761–770. [Google Scholar] [CrossRef]
- Aguera, F.; Aguilar, F.J.; Aguilar, M.A. Using texture analysis to improve per-pixel classification of very high resolution images for mapping plastic greenhouses. ISPRS J. Photogramm. 2008, 63, 635–646. [Google Scholar] [CrossRef]
- Zhai, Y.; Thomasson, J.A.; Boggess, J.E., III; Sui, R. Soil texture classification with artificial neural networks operating on remote sensing data. Comput. Electron. Arg. 2006, 54, 53–68. [Google Scholar] [CrossRef]
- Mountrakis, G.; Im, J.; Ogole, C. Support vector machines in remote sensing: A review. ISPRS J. Photogramm. 2011, 66, 247–259. [Google Scholar] [CrossRef]
© 2015 by the authors; licensee MDPI, Basel, Switzerland. This article is an open access article distributed under the terms and conditions of the Creative Commons Attribution license (http://creativecommons.org/licenses/by/4.0/).
Share and Cite
Feng, Q.; Liu, J.; Gong, J. Urban Flood Mapping Based on Unmanned Aerial Vehicle Remote Sensing and Random Forest Classifier—A Case of Yuyao, China. Water 2015, 7, 1437-1455. https://doi.org/10.3390/w7041437
Feng Q, Liu J, Gong J. Urban Flood Mapping Based on Unmanned Aerial Vehicle Remote Sensing and Random Forest Classifier—A Case of Yuyao, China. Water. 2015; 7(4):1437-1455. https://doi.org/10.3390/w7041437
Chicago/Turabian StyleFeng, Quanlong, Jiantao Liu, and Jianhua Gong. 2015. "Urban Flood Mapping Based on Unmanned Aerial Vehicle Remote Sensing and Random Forest Classifier—A Case of Yuyao, China" Water 7, no. 4: 1437-1455. https://doi.org/10.3390/w7041437