
Estimating Natural Recharge by Means of Chloride Mass Balance in a Volcanic Aquifer: Northeastern Gran Canaria (Canary Islands, Spain)

Abstract
:1. Introduction
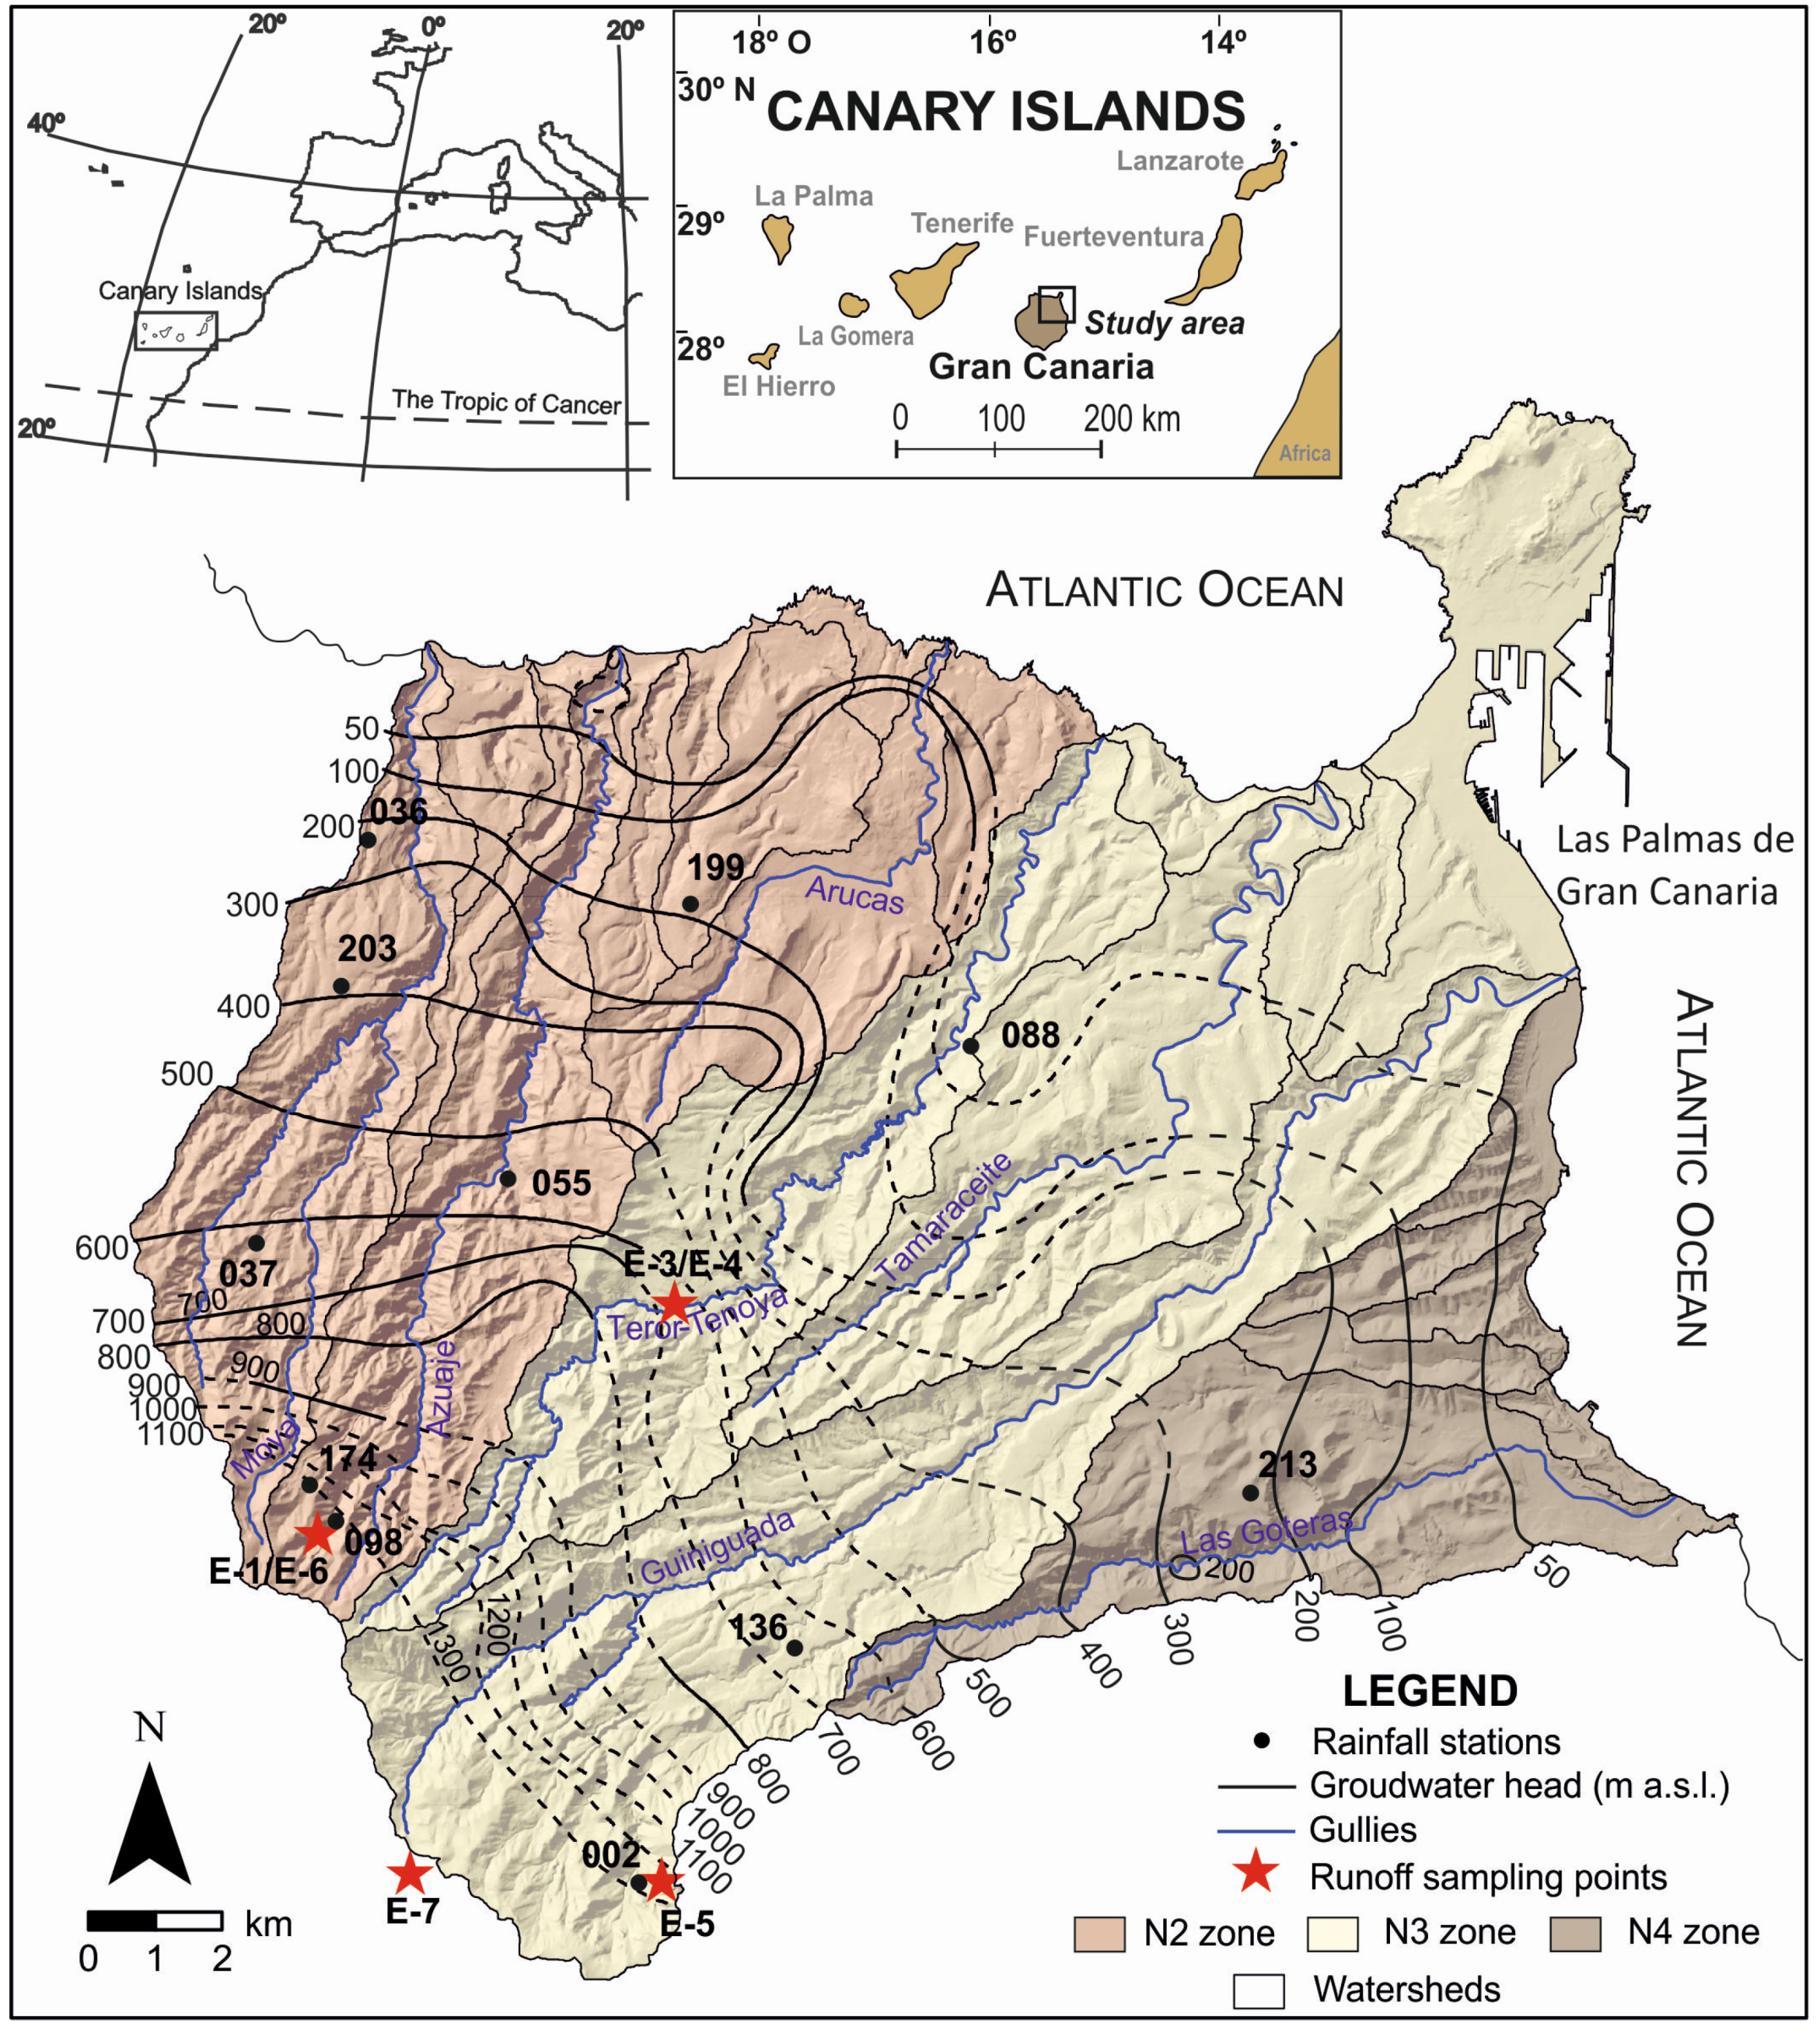
2. Study Area

3. Materials and Methods
3.1. Atmospheric Chloride Mass Balance (CMB) Method
3.2. Rainwater Sampling

| Station | Sampling Period | n | |
|---|---|---|---|
| 036 | 6 November 2008 | 5 November 2014 | 48 |
| 037 | 31 October 2008 | 5 November 2014 | 52 |
| 055 | 30 October 2008 | 5 November 2014 | 54 |
| 098 * | 31 August 2010 | 5 November 2014 | 36 |
| 174 * | 31 October 2008 | 1 July 2010 | 18 |
| 203 | 31 October 2008 | 5 November 2014 | 52 |
| 002 | 4 February 2010 | 4 November 2014 | 37 |
| 088 | 4 February 2010 | 4 November 2014 | 30 |
| 136 | 4 February 2010 | 4 November 2014 | 35 |
| 199 | 4 February 2010 | 4 November 2014 | 30 |
| 213 | 4 March 2010 | 4 November 2014 | 41 |
3.3. Runoff Water

3.4. Recharge Water (Groundwater)
4. Results
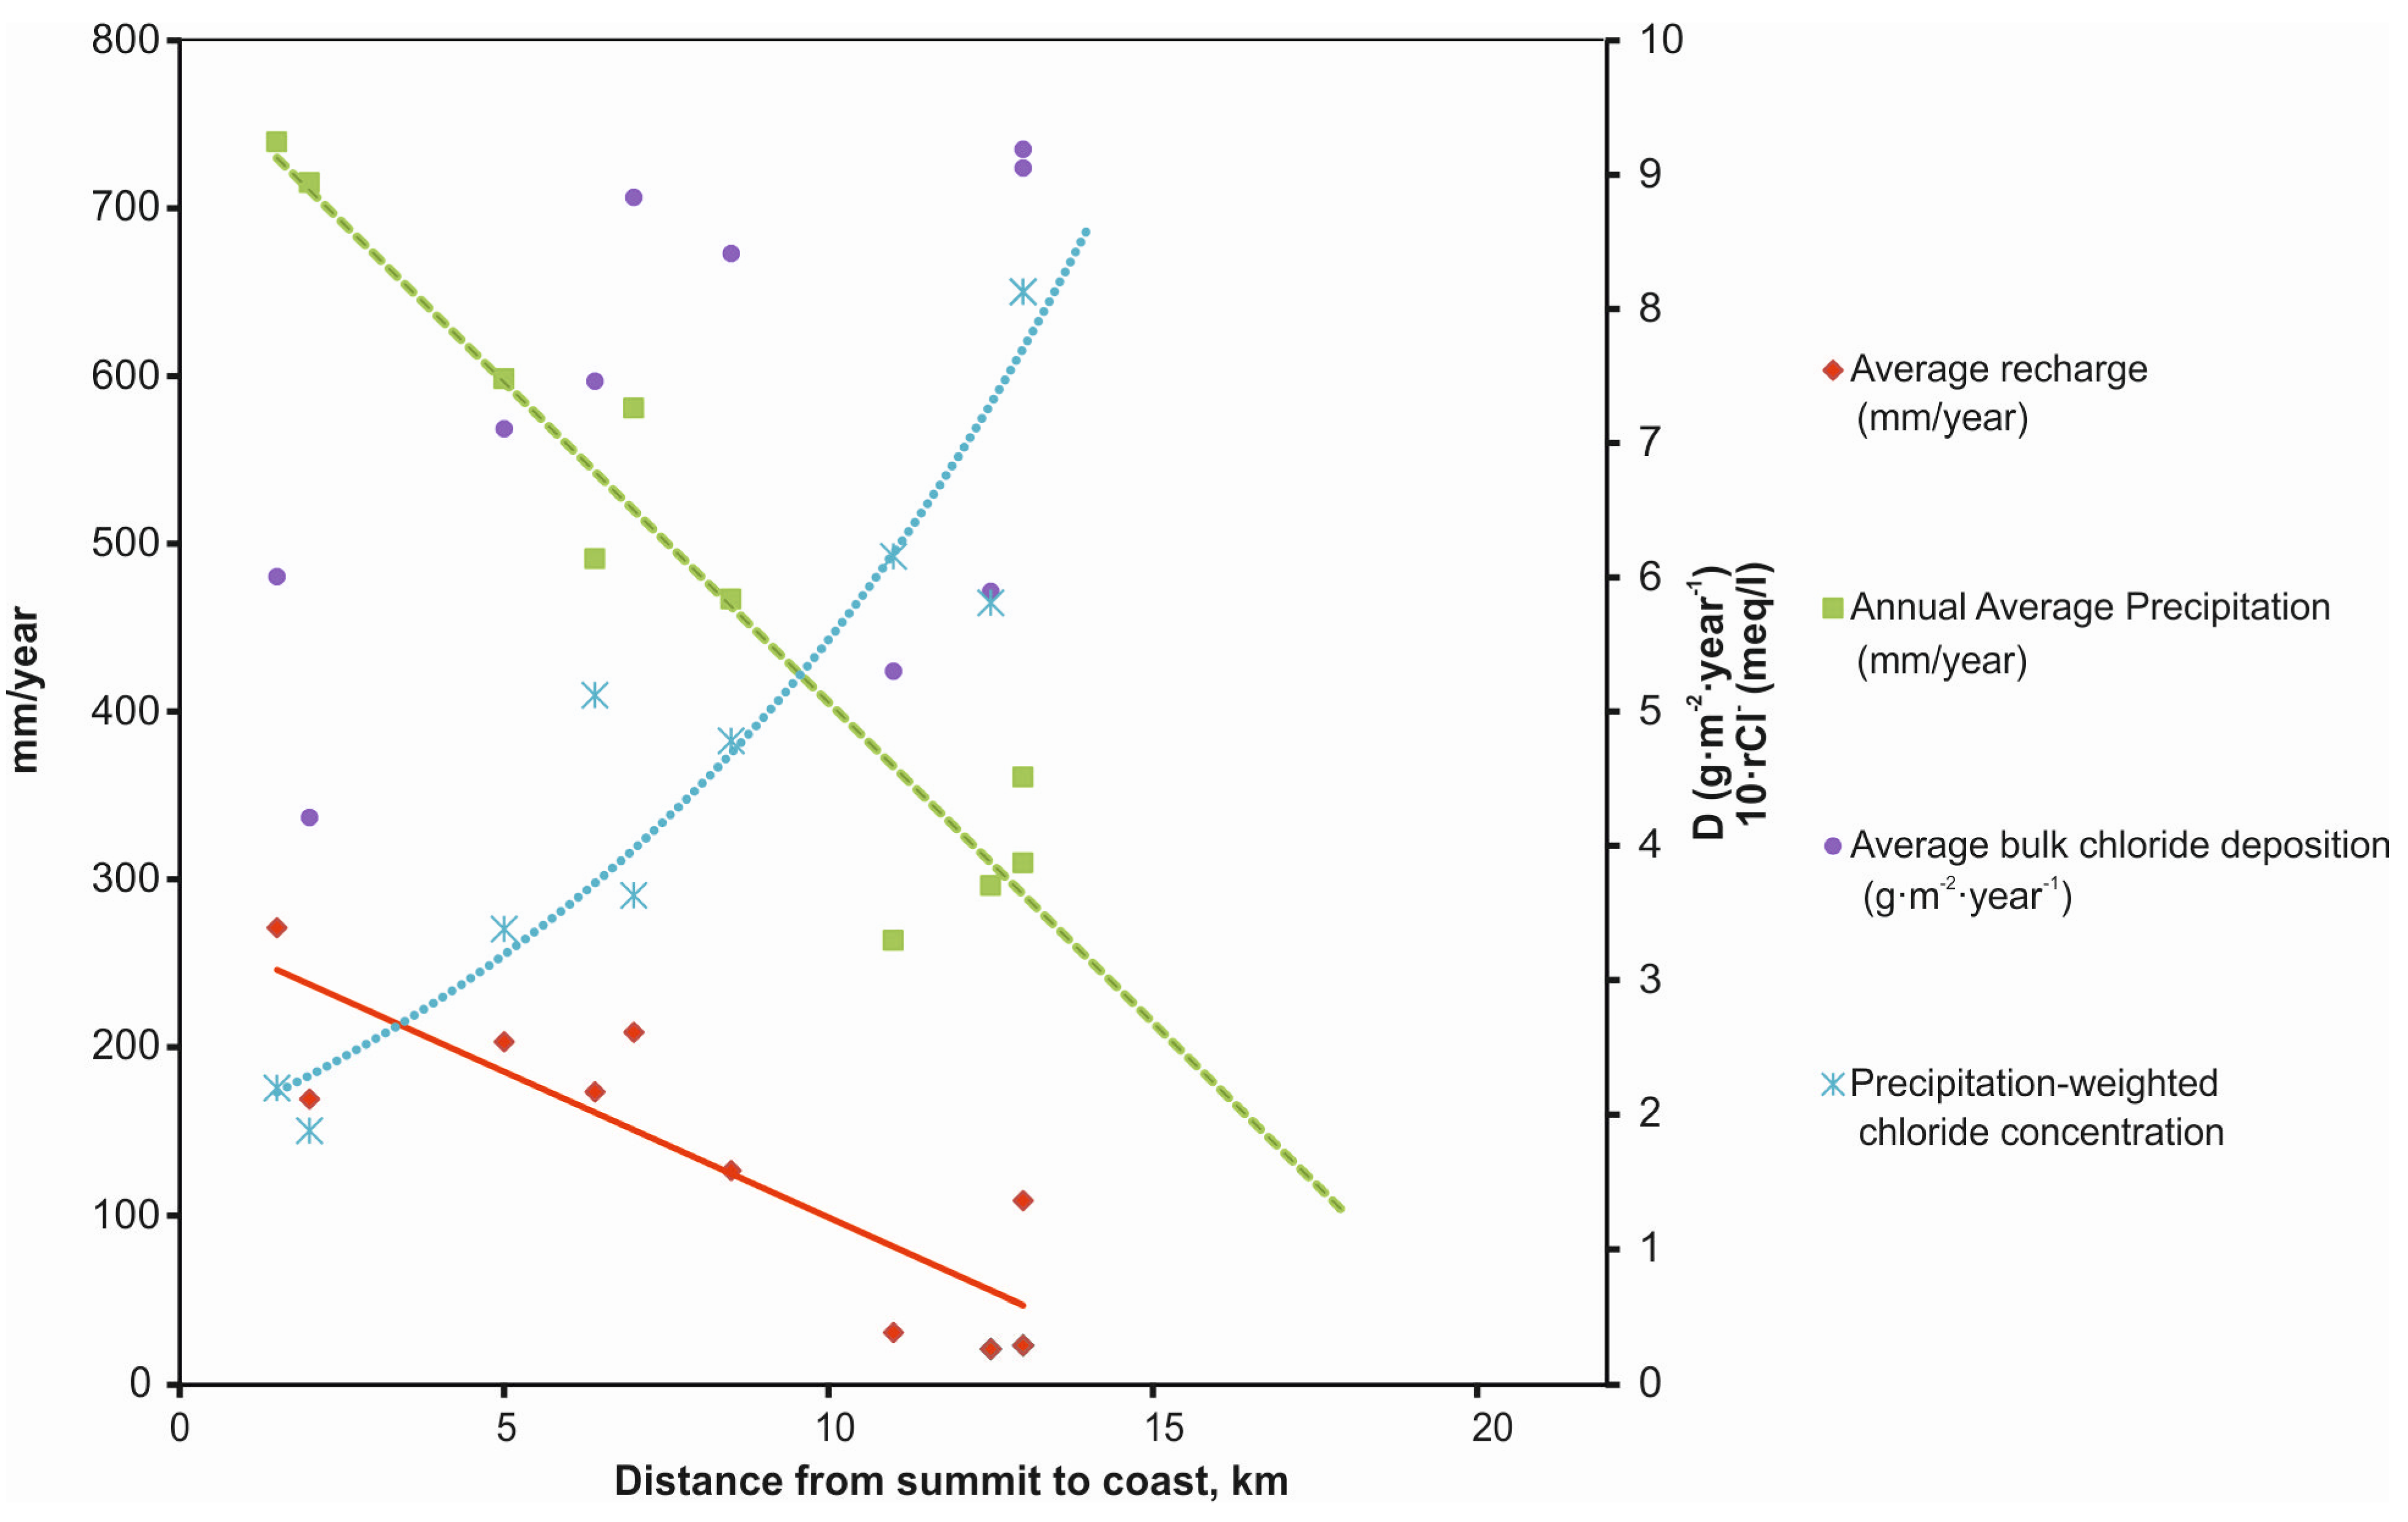
4.1. Chloride Concentration of Rainfall
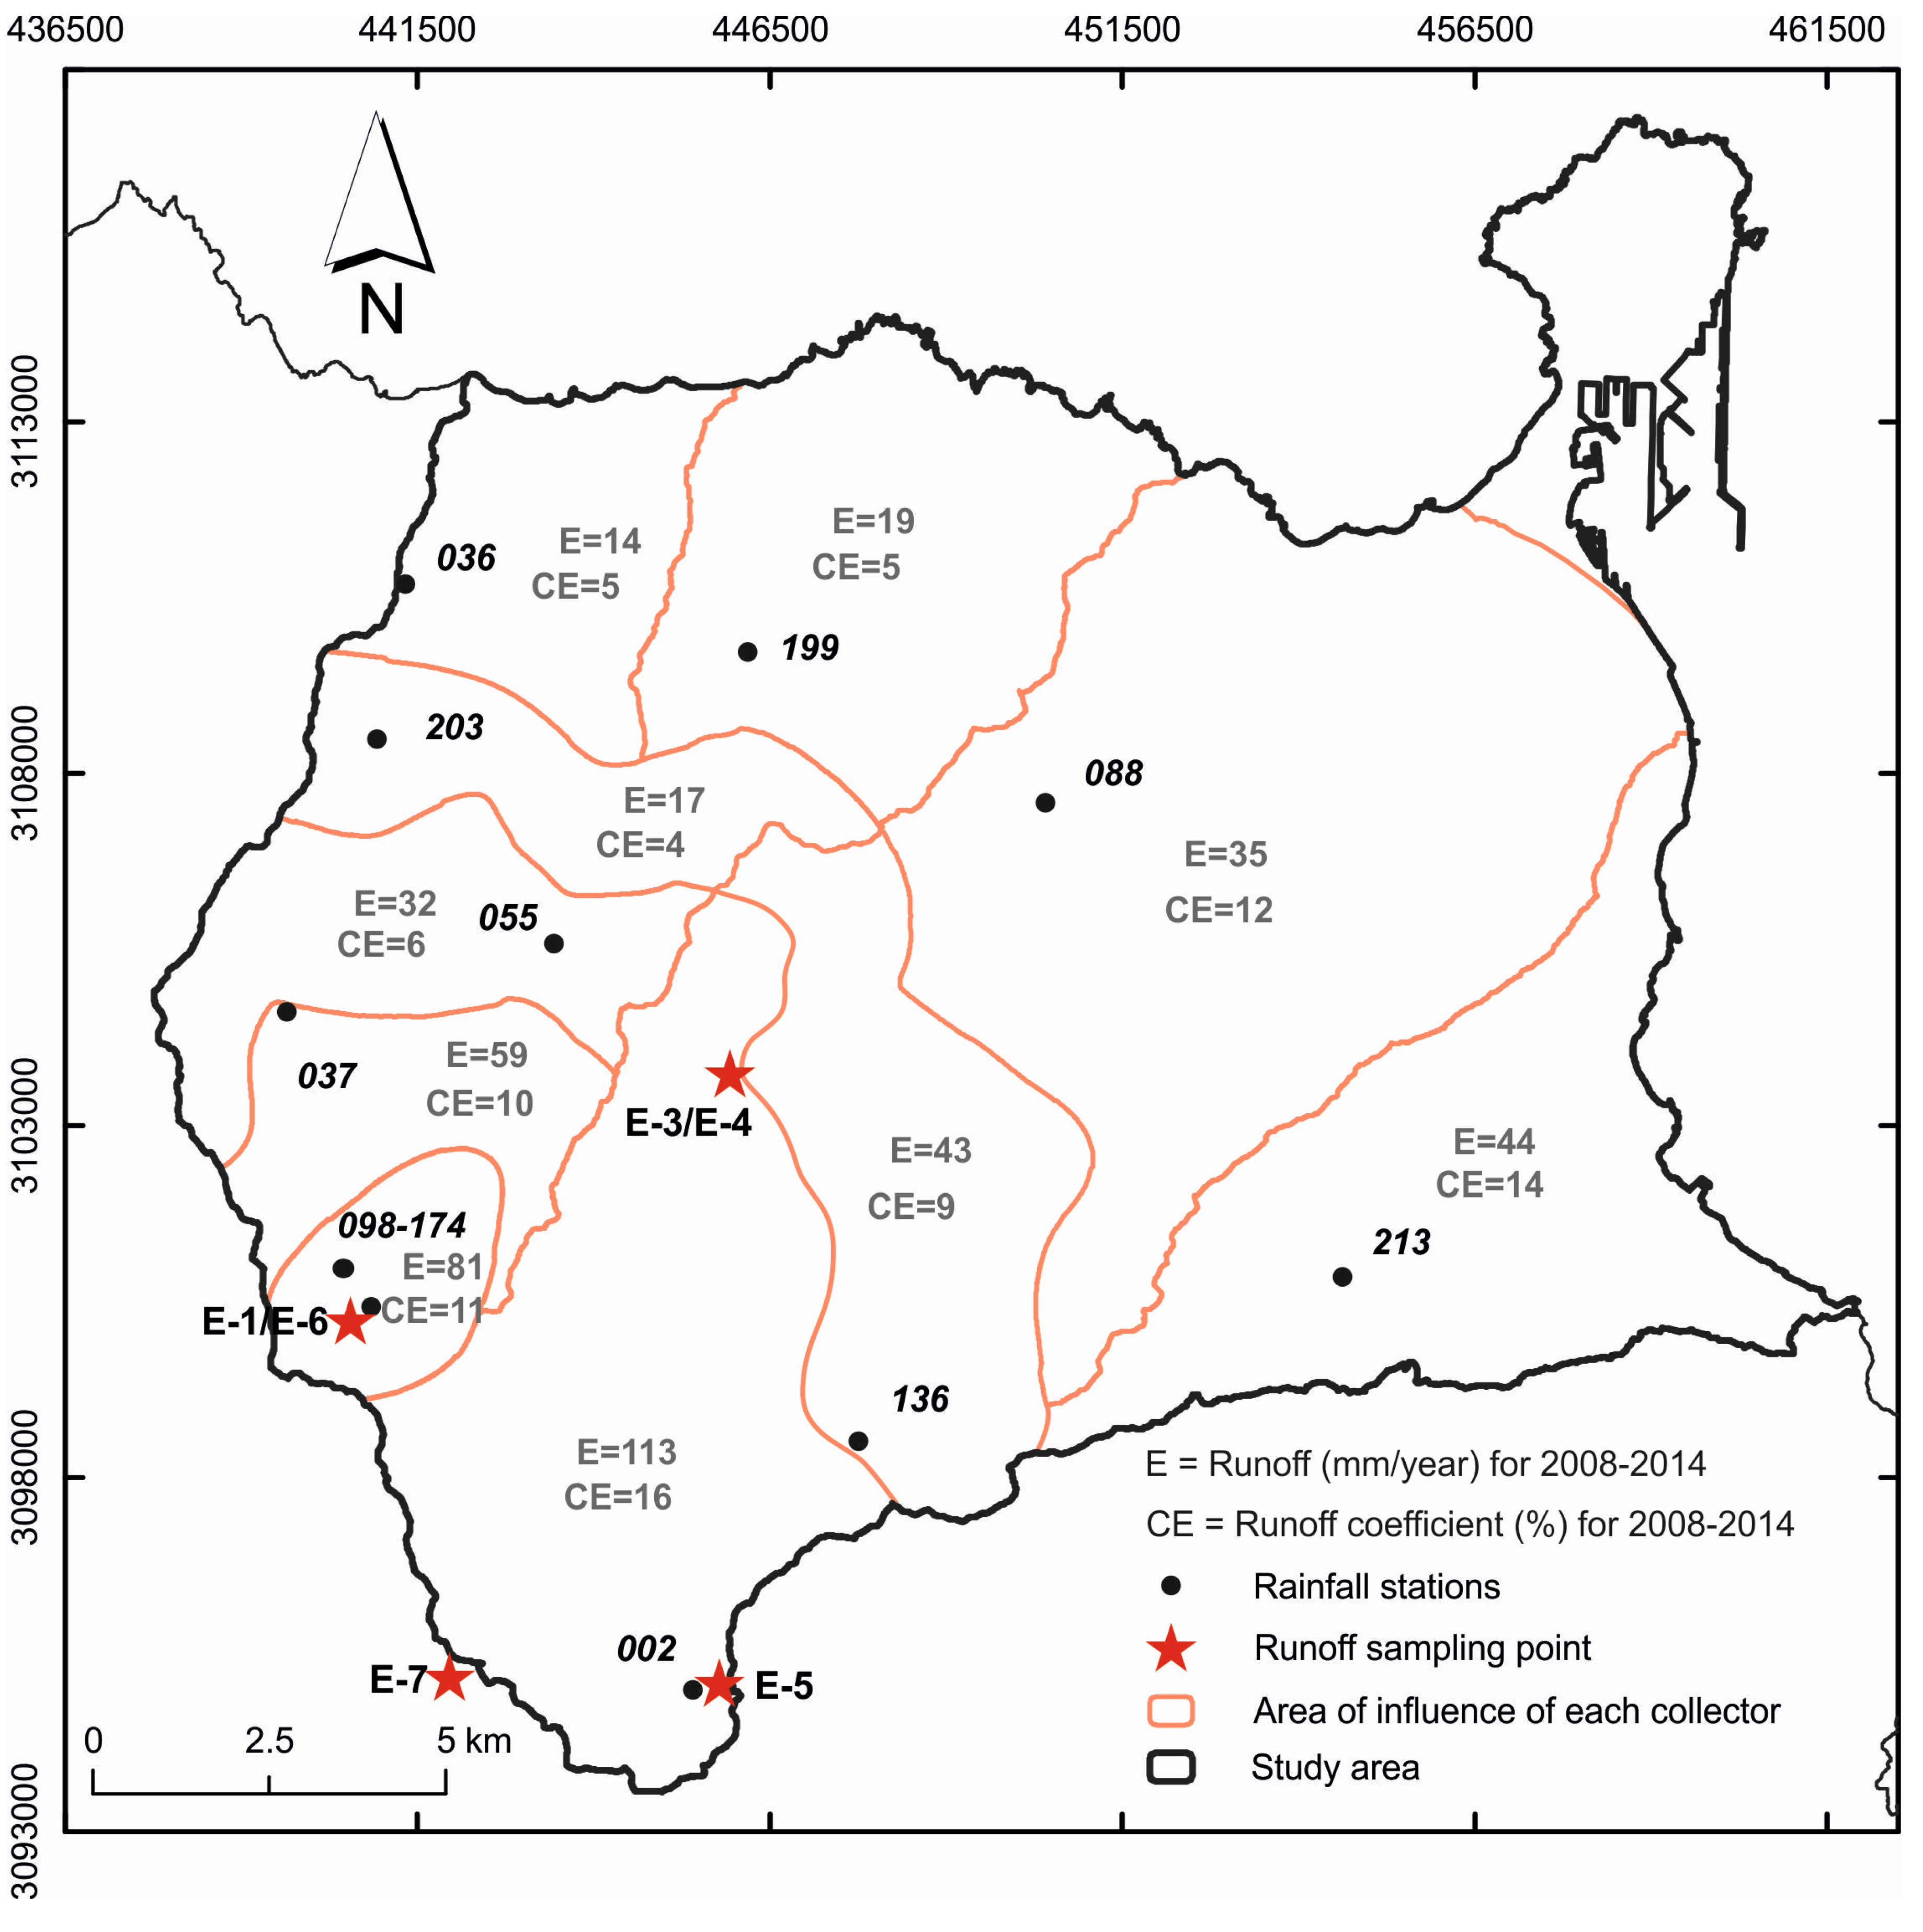
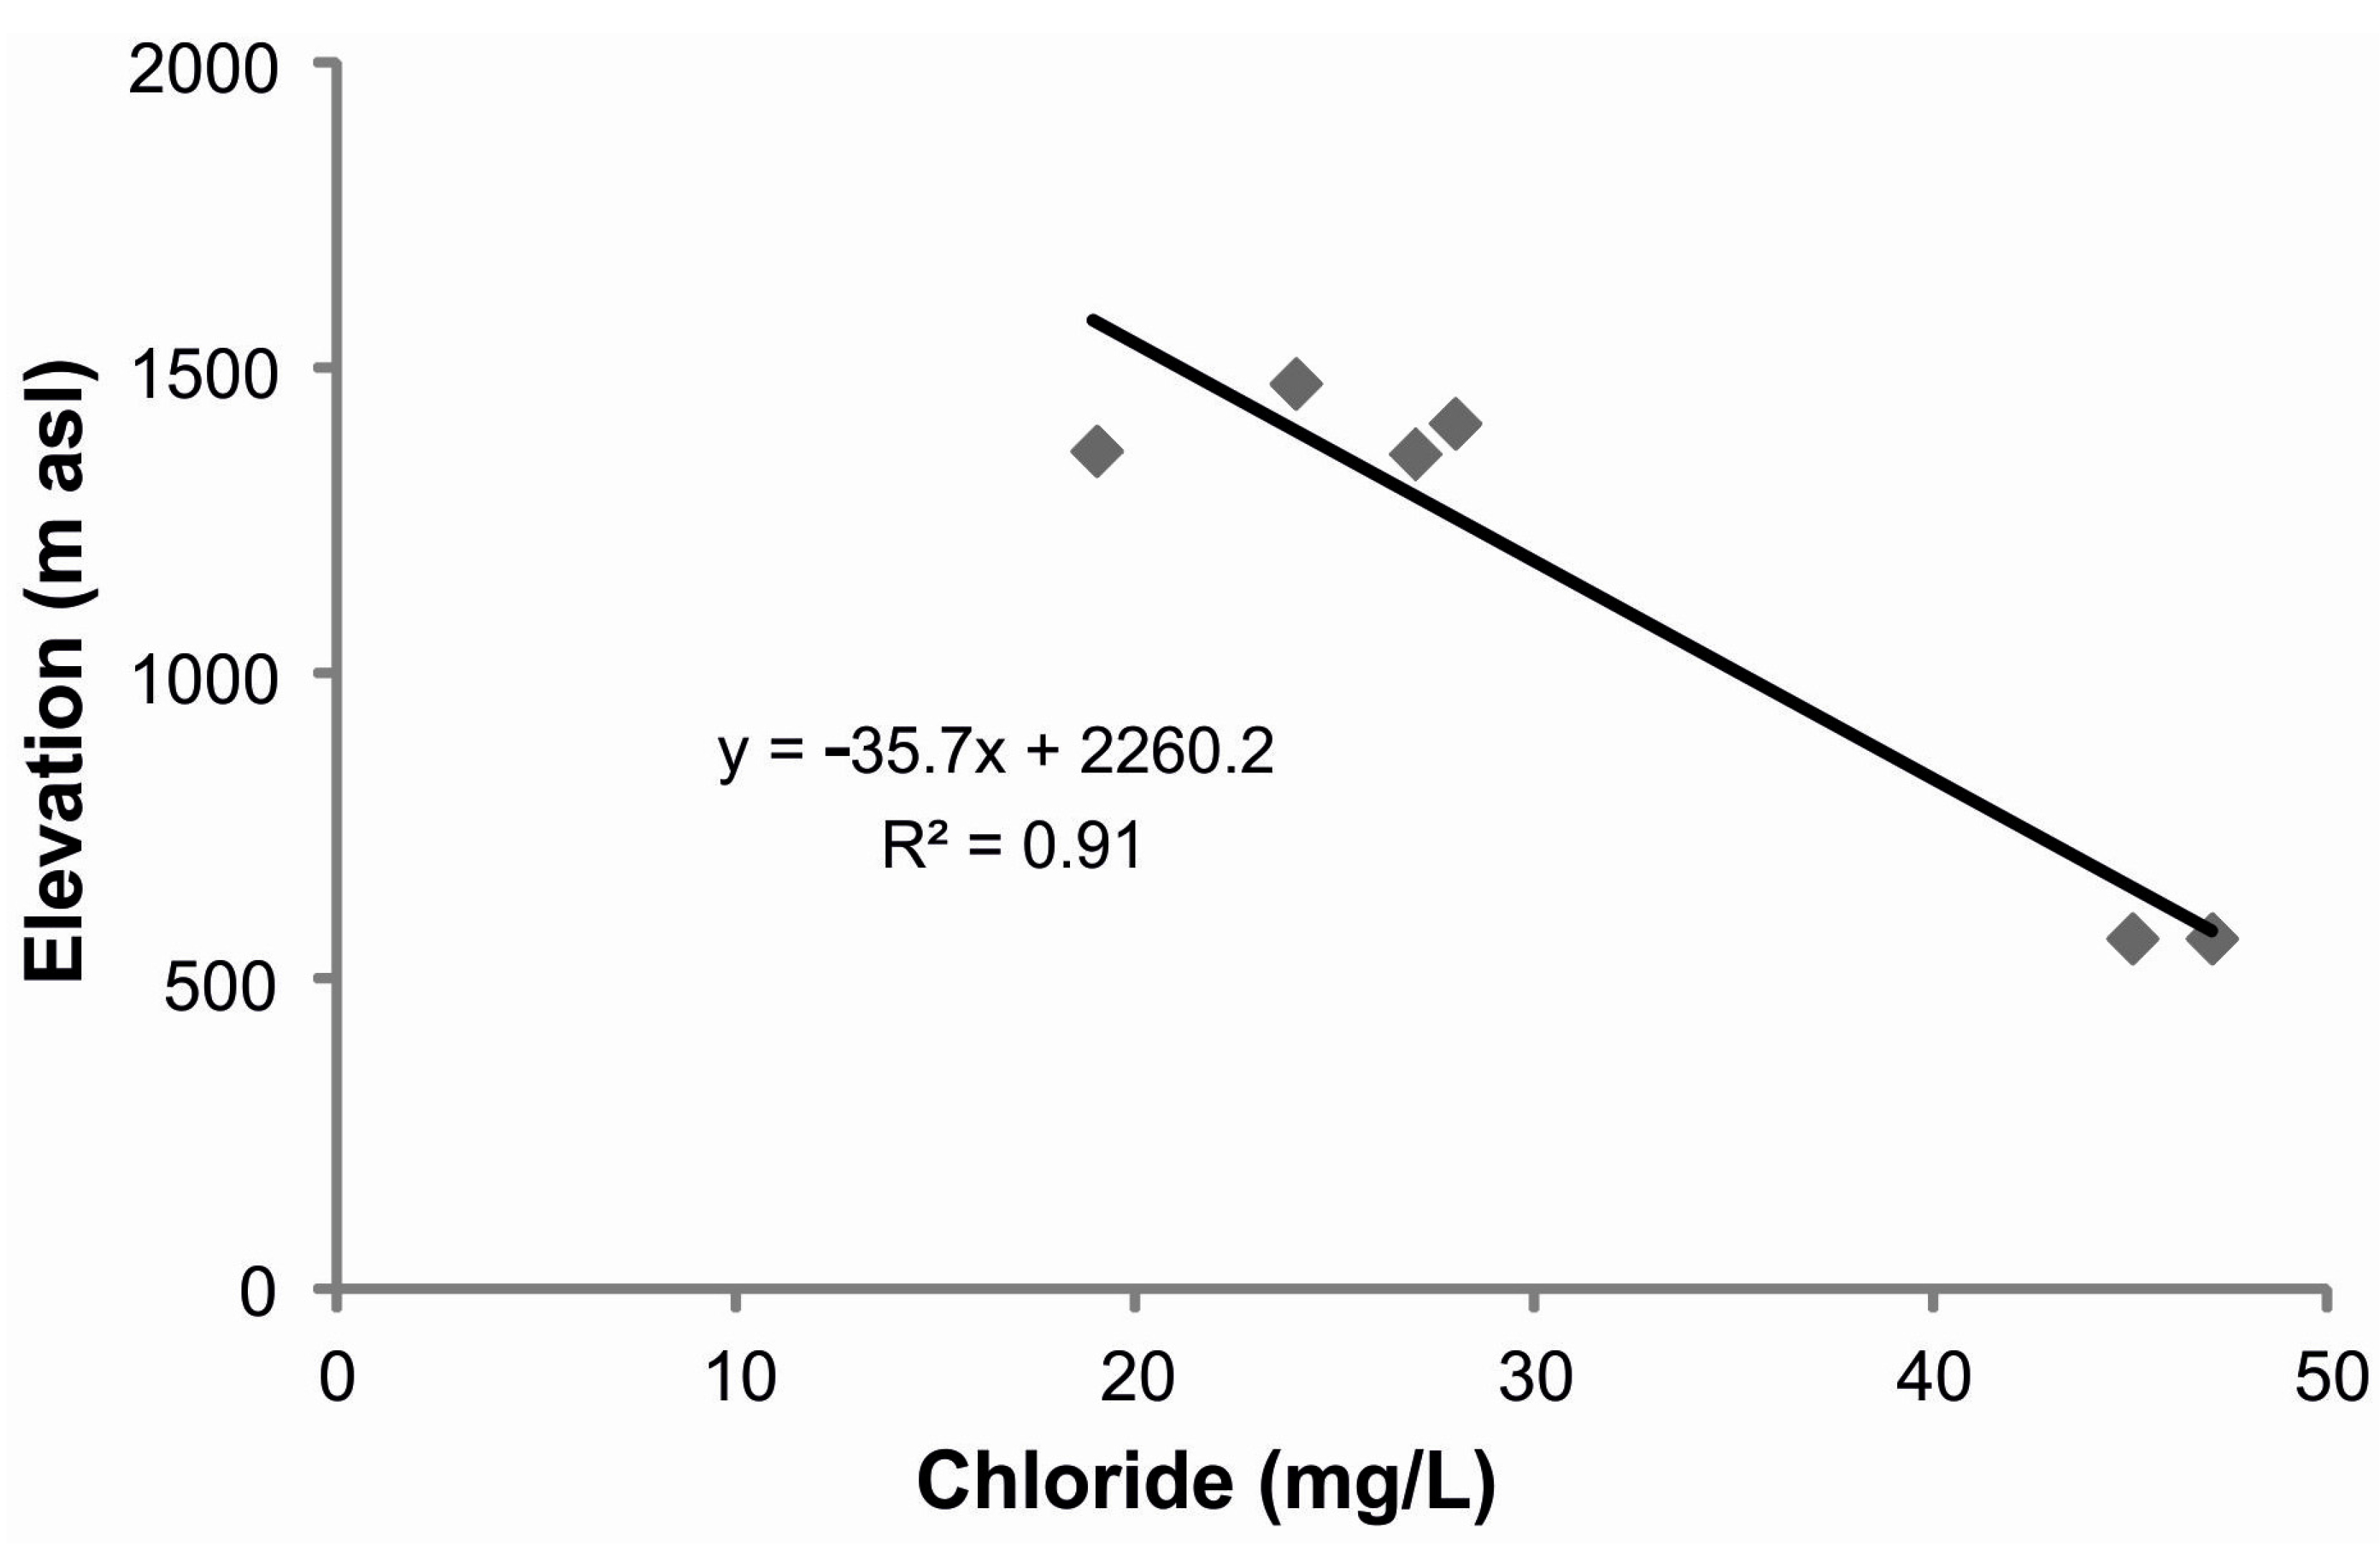
4.2. Runoff Chloride Concentrations

| Zone | Station | Z m a.s.l. | P mm/year | CP mg/L | DP g·m−2·year−1 |
|---|---|---|---|---|---|
| N2 | 036 | 375 | 264 | 21.9 | 5.3 |
| 199 | 443 | 361 | 28.9 | 9.2 | |
| 055 | 577 | 581 | 12.9 | 8.8 | |
| 203 | 645 | 467 | 16.9 | 8.4 | |
| 037 | 990 | 598 | 11.9 | 7.1 | |
| 098-174 | 1370 | 739 | 7.8 | 6.0 | |
| N3 | 088 | 315 | 296 | 20.6 | 5.9 |
| 136 | 841 | 491 | 18.2 | 7.5 | |
| 002 | 1365 | 715 | 6.7 | 4.2 | |
| N4 | 213 | 485 | 310 | 28.9 | 9.0 |

| Station | Z (m a.s.l.) | Gully | Runoff (mm/year) | Chloride in Runoff (mg/L) |
|---|---|---|---|---|
| 002 | 1365 | Guiniguada | 113 | 21 |
| 036 | 375 | Moya | 14 | 46 |
| 037 | 990 | Moya | 59 | 36 |
| 055 | 577 | Azuaje | 32 | 46 |
| 088 | 315 | Teror | 35 | 46 |
| 098 | 1370 | Azuaje | 81 | 27 |
| 136 | 841 | Guiniguada | 43 | 40 |
| 199 | 443 | Arucas | 19 | 51 |
| 203 | 645 | Moya | 17 | 45 |
| 213 | 485 | Las Goteras | 44 | 46 |
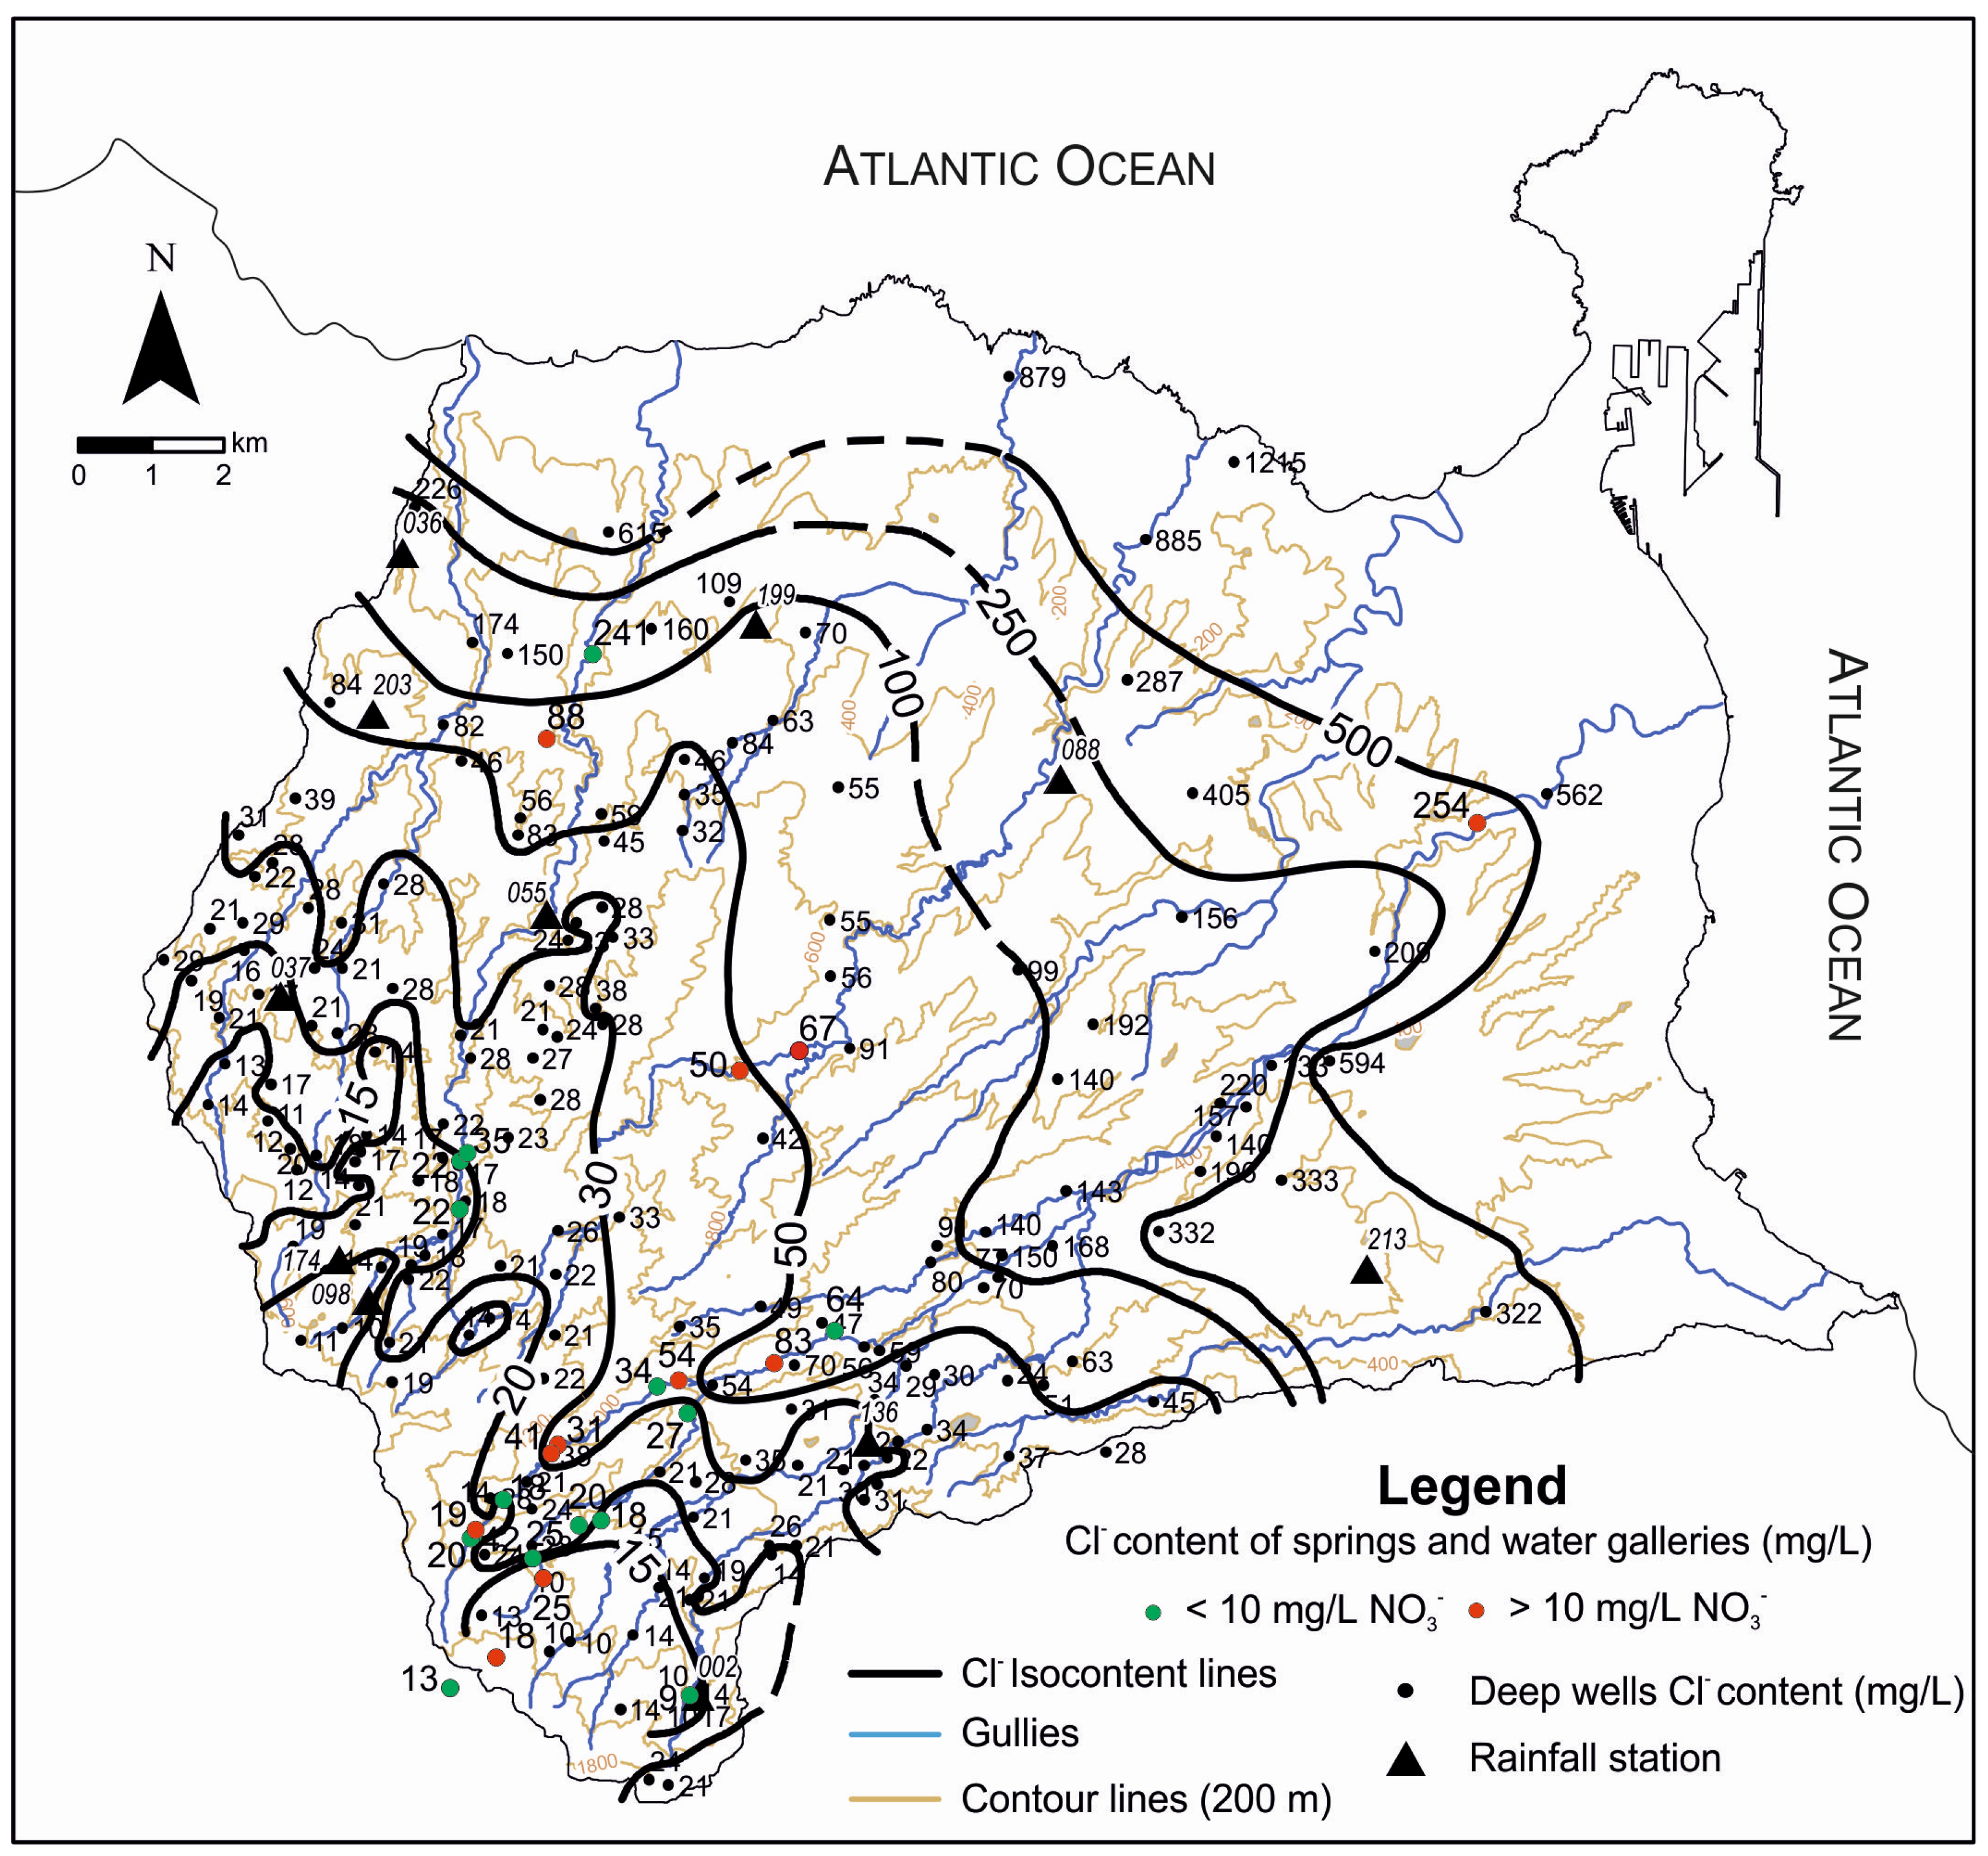
4.3. Chloride Concentration in Recharge Water

| Zone | Station | Z m a.s.l. | S (km2) | DP g∙m−2∙year−1 | CR mg/L | E·CE (g∙m−2∙year−1) | R mm/year | % R/P |
|---|---|---|---|---|---|---|---|---|
| N2 | 036 | 375 | 17 | 5.3 | 150 | 0.6 | 31 | 12 |
| 199 | 443 | 33 | 9.2 | 75 | 1.0 | 109 | 30 | |
| 055 | 577 | 19 | 8.8 | 35 | 1.5 | 209 | 36 | |
| 203 | 645 | 15 | 8.4 | 60 | 0.8 | 127 | 27 | |
| 037 | 990 | 13 | 7.1 | 25 | 2.0 | 203 | 34 | |
| 098-174 | 1370 | 8 | 6.0 | 15 | 1.9 | 271 | 37 | |
| N3 | 088 | 315 | 77 | 5.9 | 200 | 1.7 | 21 | 7 |
| 136 | 841 | 28 | 7.5 | 35 | 1.4 | 173 | 35 | |
| 002 | 1365 | 48 | 4.2 | 15 | 1.7 | 169 | 24 | |
| N4 | 213 | 485 | 41 | 9.0 | 300 | 2.1 | 23 | 8 |
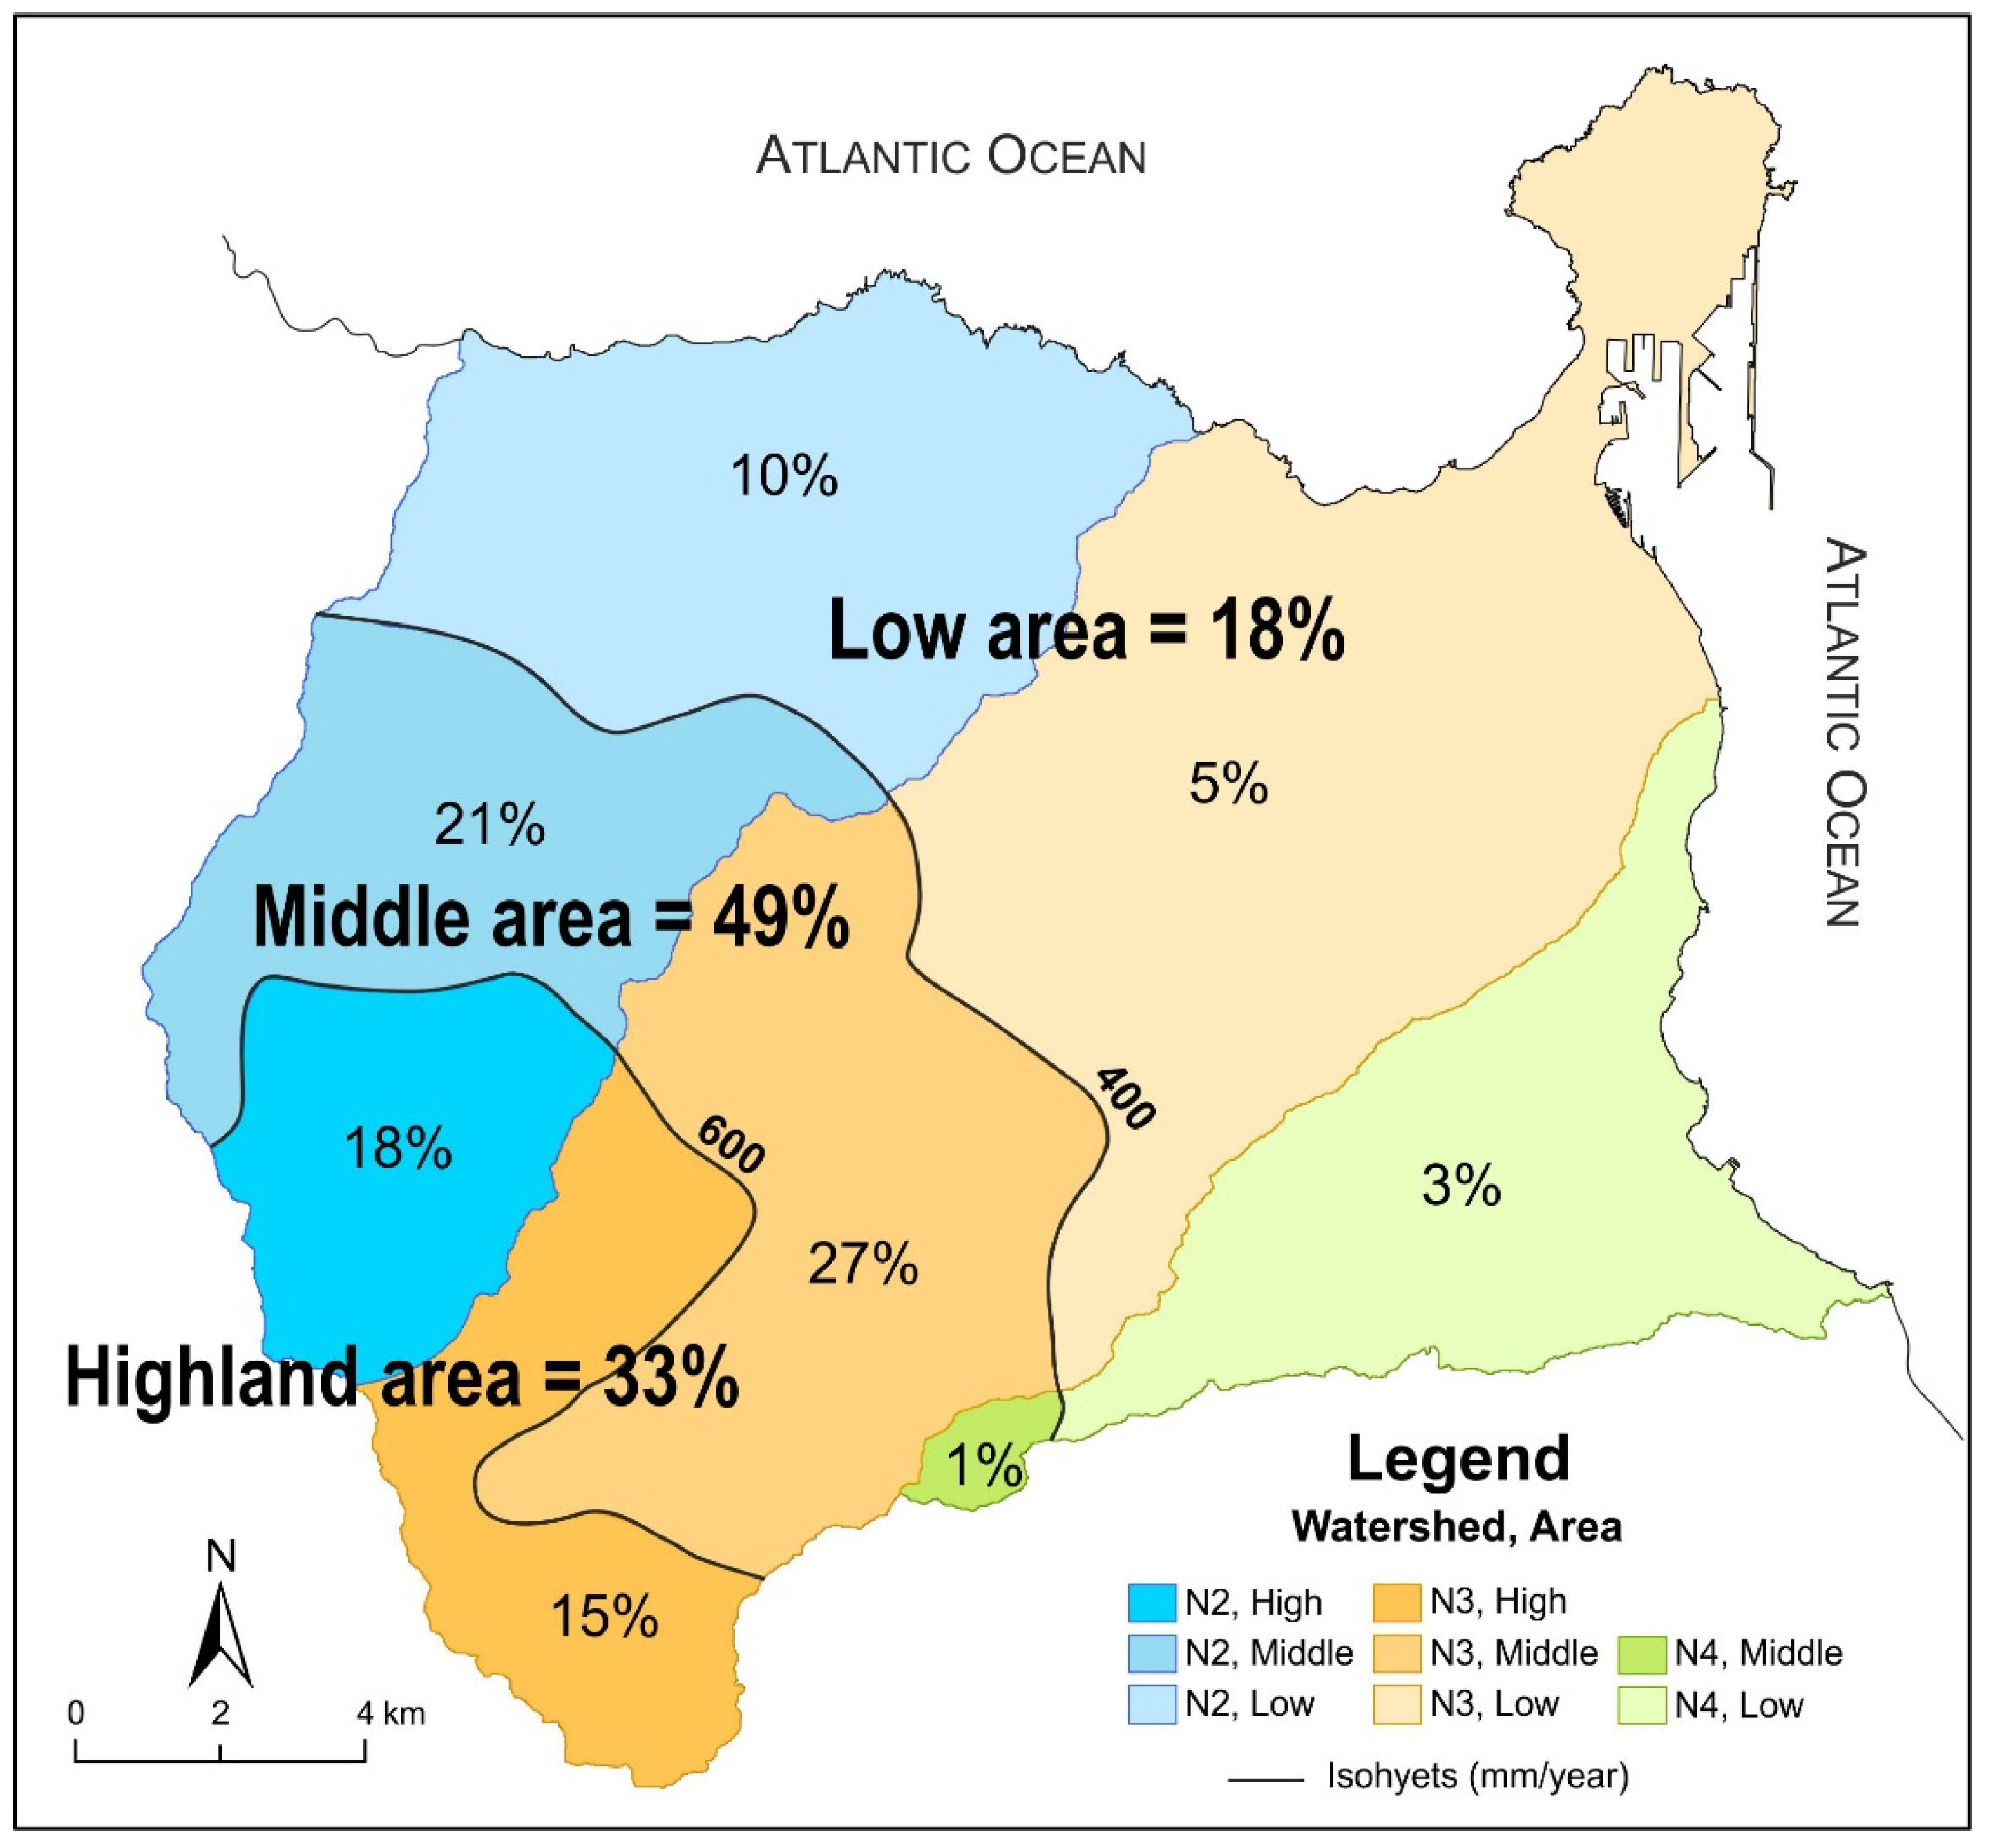
4.4. Recharge Estimation
| Zone | Area | S (km2) | Precipitation | Recharge | % R/Ptotal | ||
|---|---|---|---|---|---|---|---|
| mm/year | hm3/year | mm/year | hm3/year | ||||
| N2 | Low | 50 | 243 | 12.1 | 58 | 2.9 | 2.5 |
| Middle | 34 | 530 | 17.9 | 172 | 5.8 | 5.0 | |
| High | 22 | 652 | 14.1 | 229 | 5.0 | 4.3 | |
| Total: | 105 | 44.1 | 13.7 | 11.8 | |||
| N3 | Low | 77 | 234 | 18.1 | 17 | 1.3 | 1.1 |
| Middle | 48 | 518 | 25 | 153 | 7.4 | 6.4 | |
| High | 26 | 661 | 17.0 | 157 | 4.0 | 3.5 | |
| Total: | 151 | 60.1 | 12.7 | 11.0 | |||
| N4 | Low | 41 | 259 | 10.5 | 20 | 0.8 | 0.7 |
| Middle | 2 | 491 | 1.1 | 173 | 0.4 | 0.3 | |
| Total: | 43 | 11.5 | 1.2 | 1.0 | |||
| TOTAL | 299 | 387 | 115.7 | 92.1 | 27.6 | 23.8 | |
4.5. Uncertainty of Recharge
5. Discussion


6. Conclusions
Acknowledgments
Author Contributions
Conflicts of Interest
References
- De Vries, J.J.; Simmers, I. Groundwater recharge: An overview of processes and challenges. Hydrogeol. J. 2002, 10, 5–17. [Google Scholar] [CrossRef]
- Lerner, D.N.; Issar, A.S.; Simmers, I. (Eds.) Groundwater Recharge, a Guide to Understanding and Estimating Natural Recharge; International Association of Hydrogeologists: Hannover, Germany, 1990; Volume 8, p. 345.
- Custodio, E.; Llamas, M.R.; Samper, J. (Eds.) La Evaluación de la Recarga a los Acuíferos en la Planificación Hidrológica; Asociación Internacional de Hidrogeólogos—Grupo Español/Instituto Geológico y Minero de España: Madrid, Spain, 1997; pp. 1–455.
- Scanlon, B.R.; Healy, R.W.; Cook, P.G. Choosing appropriate techniques for quantifying groundwater recharge. Hydrogeol. J. 2002, 10, 18–39. [Google Scholar] [CrossRef]
- Custodio, E. Estimation of aquifer recharge by means of atmospheric chloride deposition balance. Contrib. Sci. 2010, 6, 81–97. [Google Scholar]
- Scanlon, B.R.; Keese, K.E.; Flint, A.L.; Flint, L.E.; Gaye, C.B.; Edmunds, W.M.; Simmers, I. Global synthesis of groundwater recharge in semiarid and arid regions. Hydrol. Process. 2006, 20, 3335–3370. [Google Scholar] [CrossRef]
- Nolan, B.T.; Healy, R.W.; Taber, P.E.; Perkins, K.; Hitt, K.J.; Wolock, D.M. Factors influencing groundwater recharge in the eastern United States. J. Hydrol. 2007, 332, 187–205. [Google Scholar] [CrossRef]
- Coes, A.L.; Spruill, T.B.; Thomasson, M.J. Multiple-method estimation of recharge rates at diverse locations in the North Carolina Coastal Plain, USA. Hydrogeol. J. 2007, 15, 773–788. [Google Scholar] [CrossRef]
- McMahon, P.B.; Plummer, L.N.; Bohlke, J.K.; Shapiro, S.D.; Hinkle, S.R. A comparison of recharge rates in aquifers of the United States based on groundwater-based data. Hydrogeol. J. 2011, 19, 779–800. [Google Scholar] [CrossRef]
- Allison, G.B. A review of some of the physical, chemical and isotopic techniques available for estimating groundwater recharge. In Estimation of Natural Groundwater Recharge; Simmers, I., Ed.; NATO ASI Series; Springer: Berlin, Germany, 1988; Volume 222, pp. 49–72. [Google Scholar]
- Custodio, E. Groundwater in volcanic hard rocks. In Groundwater in Fractured Rocks; Krásný, J., Sharp, J.M., Eds.; Taylor & Francis: London, UK, 2007; pp. 95–105. [Google Scholar]
- Eriksson, E.; Khunakasem, V. Chloride concentrations in groundwater, recharge rate and rate of deposition of chloride in the Israel coastal plain. J. Hydrol. 1969, 7, 178–197. [Google Scholar] [CrossRef]
- Wood, W.W.; Sanford, W.E. Chemical and isotopic methods for quantifying ground-water recharge in a regional, semiarid environment. Ground Water 1995, 33, 458–468. [Google Scholar] [CrossRef]
- Scanlon, B.; Mukherjee, A.; Gates, J.; Reedy, R.; Sinha, A. Groundwater recharge in natural dune systems and agricultural ecosystems in the Thar Desert region, Rajasthan, India. Hydrogeol. J. 2010, 18, 959–972. [Google Scholar] [CrossRef]
- Alcalá, F.J.; Custodio, E. Natural uncertainty of spatial average aquifer recharge through atmospheric chloride mass balance in continental Spain. J. Hydrol. 2015, 524, 642–661. [Google Scholar] [CrossRef]
- Richter, D.D.; Ralston, C.W.; Harms, W.R. Chemical composition and spatial variation of bulk precipitation at a coastal plain watershed in South Carolina. Water Resour. Res. 1983, 19, 134–140. [Google Scholar] [CrossRef]
- Keywood, M.D.; Chivas, A.R.; Fifield, L.K.; Cresswell, R.G.; Ayers, G.P. The accession of chloride to the western half of the Australian continent. Aust. J. Soil Res. 1997, 35, 1177–1190. [Google Scholar] [CrossRef]
- Gustafsson, M.R.; Hallgren Larsson, E. Spatial and temporal patterns of chloride deposition in Southern Sweden. Water Air Soil Pollut. 2000, 124, 345–369. [Google Scholar] [CrossRef]
- Alcalá, F.J.; Custodio, E. Atmospheric chloride deposition in continental Spain. Hydrol. Process. 2008, 22, 3636–3650. [Google Scholar] [CrossRef]
- Alcalá, F.J.; Custodio, E. Spatial average aquifer recharge through atmospheric chloride mass balance and its uncertainty in a large varied territory. Hydrol. Process. 2014, 28, 218–236. [Google Scholar] [CrossRef]
- Bresciani, E.; Ordens, C.M.; Werner, A.D.; Batelaan, O.; Guan, H.; Post, V.E.A. Spatial variability of chloride deposition in a vegetated coastal area: Implications for groundwater recharge estimation. J. Hydrol. 2014, 519, 1177–1191. [Google Scholar] [CrossRef]
- Herrera, C.; Custodio, E. Groundwater flow in a relatively old oceanic volcanic island: The Betancuria area, Fuerteventura Island, Canary Islands, Spain. Sci. Total Environ. 2014, 49, 531–550. [Google Scholar] [CrossRef]
- Marrero-Díaz, R.; Pérez, N.M.; Alcalá, F.J.; Melián, G.V.; Padrón, E.; Padilla, G.D. Estimación de la recarga mediante balance de masas de cloruro atmosférico en la Caldera de Las Cañadas, Tenerife, Islas Canarias. In Estudio, Aprovechamiento y Gestión del Agua en Terrenos e Islas Volcánicas; Cabrera, M.C., Cruz-Fuentes, T., Mendoza-Grimón, V., Palacios-Díaz, M.P., Eds.; Instituto Geológico y Minero de España and International Association of Hydrogeologists-Spanish Group: Las Palmas de Gran Canaria, Spain, 2015; pp. 207–214. [Google Scholar]
- Cruz, T. Contribución de la Modelación Numérica e Hidroquímica al Conocimiento del Acuífero de La Aldea (Gran Canaria). Ph.D. Thesis, Universidad de Las Palmas de Gran Canaria, Las Palmas de Gran Canaria, Spain, 2008; pp. 1–283. [Google Scholar]
- Gasparini, A.; Custodio, E.; Fontes, J.C.; Jimenez, J.; Núñez, J.A. Exemple d’étude géochimique et isotopique de circulations áquiferes en terrains volcanique sous climat semi-aride (Amurga, Grande Canarie, Iles Canaries). J. Hydrol. 1990, 114, 61–91. [Google Scholar] [CrossRef]
- Benavides, A.; Galindo, E. Evolución de la piezometría de la zona norte de la isla de Gran Canaria. In El conocimiento de los Recursos Hídricos en Canarias Cuatro Décadas Después del Proyecto SPA-15; Cabrera, M.C., Jiménez, J., Custodio, E., Eds.; Las Palmas de Gran Canaria: Las Palmas, Spain, 2010; pp. 53–59. [Google Scholar]
- Estévez, E.; Cabrera, M.C.; Molina-Díaz, A.; Robles-Molina, J.; Palacios-Díaz, M.P. Screening of emerging contaminants and priority substances (2008/105/EC) in reclaimed water for irrigation and groundwater in a volcanic aquifer (Gran Canaria, Canary Islands, Spain). Sci. Total Environ. 2012, 433, 538–546. [Google Scholar] [CrossRef] [PubMed]
- MOP-UNESCO. Estudio Científico de los Recursos de Agua en las Islas Canarias (SPA/69/515); Centro de Estudios Hidrográficos-Servicio Geológico de Obras Públicas, Las Palmas de Gran Canaria-Madrid: Las Palmas, Spain, 1975; Volume 4. [Google Scholar]
- Cruz-Fuentes, T.; Heredia, J.; Cabrera, M.C.; Custodio, E. Behaviour of a small sedimentary volcanic aquifer receiving irrigation return flows: La Aldea, Gran Canaria, Canary Islands (Spain). Hydrogeol. J. 2014, 22, 865–882. [Google Scholar] [CrossRef]
- Guan, H.; Love, A.J.; Simmons, C.T.; Hutson, J.; Ding, Z. Cathcment conceptualization for examining applicability of chloride mass balance method in an area with historical forest clearance. Hydrol. Earth Syst. Sci. 2010, 14, 1233–1245. [Google Scholar] [CrossRef]
- United Stated Soil Conservation Service (US-SCS). National Engineering Handbook, Section 4; U.S. Department of Agriculture: Washington, DC, USA, 1972.
- United Stated Soil Conservation Service (US-SCS). National Engineering, Handbook, Section 4: Hydrology; U.S. Department of Agriculture: Washington, DC, USA, 1985.
- Cruz-Fuentes, T.; Naranjo, G.; Cabrera, M.C.; Custodio, E. Estimación de la escorrentía superficial mediante la generación automática del número de curva con un SIG. Aplicación al norte de Gran Canaria (Islas Canarias, España). In Proceedings II Congreso Ibérico de las Aguas Subterráneas, CIAS2014; Gómez-Hernández, J., Rodrigo-Illari, J., Eds.; Universidad Politécnica de Valencia: Valencia, Spain, 2014; pp. 217–232. [Google Scholar]
- Custodio, E. Coastal aquifer salinization as a consequence of aridity: The case of Amurga phonolitic massif, Gran Canaria Island. In Study and Modeling of Saltwater Intrusion into Aquifers; Custodio, E., Galofré, A., Eds.; CIMNE: Barcelona, Spain, 1993; pp. 81–98. [Google Scholar]
- Cabrera, M.C.; Naranjo, G.; Hernández-Quesada, P.; Benavides, A.; Estévez, E.; Cruz-Fuentes, T.; Martín, L.F.; Custodio, E. Estimación de la recarga natural a los acuíferos del Norte de Gran Canaria a partir del balance de cloruros. In Temas Actuales de la Hidrología Subterránea; González, N., Kruse, E., Trovatto, M.M., Laurencena, P., Eds.; Provincia de Buenos Aires: La Plata, Argentina, 2013; pp. 247–254. [Google Scholar]
- Boletín Oficial de Canarias (BOC). Decreto 82/1999,de 6 de Mayo, por el que se Aprueba el Plan Hidrológico Insular de Gran Canaria; Consejería de Obras Públicas, Vivienda y Aguas, Gobierno de Canarias: Canary Islands, Spain, 1999; pp. 8218–8436. [Google Scholar]
- Naranjo, G.; Cabrera, M.C.; Cruz-Fuentes, T.; Martín, L.F.; Custodio, E. Cuantificación de la recarga natural al acuífero del norte de Gran Canaria mediante el balance diario de agua en el suelo. In Estudio, Aprovechamiento y Gestión del Agua en Terrenos E Islas Volcánicas; Cabrera, M.C., Cruz-Fuentes, T., Mendoza-Grimón, V., Palacios-Díaz, M.P., Eds.; Instituto Geológico y Minero de España and International Association of Hydrogeologists-Spanish Group, Las Palmas de Gran Canaria: Las Palmas, Spain, 2015; pp. 247–254. [Google Scholar]
- Custodio, E.; Cabrera, M.C.; Poncela, R.; Cruz-Fuentes, T.; Naranjo, G.; Puga de Miguel, L.O. Uncertainty in groundwater governance. General comments and application to the volcanic Canary Islands, Spain. Water. submitted.
© 2015 by the authors; licensee MDPI, Basel, Switzerland. This article is an open access article distributed under the terms and conditions of the Creative Commons Attribution license (http://creativecommons.org/licenses/by/4.0/).
Share and Cite
Naranjo, G.; Cruz-Fuentes, T.; Cabrera, M.D.C.; Custodio, E. Estimating Natural Recharge by Means of Chloride Mass Balance in a Volcanic Aquifer: Northeastern Gran Canaria (Canary Islands, Spain). Water 2015, 7, 2555-2574. https://doi.org/10.3390/w7062555
Naranjo G, Cruz-Fuentes T, Cabrera MDC, Custodio E. Estimating Natural Recharge by Means of Chloride Mass Balance in a Volcanic Aquifer: Northeastern Gran Canaria (Canary Islands, Spain). Water. 2015; 7(6):2555-2574. https://doi.org/10.3390/w7062555
Chicago/Turabian StyleNaranjo, Gema, Tatiana Cruz-Fuentes, María Del Carmen Cabrera, and Emilio Custodio. 2015. "Estimating Natural Recharge by Means of Chloride Mass Balance in a Volcanic Aquifer: Northeastern Gran Canaria (Canary Islands, Spain)" Water 7, no. 6: 2555-2574. https://doi.org/10.3390/w7062555