
Improving Water Use in Fodder Production


Abstract
:1. Introduction
2. Materials and Methods
2.1. Experimental Plot

2.2. Soil Analysis

| Transplant | T1/T2 | pH | CE 1:5 | OM | C/N | N tot | Nitrate | P | K | Ca | Mg | Na | B | Cu | Fe | Mn | Zn | |
|---|---|---|---|---|---|---|---|---|---|---|---|---|---|---|---|---|---|---|
| 8.1 | 1.23 | 6.61 | 10.55 | 0.36 | 498 | 151.5 | 9.58 | 24.82 | 8.85 | 5.8 | 6.63 | -- | -- | -- | -- | |||
| May | T1 | Mean | 8.6 b | 0.7 | 3.0 a | 8.4 | 0.21 | 171 a | 123 a | 8.0 a | 18.8 | 8.9 c | 4.01 a | 6.6 | 1.6 b | 4.5 a | 12.9 a | 4.2 b |
| Std. | 0.07 | 0.28 | 0.12 | 0.14 | 0.01 | 46.7 | 33.9 | 4.31 | 0.64 | 0.35 | 1.41 | 0.00 | 0.00 | 0.57 | 0.00 | 0.38 | ||
| T2 | Mean | 8.6 b | 0.5 | 2.5 a | 8.5 | 0.17 | 152 a | 75 a | 5.5 a | 20.5 | 9.4 c | 4.10 a | 5.7 | 1.8 b | 4.9 a | 13.2 a | 4.1 b | |
| Std. | 0.0 | 0.08 | 0.46 | 0.92 | 0.01 | 28.3 | 33.2 | 2.12 | 1.56 | 0.42 | 0.14 | 0.57 | 0.07 | 0.35 | 1.7 | 0.00 | ||
| July | T1 | Mean | 8.5 a | 1.1 | 3.2 a | 8.6 | 0.22 | 295 a | 174 a | 9.8 a | 26.00 | 6.00 a | 6.90 b | 8.1 | 1.0 a | 2.7 a | 11.1 a | 2.5 a |
| Std. | 0.0 | 0.29 | 0.32 | 0.0 | 0.02 | 135.1 | 50.2 | 4.24 | 4.03 | 0.64 | 0.49 | 1.27 | 0.03 | 0.14 | 1.06 | 2.07 | ||
| T2 | Mean | 8.4 a | 0.6 | 2.7 a | 8.2 | 0.19 | 206 a | 86 a | 5.6 a | 28.4 | 7.00 b | 5.00 b | 6.7 | 1.2 a | 3.4 a | 13.4 a | 2.5 a | |
| Std. | 0.0 | 0.09 | 0.28 | 0.28 | 0.03 | 91.9 | 38.9 | 1.63 | 2.62 | 0.21 | 0.35 | 1.27 | 0.21 | 1.06 | 1.41 | 0.78 | ||
| September | T1 | Mean | 8.5 a | 1.2 | 3.3 b | 8.8 | 0.22 | 250 a | 124 a | 10.4 | 23.8 | 8.2 c | 6.90 b | 7.3 | 2.6 c | 7.7 b | 26.6 b | 7.2 c |
| Std. | 0.0 | 0.58 | 0.05 | 0.14 | 0.01 | 101.1 | 50.9 | 5.52 | 14.71 | 3.32 | 1.34 | 1.13 | 0.57 | 1.63 | 1.7 | 1.27 | ||
| T2 | Mean | 8.5 a | 1.2 | 2.9 a | 8.8 | 0.19 | 146 a | 87 a | 5.9 a | 29.2 | 8.8 c | 5.60 b | 6.9 | 2.3 c | 6.7 b | 32.1 b | 7.7 c | |
| Std. | 0.7 | 0.65 | 0.2 | 0.07 | 0.01 | 45.3 | 49.5 | 2.12 | 18.1 | 4.31 | 0.35 | 0.78 | 0.28 | 1.34 | 2.4 | 1.38 | ||
2.3. Forage Characterization
2.4. Irrigation System
2.5. Statistical Analysis
3. Results and Discussion
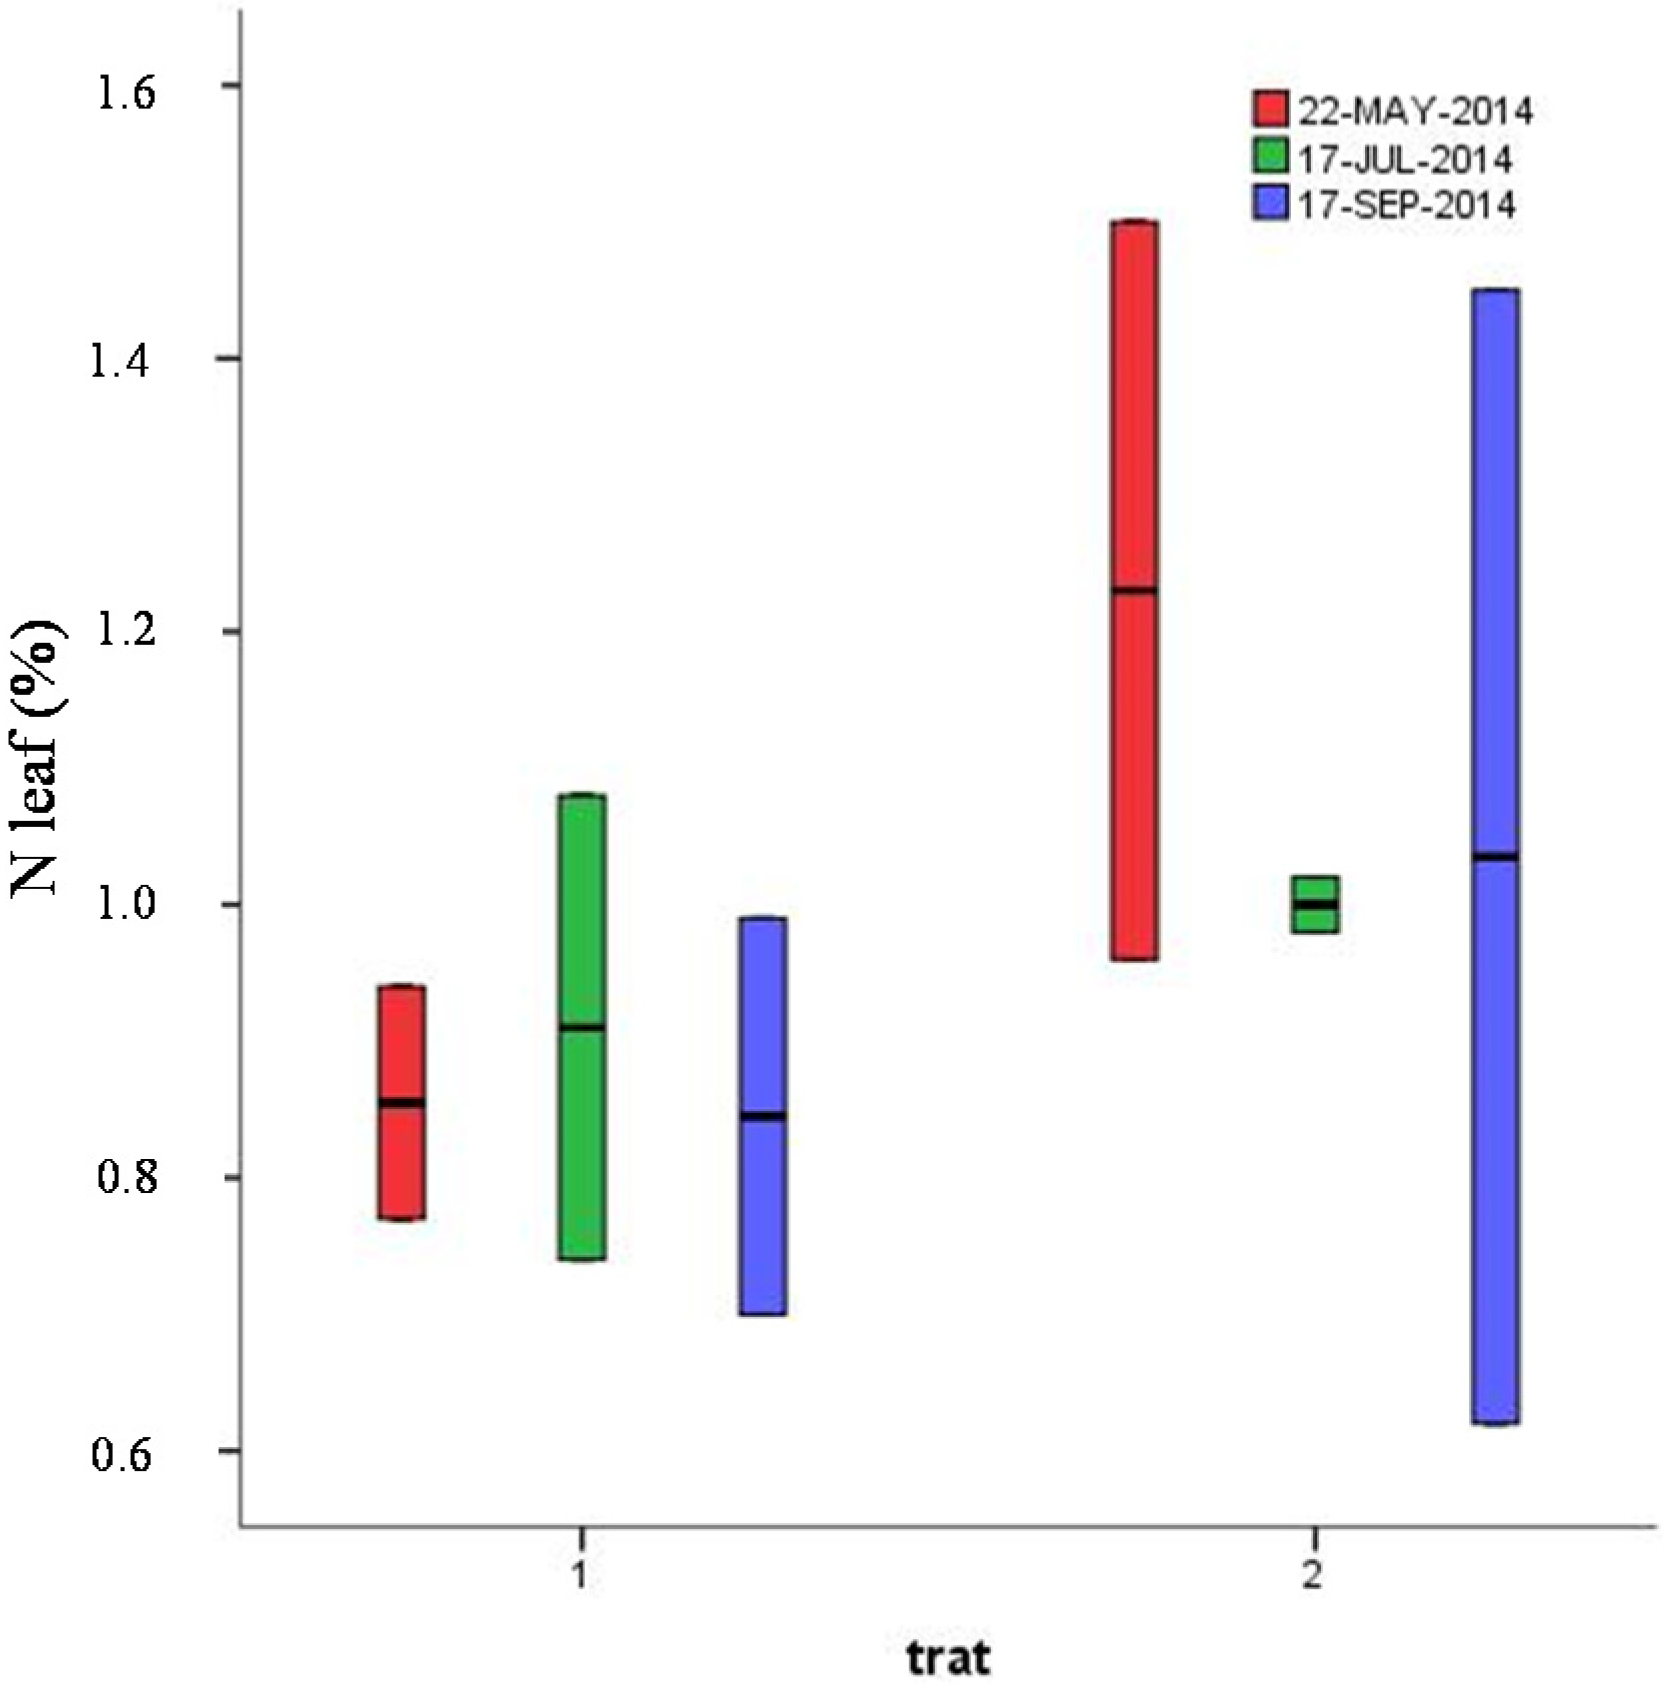
| Transplant | T1/T2 | DM | N | P | K | Ca | Mg | Na | B | Cu | Fe | Mn | Zn | |
|---|---|---|---|---|---|---|---|---|---|---|---|---|---|---|
| May | T1 | Mean | 9.42 a | 0.86 a | 0.31 a,b | 5.75 c | 0.17 | 0.11 | 0.07 | 11.50 | 5.50 | 64.00 | 36.50 | 23.00 |
| std | 0.85 | 0.12 | 0.12 | 0.25 | 0.10 | 0.01 | 0.04 | 0.71 | 0.71 | 15.56 | 7.78 | 2.83 | ||
| T2 | Mean | 9.70 a | 1.23 a | 0.22 a | 5.46 c | 0.20 | 0.14 | 0.07 | 9.50 | 6.00 | 77.50 | 48.00 | 26.50 | |
| std | 0.07 | 0.38 | 0.06 | 0.08 | 0.04 | 0.04 | 0.01 | 2.12 | 0.00 | 6.36 | 9.90 | 0.71 | ||
| July | T1 | Mean | 9.56 a | 0.9 a | 0.36 b | 5.13 b | 0.13 | 0.15 | 0.06 | 16.50 | 5.00 | 81.00 | 35.00 | 37.50 |
| std | 0.00 | 0.24 | 0.04 | 0.08 | 0.03 | 0.01 | 0.02 | 0.71 | 0.00 | 32.53 | 4.24 | 9.19 | ||
| July | T2 | Mean | 9.56 a | 1.00 a | 0.36 b | 4.98 b | 0.12 | 0.16 | 0.05 | 17.00 | 5.00 | 71.50 | 34.00 | 36.00 |
| std | 0.00 | 0.03 | 0.04 | 0.50 | 0.01 | 0.02 | 0.01 | 1.41 | 0.00 | 23.33 | 5.66 | 9.90 | ||
| September | T1 | Mean | 21.26 b | 0.85 a | 0.34 b | 4.97 b | 0.10 | 0.13 | 0.04 | 11.50 | 4.50 | 70.50 | 22.00 | 36.50 |
| std | 0.96 | 0.21 | 0.04 | 0.35 | 0.01 | 0.03 | 0.01 | 0.71 | 0.71 | 12.02 | 4.24 | 2.12 | ||
| T2 | Mean | 21.83 b | 1.04 a | 0.25 a | 3.84 a | 0.13 | 0.14 | 0.04 | 14.00 | 4.00 | 75.00 | 28.00 | 29.50 | |
| std | 1.05 | 0.59 | 0.03 | 0.40 | 0.08 | 0.04 | 0.01 | 4.24 | 0.00 | 22.63 | 9.90 | 6.36 | ||
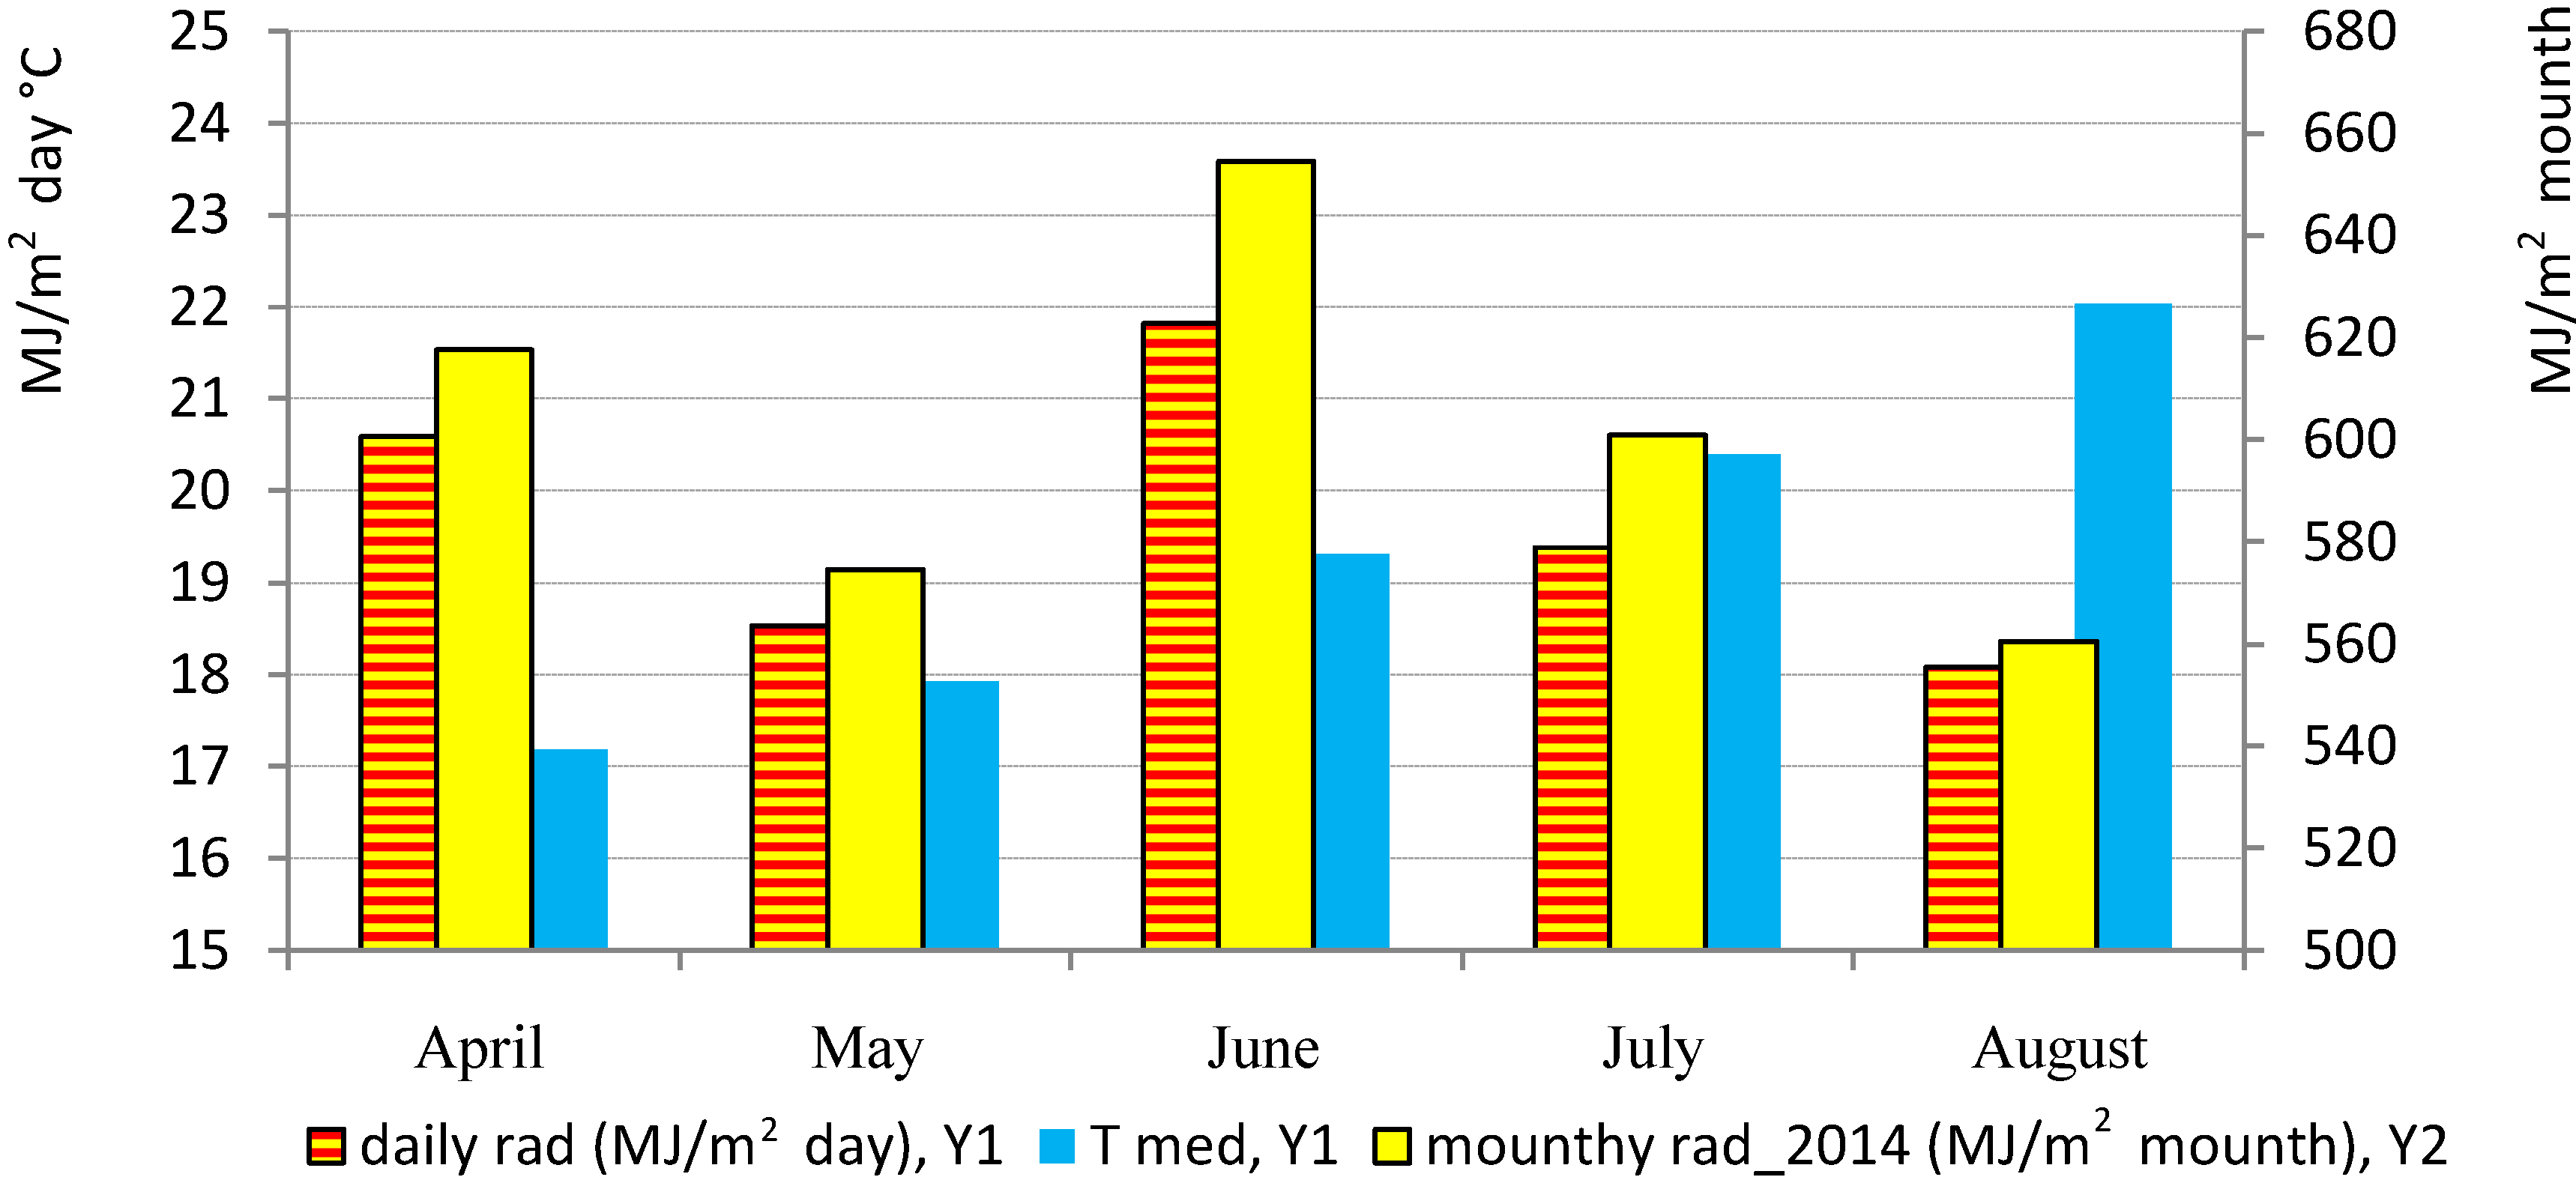
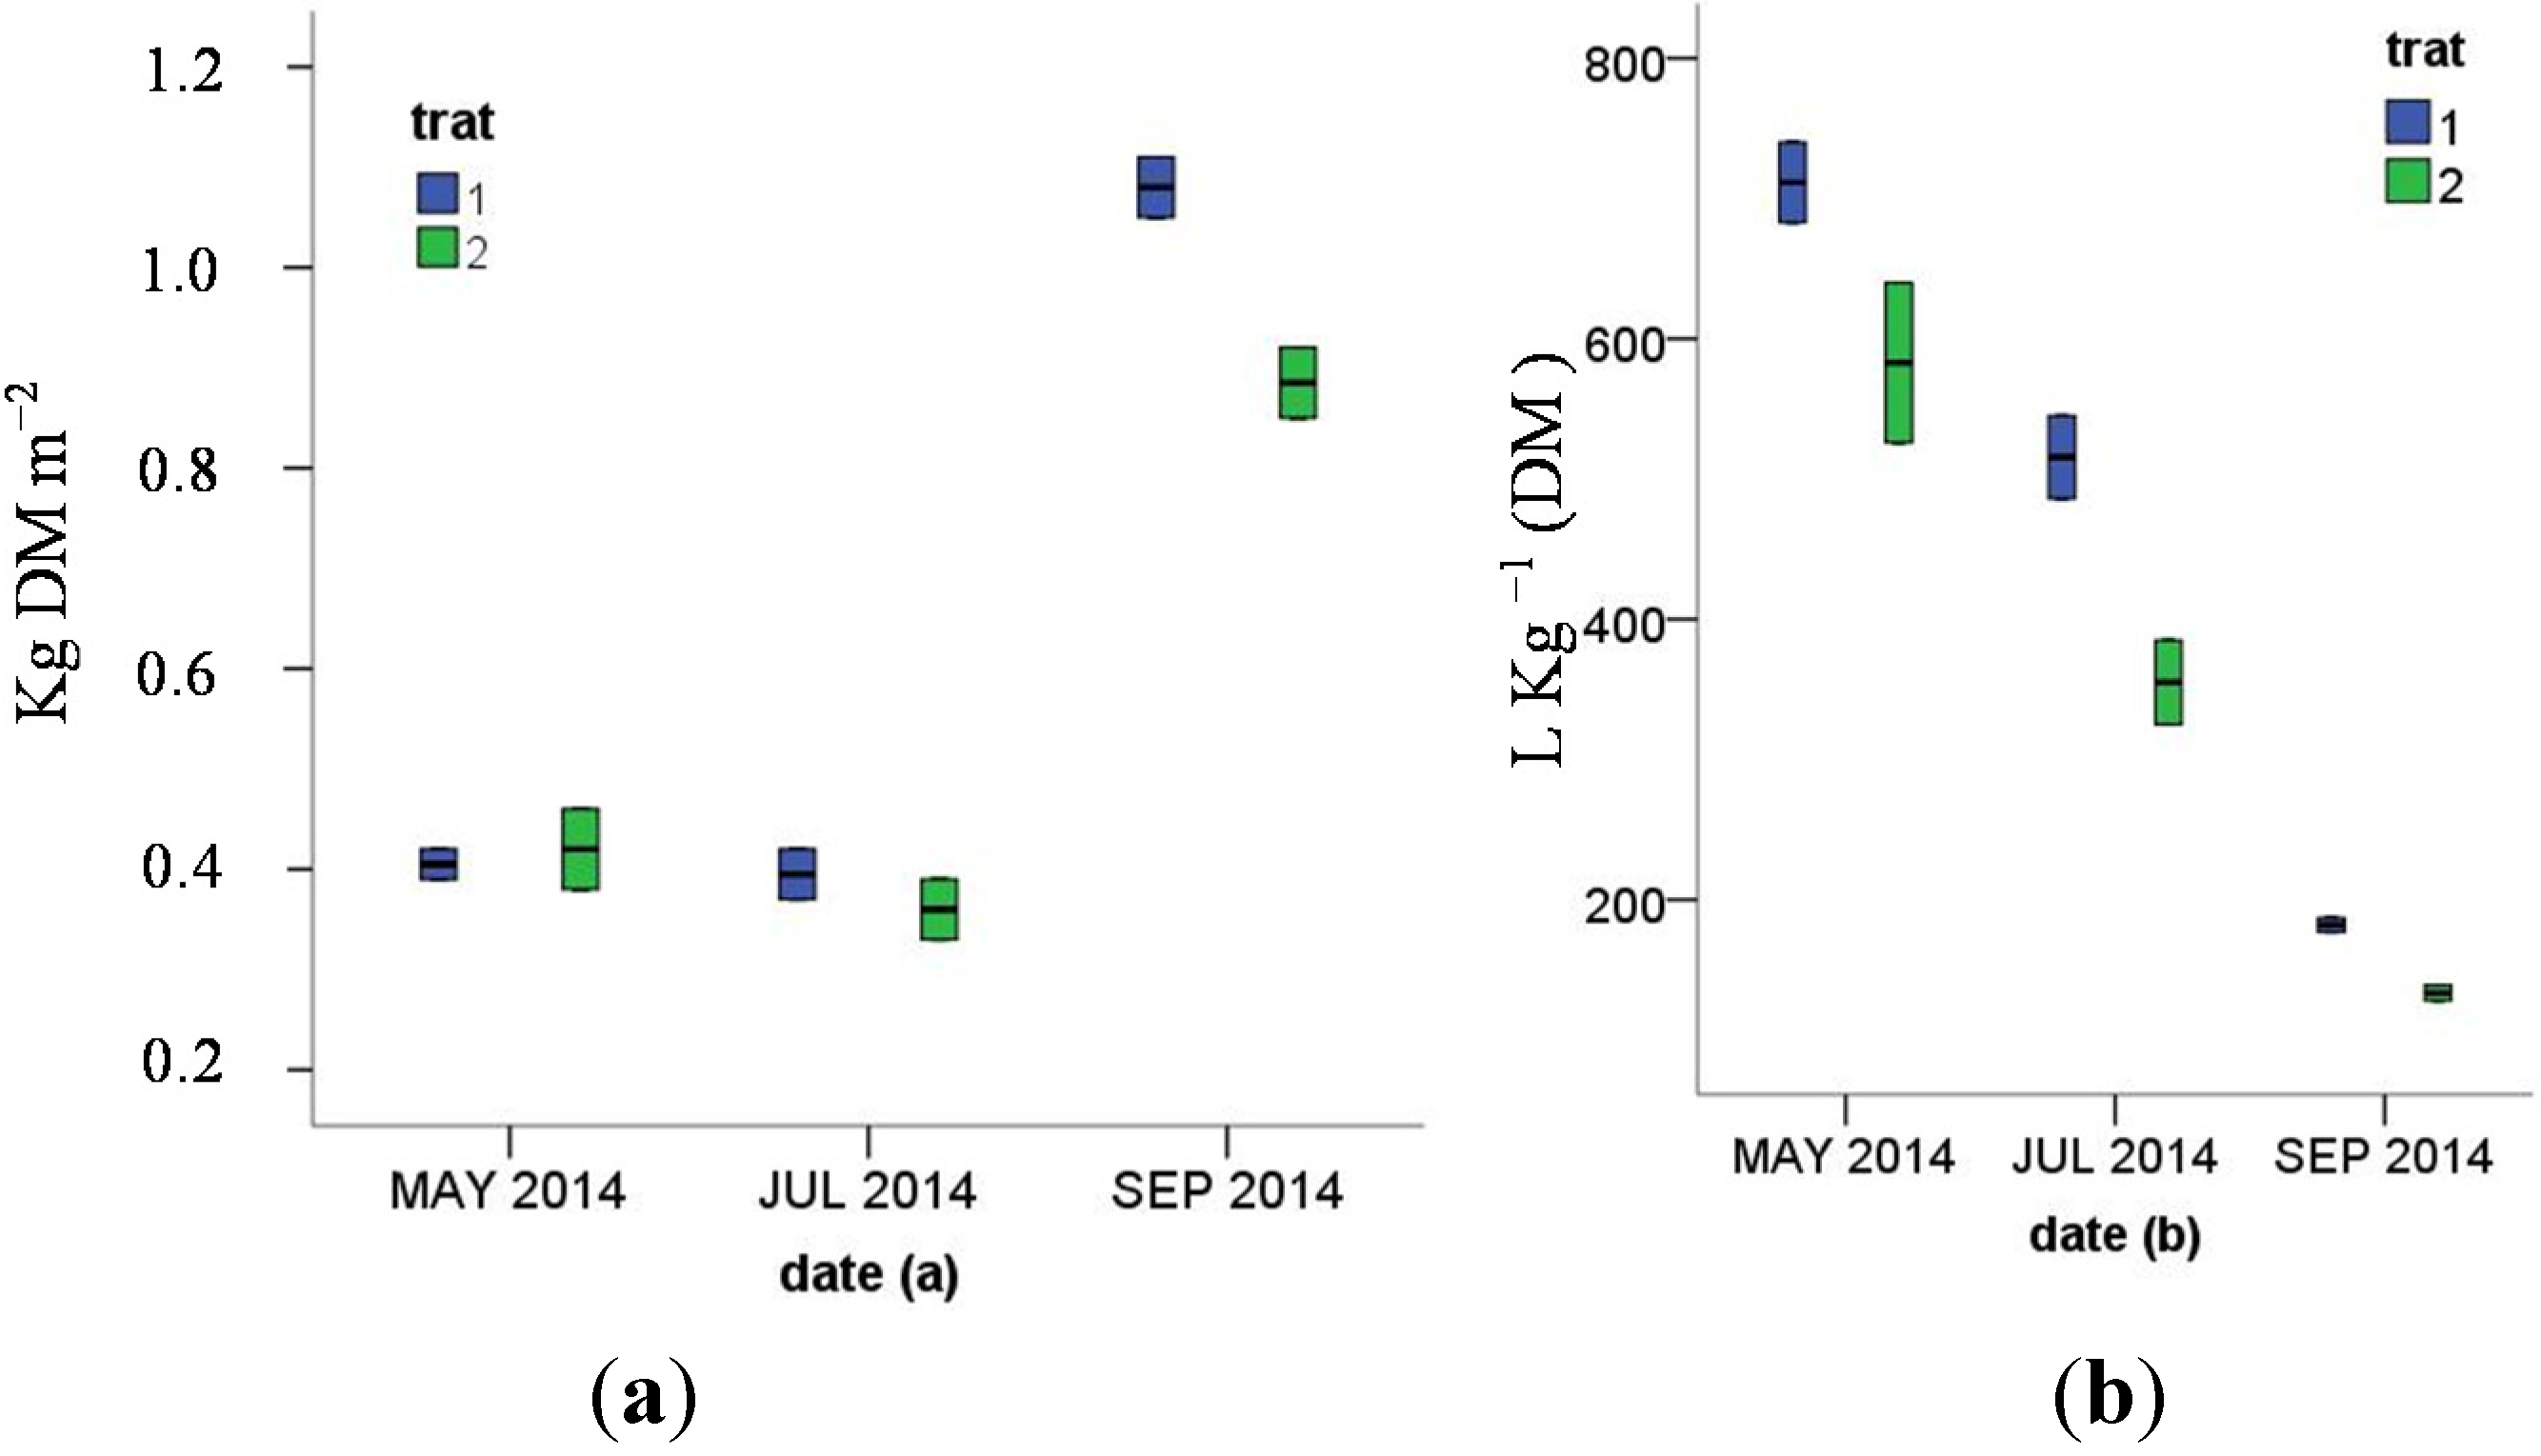
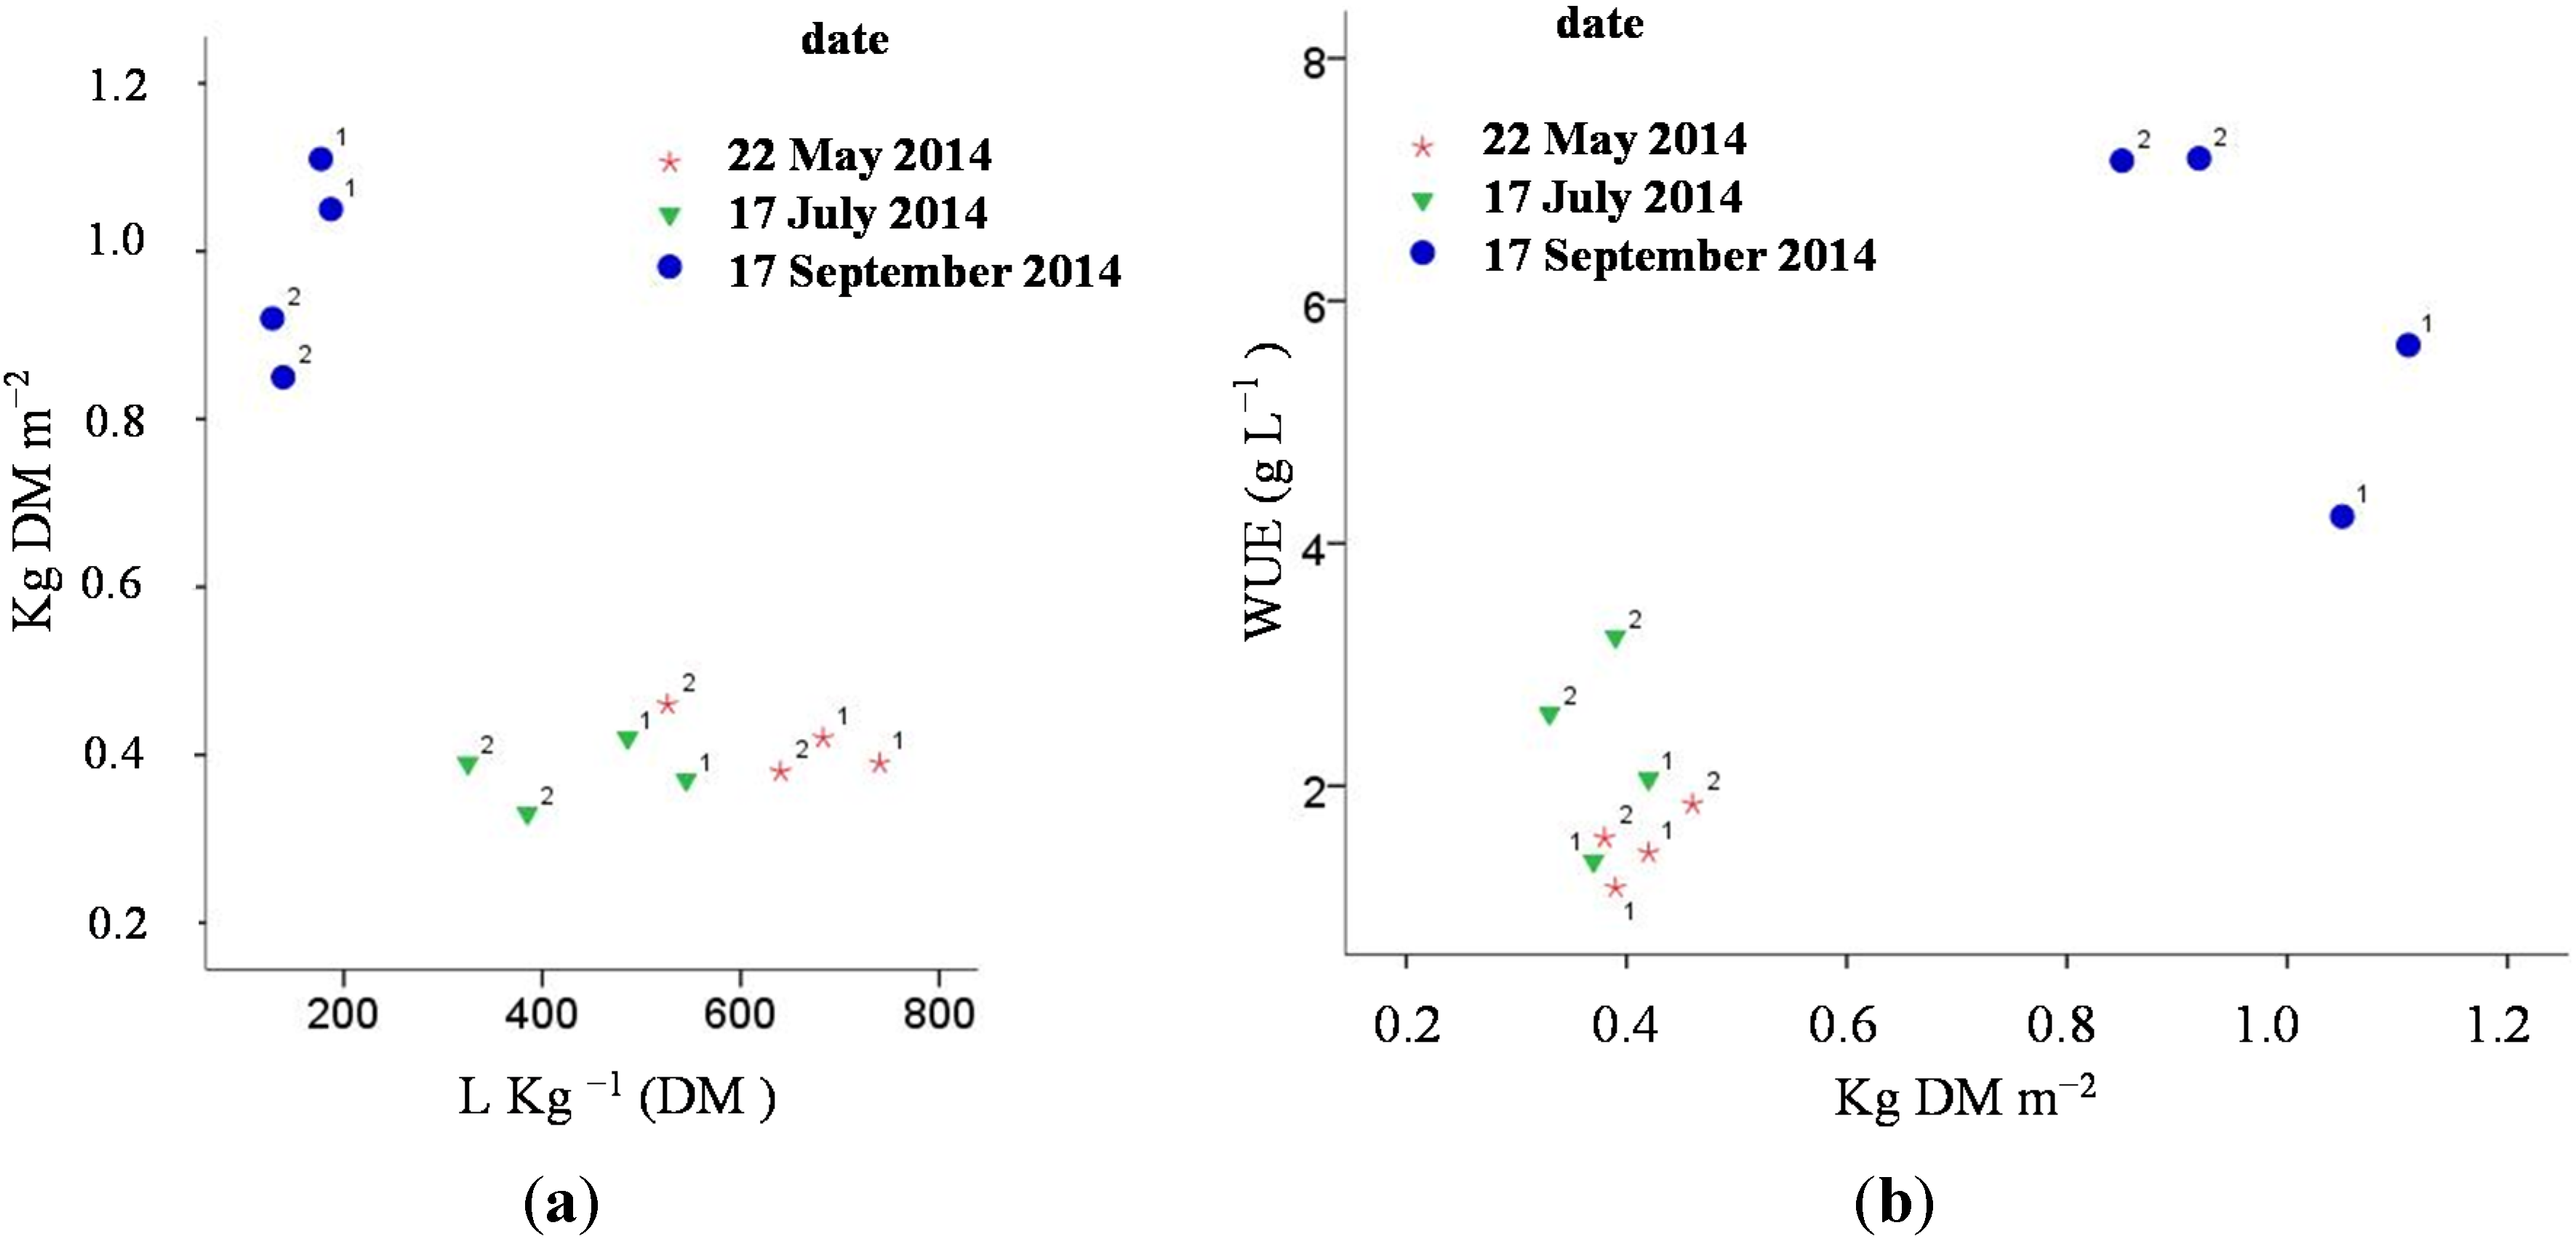
| Date | Days | TI Period | Rad Period | Wcons (L/m2) | ETo (L/m2) | Wcons/ETo (%) | T1 | T2 | |||||||||
|---|---|---|---|---|---|---|---|---|---|---|---|---|---|---|---|---|---|
| kgDM·m−2 | L·kg-1DM | kgDM·m−2 | L·kg-1 DM | ||||||||||||||
| ° | MJ/m2 | T1 | T2 | Ac | Mean | T1 | T2 | Mean | Std | Mean | Std | Mean | Std | Mean | Std | ||
| 22 May 2014 | 100 | 900 | 1862 | 287 | 243 | 333.1 | 3.3 | 86.2 | 73.0 | 0.40 a | 0.02 | 712 f | 40.64 | 0.42 a | 0.06 | 583e | 81.10 |
| 17 July 2014 | 55 | 519 | 1097 | 203 | 127 | 211.4 | 3.8 | 96.0 | 60.1 | 0.40 a | 0.03 | 516 d | 41.41 | 0.36 a | 0.04 | 355c | 42.50 |
| 17 September 2014 | 60 | 706 | 1183 | 197 | 118 | 224.3 | 3.6 | 87.8 | 52.6 | 1.08 c | 0.04 | 182 b | 6.98 | 0.88 b | 0.05 | 134a | 7.58 |


4. Conclusions
Acknowledgments
Author Contributions
Conflicts of Interest
References
- Peden, D.; Tadesse, G.; Misra, A.K. Water and livestock for human development. In Water for Food, Water for Life: A Comprehensive Assessment of Water Management in Agriculture; Molden, D., Ed.; Earthscan: London, UK; International Water Management Institute: Colombo, Sri Lanka, 2007; pp. 485–514. [Google Scholar]
- Real Decreto 1620/2007, de 7 de Diciembre, Por el Que se Establece el Régimen Jurídico de la Reutilización de las Aguas Depuradas. Available online: http://www.boe.es/diario_boe/txt.php?id=BOE-A-2007-21092 (accessed on 25 May 2015).
- Winpenny, J.; Heinz, I.; Koo-Oshima, S. Reutilización del Agua en Agricultura: Beneficios Para Todos? FAO Informe sobre Temas hídricos: Rome, Italy, 2013; p. 35. [Google Scholar]
- Palacios-Díaz, M.P.; Mendoza-Grimón, V.; Fernández-Vera, J.R.; Rodríguez-Rodríguez, F.; Tejedor-Junco, M.T.; Hernández-Moreno, J.M. Subsurface drip irrigation and reclaimed water quality effects on phosphorus and salinity distribution and forage production. Agric. Water Manag. 2009, 96, 1659–1666. [Google Scholar] [CrossRef]
- Jensen, M.E. Water consumption by agricultural plants. In Water Deficits and Plant Growth; Kozlowski, T.T., Ed.; Academic Press: New York, NY, USA, 1968; pp. 1–22. [Google Scholar]
- Márquez, F.; Sánchez, J.; Urbano, D.; Dávila, C. Evaluación de la frecuencia de corte y tipos de fertilización sobre tres genotipos de pasto elefante (Pennisetum purpureum). 1. Rendimiento y contenido de proteína. Zootec. Trop. 2007, 25, 253–259. (In Spanish) [Google Scholar]
- Murillo Solano, J.; Barros Henríquez, J.A.; Roncallo Fandiño, B.; Arrieta Pico, G. Requerimientos hídricos de cuatro gramíneas de corte para uso eficiente del agua en el Caribe seco colombiano. Corpoica Cienc. Tecnol. Agropecu. 2014, 15, 83–99. (In Spanish) [Google Scholar]
- ISSS/ISRIC/FAO. World reference base for soil resources. In World Soil Resources Reports; FAO: Rome, Italy, 1998; Volume 84. [Google Scholar]
- Soil Survey Staff. Keys to Soil Taxonomy, 8th ed.; USDA-NRCS: Washington, DC, USA, 1998. [Google Scholar]
- Olsen, S.R.; Sommers, L.E. Phosphorus. In Methods of Soil Analysis. Part2. Chemical and Microbiological Properties, Agronomy Monograph 9.2; Miller, R.H., Keeney, E.R., Eds.; America Society Agronmy, Inc. and Soil Science of America, Inc.: Madison, WI, USA, 1982; pp. 1035–1049. [Google Scholar]
- Palacios-Díaz, M.P.; Mendoza-Grimón, V.; Fernández-Vera, J.R.; Hernández-Moreno, J.M. Effects of defoliation and nitrogen uptake on forage nutritive values of Pennisetum sp. J. Anim. Plant Sci. 2013, 23, 566–574. [Google Scholar]
- Tropical Forages: An Interactive Selection Tool. Available online: http://www.tropicalforages.info/ (accessed on 21 May 2015).
- Zhang, H.; Oweis, T. Water-yield relations and optimal irrigation scheduling of wheat in the Mediterranean region. Agric. Water Manag. 1999, 38, 195–211. [Google Scholar] [CrossRef]
© 2015 by the authors; licensee MDPI, Basel, Switzerland. This article is an open access article distributed under the terms and conditions of the Creative Commons Attribution license (http://creativecommons.org/licenses/by/4.0/).
Share and Cite
Mendoza-Grimón, V.; Hernández-Moreno, J.M.; Palacios-Díaz, M.D.P. Improving Water Use in Fodder Production. Water 2015, 7, 2612-2621. https://doi.org/10.3390/w7062612
Mendoza-Grimón V, Hernández-Moreno JM, Palacios-Díaz MDP. Improving Water Use in Fodder Production. Water. 2015; 7(6):2612-2621. https://doi.org/10.3390/w7062612
Chicago/Turabian StyleMendoza-Grimón, Vanessa, José Manuel Hernández-Moreno, and María Del Pino Palacios-Díaz. 2015. "Improving Water Use in Fodder Production" Water 7, no. 6: 2612-2621. https://doi.org/10.3390/w7062612