Article

Spatial Distribution of Field Physico-Chemical Parameters in the Vulcano Island (Italy) Coastal Aquifer: Volcanological and Hydrogeological Implications

1
INGV, Sezione di Palermo, via Ugo La Malfa 153, Palermo 90146, Italy
2
CNR-IGAG, via Eudossiana 18, Roma 00184, Italy
*
Author to whom correspondence should be addressed.
Water 2015, 7(7), 3206-3224; https://doi.org/10.3390/w7073206
Submission received: 17 April 2015 / Revised: 12 June 2015 / Accepted: 16 June 2015 / Published: 25 June 2015
(This article belongs to the Special Issue Study, Development and Management of Water in Volcanic Areas)

Abstract

:
Vulcano, the southernmost of the Aeolian island arc (Italy), is characterized by a shallow coastal aquifer resulting from the mixing of seawater, meteoric recharge and volcanogenic fluids. The aquifer has been intensively studied during the last decades, but a comprehensive hydrogeological model has never been developed due to the lack of direct information about the litho-stratigraphic columns of the wells and the depth of water bearing levels. We present and discuss here the time and spatial analysis of water table elevation, temperature and electric conductivity data, acquired during the last 20 years in 33 wells located at Vulcano Island, with the aim of developing a groundwater circulation scheme able to fit the field observations. We retrieved a circulation scheme characterized by an intricate geometry of flow paths driven by horizontal and vertical permeability variations, accounting for the strong variability of geochemical data evidenced in this area by the related scientific literature. Extending these results to a general context, particular care must be taken in approaching the study of aquifers in volcanic islands, because a strong, small spatial scale variability of the hydrogeochemical parameters is expected, and a reliable knowledge of the local conditions is required for developing successful groundwater circulation schemes.

1. Introduction

Vulcano is the southernmost island of the Aeolian Archipelago (Italy); since its last eruption (1888–1890), it has been in a state of fumarolic activity, mainly located at “La Fossa” crater (
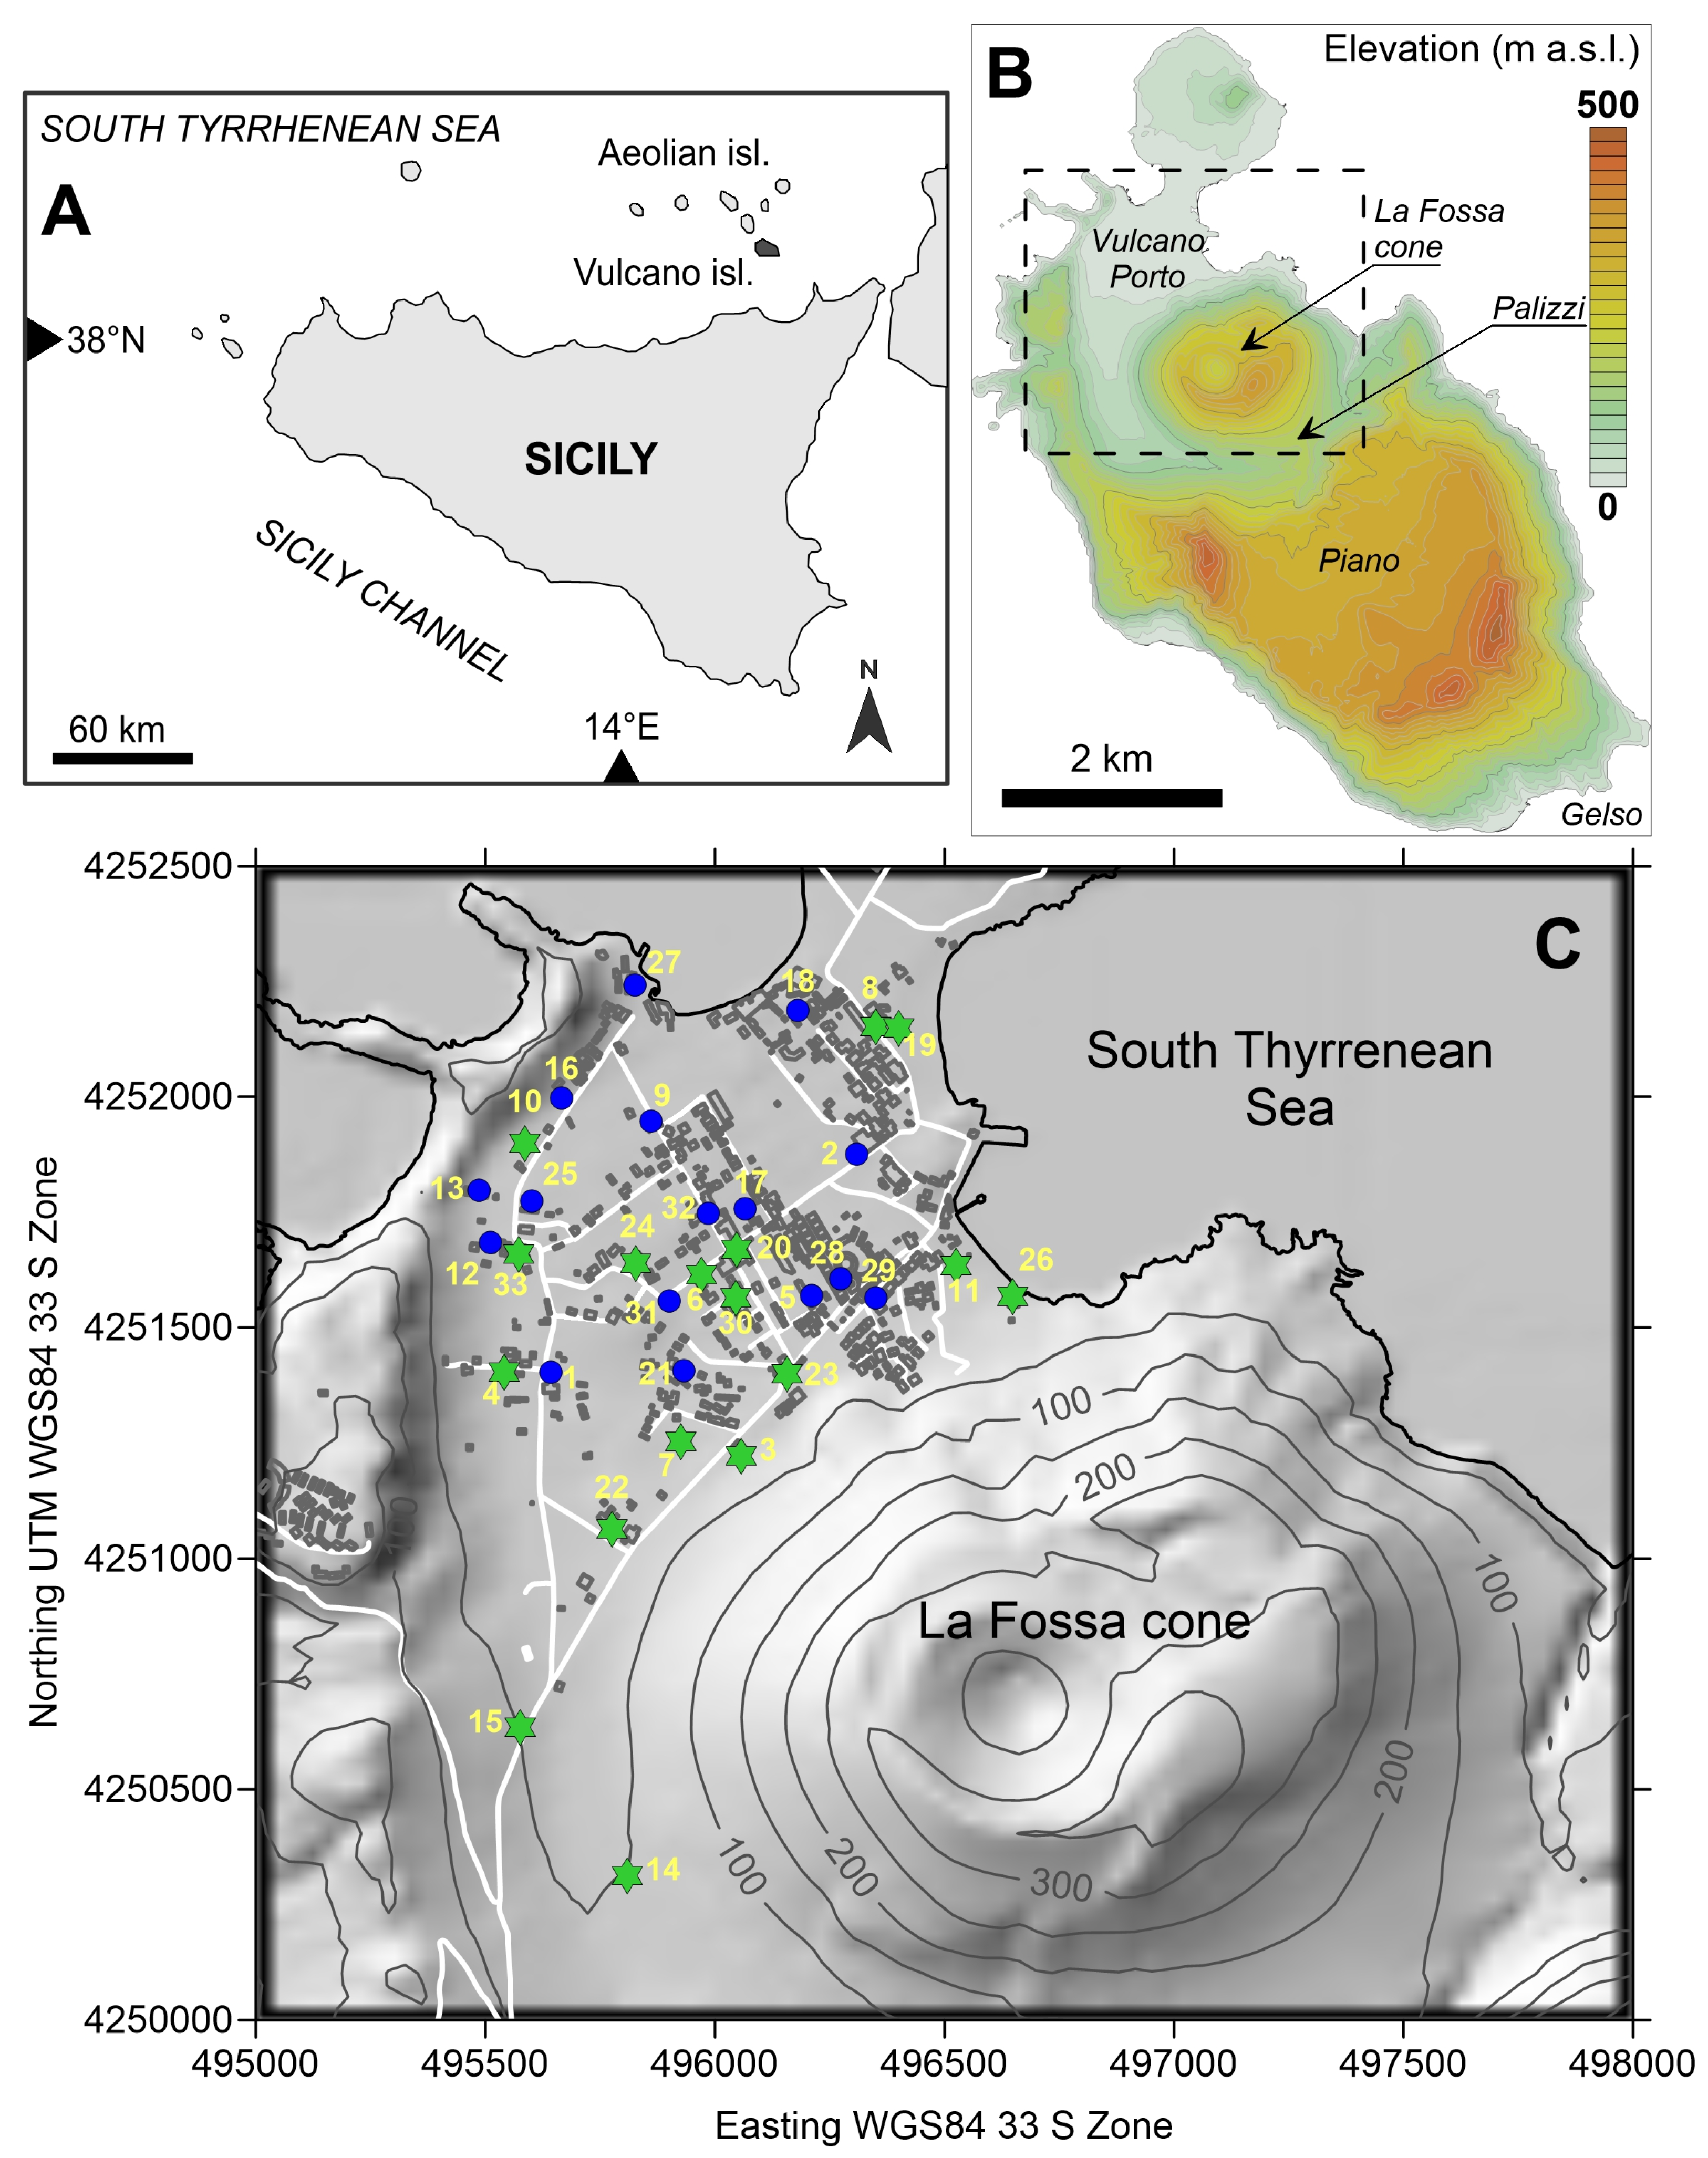
Figure 1).
Figure 1. (A) Geographical setting of Vulcano Island; (B) Terrain elevation map with indication of the studied area (dashed box); (C) Particular of the Vulcano Porto area with localization of the studied wells (blue filled circles are hand dug wells, green stars drilled wells).
Water 07 03206 g001
The densely inhabited alluvial plane of Vulcano Porto area, located NW of La Fossa cone, hosts a thermal aquifer that has claimed the interest of volcanologists for decades.
Although a huge number of detailed hydro-chemical studies have been carried out in the Vulcano Porto area, only few works debated the hydrogeological characterization of the aquifer and its influence on chemical and isotopic composition of groundwater. Inguaggiato et al. [1], and references therein quantified a hydrologic balance for the Vulcano Porto aquifer, supported by a piezometric contour map of the area, aimed at the evaluation of the dissolved CO2 budget of the island. Capasso et al. [2,3] analysed a long time series of water table elevation data, with the aim of discriminating between the volcanic signal (changes of volcanic activity) and the hydro-meteorological noise driven by sea level oscillations and changes in rainfall regime.
The main obstacle in describing the hydrogeology at Vulcano Island is the incomplete information about depth, thickness and lithology of water bearing levels intercepted by the wells. Some limited data are available about a hydrothermal aquifer located between 5 and 14 m b.w.h., found in two holes drilled at Vulcano for hydrothermal exploration purposes [4], but it is not known, however, if the measured piezometric levels are expressions either of a confined, over-pressured aquifer, or of an unconfined water body, or of a combination between these two.
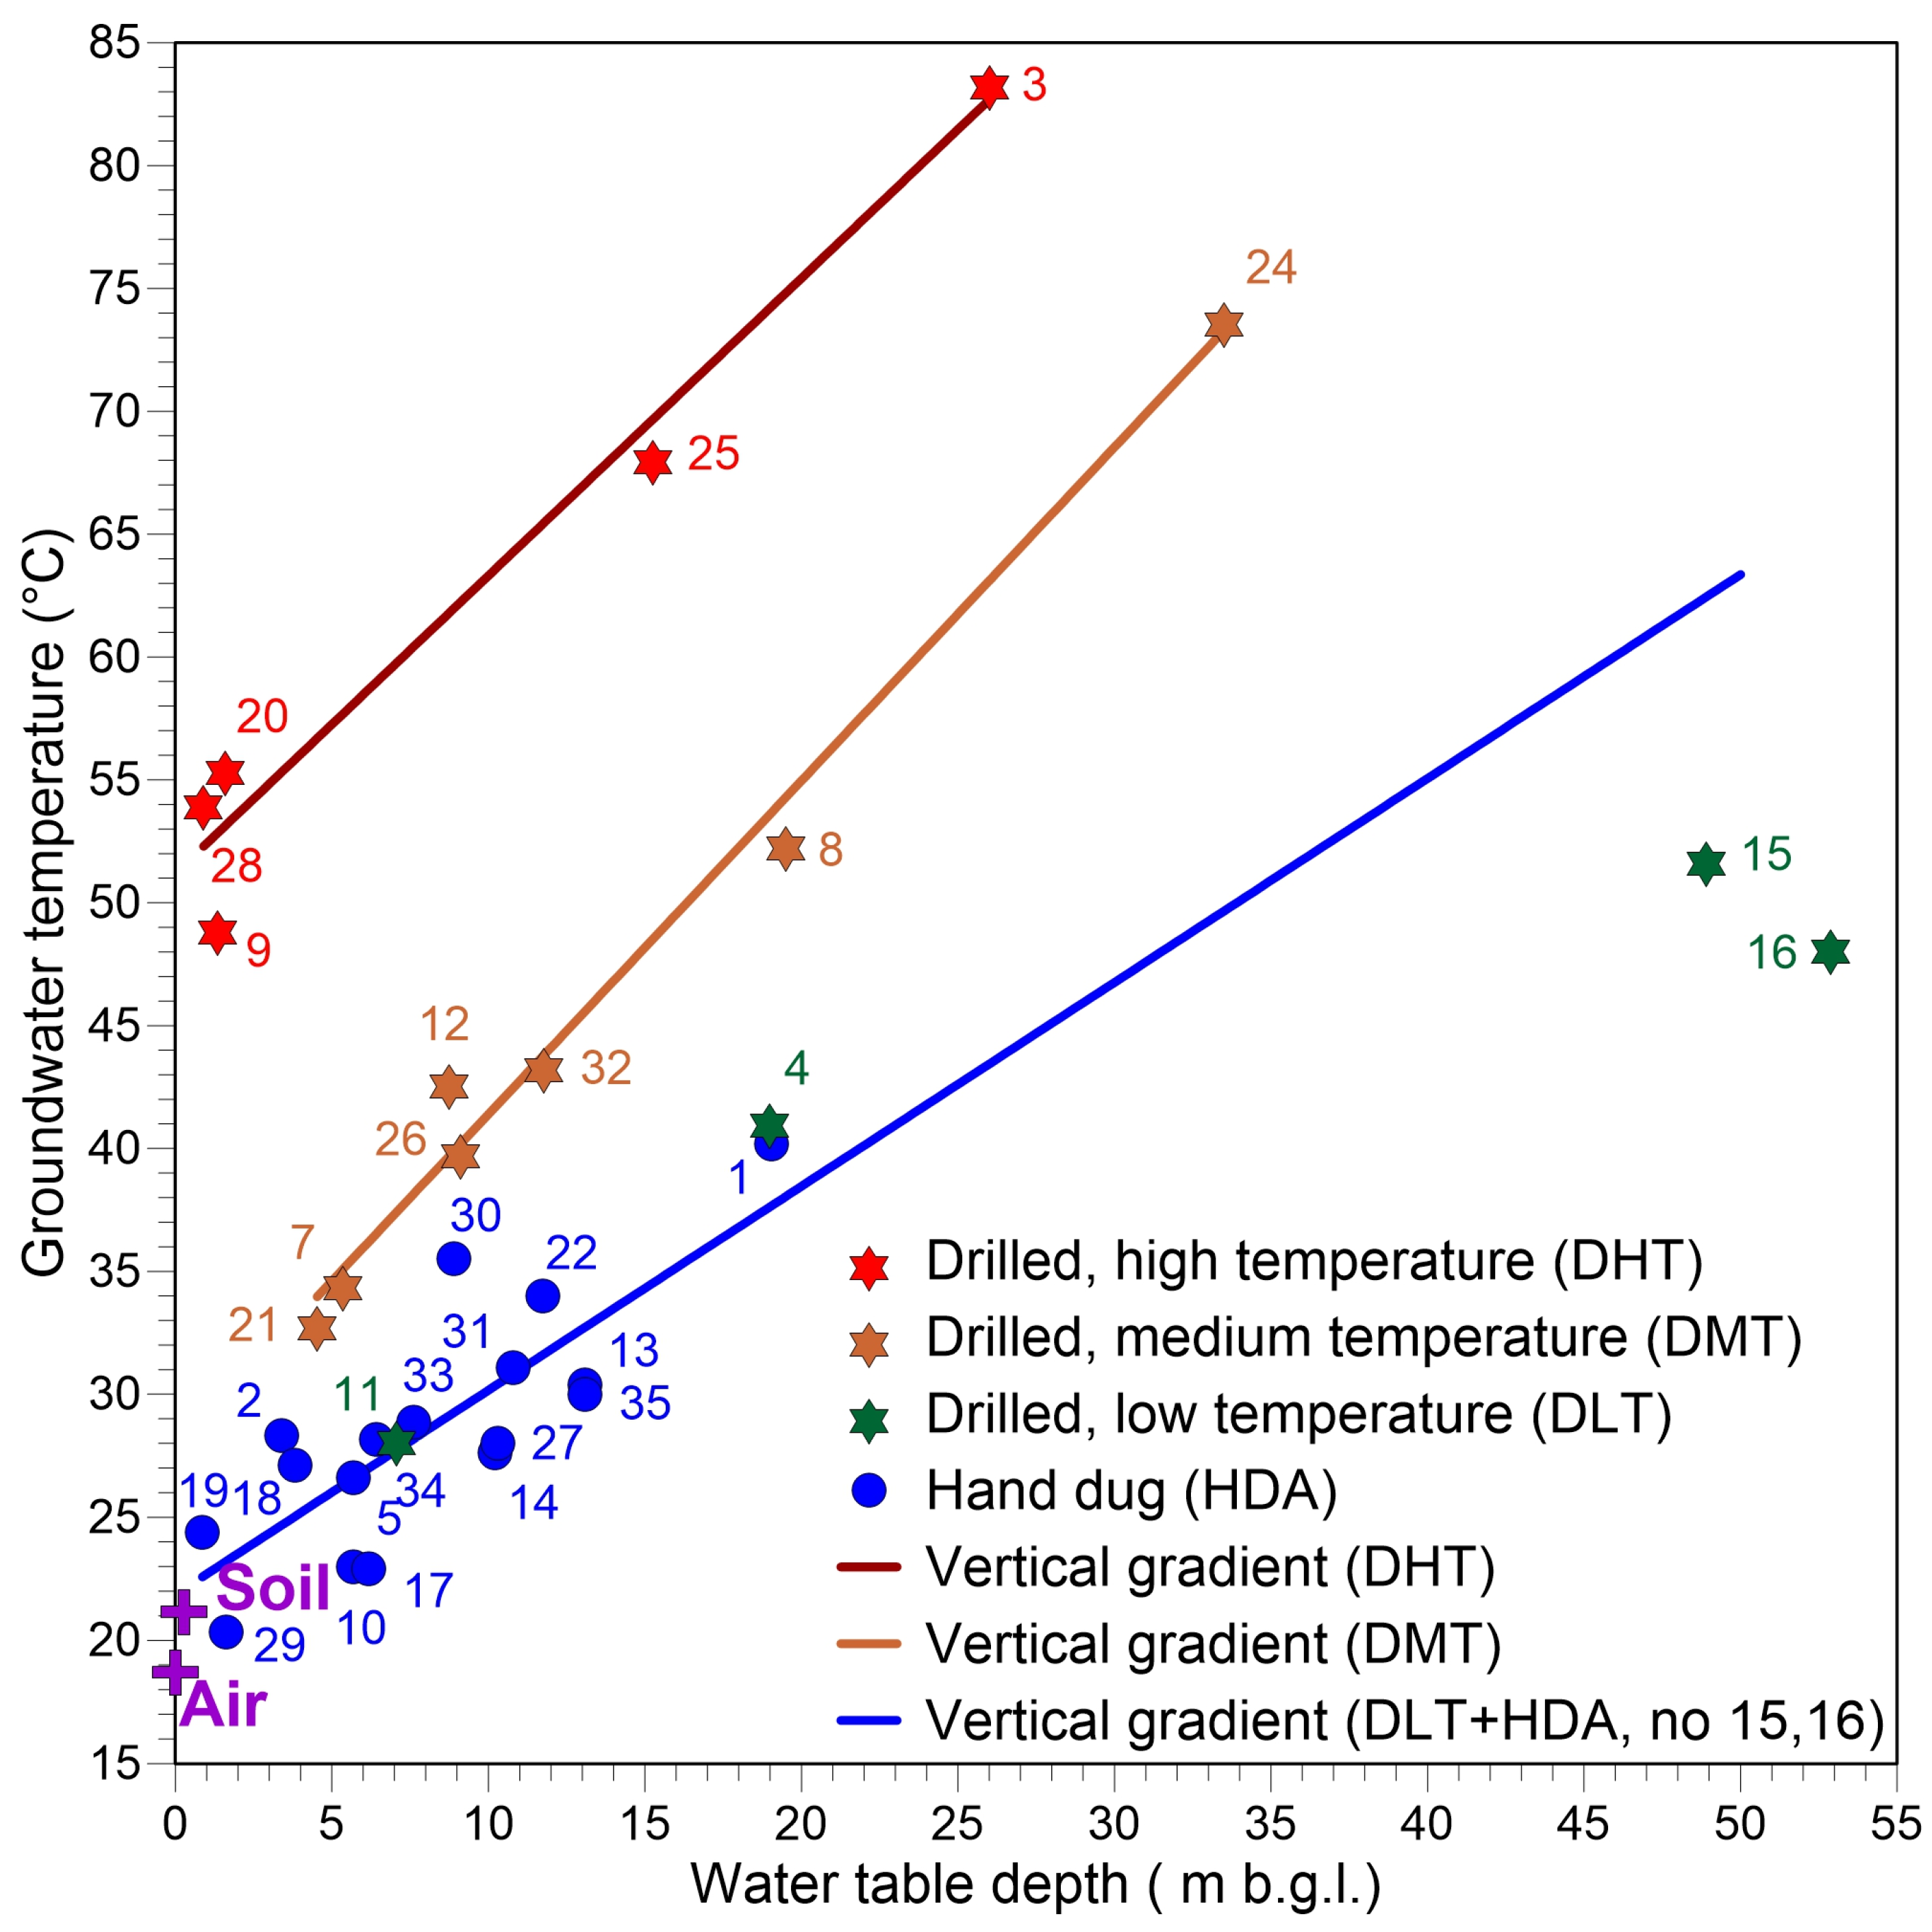
To address this issue, we present in this paper, field data of water table elevation, temperature and electric conductivity measured in 33 wells drilled (or hand dug) in the Vulcano Porto area, supported by volcano-stratigraphic data acquired in a drilling program in 2004. Space and time variations of the measured parameters will be discussed in terms of the mass and energy exchange among the different components of the Vulcano Porto aquifer, intended as a paradigmatic, local example of processes acting more in general on volcanic islands.

2. Materials and Methods

Groundwater data were collected between 1995 and 2011 in 33 wells; 17 were drilled with an average diameter of 30 cm and 16 hand-dug (average diameter 2 m). All are located in the alluvial plain lying NW of La Fossa cone (Figure 1). Elevations of well heads were measured by optical leveling, based on the benchmark network managed by the Italian Istituto Nazionale di Geofisica e Vulcanologia, Osservatorio Vesuviano (INGV-OV), with a relative error of ±10 cm. Water table elevations were measured under static conditions using freatimeters, with an error of ±1 cm. Water temperature and electric conductivity were determined with a portable Orion instrument, equipped with a temperature-conductivity cell, with errors of ±0.1 °C and ±2%, respectively. Temperature and conductivity were measured into samples collected with a 1-L plastic bottle, attached to a nylon rope, plunged into water and pulled back to ground level after 15 min of immersion to insure a good thermal equilibration with water. Table 1 summarizes the main data presented and discussed in this work.
Contour maps were made using Golden Software Surfer, release 12, with the kriging algorithm. Fast Fourier Transform (FFT) analysis on water table elevation data was performed using the KY Plot freeware.
Table 1. Id, typology (D = drilled, HD = hand dug), coordinates (UTM WGS84, Zone 33 S), well head elevation (m a.s.l.), water table depth (m b.w.h., measured under static conditions), temperature (°C) and electric conductivity (mS/cm) of the hydrothermal wells located in the coastal area of Vulcano Island (Italy). Data were measured during Spring 1995, except well 26 drilled in 2004.
IdTypeEastNorthElevation (m a.s.l.)Depth (m b.w.h.)Temperature (°C)Electric Conductivity (mS/cm)
1HD495642425140519.519.0440.2-
2HD49630942518754.23.4028.32.47
3D496058425123629.726.0083.5-
4D495541425141719.718.9741.3-
5HD49621042515694.45.6726.62.09
6D49597042516276.75.3534.63.11
7D495926425126721.719.5152.57.54
8D49635042521661.81.3649.1-
9HD49586142519486.55.7023.02.65
10D49558642519128.17.0528.36.38
11D49652642516479.08.7642.84.75
12HD495511425168413.713.0930.41.69
13HD495486425179711.110.1927.62.22
14D495809425032750.648.9151.96.07
15D495576425064751.852.8948.33.59
16HD49566642519986.96.1722.91.59
17HD49606642517574.53.8327.12.94
18HD49618142521872.60.8724.45.52
19D49640142521630.61.5955.6-
20D49604742516825.34.5333.0-
21HD495933425140713.811.7434.02.74
22D495776425107734.433.4973.98.43
23D496158425141516.915.2468.28.32
24D49582742516529.69.1140.03.94
25HD495601425177411.410.3028.02.15
26D49664842515811.00.9054.2-
27HD49582642522422.01.6120.36.31
28HD496273425160610.88.9035.54.73
29HD496350425156411.510.7931.1
30D496046425157713.411.7643.54.14
31HD49590142515579.47.6128.9-
32HD49598642517477.76.4028.2-
33D495572425167313.713.0730.0-

3. Study Area Settings

Vulcano island lies on a NNW-SSE trending fault, known as Tindari-Letojanni Fault, and is part of a transpressive belt [5], where the dominant mechanism is right-lateral shear [6]. The subaerial portion of Vulcano is built up of high-K calc-alkaline (HKCA), shoshonitic (SHO), and leucite tephrite or potassic (KS) rocks, which vary widely in their degree of evolution from basalt to rhyolite [7,8,9]. These studies have recognized six main stages of volcanic activity: Primordial Vulcano; Piano Caldera in-fill products and volcanic units older than 20 ka; Lentia Complex; La Fossa Caldera deposits and volcanic units erupted from 15 to 8 ka; La Fossa Cone and Vulcanello.
The Primordial Vulcano is a truncated composite cone that forms the oldest (120 to 100 ka) and southernmost part of the island, with a central summit caldera (Piano Caldera). It consists of alternating lava flows, scoriae deposits, and minor, fine-grained pyroclastic units. According to Keller [7] and De Astis et al. [10], intracaldera volcano-tectonic activity shifted from the SE toward the NW and formed the southeast sectors of Fossa Caldera between 50 and 20 ka. The Lentia Complex is a remnant of a larger structure located sited north of the Piano Caldera. It was formed between 24 and 15 ka, and it is cut by the western ring fault of the Fossa Caldera. Rhyolitic lava flows and minor extrusive domes overlie a sequence of explosive and effusive latitic products, which contains subordinate trachytic juvenile clasts.
The Fossa Caldera deposits and volcanic units, erupted between 15 and 8 ka, consist of several pyroclastic and effusive stratigrphic units that tend to become more mafic and alkaline toward the top, suggesting that the eruptions were triggered by the input of new magma in a shallow reservoir. La Fossa Cone is an active composite edifice, 391 m high, located at the centre of the Fossa Caldera. It was formed over the last 6 ka by pyroclastic products and minor lava flows, erupted from different vents. Frazzetta et al. [11,12] distinguished four main eruptive cycles starting with phreatic breccia or surge deposits, and ending with lava effusion. Lastly, Vulcanello is the northernmost structure of the island and consists of a composite lava platform and three volcanic cones located on an ENE-WSW structural trend. It was formed as a new island in 183 B.C and was connected with Vulcano by ash accumulation in the isthmus area, around 1550 A.D.
Thermal waters in the Vulcano Porto area show notable geochemical differences, due to the existence of zones of preferential upflow of deep fluids, locally modifying the physico-chemical parameters of the aquifer. Indeed, one of the most important chemical processes, which characterizes the ionic content of the Vulcano groundwater, is the contribution of the fumarolic gases [13,14,15,16,17,18,19,20,21,22,23,24].
In particular, the hottest and most-saline waters share a variably Cl-rich to SO4-rich composition with only minor C contents. Referring to the classification of Giggenbach [25], these waters are the typical volcanic waters. Other waters, with an intermediate composition between C and Cl–SO4 rich, represent the so-called peripheral waters and the steam-heated waters. These waters are characterized by lower salinity, lower temperature, slightly acidic pH values, and water stable isotopes at close to meteoric values. Finally, some wells close to the seashore have a marked marine contribution. These waters generally have high salinity, temperature around 40 °C and a stable-isotope composition intermediate between seawater and meteoric water.

4. Results

Even though the core of our work is the spatial analysis of the measured parameters, generally measured once, water table elevations of some selected wells (2, 7, 14 and 15, Figure 1) were measured with a roughly 60 day period, randomly alternating between odd and even months during the years 1995–2011. The analysis of these time series provided information useful for the general hydro-geochemical characterization of the Vulcano aquifer.

4.1. Time Variation of Water Table Elevation

Average monthly water table elevations are illustrated in Figure 2 and compared with effective rainfall amounts (i.e., the amount of rain at the net of reference evapotranspiration), calculated applying the Thornthwaite formula to the data acquired by the Sicilian Agro-Meteorological Service (SIAS) in the neighbour station of Salina Island. Water table elevations are presented as relative variations above the lowest level reached in each well during the average hydrologic year (Figure 2). According to the observed intra-annual rainfall and air temperature distributions, we considered the average hydrologic year running from May to April, with a dry season between May and August, due to rain scarcity and strong evapotranspiration, followed by a wet period with precipitation maxima between October and December.
Figure 2. Average monthly values of effective rain (top) and water table elevations (bottom) measured in the wells of Vulcano Porto area. Meteorological data refer to the Salina Island station of the Sicilian Agro-meteorological Service. Water table elevation data are expressed in relative variations, set as zero the lowest level reached in each well during the average hydrological year. Displayed data are related to the period 1995–2011.
Water 07 03206 g002
The trend in precipitation is similar to that of the average water table elevation curve (thick blue line in the bottom of Figure 2), showing a minimum in July and a maximum in December. Variations of the piezometric head were modest, if compared to the strong asymmetry in the intra-annual effective rain distribution: less than 0.1 m on average, with only one well (number 2) showing a larger oscillation (0.25 m). A secondary maximum in average water head elevation, but the main one for wells 7 and 14, was observed between April and May; this was not accompanied by a similar signal in effective rain. Moreover, a secondary but significant positive anomaly of about 0.05 m occurs in all the wells in July, in the middle of the driest period of the year.
Amplitude spectra from FFT (Figure 3) highlighted the annual periodicity of the hydrological cycle, observed in the monitored wells. A strong 12-month component dominates the power spectrum of well number 2, i.e., the site with the largest intra-annual oscillation (Figure 2) located close to the sea. This signal progressively diminishes upslope (Figure 1): it is still visible but with much lower amplitude in well 7, while it is absent in wells 14 and 15. The variability affecting the water table elevation signal, both in the time and frequency domains, seemed to indicate the complexity in the geometry of the coastal groundwater flow system of Vulcano Island. The complexity of the groundwater flow system is further remarked by its behaviour in the space domain, as discussed in the next section.
Figure 3. Power spectra obtained by FFT applied to the water table elevation data acquired in wells number 2, 7, 14 and 15 (see Figure 1 for their location). The time axis starts at 4 months for removing aliased data determined by sampling period (2 months).
Water 07 03206 g003

4.2. Spatial Distribution of Water Table Elevation, Temperature and Electric Conductivity

The water-table elevation contour map shows a piezometric high, elongated in the SE-NW direction, originating at the foot of the NW flank of La Fossa cone and propagating to the central area of the coastal plain, from which it rotates SSW-NNE toward well 18 (Figure 4). The piezometric high both on its SW (well 15) and NE (well 5) flanks is between two depressed areas, where the water table lies down to 1.5 m below sea level. Another depressed area is found at the NE termination of the coastal plain (well 19). Conversely, wells 10–25 and 28–29 delimitates two small-scale piezometric highs, interrupting the general flow direction of groundwater.
Figure 4. Water table elevation contour map of the Vulcano Porto aquifer.
Water 07 03206 g004
The distribution of water temperature measured into wells from volcanic areas is controlled by the interaction between volcanic and meteoric fluids. The geothermal heat flux on volcanoes is both conductive and advective. When a meteoric-cold aquifer intercepts vertical fractures or volcano-stratigraphic discontinuities, conveying hot hydrothermal fluids (advective heat transfer), a thermal anomalous zone is generated around the interception area. Amplitude and lateral decay of temperature within this anomalous zone are driven by the flow rate ratio between the cold and hot components. If a very productive meteoric aquifer intercepts a family of discontinuities conveying a modest flow of hydrothermal fluids, a strong thermal anomaly is generated in the immediate surroundings of the interception zone, but water temperature rapidly decays moving away from it. Conversely, if the flow ratio between the hot and cold components is reverted, the thermal anomalous area will be more extended.
This situation is typical of Vulcano Island. If water temperature is plotted vs. water table depth (In Figure 5 noticeable scattering is observed. Part of this scattering is due to physical differences between the hand-dug and the drilled wells. The large diameter of the hand-dug wells (HDA, blue circles in Figure 5) expose significant water amounts (1–2 m3), efficiently exchanging heat with the atmosphere with a consequent rapid cooling. These points represent the coldest population family in Figure 5, with the lowest vertical thermal gradient (1 °C/m) and a temperature intercept at ground level of 21 °C, which is the yearly average soil temperature recorded at Vulcano Island in areas not influenced by hydrothermal circulation [26].
Figure 5. Water temperature plotted vs. water table depth measured in the wells of Vulcano Porto aquifer. Wells were grouped in different classes: drilled-high temperature (DHC, red stars), drilled-medium temperature (DMT, orange stars), drilled-low temperature (DLT, green stars), hand dug (HDA, blue filled circle). Continuous lines are the linear regression best fitting curves, traced for each class. Average yearly soil temperature at 10 cm depth [26] and air temperature (Salina station of the Sicilian Agro-Meteorological Service, SIAS) are also displayed.
Water 07 03206 g005
The small-diameter drilled wells, on the other hand, are influenced by direct thermal exchange with the atmosphere to a lesser extent, resulting in higher temperatures and steeper vertical thermal gradients. These wells still show considerable scattering but, if subdivided into different groups, according to their relative position with respect to known areas prone to hydrothermal fluid circulation, different homogeneous patterns can be recognized (Figure 5). Wells located close to La Fossa cone and the thermalized NE seashore (DHT) show the highest temperatures and a steeper vertical gradient (1.2 °C/m). Moving away from these areas (DMT group), average temperatures are lower and vertical gradients are similar to those of the previous group at the net of a minor statistical fluctuation (1.3 °C/m). With increasing distances drilled wells (DLT) show temperatures and vertical gradients similar to those of hand carved wells. It is worth noting the anomalous behaviour of DLT wells 14 and 15, colder than HDAs.
Similarly, the contouring of raw groundwater temperatures provides a misleading spatial distribution because the well depth is not taken into account. If raw temperatures are contoured, the resulting spatial distribution does not take into account the depth effect: a deep well could end up apparently warmer than a shallower one just because of the vertical gradient effect. This effect can be removed plotting not the measured temperatures but their extrapolations at ground level, derived by the linear regression fitting lines represented in Figure 5. Figure 6A,B show for comparison the groundwater temperature contour lines related to both the raw field measurements (Figure 6A) and the corrected values at zero depth (Figure 6B); the latter has been draft excluding HDAs, due to the severe thermal noise introduced by the heat exchange with the atmosphere, and DLT 14 and 15, since their particularly low gradient suggest very different local hydrogeological conditions (this issue will be more extensively debated in the next section).
As shown in Figure 6A, and anticipated in the discussion about vertical gradients, raw water temperatures are higher where hydrothermal fluid circulation is particularly active, i.e., at the foothill of La Fossa cone and along the eastern coast. If data are corrected for the vertical gradient effect (Figure 6B), some significant differences are introduced: the position of the warmest area is slightly shifted northeastwardly, and its previously evident prolongation toward the central and south-westernmost sections of the aquifer quickly vanishes.
Figure 6. (A) Contour map of water temperature measured in the wells of Vulcano Porto area; (B) Contour map of water temperature corrected for well depth following the vertical gradient curves illustrated in Figure 5. The area of wells 14 and 15 was excluded from the calculation because they are related to a different groundwater system (see main text for details).
Water 07 03206 g006aWater 07 03206 g006b
Finally, lower conductivity values were found in the central sector of Vulcano Porto aquifer (Figure 7). These are bordered northwardly and southeastwardly by areas with values up to three times higher. In particular, the conductivity high area in the southeast occupies the same zone of the piezometric and thermal highs previously mentioned. These observations suggest a significant inflow of warm and salty water from the NE flank of La Fossa cone, which mixes with the water of the aquifer residing in the Vulcano Porto alluvial plane, which is mainly of meteoric origin and hence colder and more diluted.

4.3. Stratigraphy and Temperature Profile of Well 26

In the summer of 2004, a borehole dedicated to geotechnical sampling and geophysical investigations (number 26 in Figure 1) was drilled on the beach of the Eastern Bay at Vulcano Island, giving the unique opportunity to retrieve information about the volcanic stratigraphy and the vertical distributions of water aquifers and temperature (Figure 8). A thin (1.5 m) alluvial deposit made of coarse sand, covers volcanic deposits that for the first 10 m are dominated by pyroclastics, more or less hydrothermally altered. The rest of the column mainly consists of massive lava. Below 27 m b.w.h., these alternate with scoriaceous deposits. Two water-bearing strata were intercepted by the well, both of a few tens of centimetres. The shallower of the two was located in the alluvial coverage and lies over the sea water level. The deeper one lied in a hydrothermally altered pyroclastic deposit confined between lava deposits at about 7 m below sea level.
Figure 7. Contour map of water electric conductivity measured in the wells of the Vulcano Porto area.
Water 07 03206 g007
The vertical temperature profile indicated that heat transport is essentially due to the circulation of hydrothermal fluids. The highest temperatures, 50 °C and 54 °C respectively, were recorded at the depths where hydrothermal fluids circulated. Temperature decreased moving downward; it reached a minimum of 25.3 °C at bottom hole (70 m b.w.h.). The corresponding vertical geothermal gradient, considering a temperature of 21 °C at ground level, was 0.06 °C/m, about one order of magnitude lower than in wells located at the foothill of La Fossa cone (Figure 1 and Figure 5). Moreover, both the gamma ray and magnetic susceptibility logs, reported in Figure 8, highlight hydrothermal alteration affecting the first 10 m of the lithostratigraphic column. In fact, circulation of thermalized water transform ferromagnetic minerals into low susceptibility phases, furthermore removing via selective leaching radioelements like K, U and Th.
Figure 8. From left to right, lithostratigraphic column of well 26, position of the water bearing levels (blue triangles), water temperature (red filled circles), gamma-ray log (thin black curve), magnetic susceptibility log (black dotted lines with standard deviation bars). Both depths from well-heads (left vertical axis) and elevations above sea level (right vertical axis) are indicated. Magnetic susceptibility data are a courtesy of Luigi Vigliotti (CNR-ISMAR), gamma-ray log is a courtesy of Robert Supper (Geological Survey of Austria, Department of Geophysics).
Water 07 03206 g008

5. Discussion

The development of a quantitative groundwater circulation model for the aquifer of Vulcano Porto area is not presently achievable, because fundamental data like vertical distribution of permeability (e.g., litho-stratigraphic information) and thickness/depth of water productive horizons are lacking, with the single exception of well 26 (Figure 1). Instead, we propose a Boolean circulation scheme, based on a logical tree connecting consequential hypotheses whose maximum likelihood is suggested by field observations.
In doing this, let us consider first the simplest model: groundwater of meteoric origin flowing in an unconfined aquifer, driven by both the main topographic gradient of Vulcano island and the orientation and location of the main volcano-stratigraphic discontinuities (Figure 9A). We should expect a dominant northeastwardly flow direction, from the most elevated sector of the island (Piano area) toward Vulcano Porto. The caldera rim, bordering the northern side of the alluvial plane [9] could act as a hydraulic barrier, causing a NE rotation of the isopiestics in the sector of the aquifer closest to the coastline (Figure 9A).
Figure 9. (
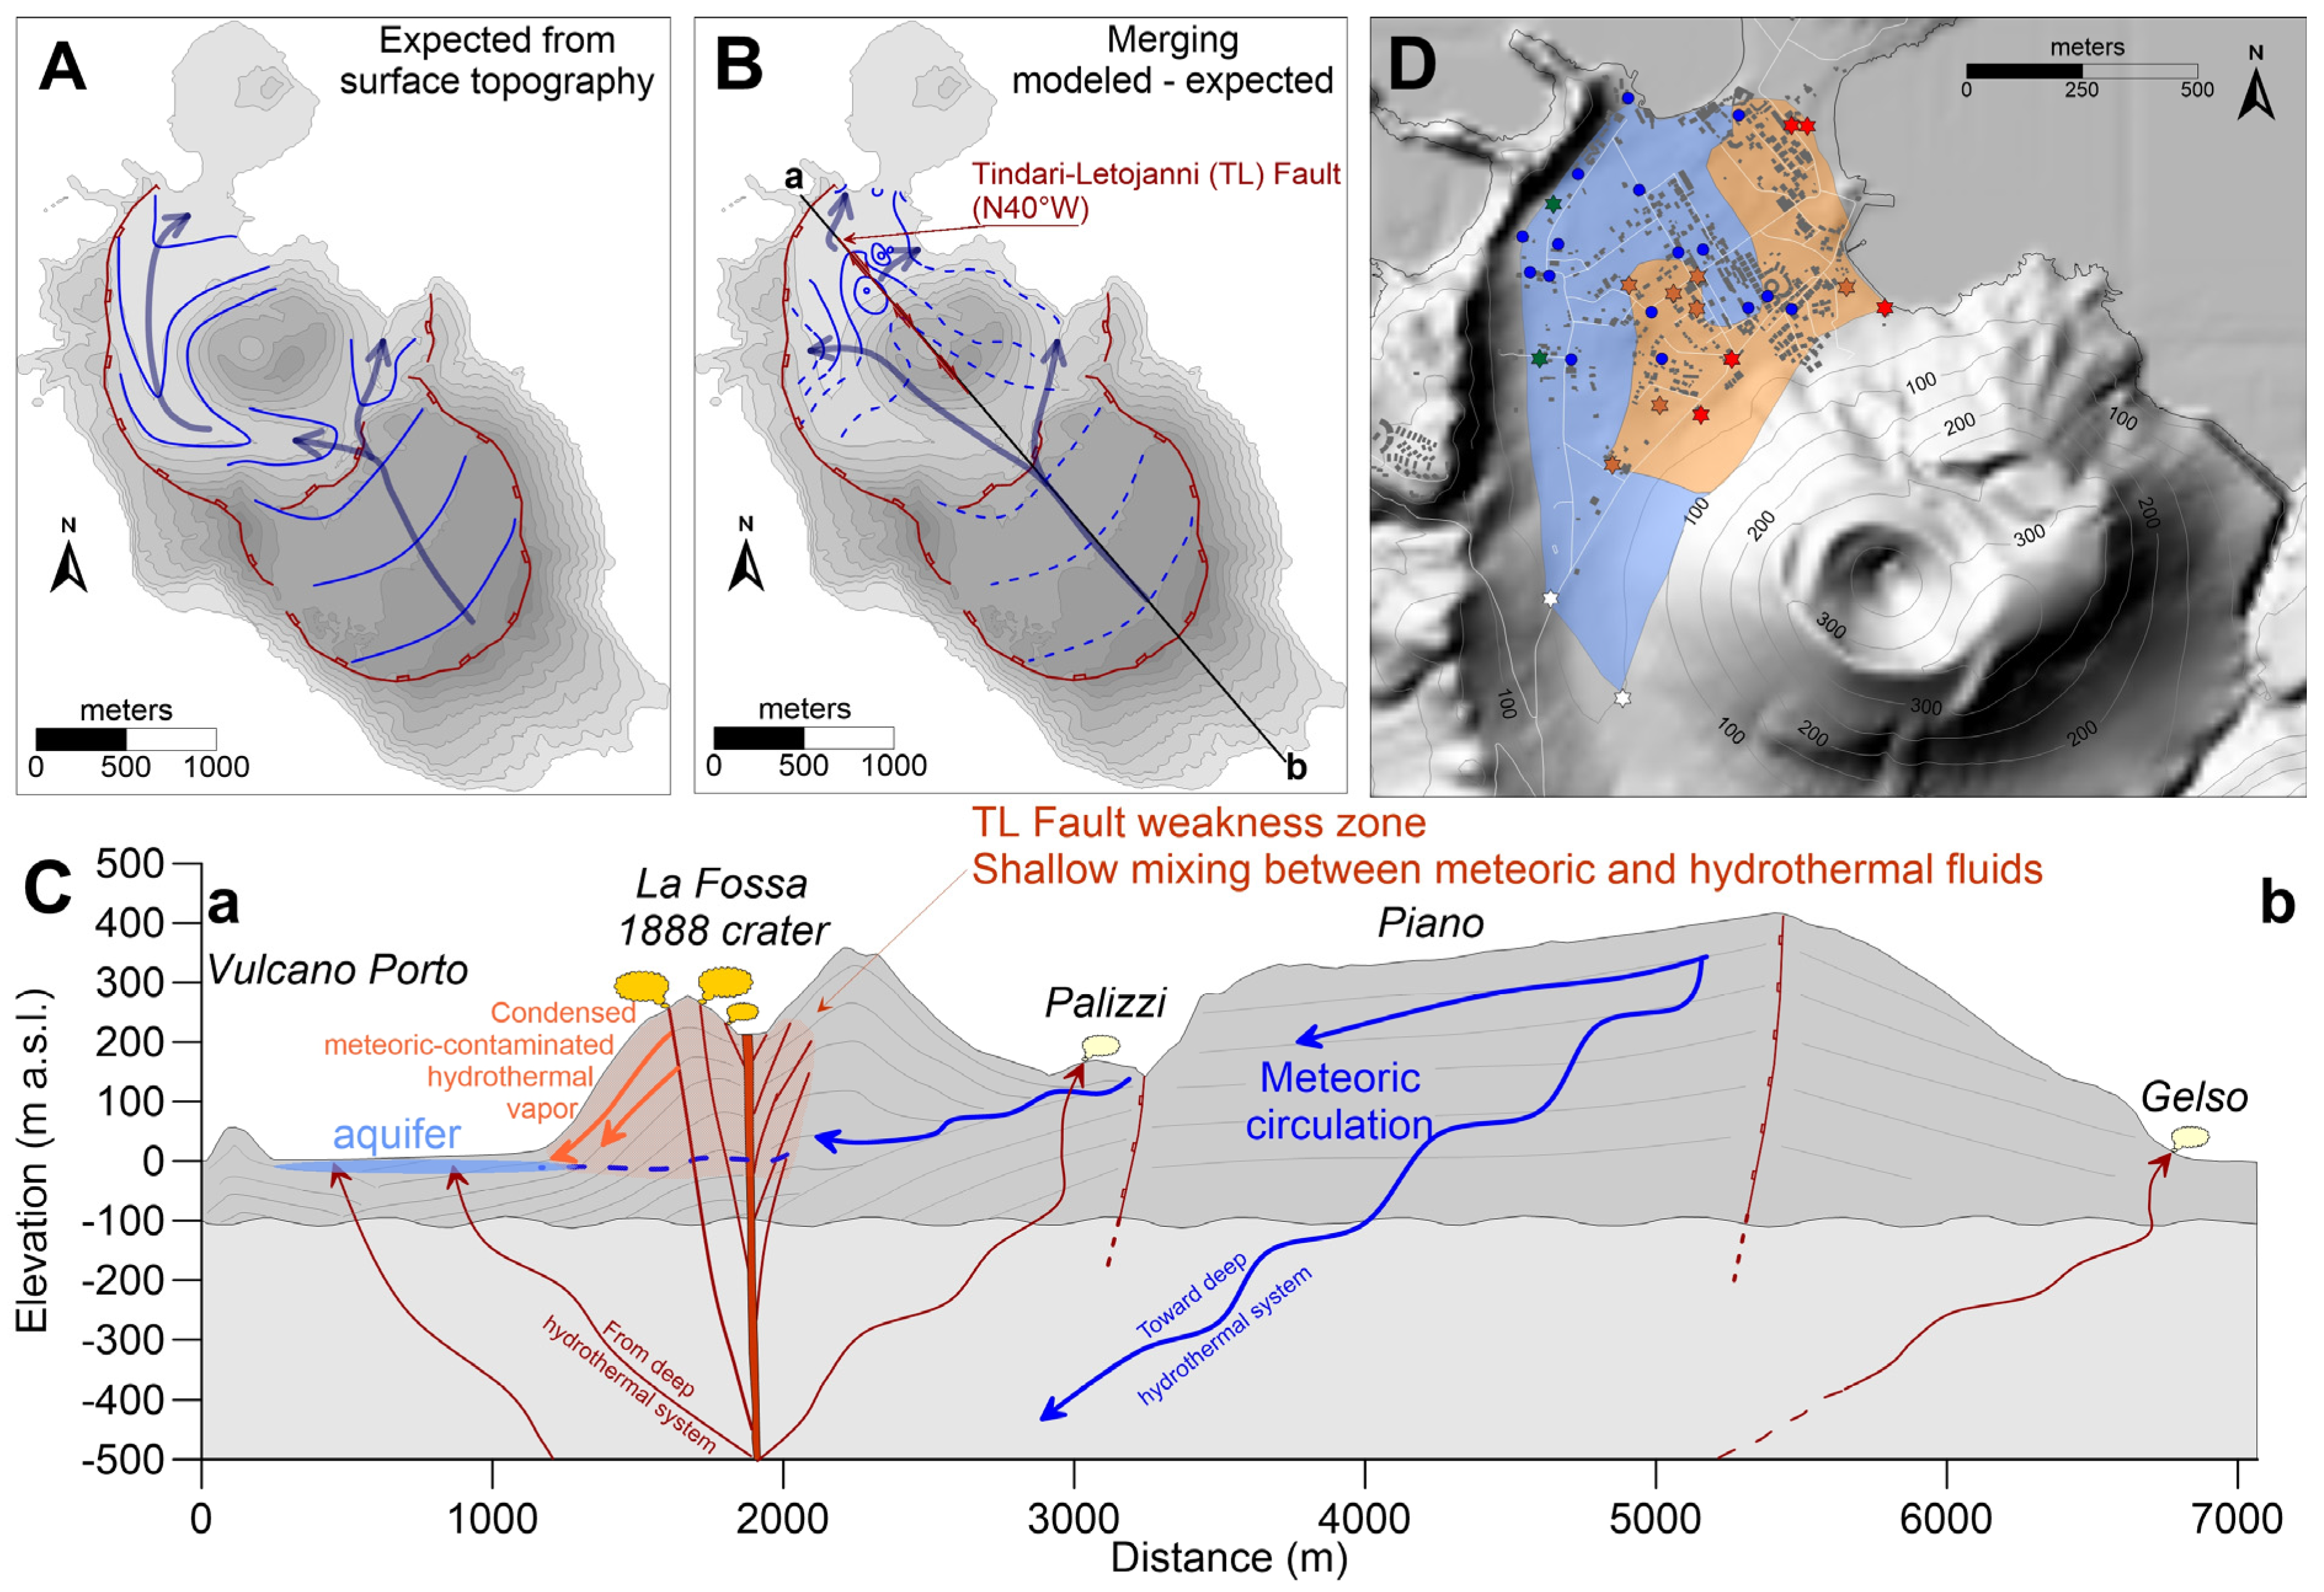
A) Sketch of the water table elevation contour lines and groundwater flow directions as expected from surface topography; (B) Integration of (a) with modelled data as presented in Figure 4; (C) Groundwater circulation scheme along the a-b profile traced in (b); orange clouds represent venting points of hydrothermal fluids (fumaroles); (D) Subdivision of the Vulcano Porto aquifer in two subsectors with prevailing meteoric (blue polygon) and hydrothermally altered (orange polygon) water. Brick red lines in (a–c) are caldera rims [9]. The hydrogeological section in (c) was draft integrating with our model the geological section after De Astis et al. [9] and the circulation scheme proposed by Capasso et al. [16]. We reported in (c) the geometrical relationships between volcano-stratigraphic horizons as indicated in the cited section; these are omitted below 100 m b.s.l. (homogeneous grey band) since no information are available. The colour code of wells plotted in (d) is the same used in Figure 6.
Water 07 03206 g009
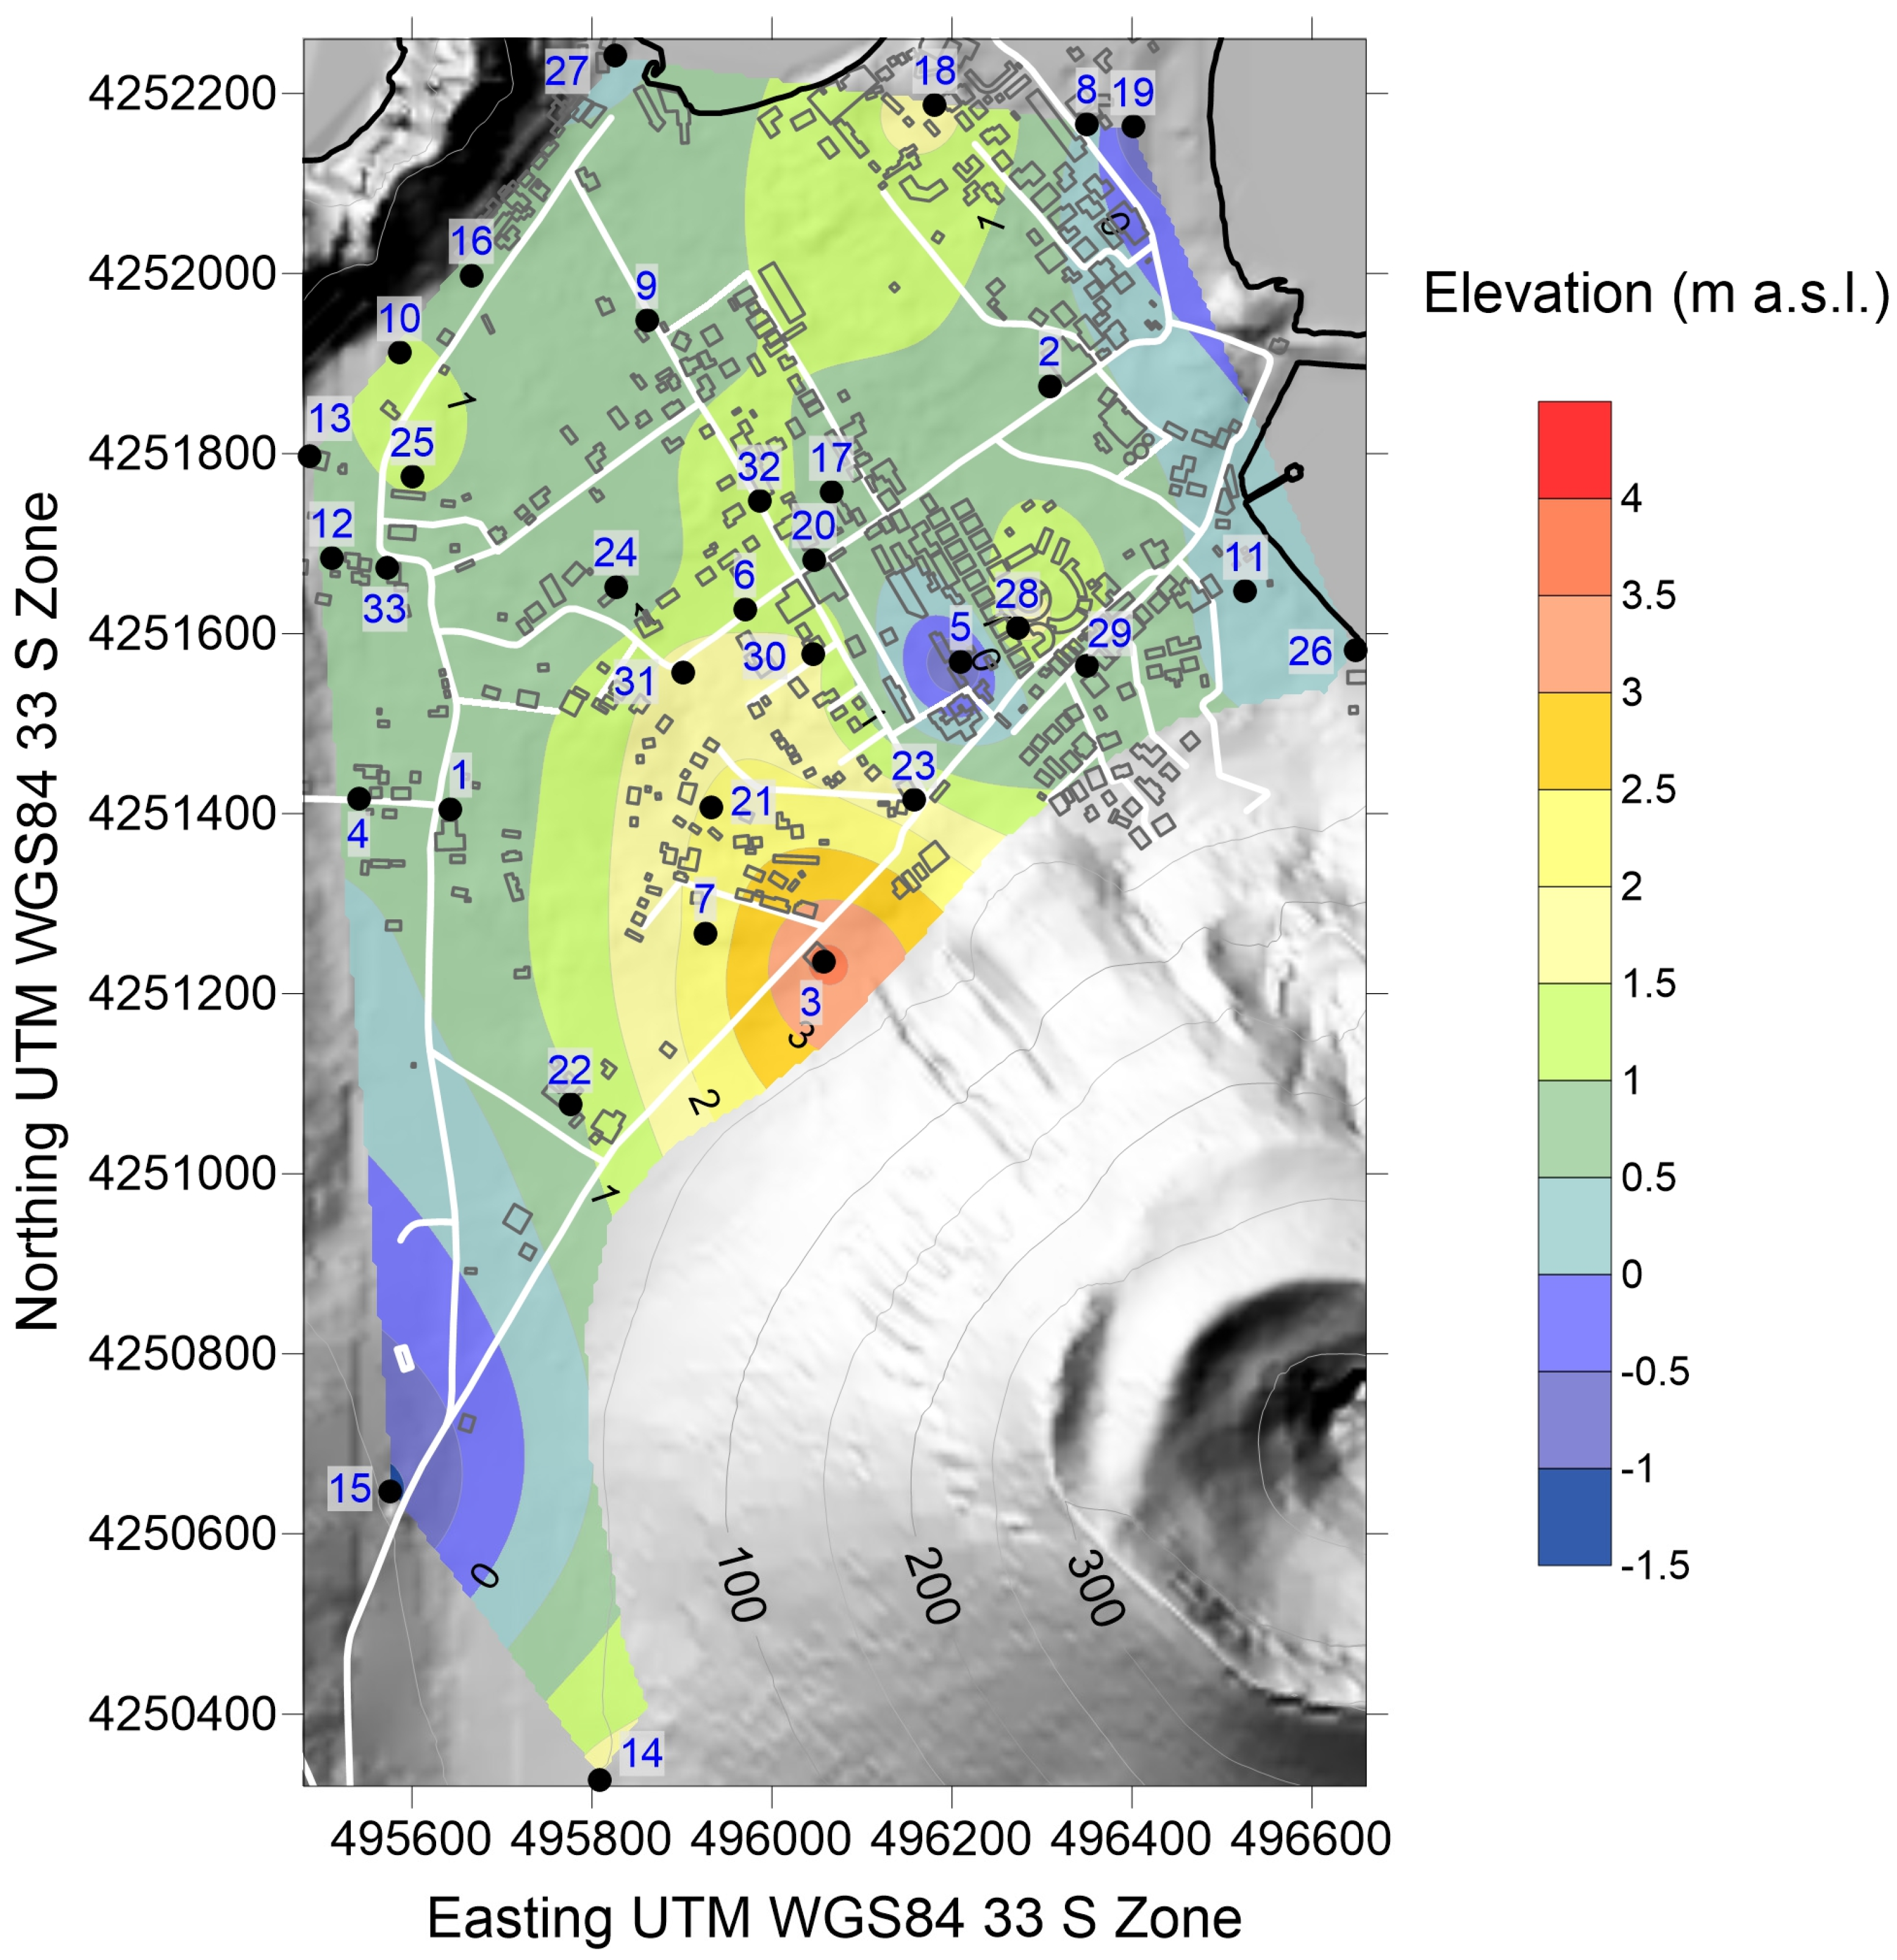
If the isopiestics traced from our field data (Figure 4) are merged with those from the abovementioned theoretical circulation scheme (Figure 9B), a different geometry of the Vulcano Porto aquifer is suggested. The geometry of Vulcano Porto aquifer seems to be strongly conditioned by the 391 m high La Fossa cone. Around La Fossa cone, isopiestics form a piezometric ridge originating from its NW flank and elevating about 2.5 m over the average height of the aquifer. This ridge progressively tapers in the central area of the aquifer. The feature indicates a significant inflow from the cone, superimposed to that coming from the Piano area. The existence of a lateral recharge from La Fossa cone, related to hot and salty fluids of volcanic/hydrothermal origin, was previously hypothesized [
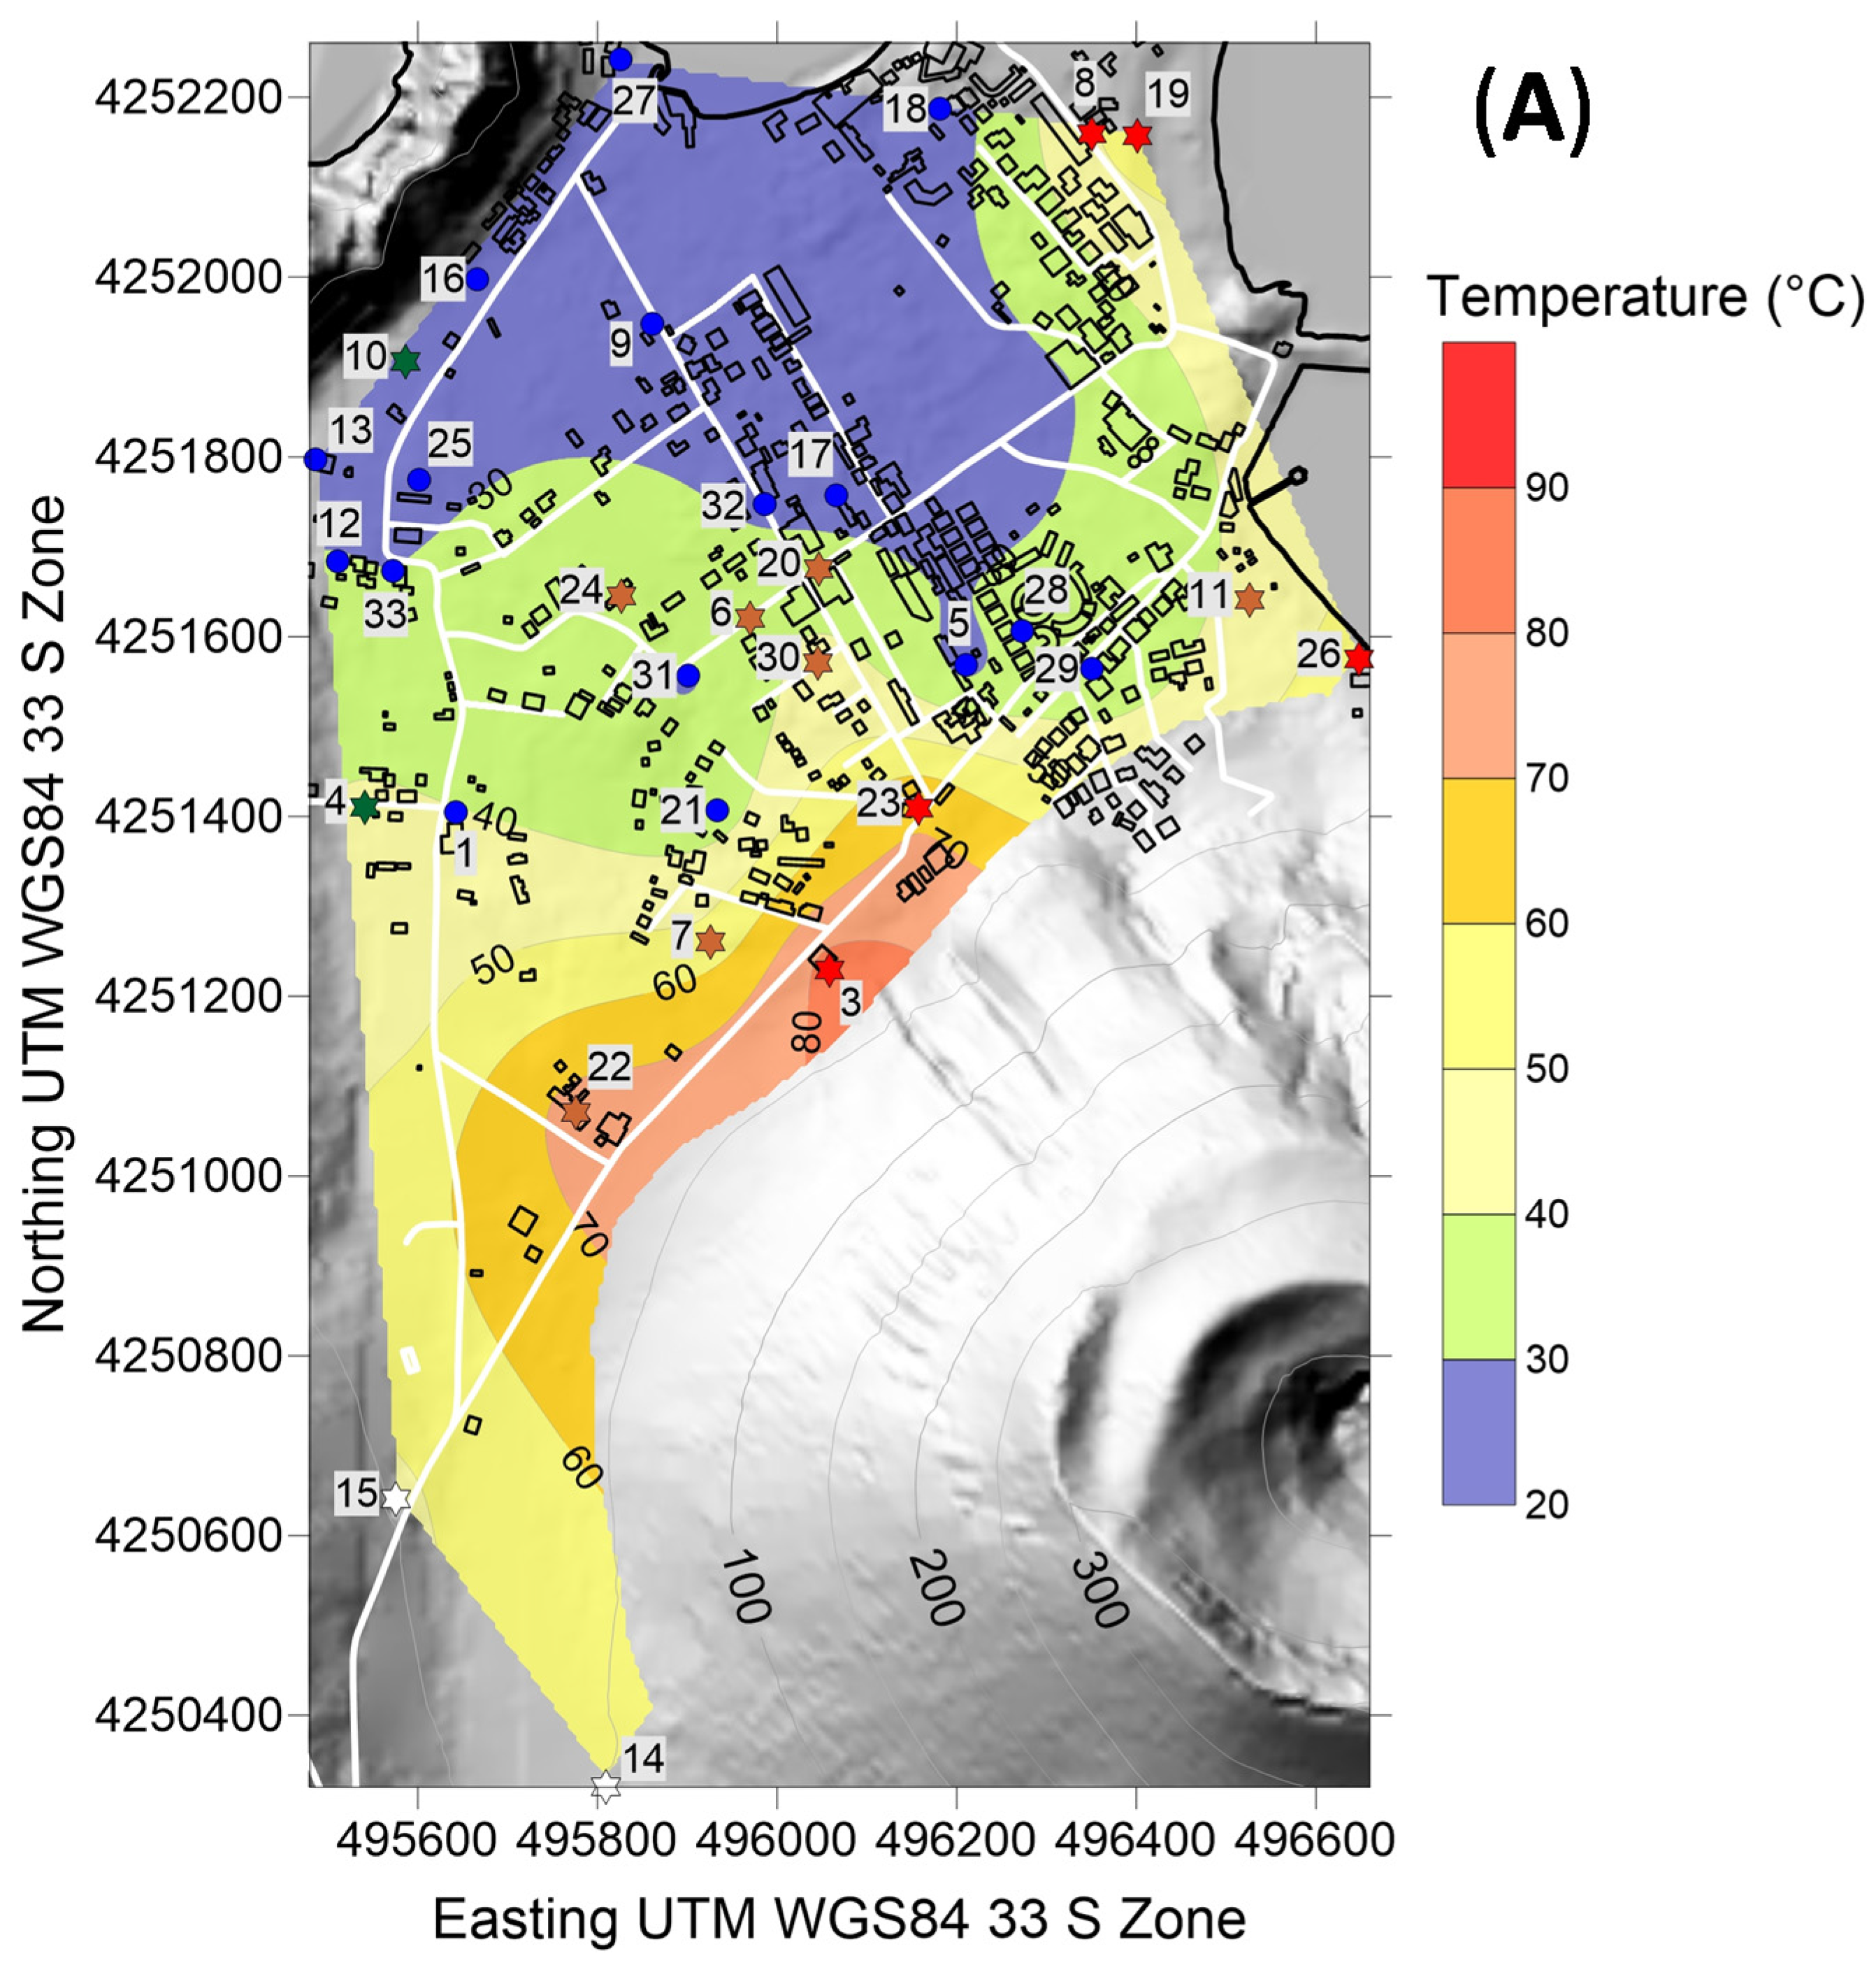
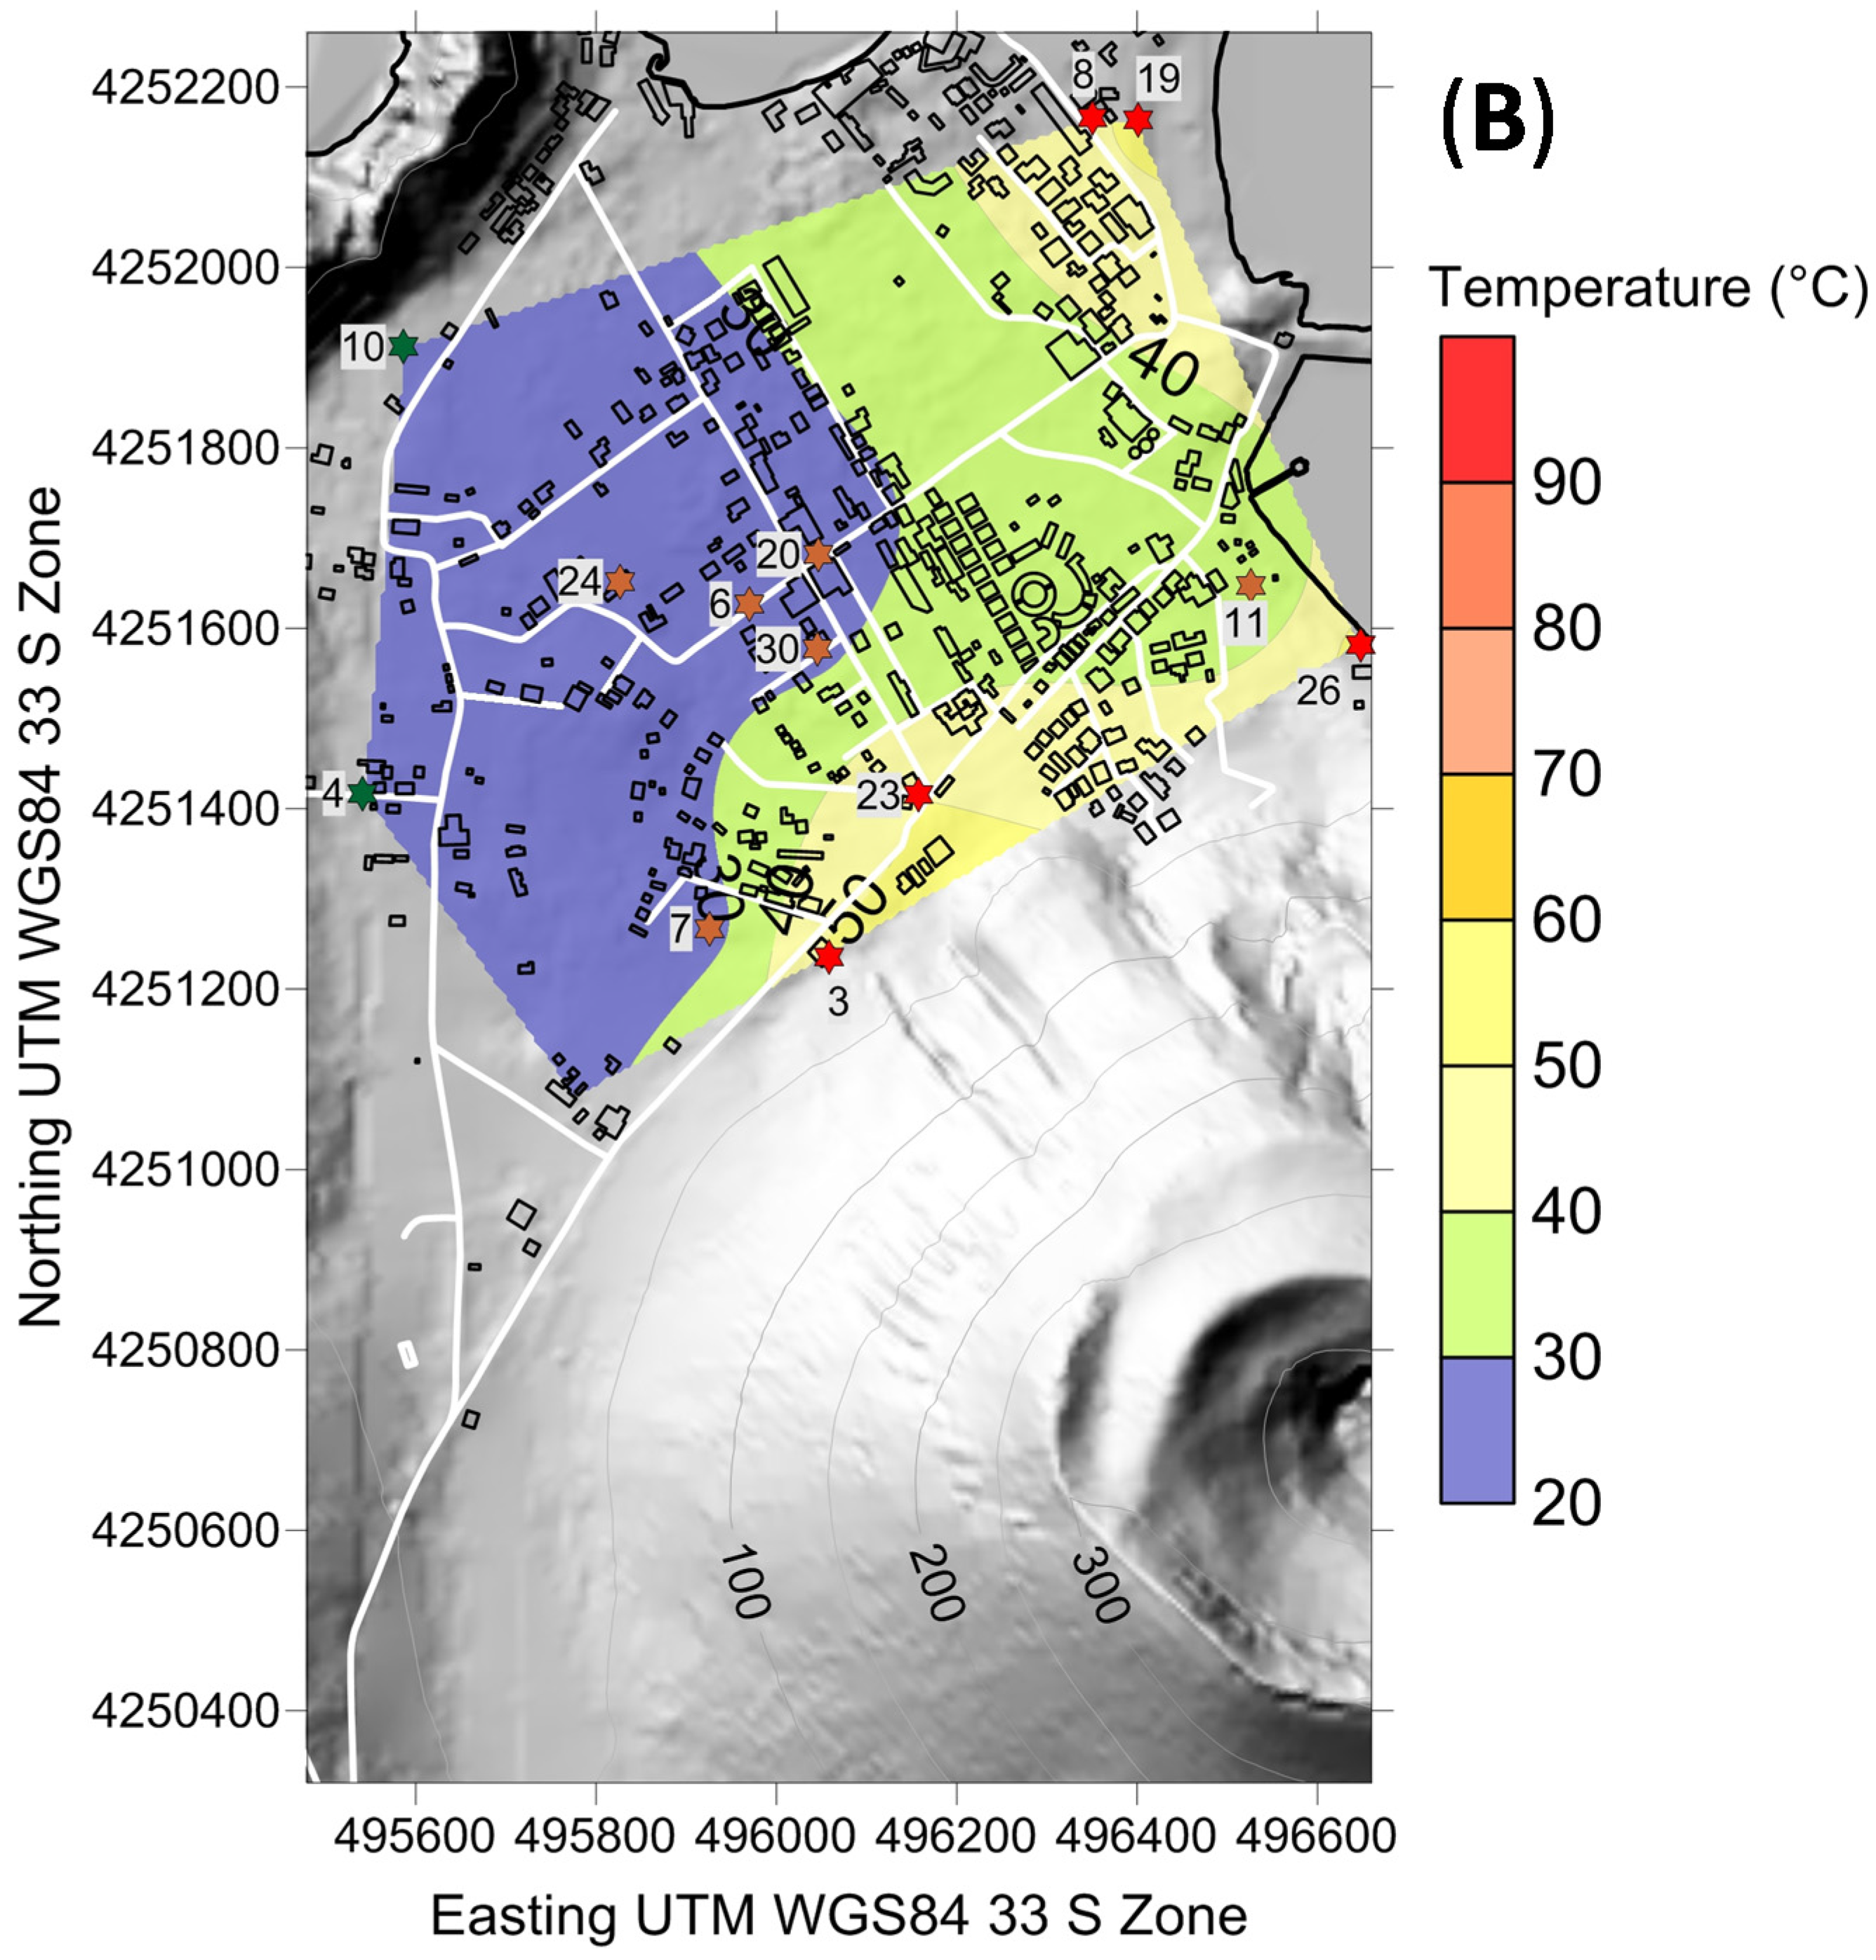
27]. Our study gives a further support to this hypothesis, as evidenced in the positive anomalies in both water temperature (
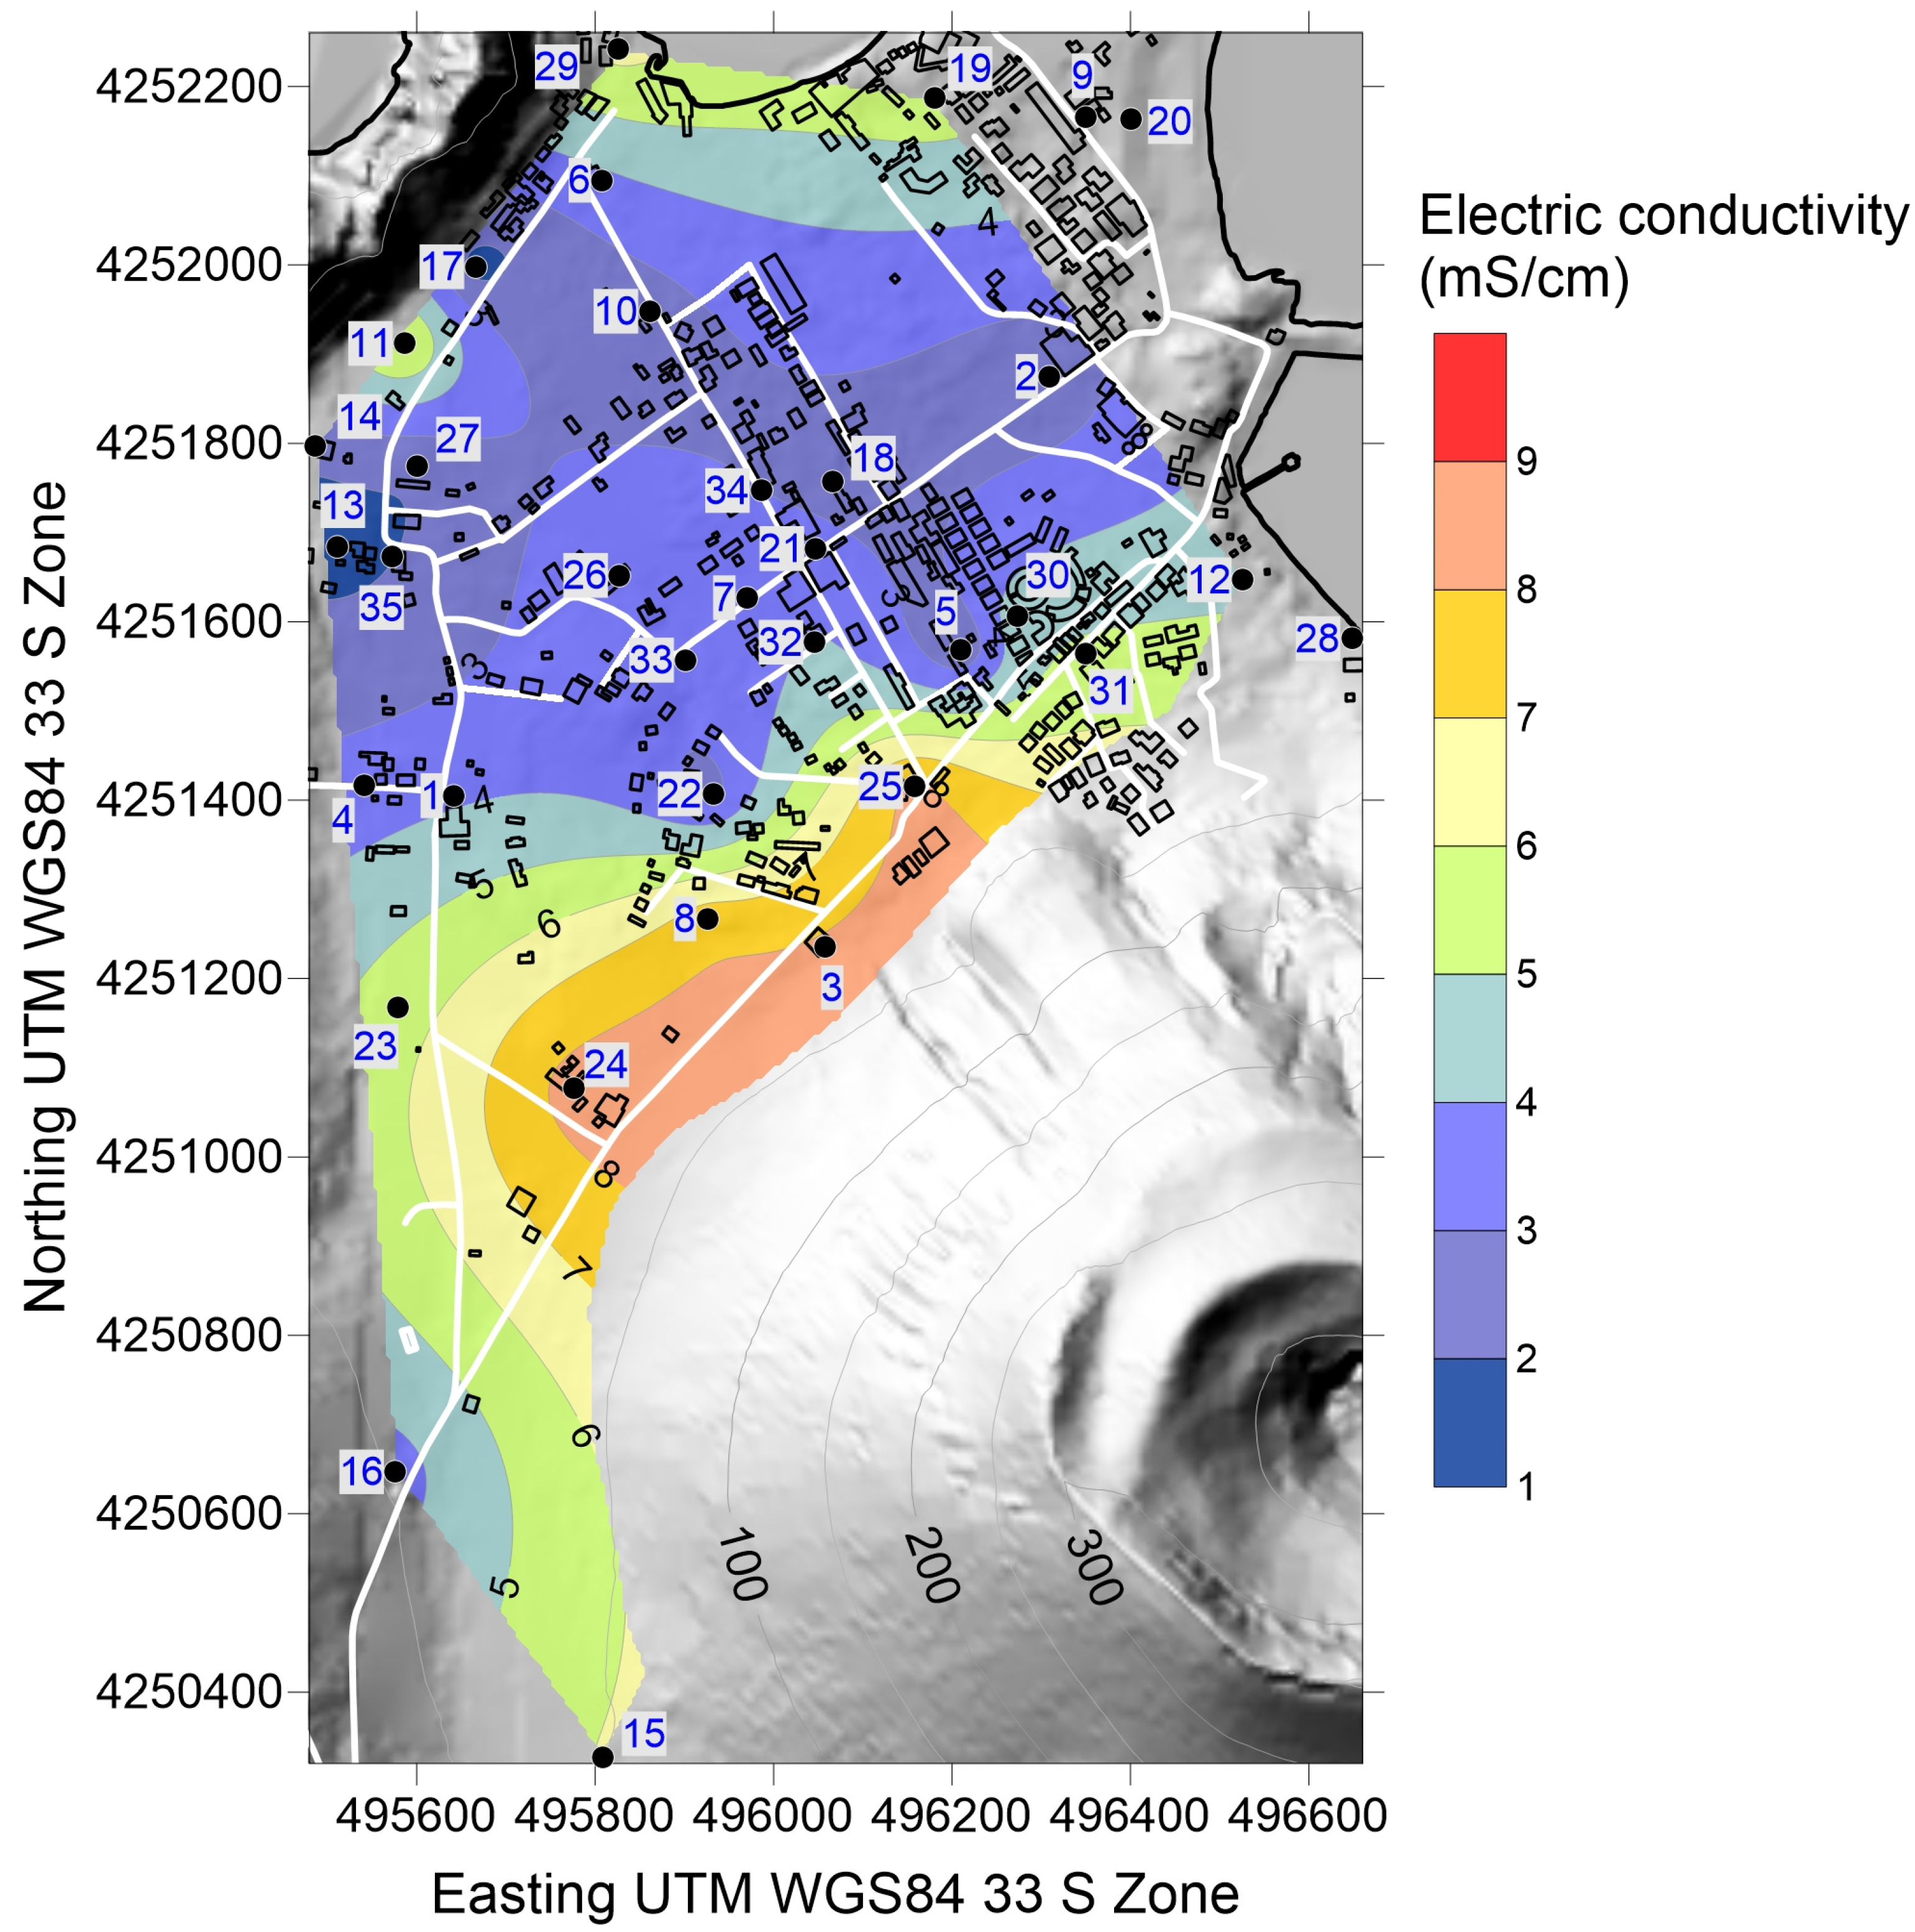
Figure 6B) and electric conductivity (Figure 7) maps. The shapes and locations of these anomalies are both similar to that defined by the isopiestic contour map (Figure 4).
Two different mechanisms can be invoked for justifying the inflow from La Fossa cone: ascending fluid flow along a vertical discontinuity (fracture or fault) or descending flow along the permeable volcanic deposits of the liquid phase of hydrothermal fluids condensed in the shallower portion of the cone and moving downward along permeable volcanic deposits. The first hypothesis is supported by the tectonic layout of the area: the axes of all the observed anomalies (piezometric, temperature and conductivity contour lines, Figure 4, Figure 6 and Figure 7) show the same orientation of the Tindari-Letojanni (TL) Fault. This fault, a regional tectonic discontinuity oriented N40°W (Figure 9B), plays a major role in the genesis and evolution of volcanic activity in the Aeolian island arch [2,25]. Moreover, the trend of the TL fault is also followed by the main exhalative areas of Vulcano Island (Vulcano Porto, La Fossa cone, Palizzi and Gelso, Figure 1 and Figure 9C) [28], indicating that soil degassing and groundwater features represent a unique system controlled by tectonics.
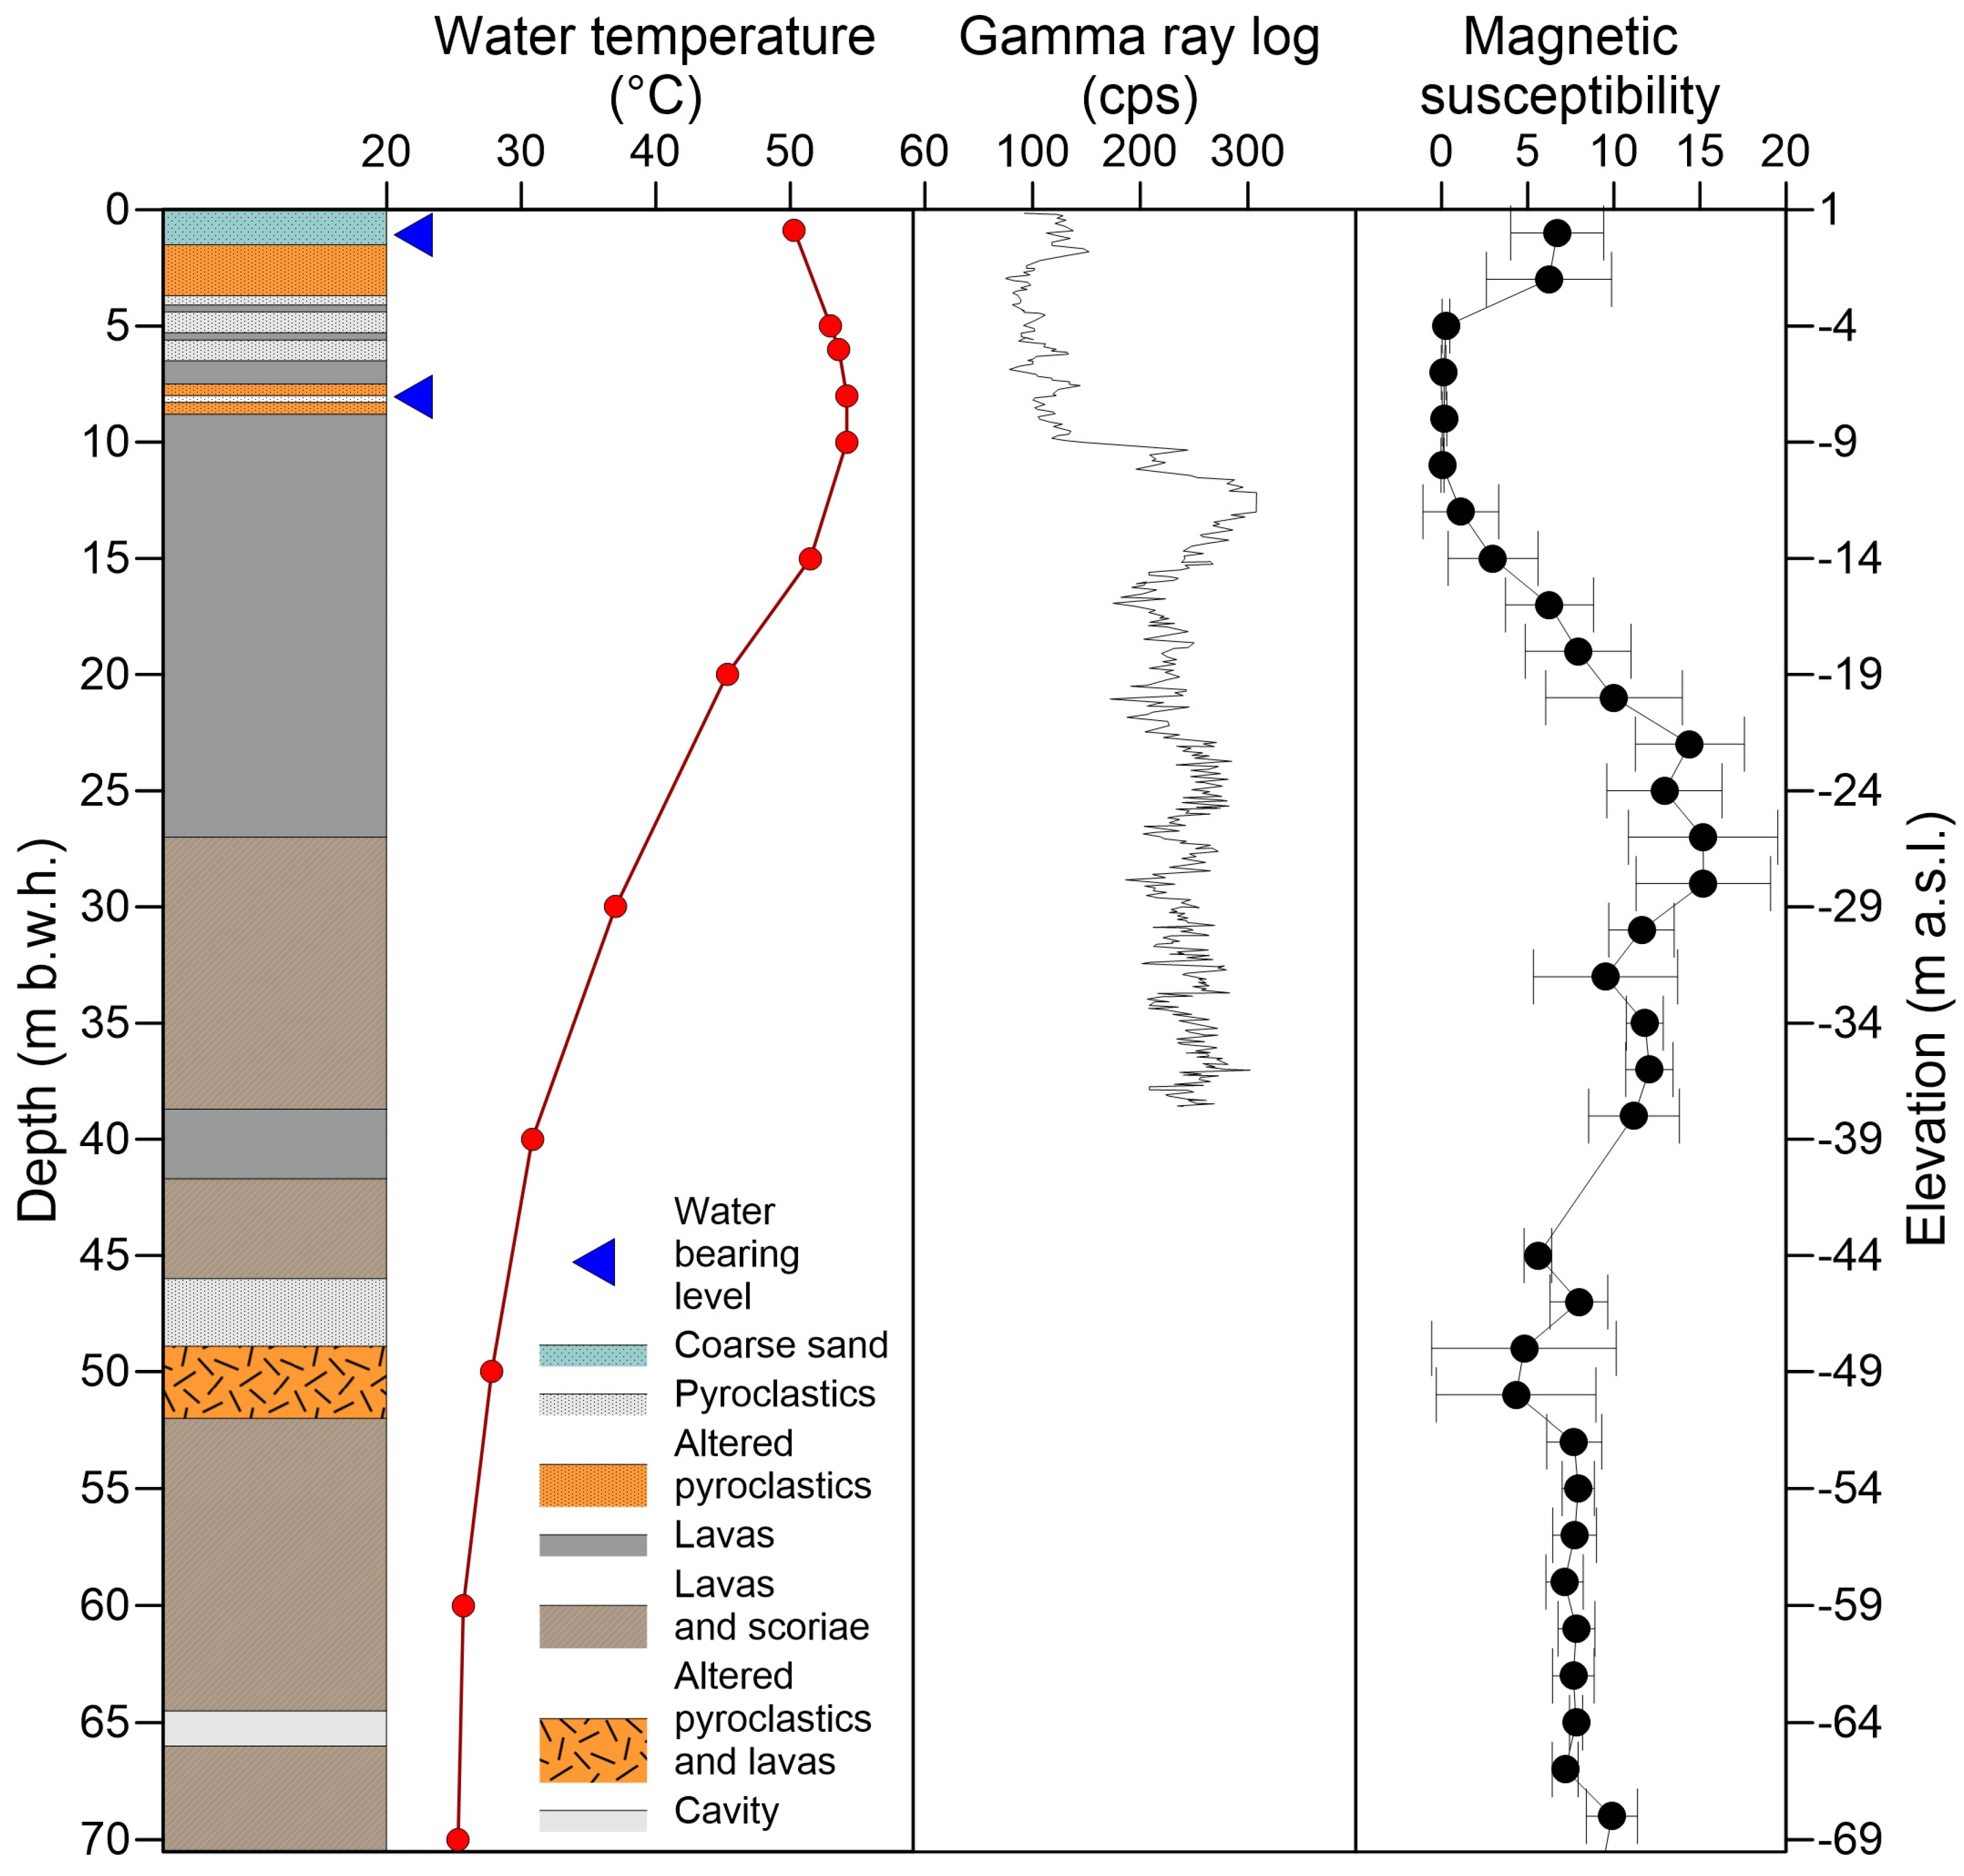
Lithostratigraphic data from well 26 (Figure 8) indicate that the Vulcano Porto aquifer is composed of at least two water bodies. The shallower of these is unconfined and sits in the alluvial coverage, whereas the deeper one is over-pressured and confined into a sub-metric pyroclastic deposit, whose depth at the seafront is several meters below sea level. This multi-layer geometry could explain the high spatial disorder shown by the isopiestic contour map (Figure 4), characterized by small-scale highs and lows possibly indicating apparent multiple flow directions with different orientations. Alternately, the isopiestic contours could be interpreted as the expression of static water table levels in wells subjected to different hydraulic regimes (unconfined or confined, over-pressured), with groundwater flowing along vertical (linked to tectonics) and/or horizontal (linked to volcano-stratigraphic horizons) discontinuities, following the prevailing relative permeability variations.
The interpreted, hydrogeological section (Figure 9C) would extend to the shallowest sector of the aquifer the general circulation model proposed by Capasso et al. [16] for the deeper hydrothermal system. As shown in the section, meteoric infiltration is subdivided into two circulation cells—a shallow, predominantly horizontal flow overlies a deep, vertical prevailing circuit. Where vertical permeability is dominant (volcano-tectonic discontinuities as faults, fractures or caldera borders) meteoric groundwater move downward supplying the deep hydrothermal system. Where horizontal permeability dominates, the hydraulic gradient between the Piano plateau (500 m a.s.l.) and Vulcano Porto (sea level) forces groundwater to move northwestwardly, with the highest gradients along the buried caldera borders.
A peculiar, local circulation scheme is established below La Fossa cone, which is a zone of higher permeability due to the intense fracturing associated with the volcanic activity originated from this vent. Under the cone, part of the meteoric circulation is intercepted by upwelling hydrothermal fluids, mixing and moving upward inside the fracture network. As this mixed fluid cools and depressurizes, while ascending toward ground level, it partially condensates into liquid water. The condensed vapor successively flows downslope along volcano-stratigraphic discontinuities (Figure 9C), as the horizontal-prevailing component of the inflow feeding the Vulcano Porto aquifer. Obviously, vertical discontinuities can be intercepted directly by the aquifer, and condensation of hydrothermal fluids can also occur directly into the water body (Figure 9C). Moving away from the cone or the vertical discontinuities the hydrothermally contaminated fluids progressively cool (Figure 5 and Figure 6a,b) and mix with the meteoric component of the aquifer, as evidenced by the observed progressive diminution of water electric conductivity (Figure 7).
The Vulcano Porto aquifer can be subdivided in two portions with a different hydrogeochemical character (Figure 9D). The area close to the La Fossa cone foothill (orange polygon in Figure 9D) is strongly influenced by the discharge of volcanic/hydrothermal fluids. The tectonic control on the hydrothermal circulation is represented by two lobes, oriented SE-NW as the TL fault, extending outside the annulus surrounding the base of the cone. The meteoric-dominated portion of the aquifer (blue polygon) is the most distant from the cone (and from the other exhaling NE coastal area). It is mainly fed by groundwater flowing from the Piano area.
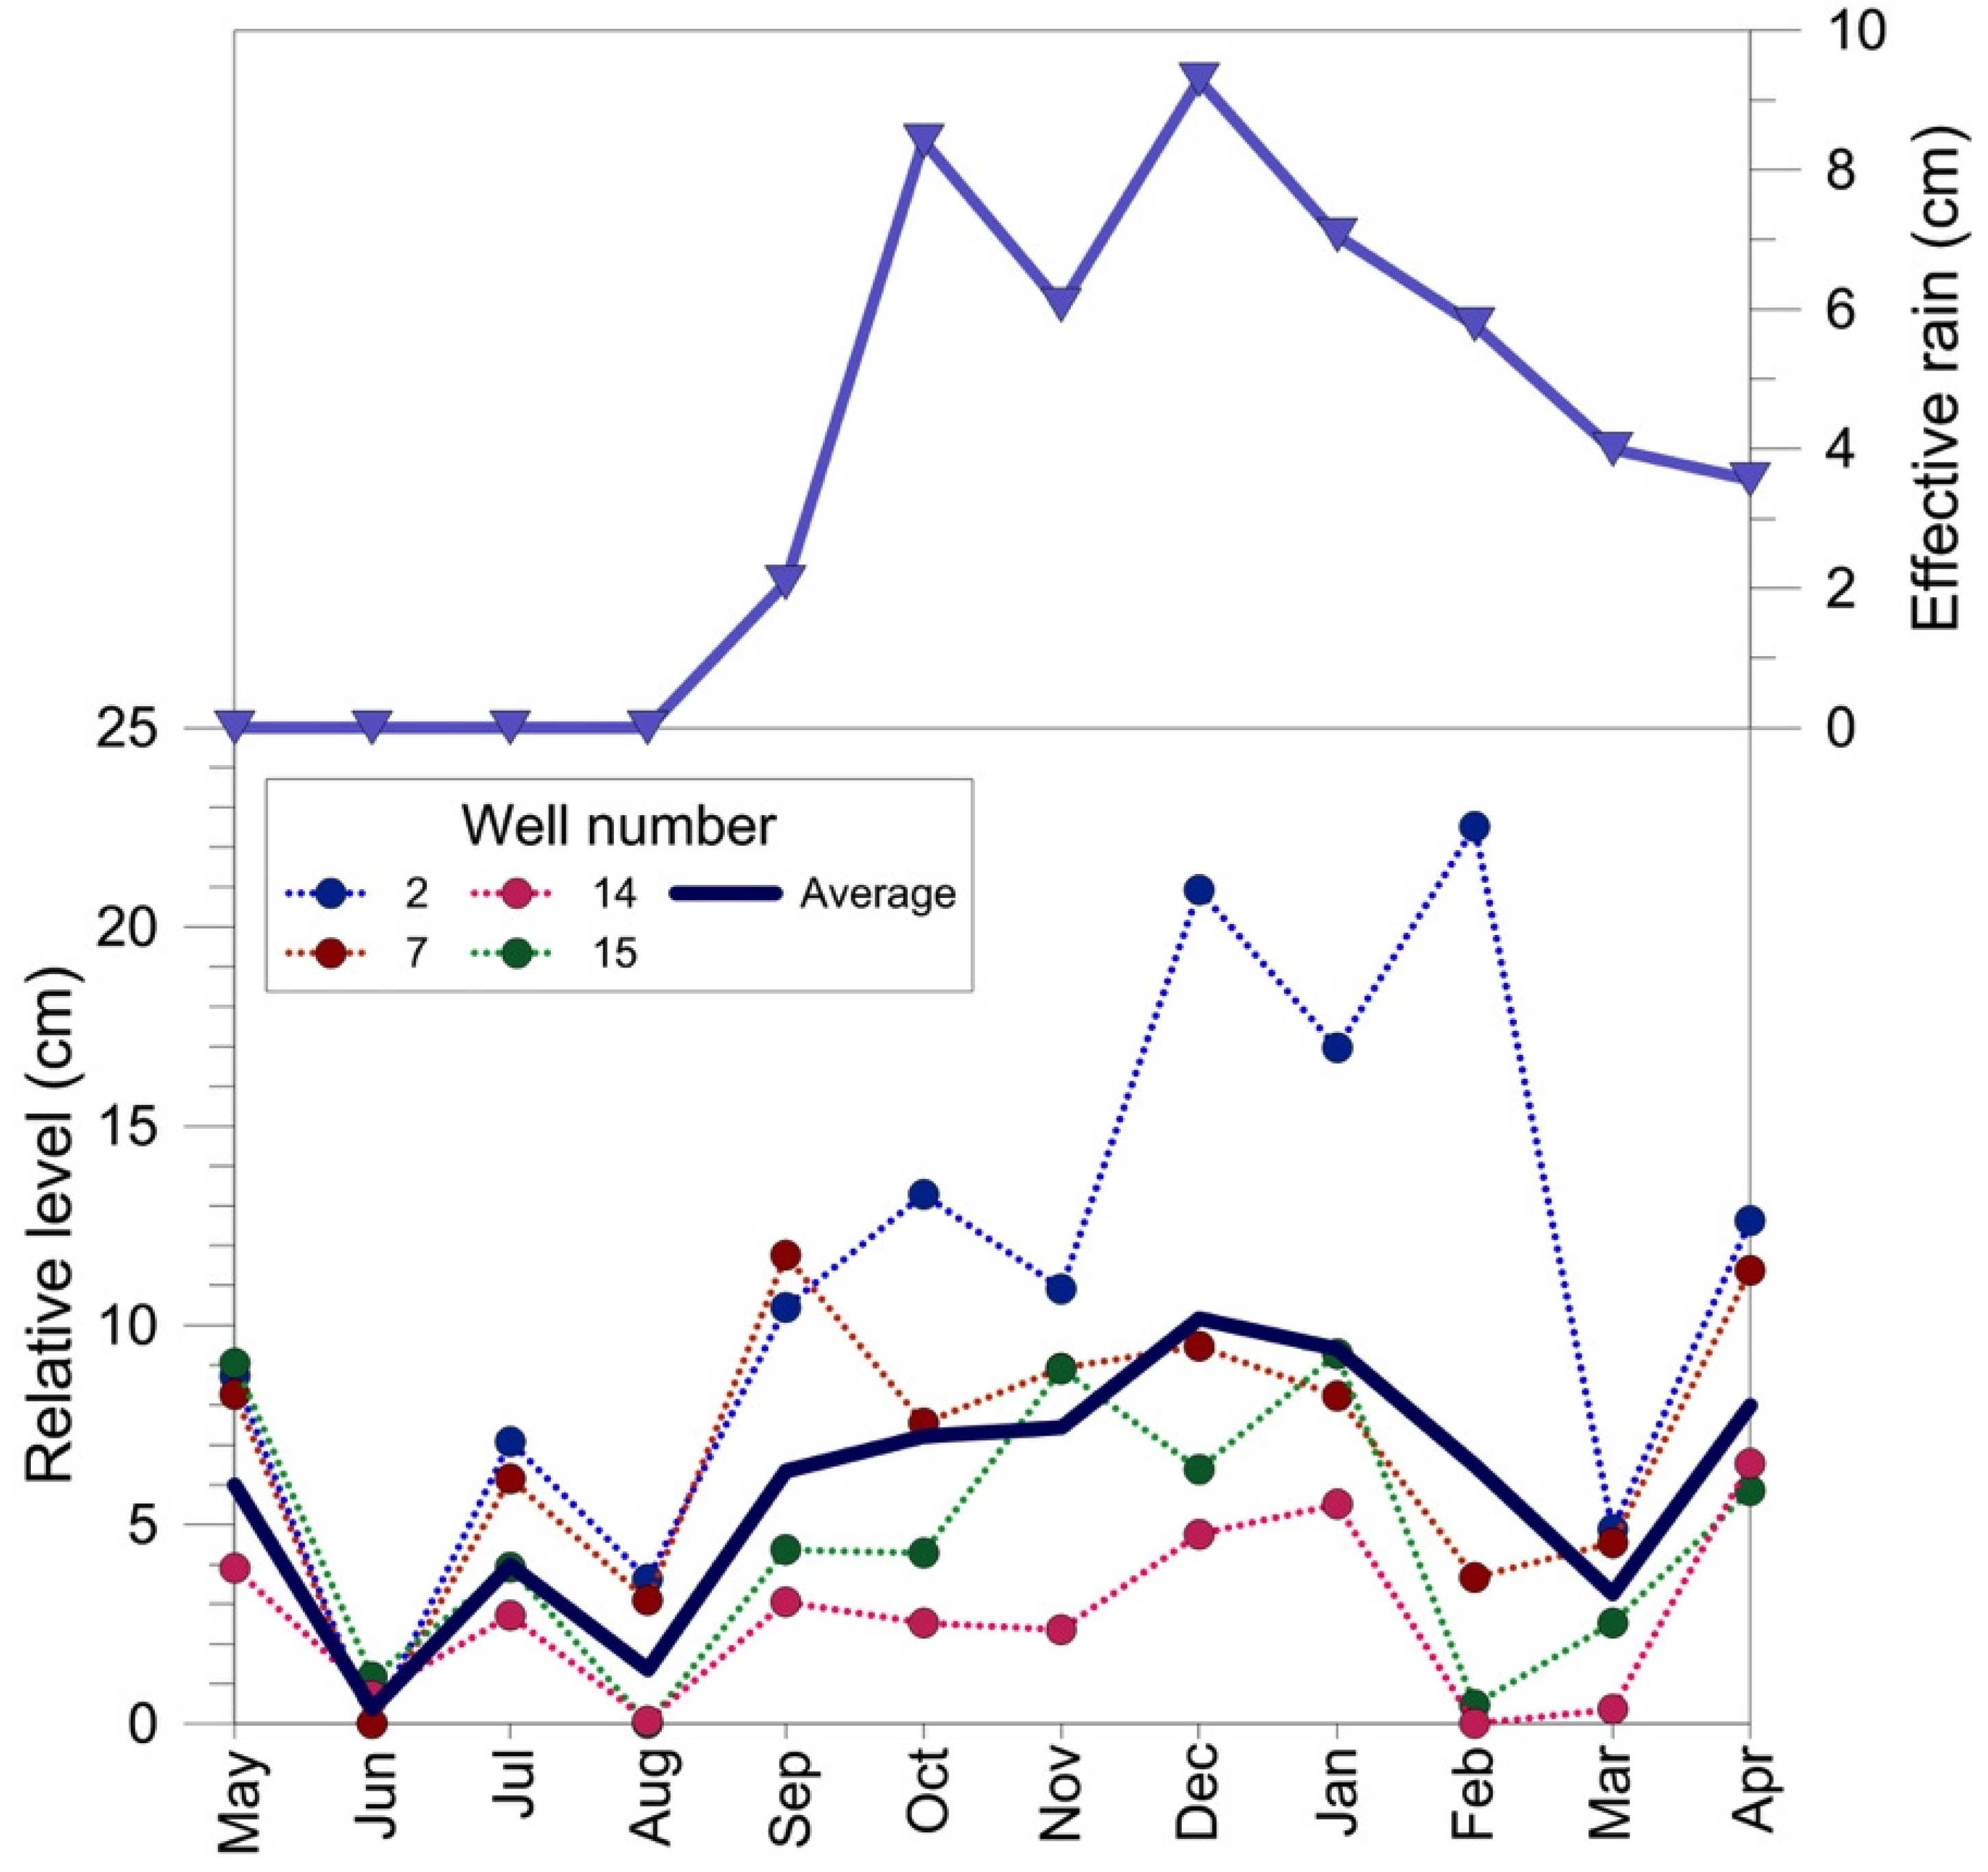
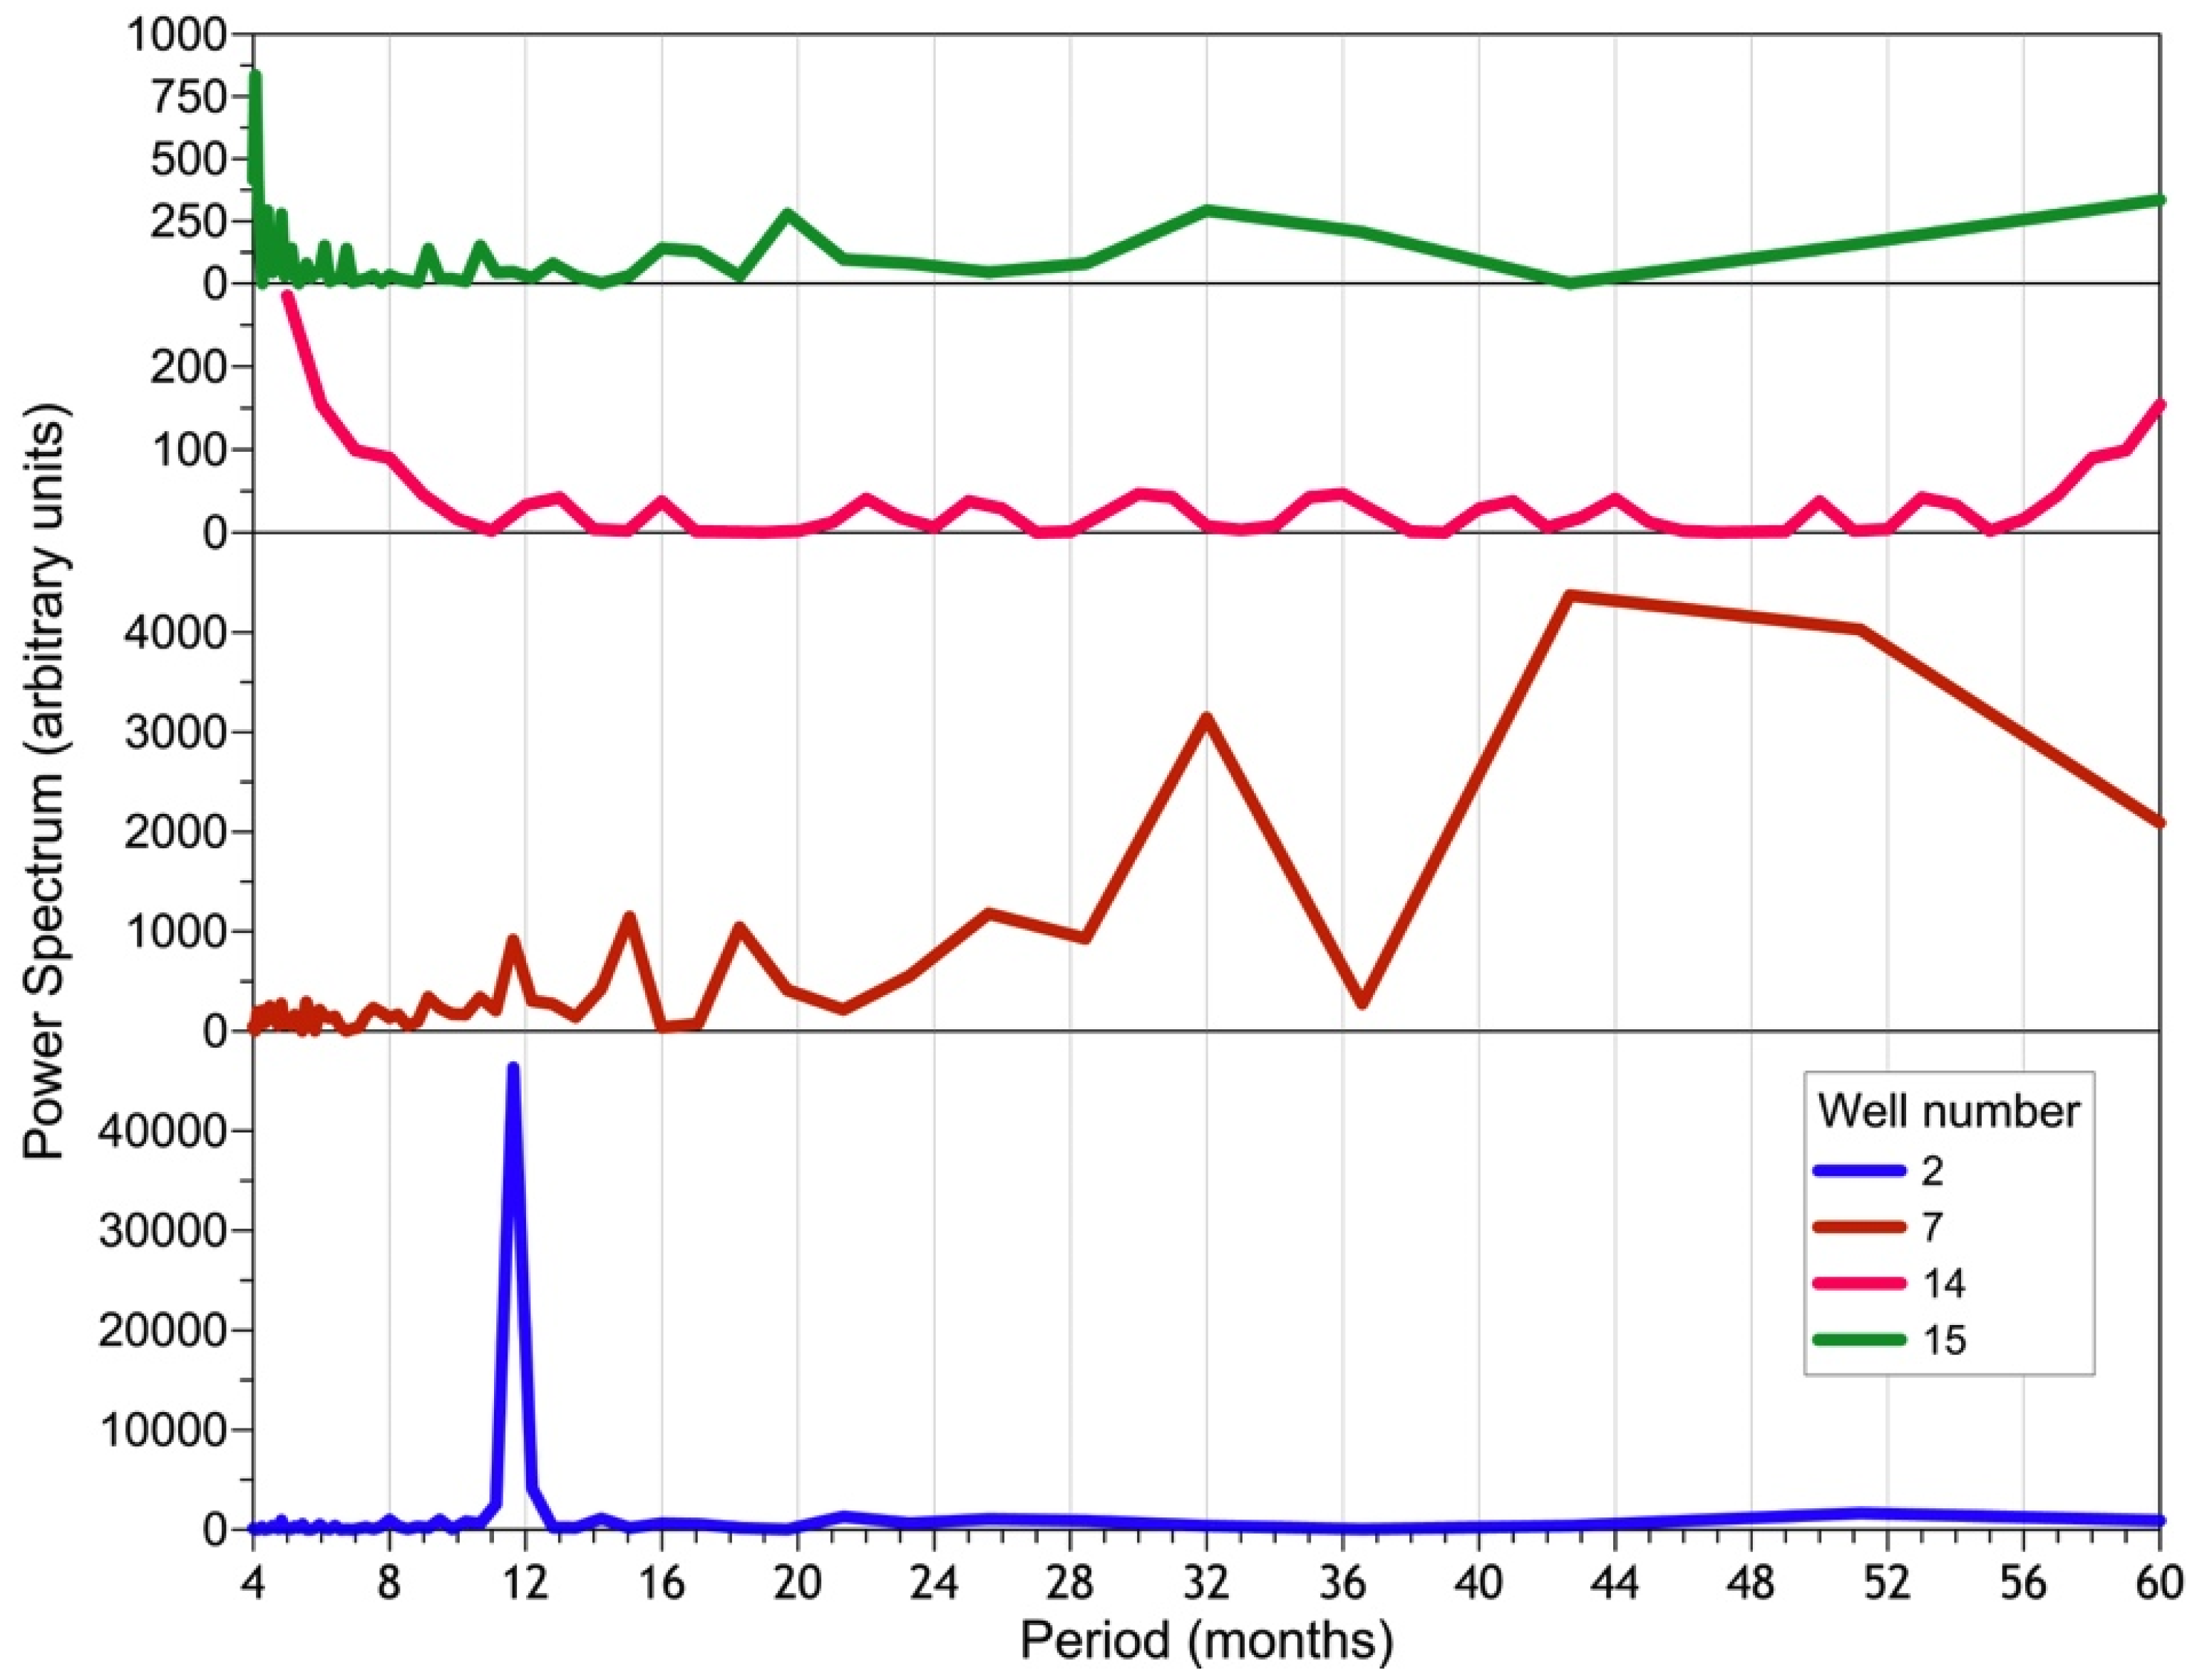
The strong annual periodicity unique to well 2 might be explained considering this is the closest well to the coast and in the most densely inhabited area of Vulcano Porto, where the number of residents is an order of magnitude (5000 to 500) greater in the touristic season (summer).
The combination among the hydrologic cycle, the astronomical tides and the intensive exploitation of the aquifer during the summer season is responsible for the variability of the piezometric head recorded in this well. Further inland, both the effects of the tide and of the exploitation (lower population density moving inward) progressively diminish, making flatter the time/frequency curves describing piezometric head variations. The positive anomaly recorded in July (Figure 2) is not explainable considering the simple hydrologic cycle, but could be due to the water supply shipped by tankers to Vulcano during summer and released to the aquifer via sub-irrigation as wastewaters, which can elevate the piezometric signal.

6. Conclusions

The proposed circulation scheme is characterized by an intricate geometry of flow paths, driven by horizontal and vertical variations of permeability at small scale, giving rise to a complicated mixing among the seawater, meteoric infiltration and hydrothermal/volcanic end members constituting the Vulcano Porto water body. This complicated mixing process is well evidenced by the huge lateral and vertical heterogeneity found in the chemical and isotopic composition of groundwater [29]. It is noteworthy that the distribution of permeability should be not considered as 3D (x, y, z) but as a 4D (x, y, z, time) system, because permeability varies in time according to variations of stress and strain fields, occurring during the tectono-volcanic phases experienced by Vulcano Island. Clues of geochemical anomalies induced by permeability variations following stress-induced permeability changes have been already reported during the recent volcanic unrests [16]. The circulation scheme we proposed could become invalid after the intervention of significant structural changes, induced by important variations in the activity state of the Vulcano Island volcanic system.
As a final and general remark we like to point out that simple field data, like water table elevation, temperature and electric conductivity, can give information useful for reconstructing the general framework of well-delimited hydro-geologic systems as those occurring in volcanic islands. Vulcano Island can be considered a pilot site for this research, because the impressive amount of geochemical literature produced in the last decades has supported the retrospective analysis of simple field physico-chemical data, giving robust constrains to the hypotheses formulated here. The general lesson learnt from the Vulcano case is that variability, both in space and time domains, is a peculiar characteristic of such a system, and particular care must be taken in applying the circulation model to other volcanic areas. In doing this, a reliable reconstruction of the local geometrical relationships among the different components of the volcanic systems is fundamental for developing successful groundwater circulation models.

Acknowledgments

This work was partially realized on behalf of the monitoring program of Italian volcanoes, financed by the Italian National Department for Civil Defence (DPCN).

Author Contributions

Paolo Madonia had the general idea, prepared graphs and maps and contributed to write the manuscript in equal parts with Giorgio Capasso, Rocco Favara and Paolo Tommasi. Field data were acquired by Giorgio Capasso, Rocco Favara, Paolo Madonia and Salvatore Francofonte. Well 26 data and their elaboration are due to Paolo Tommasi.

Conflicts of Interest

The authors declare no conflict of interest.

References

  1. Inguaggiato, S.; Mazot, A.; Diliberto, I.S.; Inguaggiato, C.; Madonia, P.; Rouwet, D.; Vita, F. Total CO2 output from Vulcano island (Aeolian Islands, Italy). Geochem. Geophys. Geosyst. 2012, 13. [Google Scholar] [CrossRef]
  2. Capasso, G.; Federico, C.; Madonia, P.; Paonita, A. Response of the shallow aquifer of the volcano-hydrothermal system during the recent crises at Vulcano Island (Aeolian Archipelago, Italy). J. Volcanol. Geotherm. Res. 2014, 273, 70–80. [Google Scholar] [CrossRef]
  3. Capasso, G.; Favara, R.; Inguaggiato, S. Interaction between fumarolic gases and thermal groundwaters at Vulcano Island (Italy): Evidences from chemical composition of dissolved gases in waters. J. Volcanol. Geotherm. Res. 1999, 102, 309–318. [Google Scholar] [CrossRef]
  4. Sommaruga, C. Le ricerche geotermiche svolte a Vulcano negli anni ′50. Rend. Soc. It. Min. Petrol. 1984, 39, 355–366. [Google Scholar]
  5. Argnani, A.; Serpelloni, E.; Bonazzi, C. Pattern of deformation around the central Aeolian Islands: Evidence from GPS data and multichannel seismics. Terra Nova 2007, 19, 317–323. [Google Scholar] [CrossRef]
  6. Mattia, M.; Palano, M.; Bruno, V.; Cannavò, F.; Bonaccorso, A.; Gresta, S. Tectonic features of the Lipari-Vulcano complex (Aeolian archipelago, Italy) from ten years (1996–2006) of GPS data. Terra Nova 2008, 20, 370–377. [Google Scholar] [CrossRef]
  7. Keller, J. The island of Vulcano. Rend. Soc. It. Min. Petrol. 1980, 36, 369–414. [Google Scholar]
  8. Ellam, R.M.; Menzies, M.A.; Hawkesworth, C.J.; Leeman, W.P.; Rosi, M.; Serri, G. The transitionf rom calc-alkaline to potassic orogenic magmatism in the Aeolian Islands, southern Italy. Bull. Volcanol. 1988, 50, 386–398. [Google Scholar] [CrossRef]
  9. De Astis, G.; Dellino, P.; la Volpe, L.; Lucchi, F.; Tranne, C.A. Geological Map of the Island of Vulcano (Aeolian Islands), Scale 1:10,000; Litografia Artistica Cartografica: Firenze, Italy, 2006. [Google Scholar]
  10. De Astis, G.; Frazzetta, G.; la Volpe, L. I depositi di riempimento della Caldera del Piano e i depositi della Lentia. Acta Vulcanol. Italy 1989, 2, 763–778. [Google Scholar]
  11. Frazzetta, G.; la Volpe, L.; Sheridan, M.F. Evolution of the Fossa cone, Vulcano. J. Volcanol. Geotherm. Res. 1983, 17, 329–360. [Google Scholar] [CrossRef]
  12. Frazzetta, G.; Gillot, P.Y.; la Volpe, L.; Sheridan, M.F. Volcanic hazards of Fossa of Vulcano: Data from the last 6000 years. Bull. Volcanol. 1984, 47, 105–124. [Google Scholar] [CrossRef]
  13. Aiuppa, A.; Dongarrà, G.; Capasso, G.; Allard, P. Trace elements in the thermal groundwaters of Vulcano Islands (Sicily). J. Volcanol. Geotherm. Res. 2000, 98, 189–207. [Google Scholar] [CrossRef]
  14. Bolognesi, L.; D’Amore, F. Isotopic variation of the hydrothermal system on Vulcano Island, Italy. Geochim. Cosmochim. Acta 1993, 57, 2069–2082. [Google Scholar] [CrossRef]
  15. Capasso, G.; Dongarrà, G.; Hauser, S.; Favara, R.; Valenza, M. Isotope composition of rain water, well water and fumarolic steam on the island of Vulcano, and their implications for volcanic surveillance. J. Volcanol. Geotherm. Res. 1992, 49, 147–155. [Google Scholar] [CrossRef]
  16. Capasso, G.; Favara, R.; Inguaggiato, S. Chemical and isotopic features of gaseous manifestation on Vulcano Island (Aeolian Island): An interpretative model of fluid circulation. Geochim. Cosmochim. Acta 1997, 61, 3425–3442. [Google Scholar] [CrossRef]
  17. Capasso, G.; Favara, R.; Francofonte, S.; Inguaggiato, S. Vulcano and Stromboli: Gas and water geochemistry. Geochemical surveillance of thermal waters and gaseous emissions at Vulcano island (Aeolian Islands, Italy). Acta Vulcanol. Italy 2000, 12, 103–106. [Google Scholar]
  18. Carapezza, M.; Dongarrà, G.; Hauser, S.; Longinelli, A. Preliminary isotopic investigations on thermal waters from Vulcano Island, Italy. Mineral. Petrogr. Acta 1983, 27, 221–232. [Google Scholar]
  19. Panichi, C.; Noto, P. Isotopic and chemical composition of water, steam and gas samples of the natural manifestations of the Island of Vulcano (Aeolian Arc, Italy). Acta Vulcanol. Italy 1992, 2, 297–312. [Google Scholar]
  20. Capasso, G.; Favara, R.; Francofonte, S.; Inguaggiato, S. Chemical and isotopic variations in fumarolic discharge and thermal waters at Vulcano Island (Aeolian Island, Italy) during 1996: Evidence of resumed volcanic activity. J. Volcanol. Geotherm. Res. 1999, 88, 167–175. [Google Scholar] [CrossRef]
  21. Federico, C.; Capasso, G.; Paonita, A.; Favara, R. Effects of steam-heating processes on a stratified volcanic aquifer: Stable isotopes and dissolved gases in thermal waters of Vulcano Island (Aeolian archipelago). J. Volcanol. Geotherm. Res. 2010, 192, 178–190. [Google Scholar] [CrossRef]
  22. Nuccio, P.M.; Paonita, A.; Sortino, F. Geochemical modeling of mixing between magmatic and hydrothermal gases: The case of Vulcano, Italy. Earth Planet. Sci. Lett. 1999, 167, 321–333. [Google Scholar] [CrossRef]
  23. Paonita, A.; Federico, C.; Bonfanti, P.; Capasso, G.; Inguaggiato, S.; Italiano, F.; Madonia, P.; Pecoraino, G.; Sortino, F. The episodic and abrupt geochemical changes at La Fossa fumaroles (Vulcano Island, Italy) and related constraints on the dynamics, structure, and compositions of the magmatic system. Geochim. Cosmochim. Acta 2013, 120, 158–178. [Google Scholar] [CrossRef]
  24. Chiodini, G.; Cioni, R.; Marini, L.; Panichi, C. Origin of fumarolic fluids of Vulcano Island, Italy and implications for volcanic surveillance. Bull. Volcanol. 1995, 57, 99–110. [Google Scholar] [CrossRef]
  25. Giggenbach, W. Geothermal solute equilibria. Derivation of Na-K-Mg-Ca geoindicators. Geochim. Cosmochim. Acta 1988, 52, 2749–2765. [Google Scholar] [CrossRef]
  26. Madonia, P.; Cusano, P.; Diliberto, I.S.; Cangemi, M. Thermal anomalies in fumaroles at Vulcano island (Italy) and their relationship with seismic activity. Phys. Chem. Earth 2013, 2013. [Google Scholar] [CrossRef]
  27. Schöpa, A.; Pantaleo, M.; Walter, T.A. Scale-Dependent location of hydrothermal vents: Stress field models and infrared field observations of the Fossa Cone, Vulcano Island, Italy. J. Volcanol. Geotherm. Res. 2011, 203, 133–145. [Google Scholar] [CrossRef]
  28. Diliberto, I.S.; Gurrieri, S.; Valenza, M. Relationships between diffuse CO2 emissions and volcanic activity on the island of Vulcano (Aeolian Islands, Italy) during the Period 1984–1994. Bull. Volcanol. 2002, 64, 219–228. [Google Scholar] [CrossRef]
  29. Capasso, G.; D’Alessandro, W.; Favara, R.; Inguaggiato, S.; Parello, F. Interaction between the deep fluids and the shallow groundwaters on Vulcano Island (Italy). J. Volcanol. Geotherm. Res. 2001, 108, 187–198. [Google Scholar] [CrossRef]

