Article

Experimenting with Coupled Hydro-Ecological Models to Explore Measure Plans and Water Quality Goals in a Semi-Enclosed Swedish Bay

Swedish Meteorological and Hydrological Institute (SMHI), Norrköping 60176, Sweden
*
Author to whom correspondence should be addressed.
Water 2015, 7(7), 3906-3924; https://doi.org/10.3390/w7073906
Submission received: 20 January 2015 / Revised: 18 June 2015 / Accepted: 6 July 2015 / Published: 14 July 2015
(This article belongs to the Special Issue Hydro-Ecological Modeling)

Abstract

:
Measure plans are currently being developed for the Water Framework Directive (WFD) by European water authorities. In Sweden, such plans include measures for good ecological status in the coastal ecosystem. However, the effect of suggested measures is not yet known. We therefore experimented with different nutrient reduction measures on land and in the sea, using a model system of two coupled dynamic models for a semi-enclosed bay and its catchment. The science question was whether it is worthwhile to implement measures in the local catchment area to reach local environmental goals, or if the status of the Bay is more governed by the water exchange with the Sea. The results indicate that by combining several measures in the catchment, the nutrient load can be reduced by 15%–20%. To reach the same effect on nutrient concentrations in the Bay, the concentrations of the sea must be reduced by 80%. Hence, in this case, local measures have a stronger impact on coastal water quality. The experiment also show that the present targets for good ecological status set up by the Swedish water authorities may be unrealistic for this Bay. Finally, we discuss when and how to use hydro-ecological models for societal needs.

Graphical Abstract

1. Introduction

Water pollution is widespread and at the same time highly complex, as it originates from the interaction between natural processes and human activities. Many cause–effect relationships are affecting the water simultaneously, with various extensions in time and space e.g., [1,2,3]. Soluble chemical components are being caught and carried by water, an aggressive liquid on continuous move, following shallow, intermediate or deep pathways from the land surface to the sea. Nutrients and oxygen are the best-documented water quality determinants e.g., [4,5], with major impacts downstream and on the coast [6,7,8]. During the last decades, this evidence base from monitoring has supported the development of a large flora of dynamic models that numerically describe the coupling between water and nutrients during the movement through the landscape. The models include interactions with sources and sinks, both within single catchments e.g., [9] and across continents in multi-basins e.g., [10]. Such models are normally developed by scientists but when used in practical applications, together with stakeholders, they may serve as platforms for communication and bridge the gap between science and practice e.g., [11,12,13].
The problems with water pollution have led to great efforts worldwide to detect deterioration and to achieve more sustainable, holistic and integrated water management. In Europe, the Water Framework Directive (WFD, 2000/60/EC) for integrated river basin management was adopted in year 2000 [14]. The environmental objectives are the core of this directive and the definition of “good ecological status” is essential. Each member state decides how to implement the WFD and in Sweden five water districts are responsible for the characterization of ecological status, setting up objectives for each water body, providing management and measure plans, and the implementation and continuous monitoring. In 2008, the European Union also adopted the Marine Strategy Framework Directive (MSFD, 2008/56/EC) which, just as the WFD, applies an adaptive management approach in a six years cycle. The MFSD addresses four marine regions surrounding Europe, where Sweden is part of the Baltic Sea region and the North-East Atlantic Ocean.
The Baltic Sea is one of the largest brackish water systems in the world and it is enclosed except from the narrow connection with the North-east Atlantic Ocean at the Danish straights and Öresund. The drainage basin is home to 85 million people and the sea suffers from pressures like eutrophication, overfishing, industrial waste, and heavy traffic by ships. International agreements, also addressing nutrient load reductions from each country surrounding the sea, have been made within the Helsinki Commission (HELCOM) Baltic Sea Action Plan, BSAP [15,16,17]. The BSAP is a substantial part of the implementation of the MSFD in the region, although local marine targets have been suggested as well [18]. The coastal zone along the Baltic Sea is highly affected by the increased load of nutrients, and just as for the sea as a whole, the problems are especially severe in semi-enclosed basins, where the water exchange is reduced. Such coasts are more affected by riverine nutrient loads from land and suffer from eutrophication and oxygen depletion. Hence, the ecological status in the coastal zone is affected by decisions taken both with reference to the WFD and the MSFD.
In the present study, we coupled a hydrological and an oceanographic model to simulate the effects of suggested measures and management plans from the two different directives for a semi-enclosed Bay in South-Eastern Sweden, called Slätbaken Bay (Figure 1). The catchment model Hydrological Predictions for the Environment, HYPE [19], which calculates water and nutrients on a daily time-step, was used to estimate effects of land-based measures. The effects in the bay itself were estimated using the Coastal Zone Model, CZM [20], which is an oceanographic ecosystem model with nine biogeochemical variables calculated with a ten minutes time-step. The hypothesis is that measures both in the coastal drainage basin and in the Baltic Proper will affect the nutrient status of the Bay, as it is semi-enclosed.
Figure 1. The Baltic Sea catchment area and the location of the semi-enclosed Slätbaken Bay (a), catchment and land cover of the major river, and monitoring sites (b).
Water 07 03906 g001
An experiment was set up to quantify the effects from various combat measures in relation to the environmental targets set up by the water authorities for Slätbaken Bay. Local land-based measures in the catchment were compared with remote measures for the total sea, to evaluate the influence of the two different EU directives on this specific coastal environment. The aim was to explore whether it is worthwhile to implement measures in the local catchment area to reach local environmental targets, or if the status of the Bay is more governed by the water exchange with the Sea. The paper thus shows how coupled hydro-ecological models can assist water authorities in practical water management issues.

2. Materials and Methods

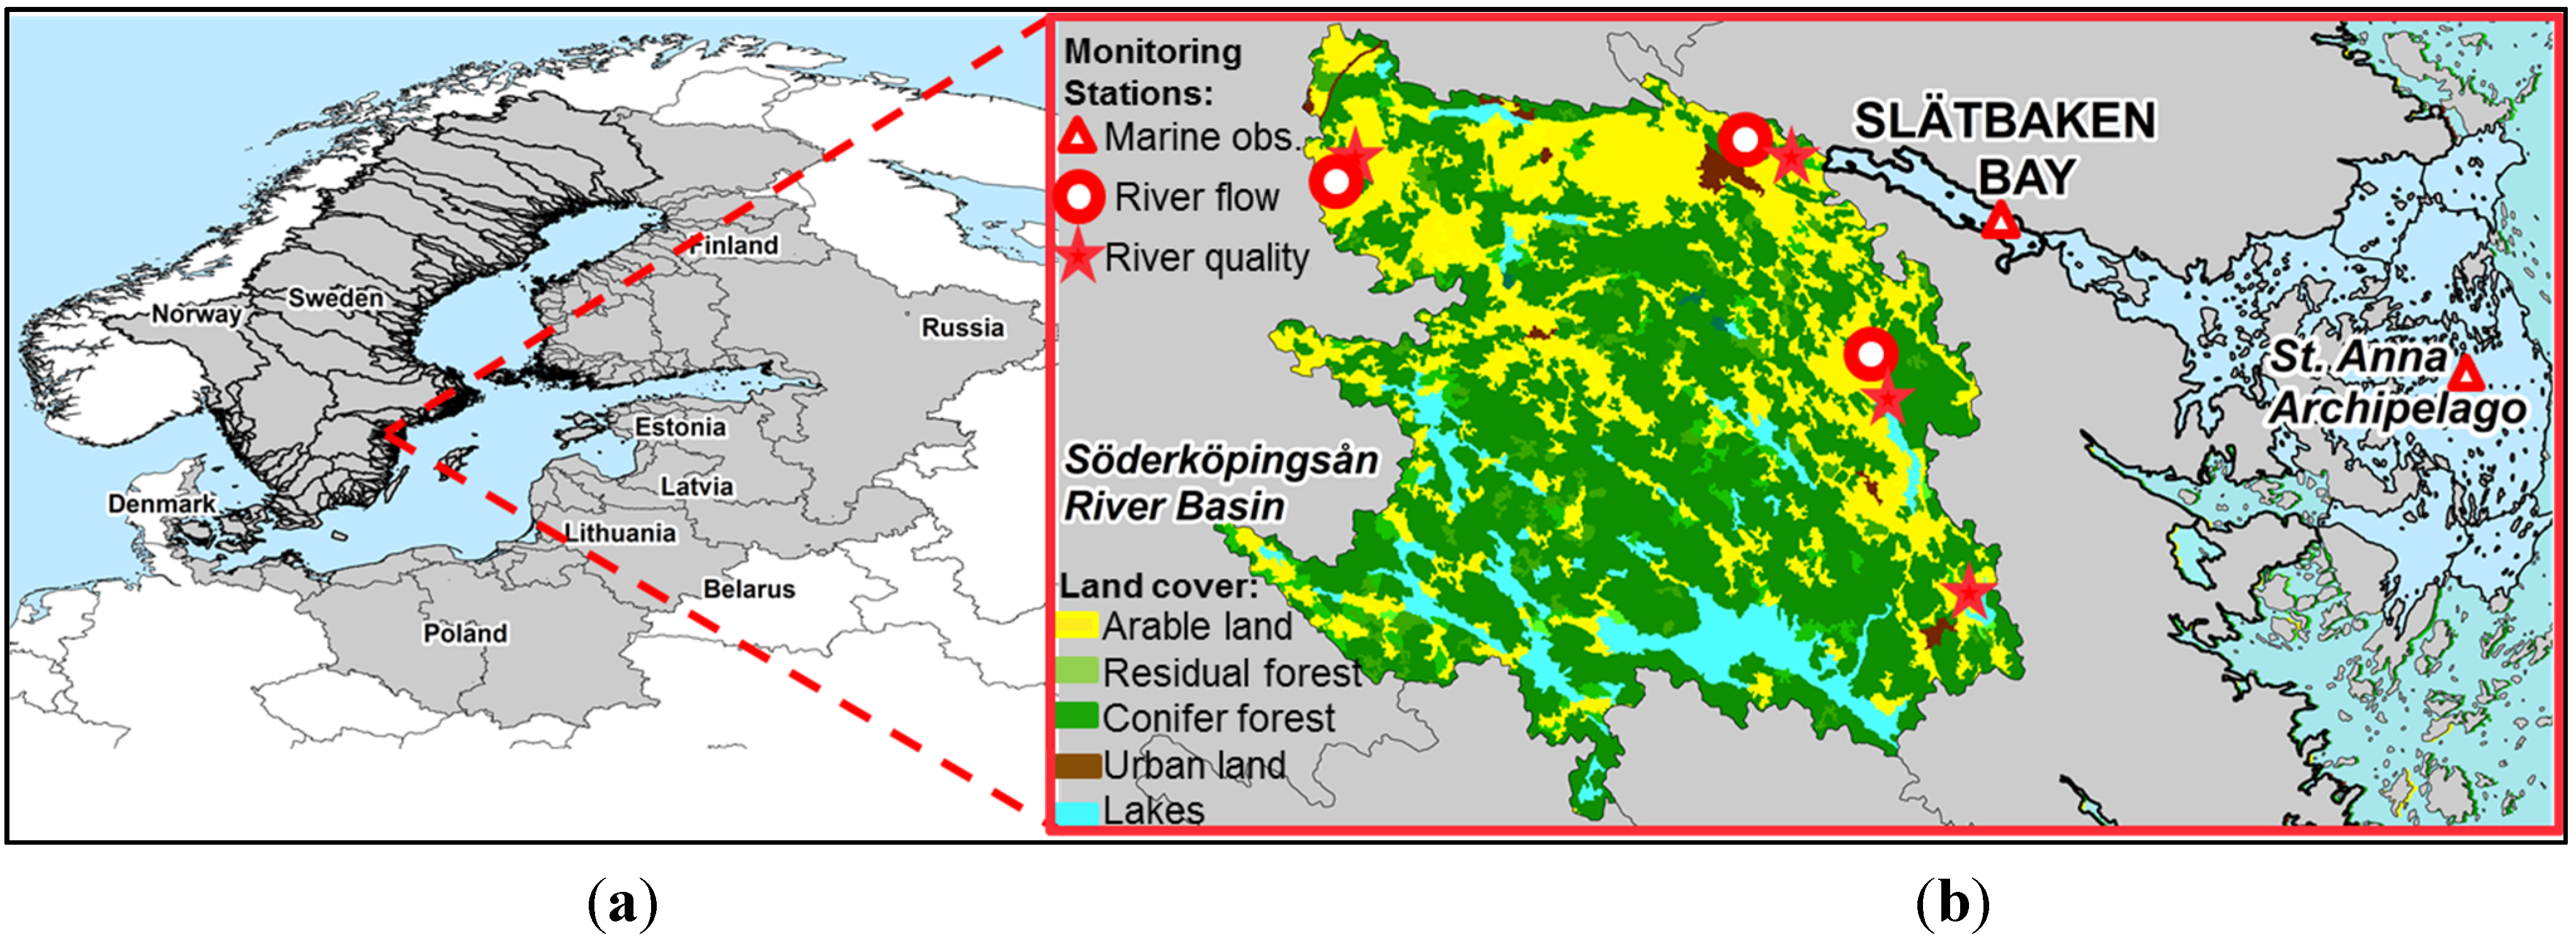
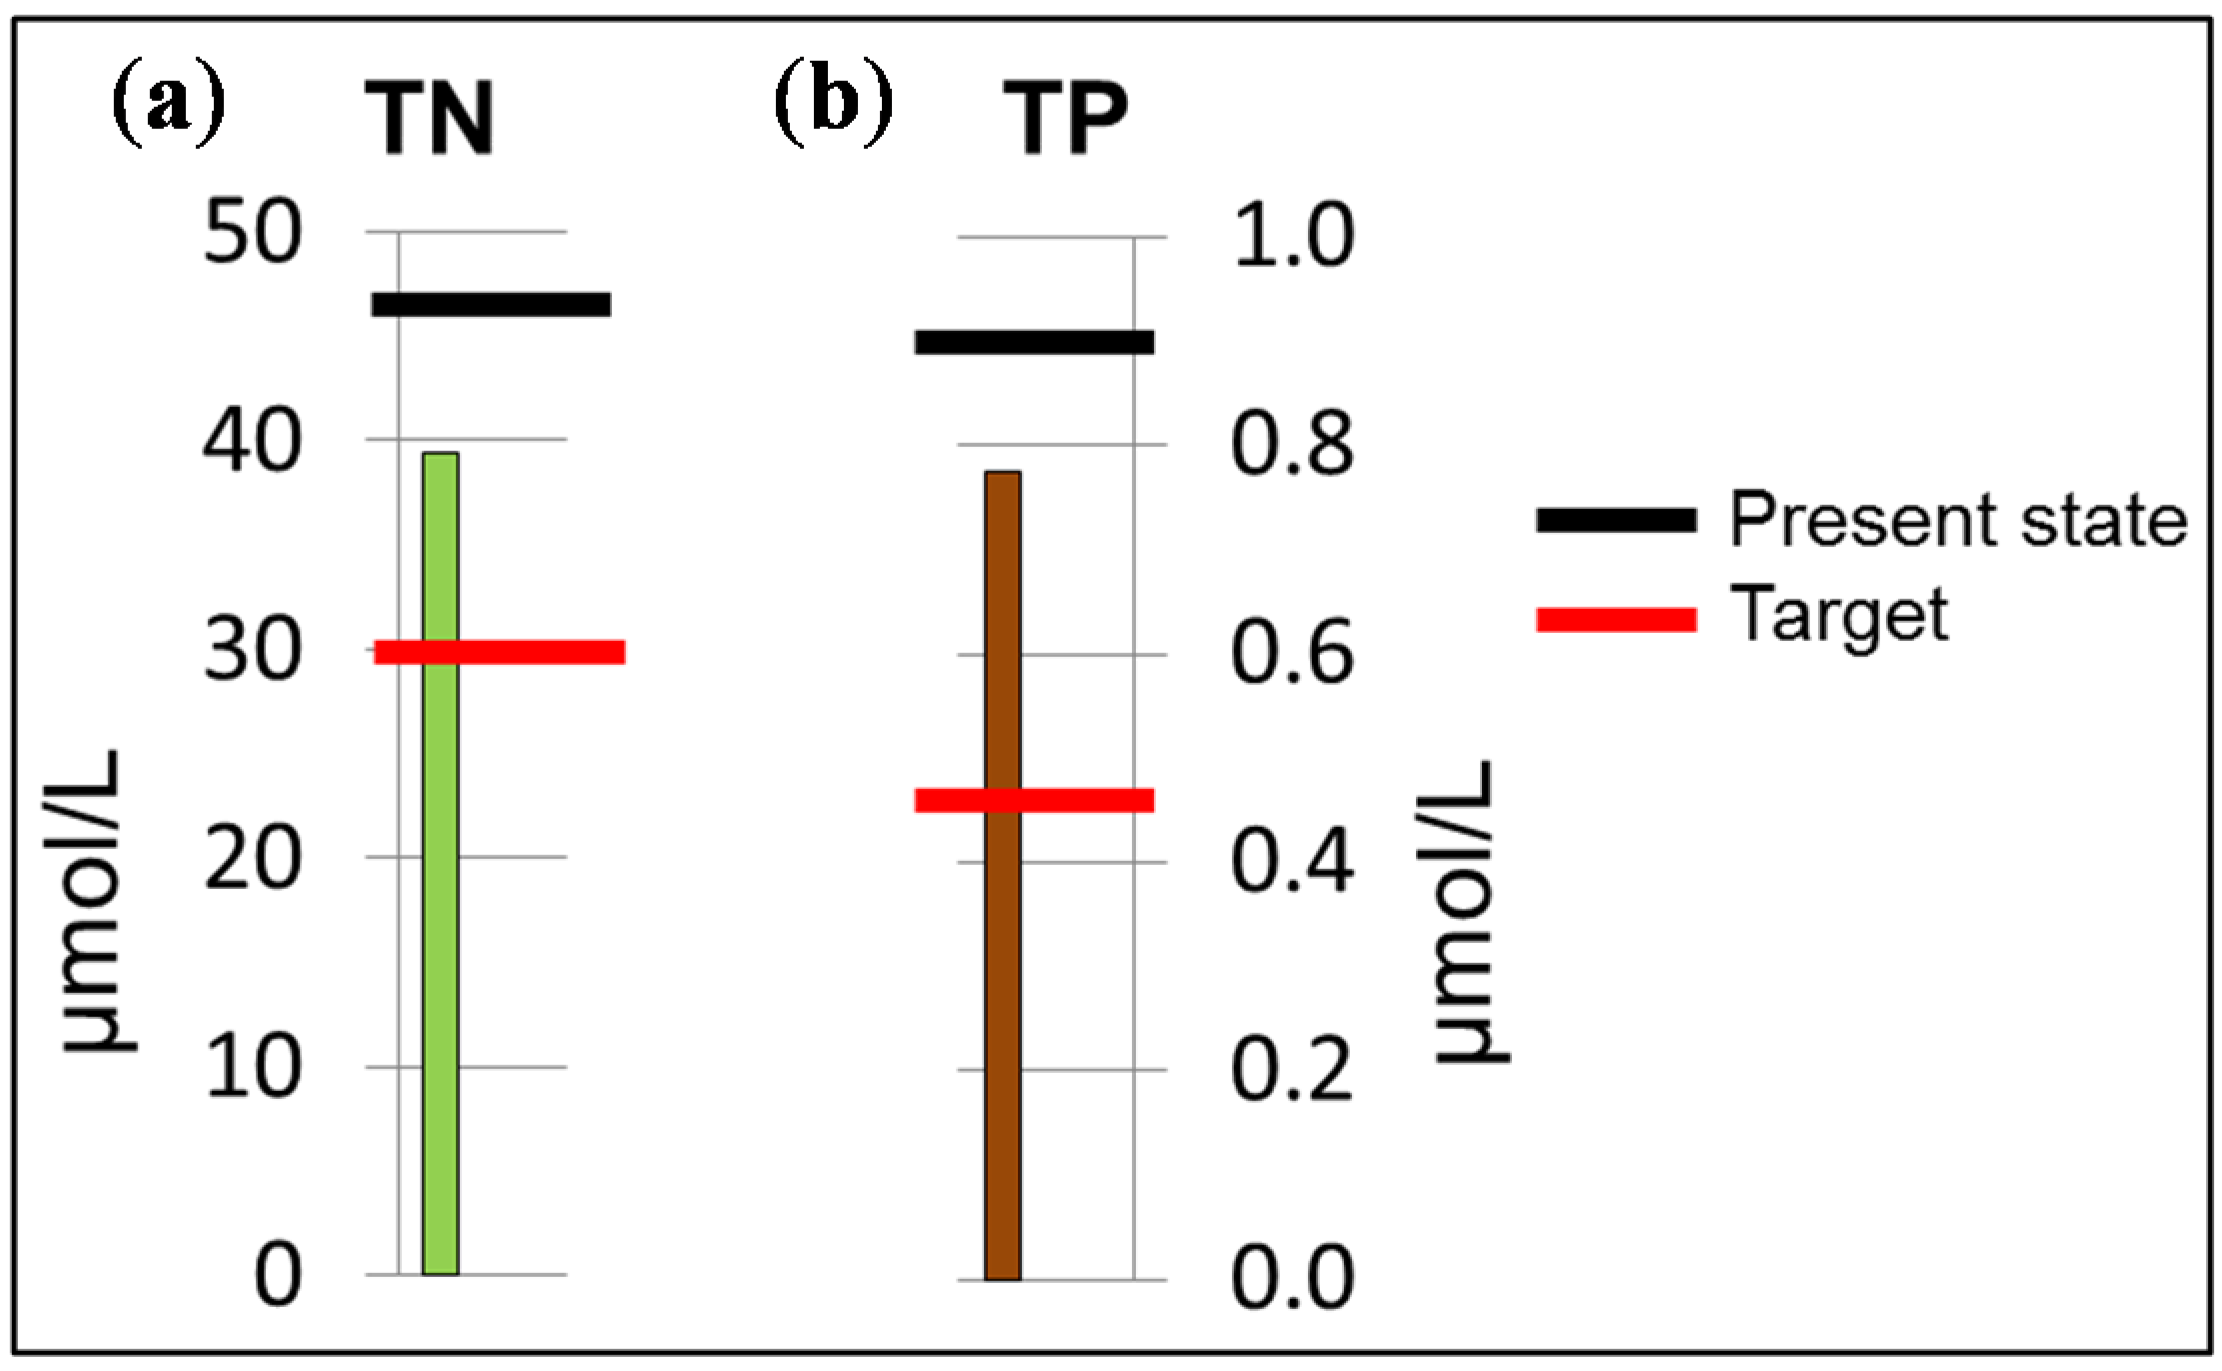
2.1. The Study Site and Environmental Quality Targets

This study explores different ways to improve the nutrient status in Slätbaken Bay (Figure 1). The bay has an area of 15.5 km2, is of fjord-like character and further enclosed by the St. Anna archipelago, which is part of the Baltic Proper. The major river inflow to the bay is the Söderköpingsån River, which has a catchment area of 880 km2, where 9% are lakes, 64% forests, 26% agricultural land and 1% urban areas. About 16,000 inhabitants live permanently in the catchment area and, in addition, there are 900 summer cottages.
In accordance with the WFD, the local water authorities have defined targets for good environmental status in Slätbaken Bay. These are winter concentrations of total nitrogen (N) < 29 µmolN/L and phosphorus (P) < 0.61 µmolP/L. Targets for summer concentrations are <30 µmolN/L and <0.46 µmolP/L.
The MSFD, on the other hand, prescribes reductions, relative to current conditions, in summer concentrations of −3% for N and −27% for P for the Baltic Proper as a whole, according to the BSAP [15]. The status of the Slätbaken Bay is thus affected by implementation of both EU directives.

2.2. Catchment Modelling with HYPE

The HYPE model [19] is a process-based hydrological model that simulates the flow and turnover of water and nutrients in the soil, rivers and lakes. Catchments are divided into subcatchments, which are further divided into hydrological response units, i.e., combinations of soil type and land use. Agricultural land is further divided into main crop types. The soil profile is normally divided into three layers. The turn-over and flow of water, N and P is simulated daily for each computational element. The model simulates concentrations of inorganic and organic N, as well as dissolved and particulate P. The HYPE model code is continuously developed and released in new versions at http://hype.sourceforge.net/. For this study, the version HYPE3.5.3 was used.
For Sweden, the HYPE model is set up according to the resolution decided by the water authorities to support the WFD work across the whole country e.g., [21,22]. This set-up is called S-HYPE and the latest version can be found for inspection and be downloaded at http://vattenwebb.smhi.se/. The national model system covers more than 450,000 km2 and produces daily values of nutrient concentration and water discharge in 37,000 catchments since 1961. The latest version has an average Nash and Sutcliffe [23] Efficiency (NSE) for water discharge of 0.7 and an average relative error of 5%, including both regulated and unregulated rivers with catchments from 1 to 50,000 km2 and various land-uses across the country. The modelled long-term flow weighted concentrations of nutrients generally fall within ±10% for N and ±20% for P compared to observations (http://vattenwebb.smhi.se/).
For this study, the requested input data [22] such as land cover, topography, soil types, emissions, and forcing data (precipitation and temperature) were obtained from the S-HYPE version 2010. The Söderköpingsån River catchment was then divided into 43 subcatchments and calibrated separately for this experiment. In addition to the river, calculations of water and nutrient inflow from adjacent coastal land near the Bay were included in the simulation. Observations of N- and P-concentrations were available at 4 sites and water discharge at 3 sites (Figure 2). The model was calibrated simultaneously for all observation sites in the specific catchment, using a step-wise iterative procedure [22]. The parameters in the model are linked to soil type and land use; hence the set of parameters for a subcatchment is determined by the distribution of these characteristics.

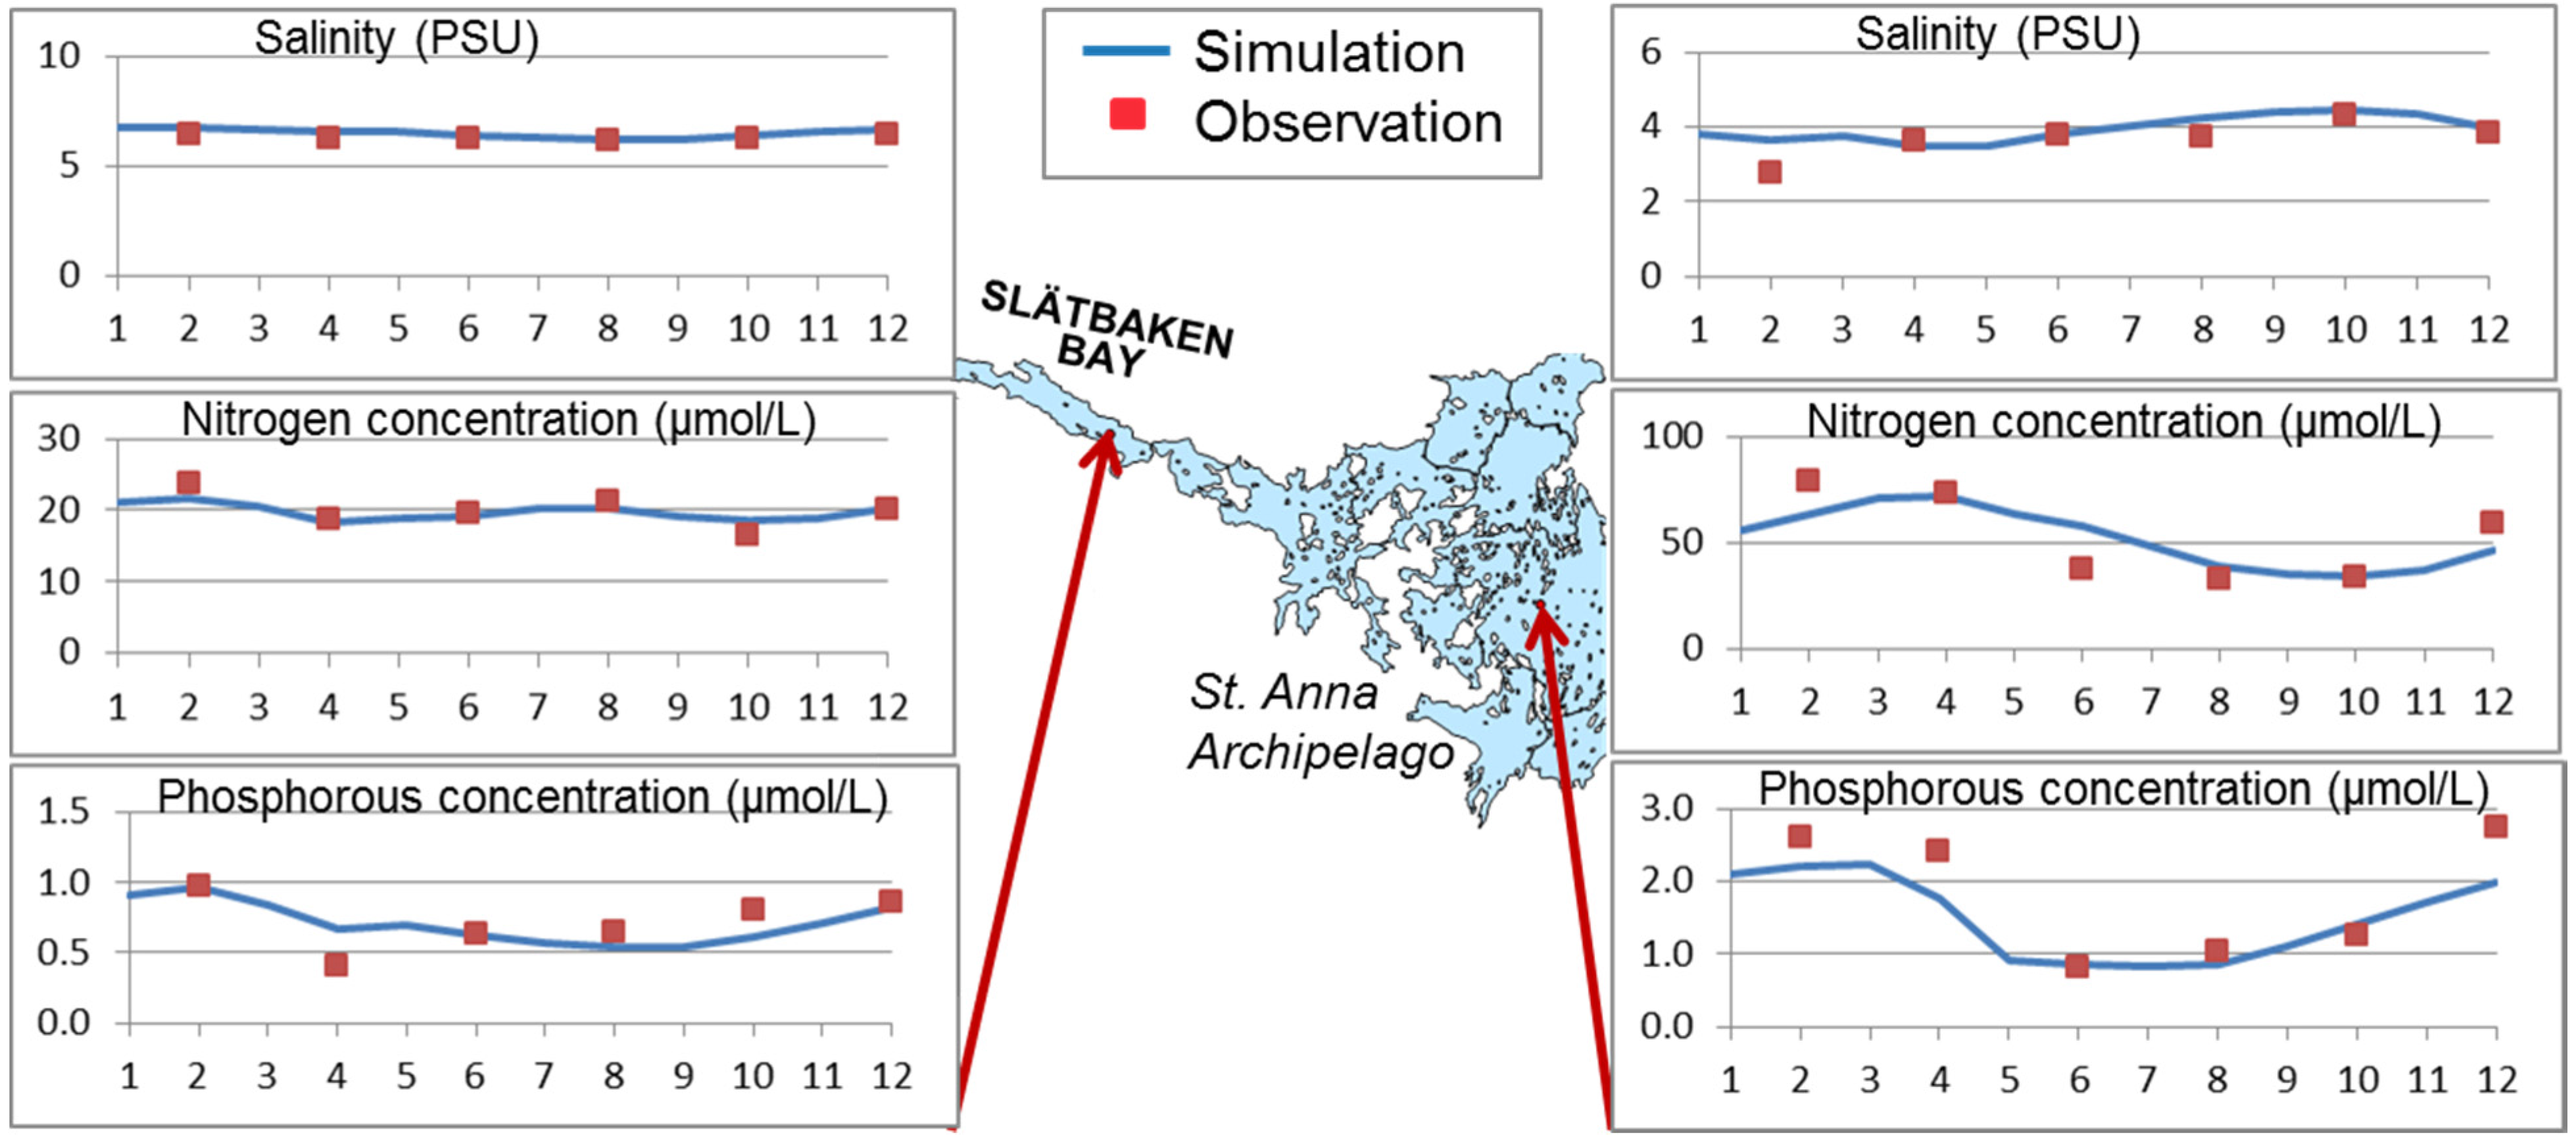
2.3. Coastal Zone Modelling with CZM

The Coastal Zone Model (CZM) [20] is a coupled one-dimensional hydrodynamic and biogeochemical model where the hydrodynamic part is based on the Program for Boundary Layers in the Environment, PROBE model [24]. PROBE is a general equation solver including, among other things, heat exchange, a two-equation turbulence model and a parameterization of deep sea mixing. The water exchange in the model is driven by baroclinic pressure gradients, i.e., density differences. The model has been set up for the whole Baltic Sea divided into thirteen subbasins in an application called PROBE-Baltic [25], for examining salinity and temperature variations.
The CZM also solves for nine biogeochemical variables described within the Swedish Coastal and Ocean Biogeochemical model, SCOBI model [26]. The variables solved for are nitrate, ammonium, phosphate, oxygen, phytoplankton, zooplankton, detritus and benthic detritus as N and as P. For every time step of 10 min, the CZM generates vertical profiles of both the hydrodynamic and the biogeochemical variables. Every subbasin is considered as horizontally homogenous and thus the horizontal resolution is determined by the division into subbasins. The vertical resolution is 0.5 m in the upper 4 m, then 1 m down to 70 m and then sparser [20]. The model is applied along the whole Swedish coast in approximately 630 subbasins, with water exchange between neighboring subbasins.
The CZM for Slätbaken Bay comprises 12 coupled basins and 15 sounds (represented by double-headed arrows in Figure 2). The Slätbaken Bay has a maximum depth of 47 m and a water exchange time of about 6 months, while the basin Trännofjärden, which is less enclosed, has an exchange time of only 20–30 days. The mean surface salinity in the bay is 4 practical salinity units (psu) compared to the Baltic Proper which has a mean surface salinity of 6–8 psu and a bottom salinity of 11–13 psu.
Figure 2. The CZM set-up in the St Anna archipelago, showing the Slätbaken Bay and the water exchange with surrounding basins and eventually the Baltic Proper.
Water 07 03906 g002
The CZM is coupled to S-HYPE so that is receives input of freshwater and nutrients generated from land to each grid connected to the shoreline. The daily values from HYPE are linearly interpolated to fit with the higher temporal resolution of CZM. In addition, the CZM receives input regarding the state of the Baltic Proper, which is calculated with a data-assimilated version of the PROBE-Baltic model [25]. The boundary conditions from land and the Baltic Proper are then combined with meteorological forcing (temperature, wind velocity, cloud cover, relative humidity and precipitation) at every third hour to drive the CZM model.
The CZM has been calibrated against available oceanographical data in the area, received from the SHARK database http://vattenwebb.smhi.se/, which is the national host of marine environmental monitoring data. The calibration was mostly done by studying the correlation between observed and simulated salinity, temperature and oxygen conditions since these reflect if the transports and mixing in the model are described correctly.

2.4. Model Experiment

After the calibration, the models were run for the time period 2000–2009 with consideration to various measures for nutrient reduction. The models were then used as laboratories, experimenting by changing model input while keeping all other variables constant. The model response was explored by changing one factor at a time and then with combined factors. In all, 10 different scenarios of land-based reduction measures were simulated. The measures were suggested by the local water authorities at the County Board as means to fulfil the environmental status targets of the Slätbaken Bay. Remedial measures to reduce nutrient emissions were addressing several societal sectors (Table 1).
Table 1. Scenarios of reduced nutrient contribution from land-based sources and sea concentrations, respectively, which were used in the experiment on effects on water quality in the Skälderviken Bay.
Societal SectorScenario No.Description
Waste Water Treatment Plants (WWTP)1Removal of N by 80% and maximum concentration of P by 0.2 mg/L
2Removal of N by 80% and maximum concentration of P by 0.1 mg/L
3Complete removal of the two largest WWTP by using a pipe to a nearby town with discharge to another bay
Rural households4200 rural households connected to WWTP
5All present (1882) rural households connected to WWTP
Wetlands656 constructed wetlands of 1 ha each
756 constructed wetlands of 0.5 ha each
Agriculture8Protection zones along the river wherever possible
9Reduced total load from arable land by 10% P and 20% N
Combined measures10Combination of the most efficient land-based measures in (i.e., scenario No: 3 + 5 + 6 + 8 + 9) and the BSAP targets for the Baltic Proper (−3% N and −27% P).
International agreements on measures for the Baltic Proper11Reduction in sea boundary conditions by −10% of N and P
12Reduction in sea boundary conditions by −20% of N and P
13Reduction in sea boundary conditions by −40% of N and P
14Reduction in sea boundary conditions by −80% of N and P
A combined scenario was tried, using the most efficient land-based measures for each sector, i.e., complete removal of waste water treatment plants (WWTP), connection of all rural households, 56 wetlands of 1 ha each, reduced load from agriculture, and BSAP [15] target levels for the Baltic Proper. The latter corresponds to reduced concentrations in the sea boundary conditions by −3% N and −27% P, respectively. Finally, the impact from only reducing concentrations in the boundary conditions of the sea was tested by reductions of concentrations in the Baltic Proper (i.e., scenario 11–14).

3. Results and Discussion

The modelled spatial pattern of nutrient concentrations in surface water clearly reflects the influence of land cover in the catchment and dilution by sea water in the Archipelago (Figure 3). River water from forested areas show much lower concentrations than the agricultural rivers (cf. Figure 1) and the influence of lakes as nutrient traps is significant. The more dark green areas are all found down-stream of lakes, which illustrates the low travel-times and rapid transport from land to sea from these areas. The semi-enclosed Slätbaken Bay is greatly affected by the inflow from the Söderköpingsån River, showing much higher concentrations than the nearby more open coastal basins to the right in each figure.
Figure 3. Spatial distribution of modelled surface-water concentrations of total N (a) and Total P (b) in the Söderköpingsån catchment, the Slätbaken Bay and St. Anna Archipelago (average values for all depths are shown).
Water 07 03906 g003
The coupled models thus clearly illustrates going from low concentrations in the head waters to higher concentration in agricultural and more populated lowlands, leading to high coastal concentrations, which are being rapidly decreased with distance from the shore towards the sea.

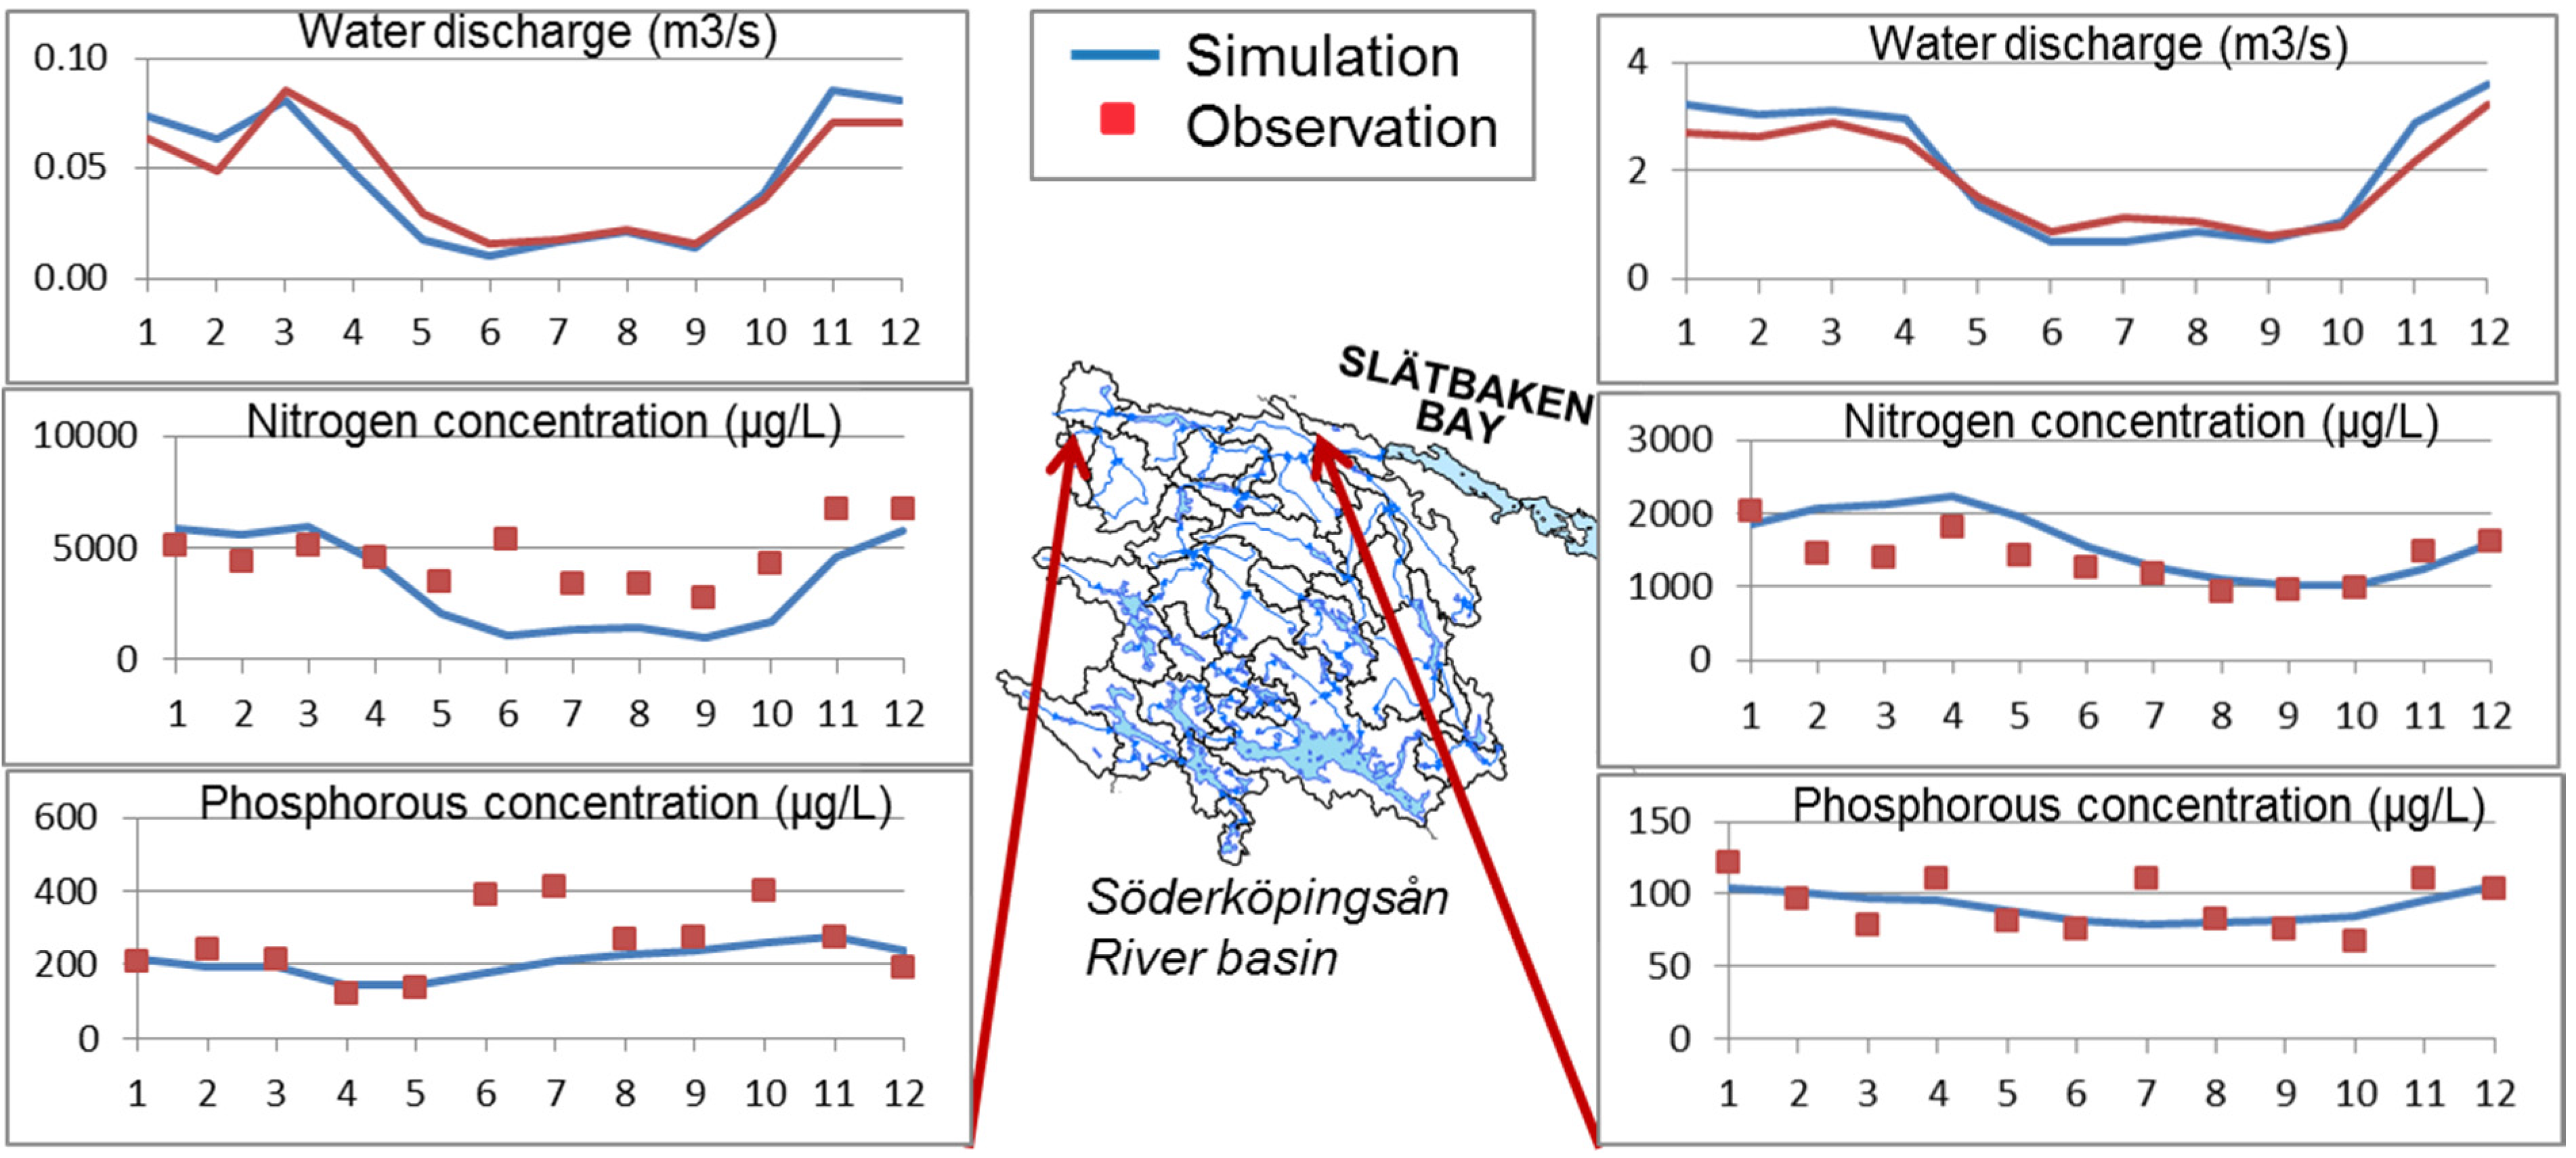
3.1. Model Performance

The model performance of water discharge in the three sites, using the HYPE model, gave an average NSE of 0.72 (best = 0.83 and poorest = 0.62). Model results for river flow and nutrient concentrations showed similar level of agreement with observations during the calibration and validation periods (Table 2). Although the same set of parameters was used in the whole catchment, the model captured the very different characteristics between the small agricultural catchment (Ryttarbacken) and the larger catchment close to the outlet with a high lake percentage (Figure 4). At all sites, however, the model underestimated the highest peaks. The simulations for N agreed better with the observations than those for P. The model underestimates the highest P peaks implying that the description of processes concerning P needs to be improved. To address these problems, the HYPE model has been further developed and the next model version includes a new process description of organic nutrient turnover, which results in particulate P also in soil water. This will give P concentrations of particulate P that are more in agreement with observations.
Table 2. HYPE model performance in the Söderköpingsån catchment (cc = correlation coefficient, re = relative error; all in %). Cal. = calibration period: 2000–2009 and Val. = validation period: 1990–1999.
Variable, Stationcc, Cal.re, Cal.cc, Val.re, Val.
Q, Hälla8589010
Q, Ryttarbacken83−879−9
Q, Söderköping91−186−10
Mean, Q860853
N, outlet Byngaren46−648−15
N, outlet Strolången62−156−2
N, inlet Hällerstadsjön45−8565
N, Söderköping5912510
Mean, N531533
P, outlet Byngaren251420−15
P, outlet Strolången32931−1
P, inlet Hällerstadsjön65−1653−4
P, Söderköping3794010
Mean, P404362
Figure 4. Daily averages of HYPE simulations vs. monthly averages of observations for water discharge, total N and P concentrations for Ryttarbacken, a small subcatchment dominated by arable land, and in Storån River, close to the outlet (1–12 in x-axis indicates the months January to December).
Water 07 03906 g004
The coastal zone model was evaluated in the surface layer in two subbasins; Slätbaken Bay and Kärrfjärden. The model performance shows a good correlation for salinity in both subbasins (Figure 5). For Slätbaken Bay, the simulations for N and P are well correlated although the highest peaks are, most prominently for P, underestimated which is a reflection of the underestimation in the modelled load from land. In the outer basin, Kärrfjärden, the simulations match observation rather well concerning the range, although the dynamics are not totally described by the CZM. However, the relative error is less in this basin. The CZM in the Archipelago is more influenced by boundary conditions from the outer sea, which are determined by using a three dimensional sea model including data assimilation. Hence, the model performance at this observation point is biased by data in the model results.
Figure 5. Daily averages of CZM simulations vs. bi-monthly observations of salinity, total N and P concentrations in the surface layer for Slätbaken Bay and Kärrfjärden (1–12 in x-axis indicates the months January to December).
Water 07 03906 g005
Overall, the model shows the same seasonal dynamic as the observations, which reflect the biogeochemical cycle in the ecosystem; phytoplankton consume nutrients during spring and summer, they grow and are grazed by zooplanktons, until they die during autumn and are decomposed to nutrients again and create the large winter storage of soluble nutrients, which is to be digested during next spring by phytoplankton growth again. This is described in the model and confirmed by observations.

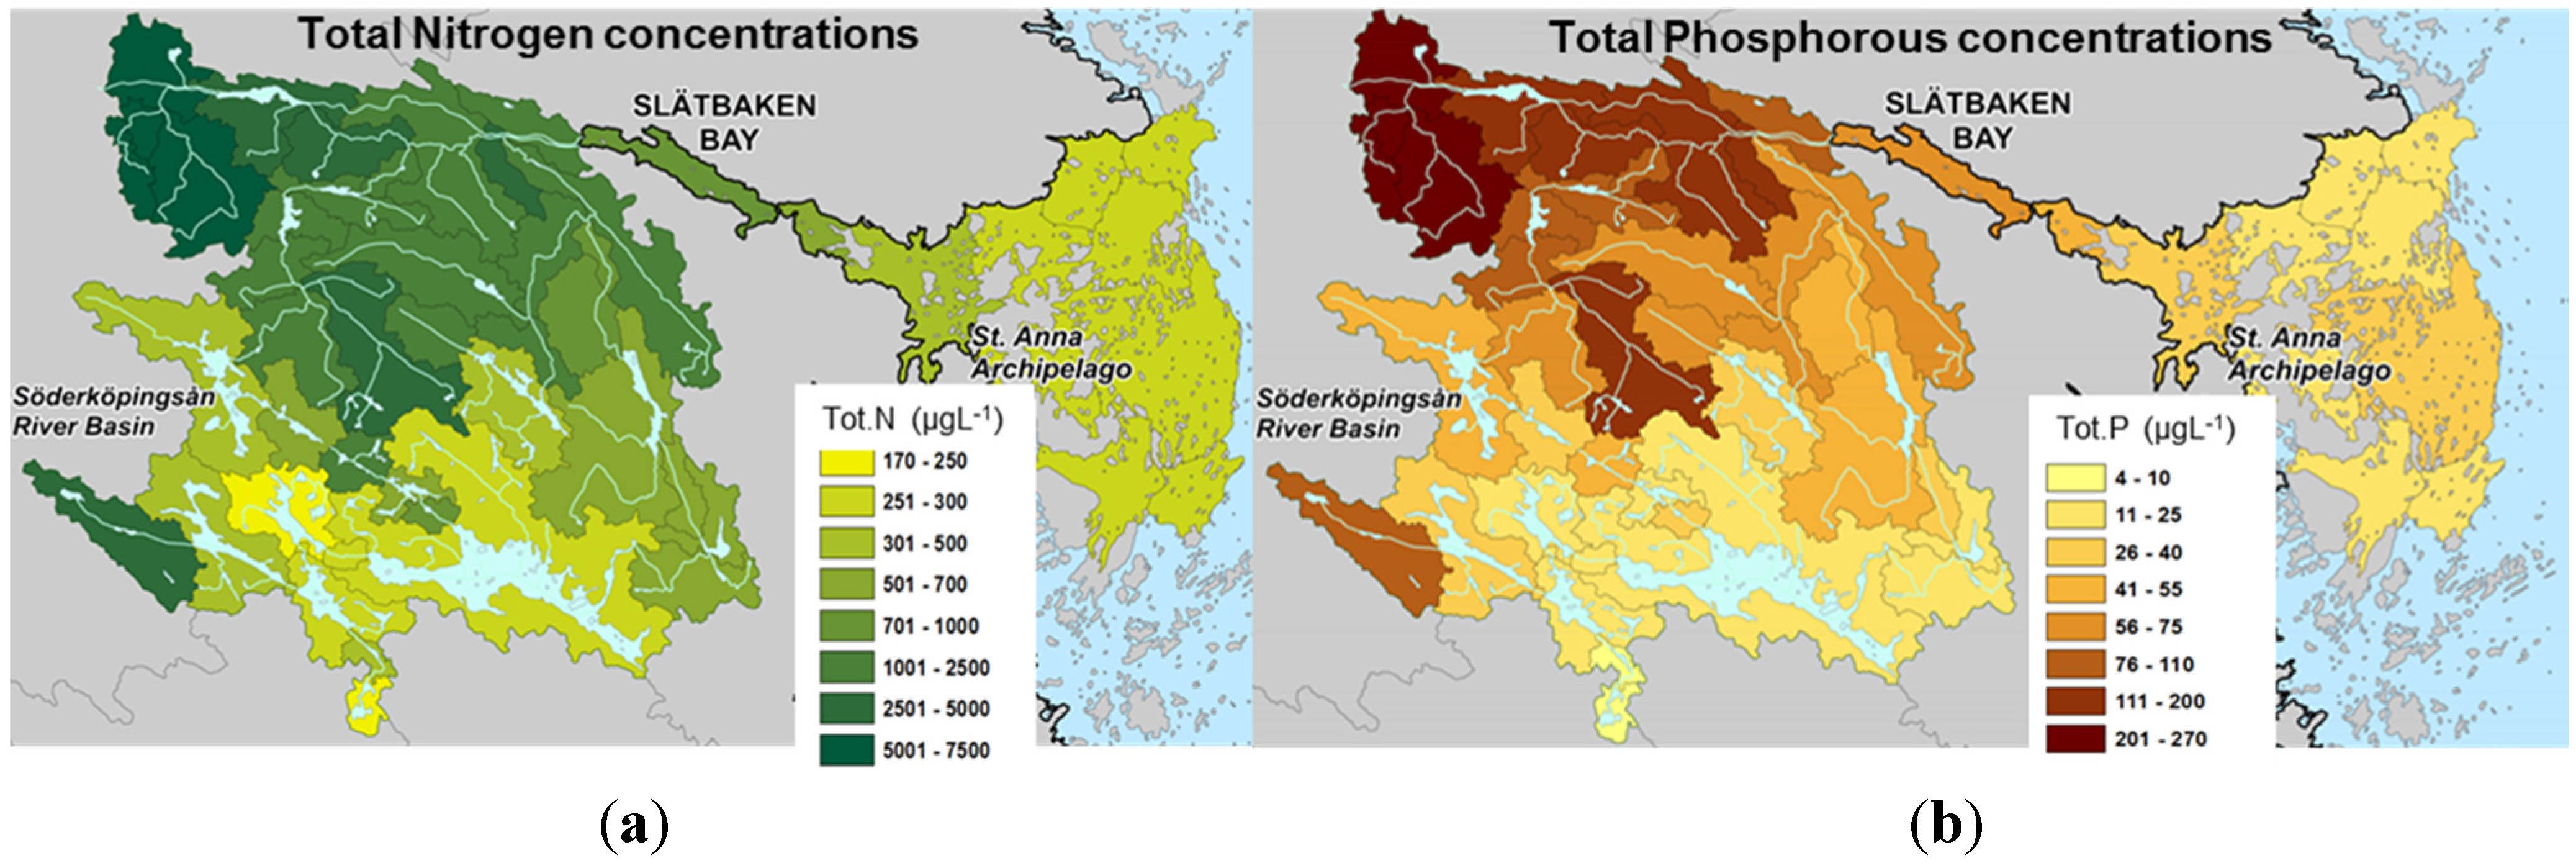
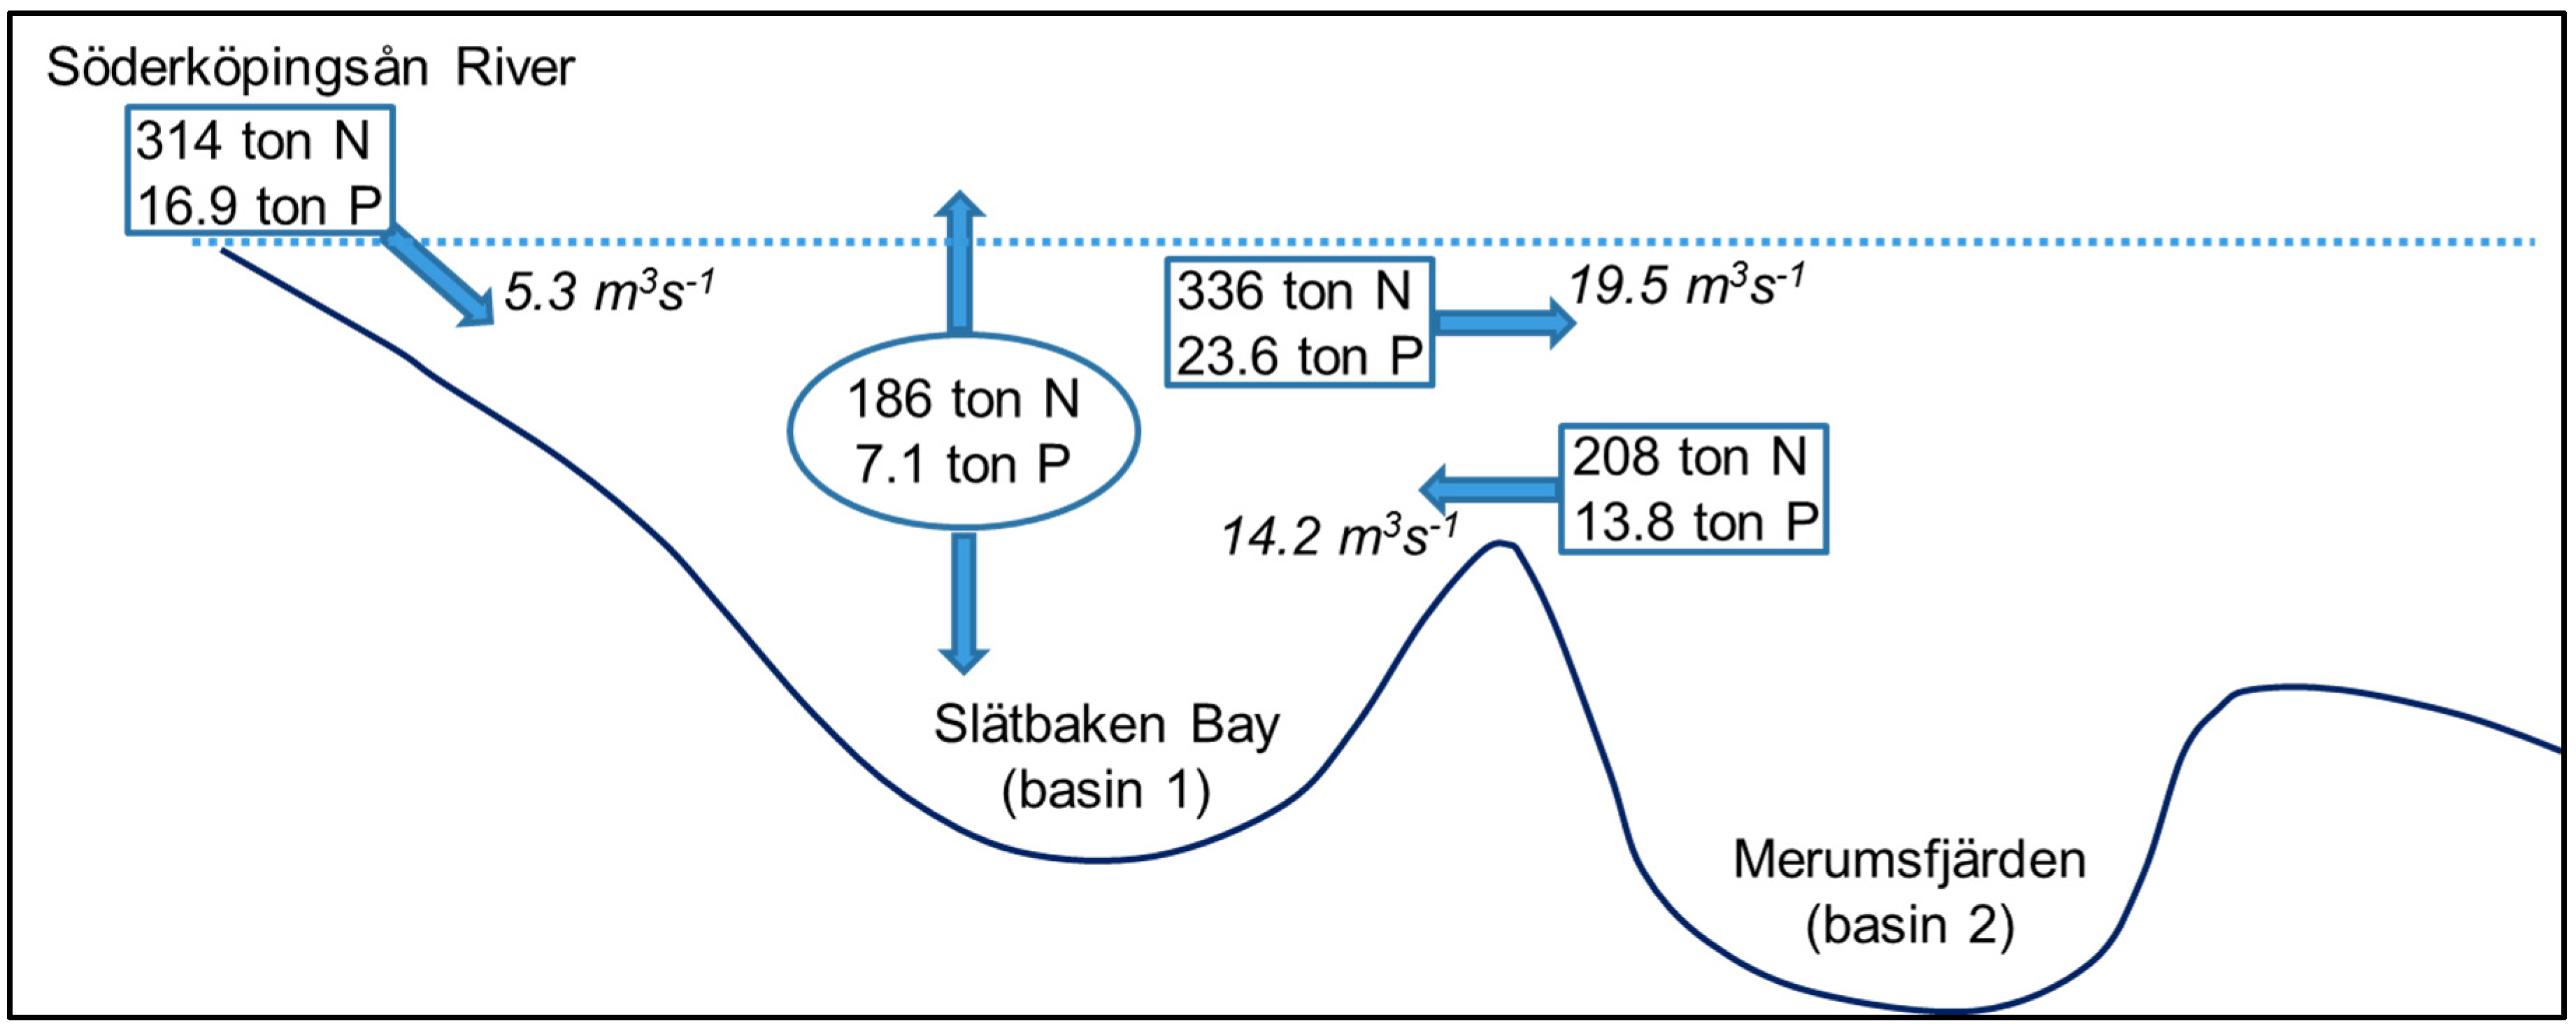
3.2. Source Apportionment and Mass Balance

Long-term mass-balance of all sources and sinks in the model are compiled along the flow paths to estimate the contribution from each sector and catchment at the river outlet. This is done by book keeping of all emissions and transformations in the model storages, assuming that equal part from all sources is transformed in each storage and time step. When knowing the rate of transformation in each sink, the origin of the load at the outlet can be traced through the flow paths upstream. Modelled contributions from various inland sources to the Slätbaken Bay indicate that 75% or more of the riverine nutrients originates from arable land in the catchment (Figure 6). Waste Water Treatment Plants (WWTP) emissions correspond to 8% of the total N and 2% of the total P river inflow to the coast.
Simulated long-term annual means in the Slätbaken Bay show that about equal nutrient contributions were received from land and sea (Figure 7). The removed amounts of nutrients refer to sedimentation processes of P and sedimentation or denitrification of N. Approximately 90% of the N removal in the Slätbaken Bay refers to denitrification and thus leaves the water as atmospheric N gas. In return, the atmospheric deposition to the water surface is about 10 tons of N/year and 0.1 tons P /year. During winter, almost no biomass remains in the water storage.
Figure 6. Long-term source apportionment for total N and total P in the Söderköpingsån River calculated with the HYPE-model.
Water 07 03906 g006
Figure 7. Long term annual means for total N and total P fluxes in the Slätbaken Bay calculated with the coastal zone model.
Water 07 03906 g007

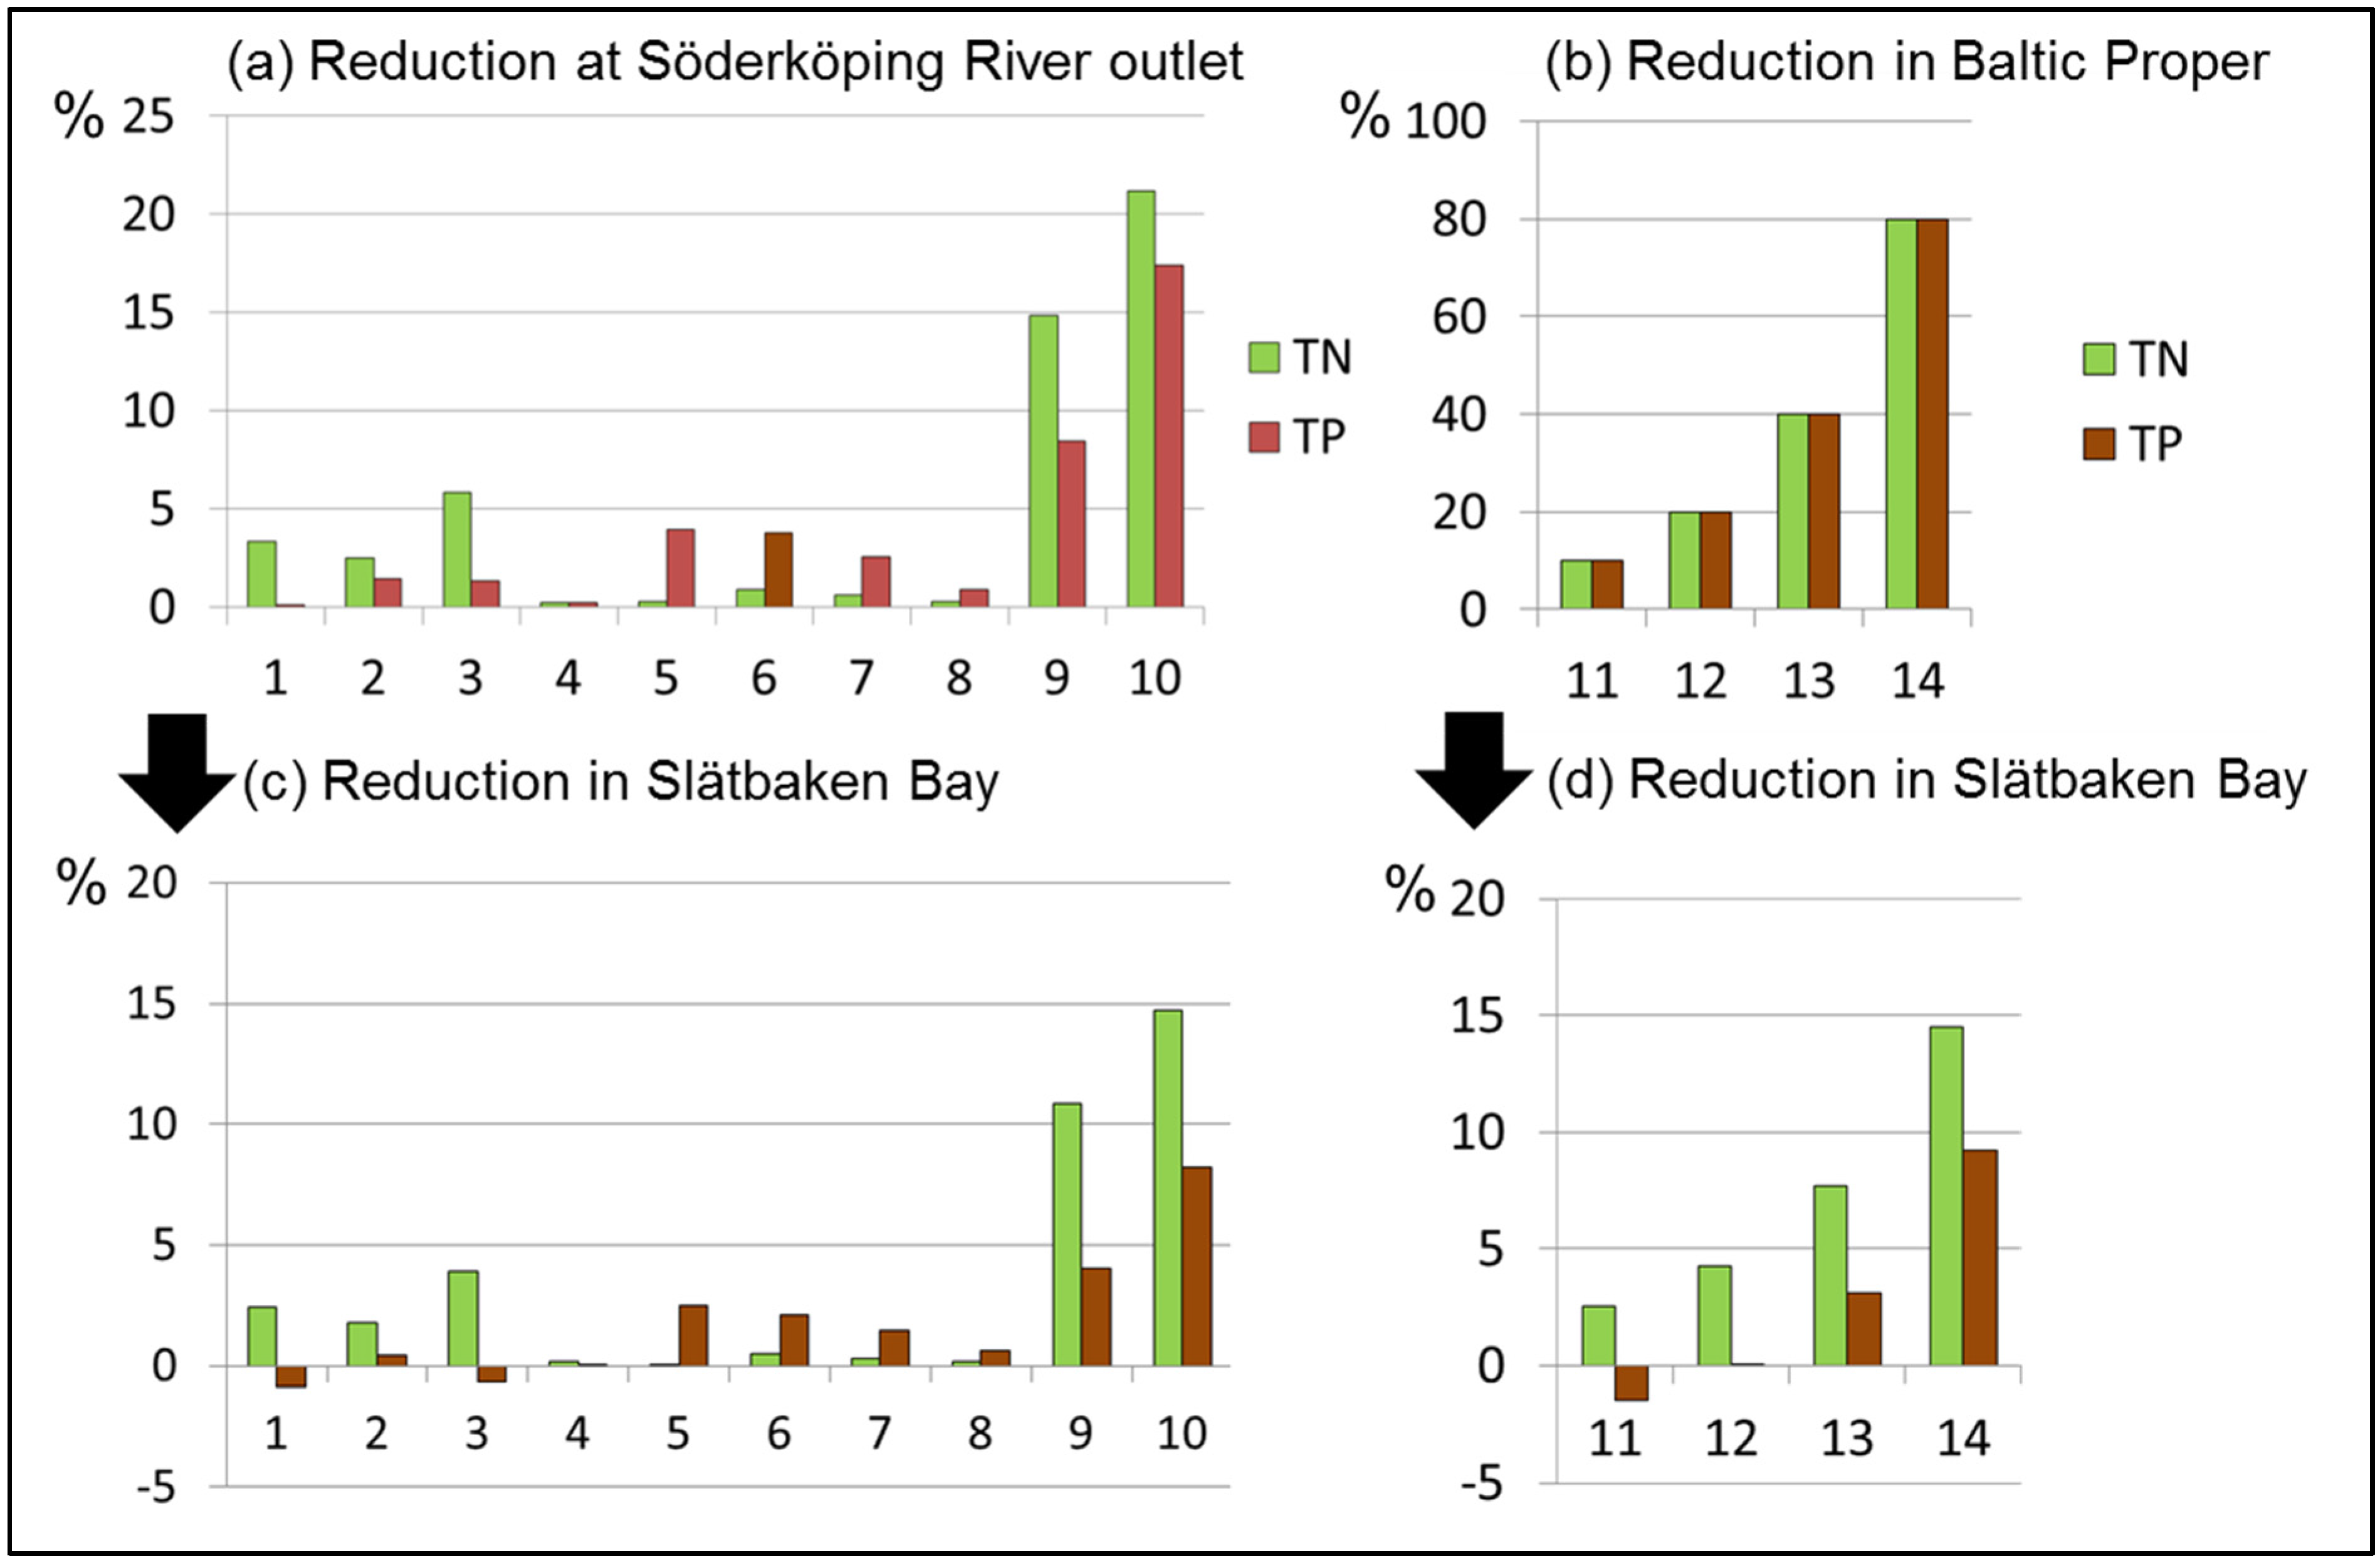
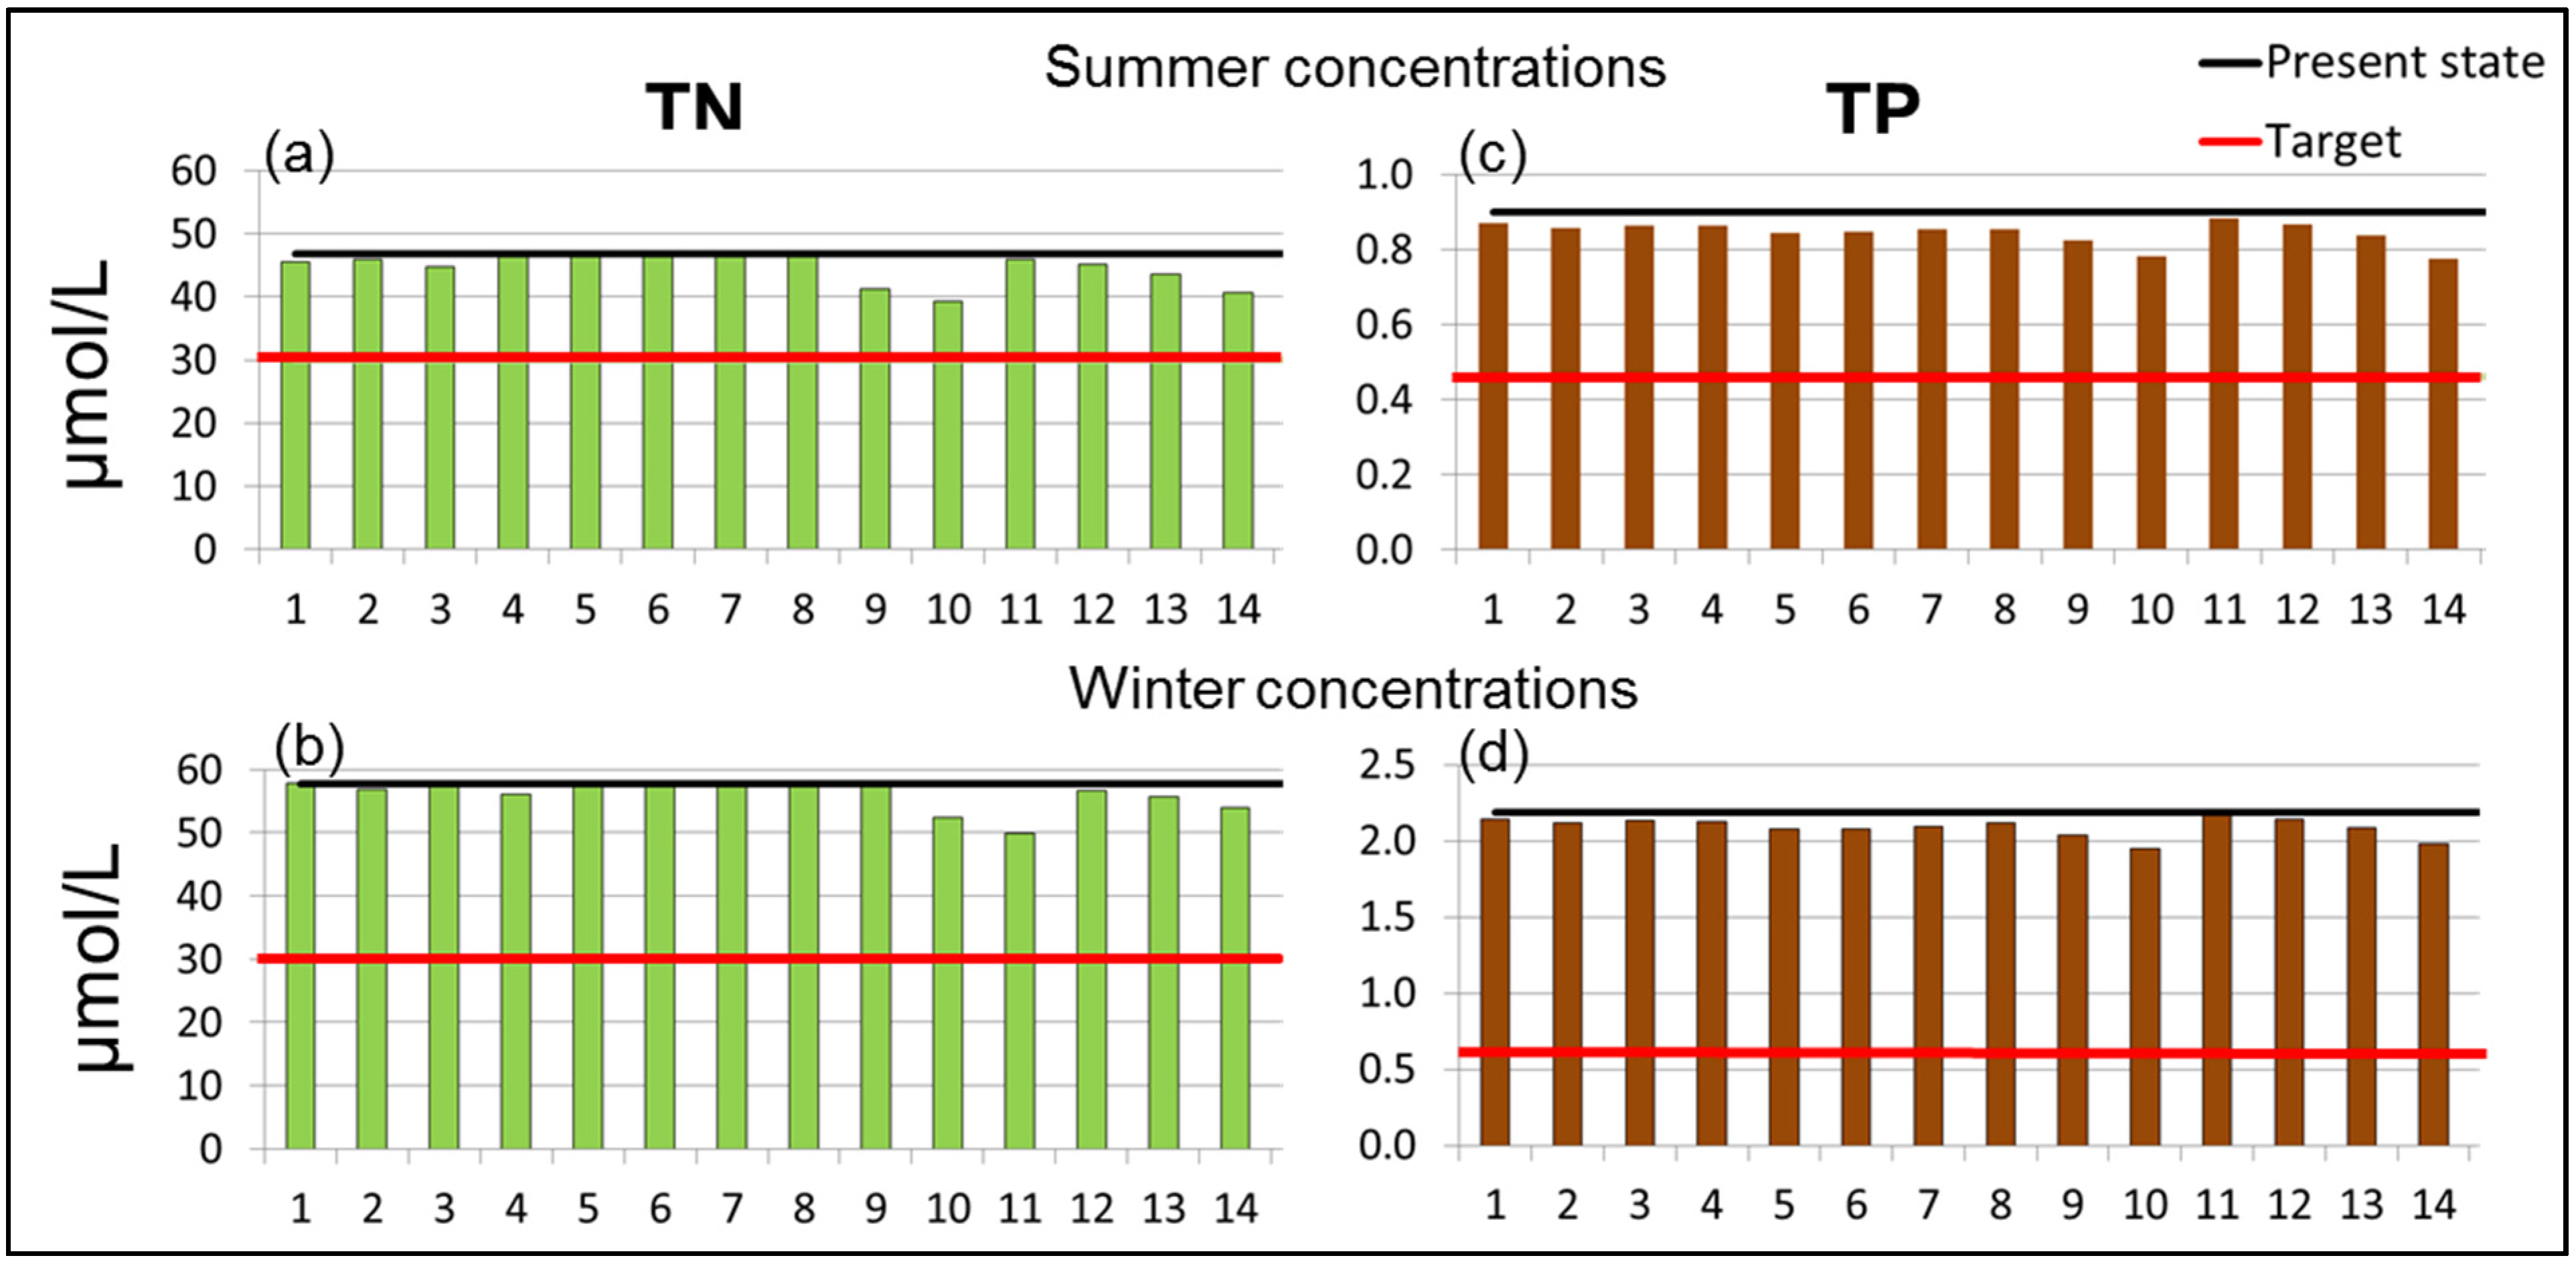
3.3. Scenario Results

The numerical experiments for reduced emissions from WWTP show that the suggested reduction levels reduced the total load by 3%–6% for N and 2% for P (bars 1–3 in Figure 8). However, reduced emissions from rural households gave higher impact on P, up to 4% (bar 5 in Figure 8). Protection zones did not give any significant impact, while reducing arable land leaching by 20% gave 15% reduction on riverine N load and 8% reduction on P load at the outlet (bar 9 in Figure 8). The lower effect at the outlet than at the sources is due to processes taking place within the river system and on the land surface, such as N denitrification in discharge areas and surface water, and sedimentation and absorption processes in bottom sediments. The combination of reductions of both WWTP emissions and arable land leaching gave the highest effect in land-based reductions and is illustrated in bar 10 in Figure 8. The resulting concentrations in the Slätbaken Bay was then reduced by 8% for P and almost 15% for N.
The corresponding reductions in Slätbaken Bay of either land-based measures or measures in the Baltic Proper were lower due to dilution and biological processes taking place within the coastal zone (lower panel of Figure 8). It was notable that 80% load reduction in the Baltic Proper sources corresponded to 15%–20% load reduction from land-based sources, to achieve about the same effect on nutrient concentrations in Slätbaken Bay. Hence, it is much more efficient to reduce the load of the river to improve the status of the Slätbaken Bay.
Figure 8. Simulated effect of various remedial measures in total nutrient load from land-based sources (a) and reduction in the Baltic Proper (b) and their corresponding effect on concentrations in the Slätbaken Bay (c) and (d). Bars correspond to Scenarios No. 1–14 in Table 1.
Water 07 03906 g008
Comparing the modelled reductions with the reduction targets set-up by the local water authorities to fulfil the WFD, it was found that no measures reached the goals, neither for N nor for P (Figure 9). The achieved effect reached only half the summer target value for the concentration of N and one fourth for the concentration of P, whereas for the winter target values, they were only reached by 1/3 for N and 1/5 for P. It should be noted that some scenarios (Nos. 1, 3 and 11) actually resulted in increased P concentrations due to a shift in the internal biogeocycling of nutrients in the Bay (Figure 8). This can happen if one nutrient is reduced more than the other so that the algae up-take is restricted or if the bottom sediments start to leach due to changes in redox potentials.
The combined scenario (No. 10) was used to explore the integrated effect of the BSAP target and the best composite of land-based actions. This resulted in about 30%–50% achievement of the desired reduction of nutrients in the Slätbaken Bay (Figure 10). The land-based measures accounted for the largest part of this reduction. The reduction was still only about 1/3 of the goal for P, although all the best land-based actions were combined. It seems unrealistic to achieve roughly three times as much reduction on the contribution from land than what is already included in the combination of best land-based actions. It can thus be questioned whether the selected local environmental goal for Slätbaken Bay is realistic and if this definition of “good ecological status” for this Bay will ever be reached.
Figure 9. The effect of remedial measures on summer and winter concentrations of total N (a, b) and total P (c, d) in the surface water of Slätbaken Bay during summer (June to August) and winter (December to February). The x-axis corresponds to scenario No. 1–14 in Table 1. Horizontal lines indicate present conditions and the target for good ecological status according to the WFD.
Water 07 03906 g009
Figure 10. The effect when combining the BSAP target for the Baltic Proper and the most efficient land-based actions as found in this study. The simulated concentrations of total N (a) and P (b) are compared to the present state and the target for good ecological status (horizontal lines) according to the WFD.
Water 07 03906 g010

3.4. Implications of Findings and Uncertainties

The numerical experiment clearly shows the importance of good decision-support before implementing remedial measures and environmental quality targets. The coupled hydro-ecological models indicate that the present targets may actually be unrealistic to be achieved for the Slätbaken Bay. It also shows that local land-based measures can be important for semi-enclosed bays. However, exact values from the experiment results should be taken with caution. All models are based on assumptions, both in the model structure itself, in input data generation, and in estimation of model coefficients, constants and parameters. For instance, Arheimer et al. [21] examined some major uncertainties when using HYPE at various scales. The most uncertain part of the catchment modelling is processes concerning soil leakage, how agricultural practices vary in time, and the assumptions on soil and sediment storages. The overall results mainly reflect the water budget of the Slätbaken Bay, for which the results are considered to be rather robust. Just analysing the mass balance of water gives a clear picture of dominating fluxes; in this case the exchange with the Baltic Proper is relatively small as there are many basins to cross with potential for denitrification and sedimentation before the water and nutrients from the sea reaches the Slätbaken Bay. Thereby, locally generated load from land will have a larger impact.
According to the experiment, local measures for the arable land gave the largest effect on nutrient reduction. Nevertheless, it should be recognised that 20% reduction of total load from the arable land may exceed the potential for reduction. A large part of the soil leaching is natural and the agriculture in the region is not very intensive. In previous studies of southern Sweden with much more intensive agricultural production, the potential reduction for the anthropogenic load from this sector was estimated to at most 15% [27,28]. It can thus be suspected that the suggested reduction of 20% by the regional authorities is too optimistic. According to HELCOM, most effort ought to be put on the agricultural sector as it is supposed to increase with the recent expansion of the European Union in the South-Eastern part of the Baltic basin. On the other hand, Humborg et al. [29], showed that an improvement of sewage treatment in these countries may compensate for the larger nutrient load from agriculture, at least as far as P is concerned.
When simulating the scenarios with reduced load from the Baltic Proper, it was not taken into account by which measures this could be achieved. Gren et al. [30] showed that a reduction in nutrient load to the Baltic Sea by 50% would bring its status back to what it was 1960 before the high increment in loads. The 80% reduction scenario thus seems unrealistic but was included to test the sensitivity of sea concentration on the semi-enclosed bay. For credibility, it is also important to recognise additional on-going changes, for instance climate change. Arheimer et al. [31] found that the BSAP targets on reductions from land-based sources may be reached in a future climate for the Baltic Proper if emissions from both agriculture and WWTP are reduced. In fact, impact from climate change may be beneficial for N reduction due to increase in denitrification by higher temperatures and longer residence times of water in the southern part of the region. However, there were large differences between the climate projections in this respect, which show the large uncertainties in climate impact assessments.
Even though there are uncertainties involved when experimenting with hydro-ecological models, it clearly shows that local analyses of mass-balance are important when improving the status of semi-enclosed bays. Although uncertain, the models are capable of separating between large and small fluxes. According to the results for the Slätbaken Bay, neither the efforts according to WFD nor the MSFD will improve the water quality as much as the local authorities wish to achieve “good ecological status”. This conclusion is probably valid in spite of model uncertainties, and can be justified by examining the mass balance and exchange between different parts of the system. The modelling should thus serve as a platform for knowledge transfer and understanding of dominant pressures for a specific site, more than providing exact numbers for planning.

3.5. On the Practical Use of Hydro-Ecological Models for Societal Needs

Water authorities are currently asking for hydro-ecological information across administrative borders e.g., [32] while most model developers claim that their models should be used in practice, also for water pollution management e.g., [33,34,35]. There is a contemporary movement in the hydrological research community to emphasise societal needs and practical applications, pointing out “Science in Practice” as one major target for the up-coming scientific decade e.g., [11,36]. However, it is not yet clear which role the scientists aim at towards societal actors, and as Pielke [37] argued, it can be as a (i) pure scientist out of decision context; (ii) science arbiter answering inquiries without interfering with the questions; (iii) issue advocate providing solutions; or (iv) honest broker trying to explain several cause-effect in relation to the broader context. The latter is probably appealing for many scientists but it is not easy to achieve as it requires good understanding of the stakeholders knowledge, setting and commission. There is a need for a common learning process, which may take long time and much efforts, before the practitioner and the scientist fully understand the vocabulary and actual needs.
For instance, the coupled model system HYPE-CZM described in this study was in an early version [38] embedded in a graphical user interface and provided to the Swedish water authorities. They were asking for a model tool to help them plan nutrient reduction measures on a catchment scale. However, although the tool fulfilled all the user requirements and regular training courses were arranged, they did not use the model as it was far too complex and slow for everyday work at the authorities. It was an expert system delivered to infrequent users in a multi-task environment. Ten years later, they received a simple web-based tool at http://vattenwebb.smhi.se/ with an emulated model for catchment analysis that is not as precise and with very little functionality. Nevertheless, it gives a rough estimate, it is easy and quick to use, and it is much appreciated. The results differ only by some 10% compared to the more complex role-model (S-HYPE). So, for practical use, a simple model was preferred and the more complex model is nowadays used only by experts to provide new data, assessments and for research.
The HYPE-CZM model system (and its earlier versions) has also been applied to facilitate dialogues and participatory processes among various stakeholders to elaborate on management plans [12,13,39]. The model then served as a platform for the establishment of a common view of present conditions and the causes behind these conditions. The benefits were found to be twofold: it increased the willingness to carry out remedies or necessary adaptations to a changing environment, and it increased the level of understanding between the various stakeholder groups and therefore ameliorated the potential for future conflicts. Compared to traditional use of model results in environmental decision-making, the experts’ role was transformed from a one-way communication of final results to assistance in the various steps of the participatory process. Hence, to use the vocabulary from Pielke [37], the scientists evolved from the role of science arbiters to honest brokers. The participatory process, however, is time- (and cost-) consuming and may thus not be feasible to implement at the large scale.
It was interesting to note that model performance, which is so much in focus in the discussions among scientists, was less important for model credibility among the stakeholders. The use of local input data was essential for confidence [40] and giving explanations for discrepancies was more convincing than the “best fit” between models and measurements [39]. Another way to improve confidence among practitioners is to present results from an ensemble of models. This is the common procedure at operational forecast institutes, where results from several models are considered before warnings of floods and droughts are issued e.g., [41,42,43]. To sum up, based on our experience, we recommend the following for practical use of hydro-ecological models when addressing societal needs:
  • Simple scenario tools (based on emulated hydro-ecological models) for rough and quick results on the web for water authorities working with WFD and MSFD;
  • Participatory modelling involving experts and stakeholders in critical conflict areas;
  • Hydro-ecological models should primarily be used for research to provide new knowledge on process interactions and dominant drivers under specific conditions, which is the basis for simplified models;
  • An ensemble of different models should be used for more reliable decision support.

4. Conclusions

This paper illustrates the societal relevance of hydro-ecological modelling as the study shows how coupled models can be used to evaluate environmental targets and improve policy making for complex systems. Two hydro-ecological models were coupled in a case study to experiment with various nutrient reduction measures and to explore the effect in a semi-enclosed Bay vs. local environmental targets set-up by water authorities. In addition, the practical use of such models was discussed based on previous experience. The study shows that:
  • For nutrient concentrations in the Slätbaken Bay, the reduction of land-based load by 15%–20% corresponded to 80% reduction of concentrations in the Baltic Proper. Local measures are thus recommended for this semi-enclosed Bay, as they have the largest potential to being implemented.
  • The best effect was achieved when combining measures for WWTP and agriculture, both locally (in the river catchment) and internationally (for the Baltic Proper). However, implementation of both the MSFD (BSAP targets) and the most efficient combined land-based actions suggested by the WFD, is not enough to achieve the locally established environmental quality targets for this bay. The present water quality targets thus seem unrealistic.
  • To overcome problems when using hydro-ecological models in practice for societal needs, we recommend the following: (i) emulate hydro-ecological models into simple scenario tools for water authorities working with WFD and MSFD; (ii) involve both experts and stakeholders in participatory modelling of critical conflict areas; (iii) use hydro-ecological models by experts only; (iv) use an ensemble of different models for more reliable decision support.

Acknowledgments

We would like to thank Jörgen Sahlberg, SMHI, for valuable insights in coastal zone modelling and Kristina Isberg for helping with GIS illustrations. We also thank two anonymous reviewers for valuable comments on the manuscript. The present work was (partially) developed within the framework of the Panta Rhei Research Initiative of the International Association of Hydrological Sciences (IAHS). The work is further a demonstration of how to apply tools from the Water Management Programme of SMHI Core Services. Data from S-HYPE and CZM can be inspected and downloaded for free at http://vattenwebb.smhi.se/.

Author Contributions

Berit Arheimer contributed with designing the experiment, putting it into a context, result compilation and analyses, figures and maps, and writing of the final manuscript. Johanna Nilsson contributed with coupled modelling using both HYPE and CZM, computational runs of the experiment, result compilation, figures and writing of results. Göran Lindström contributed with data collection, calibrating the catchment model, result compilation and commenting the manuscript.

Conflicts of Interest

The authors declare no conflict of interest.

References

  1. Meybeck, M. Riverine quality of the Anthropocene: Propositions for global space and time analysis, illustrated by the Seine River. Aquat. Sci. 2002, 64, 376–393. [Google Scholar] [CrossRef]
  2. Falkenmark, M. Water—A Reflection of Land Use: Understanding of Water Pathways and Quality Genesis. Int. J. Water Resour. Dev. 2011, 27, 13–32. [Google Scholar] [CrossRef]
  3. Vörösmarty, C.J.; McIntyre, P.B.; Gessner, M.O.; Dudgeon, D.; Prusevich, A.; Green, P.; Glidden, S.; Bunn, S.E.; Sullivan, C.A.; Reidy Liermann, C.; et al. Global threats to human water security and river biodiversity. Nature 2010, 467, 555–561. [Google Scholar] [CrossRef] [PubMed]
  4. Billen, G.; Garnier, J.; Ficht, A.; Cun, C. Modeling the response of water quality in the Seine River estuary to human activities over the last 50 years. Estuaries 2001, 24, 977–993. [Google Scholar] [CrossRef]
  5. Neal, C.; Davies, H. A summary of river water quality data collected within the Land-Ocean Interaction Study: Core data for Eastern UK rivers draining to the North Sea. Sci. Total Environ. 2000, 251, 585–665. [Google Scholar] [CrossRef]
  6. Rabalais, N.N.; Turner, R.E.; Justic, D.; Dortch, Q.; Wiseman, W.J., Jr.; Sen Gupta, B.K. Nutrient changes in the Mississippi River and system responses on the adjacent continental shelf. Estuaries 1996, 19, 386–407. [Google Scholar] [CrossRef]
  7. Humborg, C.; Conley, D.J.; Rahm, L. Silicon retention in River basins: Far reaching effects on biogeochemistry and aquatic foodwebs in coastal marine environments. Ambio 2000, 29, 45–50. [Google Scholar]
  8. Seitzinger, S.P.; Kroeze, C.; Bouwman, A.F.; Caraco, N.; Dentener, F.; Styles, R.V. Global patterns of dissolved inorganic nitrogen and particulate nitrogen inputs to coastal systems: Recent conditions and future projections. Estuaries 2002, 25, 640–665. [Google Scholar] [CrossRef]
  9. Silgram, M.; Schoumans, O.F.; Walvoort, D.J.; Anthony, S.G.; Groenendijk, P.; Strömqvist, J.; Bouraoui, F.; Arheimer, B.; Kapetanaki, M; Lo Porto, A.; et al. Subannual models for catchment management: Evaluating model performance on three European catchments. J. Environ. Monit. 2009, 11, 526–539. [Google Scholar] [CrossRef] [PubMed]
  10. Donnelly, C.; Arheimer, B.; Capell, R.; Dahné, J.; Strömqvist, J. Regional overview of nutrient load in Europe—Challenges when using a large-scale model approach, E-HYPE. In Proceedings of the H04, IAHS-IAPSO-IASPEI Assembly, Gothenburg, Sweden, 22–26 July 2013; pp. 49–58.
  11. Hipsey, M.R.; Arheimer, B. Challenges for water-quality research in the new IAHS decade on: Hydrology under societal and environmental change. In Proceedings of the H04, IAHS-IAPSO-IASPEI Assembly, Gothenburg, Sweden, 22–26 July 2013; pp. 17–30.
  12. Alkan Olsson, J.; Jonsson, A.; Andersson, L.; Arheimer, B. A model supported participatory process: A socio-legal analysis of a bottom up implementation of the EU Water Framework Directive. Int. J. Agric. Sustain. 2011, 9, 379–389. [Google Scholar]
  13. Andersson, L.; Alkan-Olsson, J.; Arheimer, B.; Johnsson, A. Use of participatory scenario modelling as platforms in stakeholder dialogues. HELP special edition. Water SA 2008, 34, 439–447. [Google Scholar]
  14. Directive 2000/60/EC of the European Parliament and of the Council of 23 October 2000 Establishing a Framework for Community Action in the Field of Water Policy (Water Framework Directive). Off. J. Eur. Commun. 2000, 43, 1–73.
  15. Helsinki Commission (HELCOM). Towards a Baltic Sea unaffected by eutrophication. In Proceedings of the HELCOM Ministerial Meeting, Krakow, Poland, 15 November 2007.
  16. Baltic Marine Environment Protection Commission. Overview of implementation of the HELCOM Baltic Sea Action Plan (BSAP). 2013. Available online: http://helcom.fi/Documents/Ministerial2013/Associated%20documents/Supporting/BSAP_Overview_with%20cover.pdf (accessed on 9 June 2015).
  17. Helsinki Commission Baltic Marine Environment Protection Commission. Approaches and Methods for Eutrophication Target Setting in the Baltic Sea Region. Baltic Sea Environment Proceedings No. 133. Available online: http://www.helcom.fi/Lists/Publications/BSEP133.pdf (accessed on 9 June 2015).
  18. Schernewski, G.; Friedland, R.; Carstens, M.; Hirt, U.; Leujak, W.; Nausch, G.; Neumann, T.; Petenati, T.; Sagert, S.; Wasmund, N.; et al. Implementation of European marine policy: New water quality targets for German Baltic waters. Mar. Policy 2015, 51, 305–321. [Google Scholar] [CrossRef]
  19. Lindström, G.; Pers, C.; Rosberg, J.; Strömqvist, J.; Arheimer, B. Development and testing of the HYPE (Hydrological Predictions for the Environment) water quality model for different spatial scales. Hydrol. Res. 2010, 41, 295–319. [Google Scholar] [CrossRef]
  20. Sahlberg, J. The Coastal Zone Model; SMHI Reports Oceanography No. 98; Swedish Meteorological and Hydrological Institute: Norrköping, Sweden, 2009. [Google Scholar]
  21. Arheimer, B.; Dahné, J.; Donnelly, C.; Lindström, G.; Strömqvist, J. Water and nutrient simulations using the HYPE model for Sweden vs. the Baltic Sea basin—Influence of input-data quality and scale. Hydrol. Res. 2012, 43, 315–329. [Google Scholar] [CrossRef]
  22. Strömqvist, J.; Arheimer, B.; Dahné, J.; Donnelly, C.; Lindström, G. Water and nutrient predictions in ungauged basins—Set-up and evaluation of a model at the national scale. Hydrol. Sci. J. 2012, 57, 229–247. [Google Scholar] [CrossRef]
  23. Nash, J.E.; Sutcliffe, J.V. River flow forecasting through conceptual models part I—A discussion of principles. J. Hydrol. 1970, 10, 282–290. [Google Scholar] [CrossRef]
  24. Svensson, U. Program for Boundary Layers in the Environment—System Description and Manual; SMHI Reports Oceanography No. 24; Swedish Meteorological and Hydrological Institute: Norrköping, Sweden, 1998. [Google Scholar]
  25. Omstedt, A.; Axel, L.B. Modelling the variations of salinity and temperature in the large Gulfs of the Baltic Sea. Cont. Shelf Res. 2003, 23, 265–294. [Google Scholar] [CrossRef]
  26. Eilola, K.; Meier, H.E.M.; Almroth, E. On the dynamics of oxygen and phosphorus and cyanobacteria in the Baltic Sea: A model study. J. Mar. Syst. 2009, 75, 163–184. [Google Scholar] [CrossRef]
  27. Arheimer, B.; Löwgren, M.; Pers, B.C.; Rosberg, J. Integrated catchment modeling for nutrient reduction: Scenarios showing impacts, potential and cost of measures. Ambio 2005, 34, 513–520. [Google Scholar] [PubMed]
  28. Arheimer, B.; Torstensson, G.; Wittgren, H.B. Landscape planning to reduce coastal eutrophication: Constructed Wetlands and Agricultural Practices. Landsc. Urban Plan. 2004, 67, 205–215. [Google Scholar] [CrossRef]
  29. Humborg, C.; Mörth, C.-M.; Sundbom, M.; Wulff, F. Riverine transport of biogenic elements to the Baltic Sea—Past and possible future perspectives. Hydrol. Earth Syst. Sci. 2007, 11, 1593–1607. [Google Scholar] [CrossRef]
  30. Gren, I.-M.; Söderqvist, T.; Wulff, F. Nutrient Reductions to the Baltic Sea: Ecology, Costs and Benefits. J. Environ. Manag. 1997, 51, 123–143. [Google Scholar] [CrossRef]
  31. Arheimer, B.; Dahné, J.; Donnelly, C. Climate change impact on riverine nutrient load and land-based remedial measures of the Baltic Sea Action Plan. Ambio 2012, 41, 600–612. [Google Scholar] [CrossRef] [PubMed]
  32. Künitzer, A. Pan-European information needs on quality of freshwater. In Understanding Freshwater Quality Problems in a Changing World; Arheimer, B., Krysanova, V., Lakshmanan, E., Meybeck, M., Stone, M., Eds.; IAHS Press: Wallingford, UK, 2013; pp. 39–48. [Google Scholar]
  33. Collins, A.L.; Strömqvist, J.; Davison, P.S.; Lord, E.I. Appraisal of phosphorus and sediment transfer in three pilot areas for the catchment sensitive farming initiative in England: Application of the prototype PSYCHIC model. Soil Use Manag. 2007, 23, 117–132. [Google Scholar] [CrossRef]
  34. Silgram, M.; Anthony, S.G.; Fawcett, L.; Stromqvist, J. Evaluating catchment-scale models for diffuse pollution policy support: Some results from the EUROHARP project. Environ. Sci. Policy 2008, 11, 153–162. [Google Scholar] [CrossRef]
  35. Crossman, J.; Whitehead, P.G.; Futter, M.N.; Jin, L.; Shahgedanova, M.; Castellazzi, M.; Wade, A.J. The interactive responses of water quality and hydrology to changes in multiple stressors, and implications for the long-term effective management of phosphorus. Sci. Total Environ. 2013, 454, 230–244. [Google Scholar] [CrossRef] [PubMed]
  36. Montanari, A.; Young, G.; Savenije, H.H.G.; Hughes, D.; Wagener, T.; Ren, L.L.; Koutsoyiannis, D.; Cudennec, C.; Grimaldi, S.; Bloschl, G.; et al. “Panta Rhei—Everything Flows”: Change in hydrology and society—The IAHS Scientific Decade 2013–2022. Hydrol. Sci. J. 2013, 58, 1256–1275. [Google Scholar] [CrossRef]
  37. Pielke, R.A., Jr. The Honest Broker: Making Sense of Science in Policy and Politics; Cambridge University Press: Cambridge, UK, 2007. [Google Scholar]
  38. Marmefelt, E.; Arheimer, B.; Langner, J. An integrated biogeochemical model system for the Baltic Sea. Hydrobiologia 1999, 393, 45–56. [Google Scholar] [CrossRef]
  39. Andersson, L.; Arheimer, B.; Gustafsson, D.; Lexén, K.; Glaumann, K. Potentials for numerical models in water management—Recommendations for local water management with stakeholder involvement. VATTEN J. Water Manag. Res. 2013, 69, 163–171. [Google Scholar]
  40. Arheimer, B.; Andersson, L.; Alkan-Olsson, J.; Jonsson, A. Using catchment models for establishment of measure plans according to the WFD. Water Sci. Technol. 2007, 56, 21–28. [Google Scholar] [CrossRef] [PubMed]
  41. Cloke, H.L.; Pappenberger, F. Ensemble flood forecasting: A review. J. Hydrol. 2009, 375, 613–626. [Google Scholar] [CrossRef]
  42. Arheimer, B.; Lindström, G.; Olsson, J. A systematic review of sensitivities in the Swedish flood-forecasting system. Atmos. Res. 2011, 100, 275–284. [Google Scholar] [CrossRef]
  43. Pechlivanidis, I.G.; Bosshard, T.; Spångmyr, H.; Lindström, G.; Gustafsson, G.; Arheimer, B. Uncertainty in the Swedish Operational Hydrological Forecasting Systems. In Proeedings of the Second International Conference on Vulnerability and Risk Analysis and Management (ICVRAM2014), University of Liverpool, Liverpool, UK, 13–16 July 2014.

