Article

Optimizing Dredge-and-Dump Activities for River Navigability Using a Hydro-Morphodynamic Model

1
HKV Consultants, Lelystad 8232, The Netherlands
2
Department of Civil, Chemical, Environmental and Materials Engineering (DICAM), University of Bologna, Bologna 40136, Italy
3
National Institute for Water (INA), Ezeiza, Buenos Aires 1804, Argentina
*
Author to whom correspondence should be addressed.
Water 2015, 7(7), 3943-3962; https://doi.org/10.3390/w7073943
Submission received: 9 May 2015 / Revised: 29 June 2015 / Accepted: 8 July 2015 / Published: 17 July 2015

Abstract

:
Worldwide, significant dredging activities of riverbed sediment are employed to ensure that freight transportation on rivers can continue year-round. Imbalances of sediment budget may produce relevant impacts regarding river morphology and related environmental services. This study shows that hydro-morphodynamic modeling tools can be used to optimize dredge-and-dump activities and, at the same time, mitigate problems deriving from these activities in rivers. As a case study, we focused on dredging activities on the Lower Parana River, Argentina. Navigation on this river is of crucial importance to the economies of the bordering countries, hence, each year significant dredging activities are employed. To estimate dredging loads under different strategies, a 25 km river reach of the Parana River was modeled using the Delft3D-modelling suite by Deltares. The Netherlands, to simulate flow-sediment interactions in a quasi-steady and uncoupled approach. Impacts of dredging activities were explicitly included. Different dredge-and-dump strategies included variations in dredging over-depth (clearance) and variations in dumping locations. Our results indicate that dredge-and-dump strategies can be targeted to stimulate natural processes that improve the depth and stability of the navigation channel and to counteract unwanted bed level responses in the long-medium term. A ~40% reduction in dredging effort could be achieved by moving the dredged material to distant locations in the secondary channel rather than dumping to the side of the waterway in the main channel.

1. Introduction

All around the world, rivers are intensively used for transportation purposes and, thereby, play a vital role in the local and international economies for the population and countries along the rivers. With increasing demands for transport efficiency and reliability, vessels and fleets have generally become larger, and rivers have been adapted to allow more and safer river navigation. One such measure to enhance river traffic is by (repetitive) dredging of a navigation channel, by which a certain minimal width and depth for safe vessel passage is guaranteed. Water borne trade increased over 5 × 10⁶ tons within the period 1970–2009 [1]. In response to the growing demand of transport, dredgers constantly work to improve and deepen existing ports and canals.
Such dredging efforts have been carried out for many decades on various rivers around the world. Worldwide commerce can be affected if river channels are not maintained. More than 200 × 106 tons of cargo is shipped via the Mississippi River each year. A year-round dredging effort is combined with an extensive system of hydraulic structures (levees, spillways and locks) for the maintenance of existing channels of the Mississippi River that would naturally divert into the Atchafalaya basin [2]. The principal purpose of dredging in the Waal River (The Netherlands) is to maintain its channel navigability. The average dredging effort per year is in the order of 400 × 103 m3 and it is subject to increase because of recent changes in the river system [3]. Furthermore, towns and farmland may be threatened by not constantly maintaining river channel systems. For example, an intense dredging activity was carried out in the Gorai river (Bangladesh) to ensure that the major spill channel of the River Ganges does not dry up, thus threatening the water supply in the region [4].
Despite the high costs, hindrance to navigation and environmental side-effects associated with dredging activities, repetitive dredging remains a commonly used approach to support continuation and further development of river traffic as a transportation mode. This is also the case for the Parana River in South America, where an ambitious international collaboration “Hidrovia Parana-Paraguay” (set up in 1997) aims at boosting the shipping capabilities on the Parana and Paraguay Rivers. The Parana-Paraguay waterway links the ocean to Asunción and Iguazu, at the border of Argentina with Paraguay and Brazil (Figure 1a,b). Fluvial trading in the downstream part of this system, from Buenos Aires to Santa Fe, has increased continuously over the last 10 years, from approximately 4100 to 5100 vessels of mostly bulk cargo, tanks and containers [5]. The Parana River is navigable for most of its route in Argentina, but low water-depth sections (“paso(s)” in Spanish) drastically reduce the admitted vessel draft. The cost effectiveness of freight transportation by means of the Parana waterway depends mainly on the expected water depth and consequent admitted vessel draft. Guerrero et al. [6,7] also recognized the effect of climate change on modifying the dredging cost to maintain the navigation channel at the actual capacity of the Parana waterway.
Dredging activities may produce significant environmental impacts because of the re-suspension of sediment and toxic substance that is especially the case of dredged materials from harbors and ports [8,9] where the settled sediment at the bed is heavily contaminated. To this regard, the most of national and international conventions that govern the disposal of dredged material limit or ban disposal at sea, whereas the traditional dredging techniques, such as trailing and cutter suction, excavate material to be transported in the hold of a ship or exported via a pipeline to the final disposal plant. Differently, in case of rivers waterway maintenance, dredging activities imply dumping in the river channel by directly pumping the excavated material to the sides of the river. Indeed, in this case, national legislations, aiming to alter as little as possible the river processes and the related morphology, may require to maintain sediment within the river channel. For example, this is the case of the Po River in Italy, where sediment mining from the river channel implied a relevant degradation of the riverbed since the 1960s [10]. Sediment augmentation [11] is even more economically relevant; it is being performed in the German part of the Rhine and it is under consideration in the Netherlands near the German-Dutch border on the Rhine to counteract continuous riverbed degradation. Therefore, for rivers, optimal procedures of dredging and dumping have to be investigated to meet different objectives such as in river functions (e.g., navigation), river restoration, and medium long-term channels morphology preservation.
The current study aims to contribute in mitigating problems deriving from dredging activities in rivers. The proposed method consists of the use of a numerical modeling tool to predict the river channel morphology in the medium-long term that is differently activated depending on the simulated dredging and dumping strategies. We specifically addressed the issue of river morphodynamics management in the medium–long term that is typically related to the most frequent hydrological conditions (i.e., the dominant discharge and the related variability) rather than to peak events [12]. Repeated dredging and dumping activities carried out during most frequent hydrological conditions may couple with natural processes in the medium-long term. These accumulate along years eventually modifying the mean sediment budget and the resulting morphology. Although the dredging response to a single peak may be of relevant intensity, it poorly affects the cumulative balance in the long-term because of short periods characterizing peak events. This is particularly true for large river systems where the watershed extension contributes in lowering peak intensity and frequency with respect to yearly averaged values. For example, flooding events rarely overcome two times the mean discharge in the 4.1 × 10⁶-km2-wide la Plata Basin (i.e., the Parana River watershed, Figure 1a).
In this paper, we set up and applied a morphodynamic computational model in a quasi-steady un-coupled approach that allowed exploration of efficiency of different dredging strategies in the medium–long term (i.e., years). Guerrero et al. [13] have set-up a hydro-morphodynamic of the Parana, which we used as a basis in this study. However, we included several important novelties; first, we considered the influence of using a detailed discharge-hydrograph, as opposed to using yearly-averaged river discharges only. Secondly, the dredging activities were explicitly integrated in the computational simulations, and therefore allowing continuous interaction between flow, bed response, and dredging and dumping activities. Finally, we investigated the impact on total dredging loads between different dredge-and-dump-strategies, and concluded that significant benefits are achievable when optimizing these strategies.
Figure 1. (a) The Parana River in the context of “La Plata Basin” watershed; (b) The Parana River and its waterway and (c) an overview of the study section between and San Martin and Rosario.
Water 07 03943 g001

2. Materials and Methods
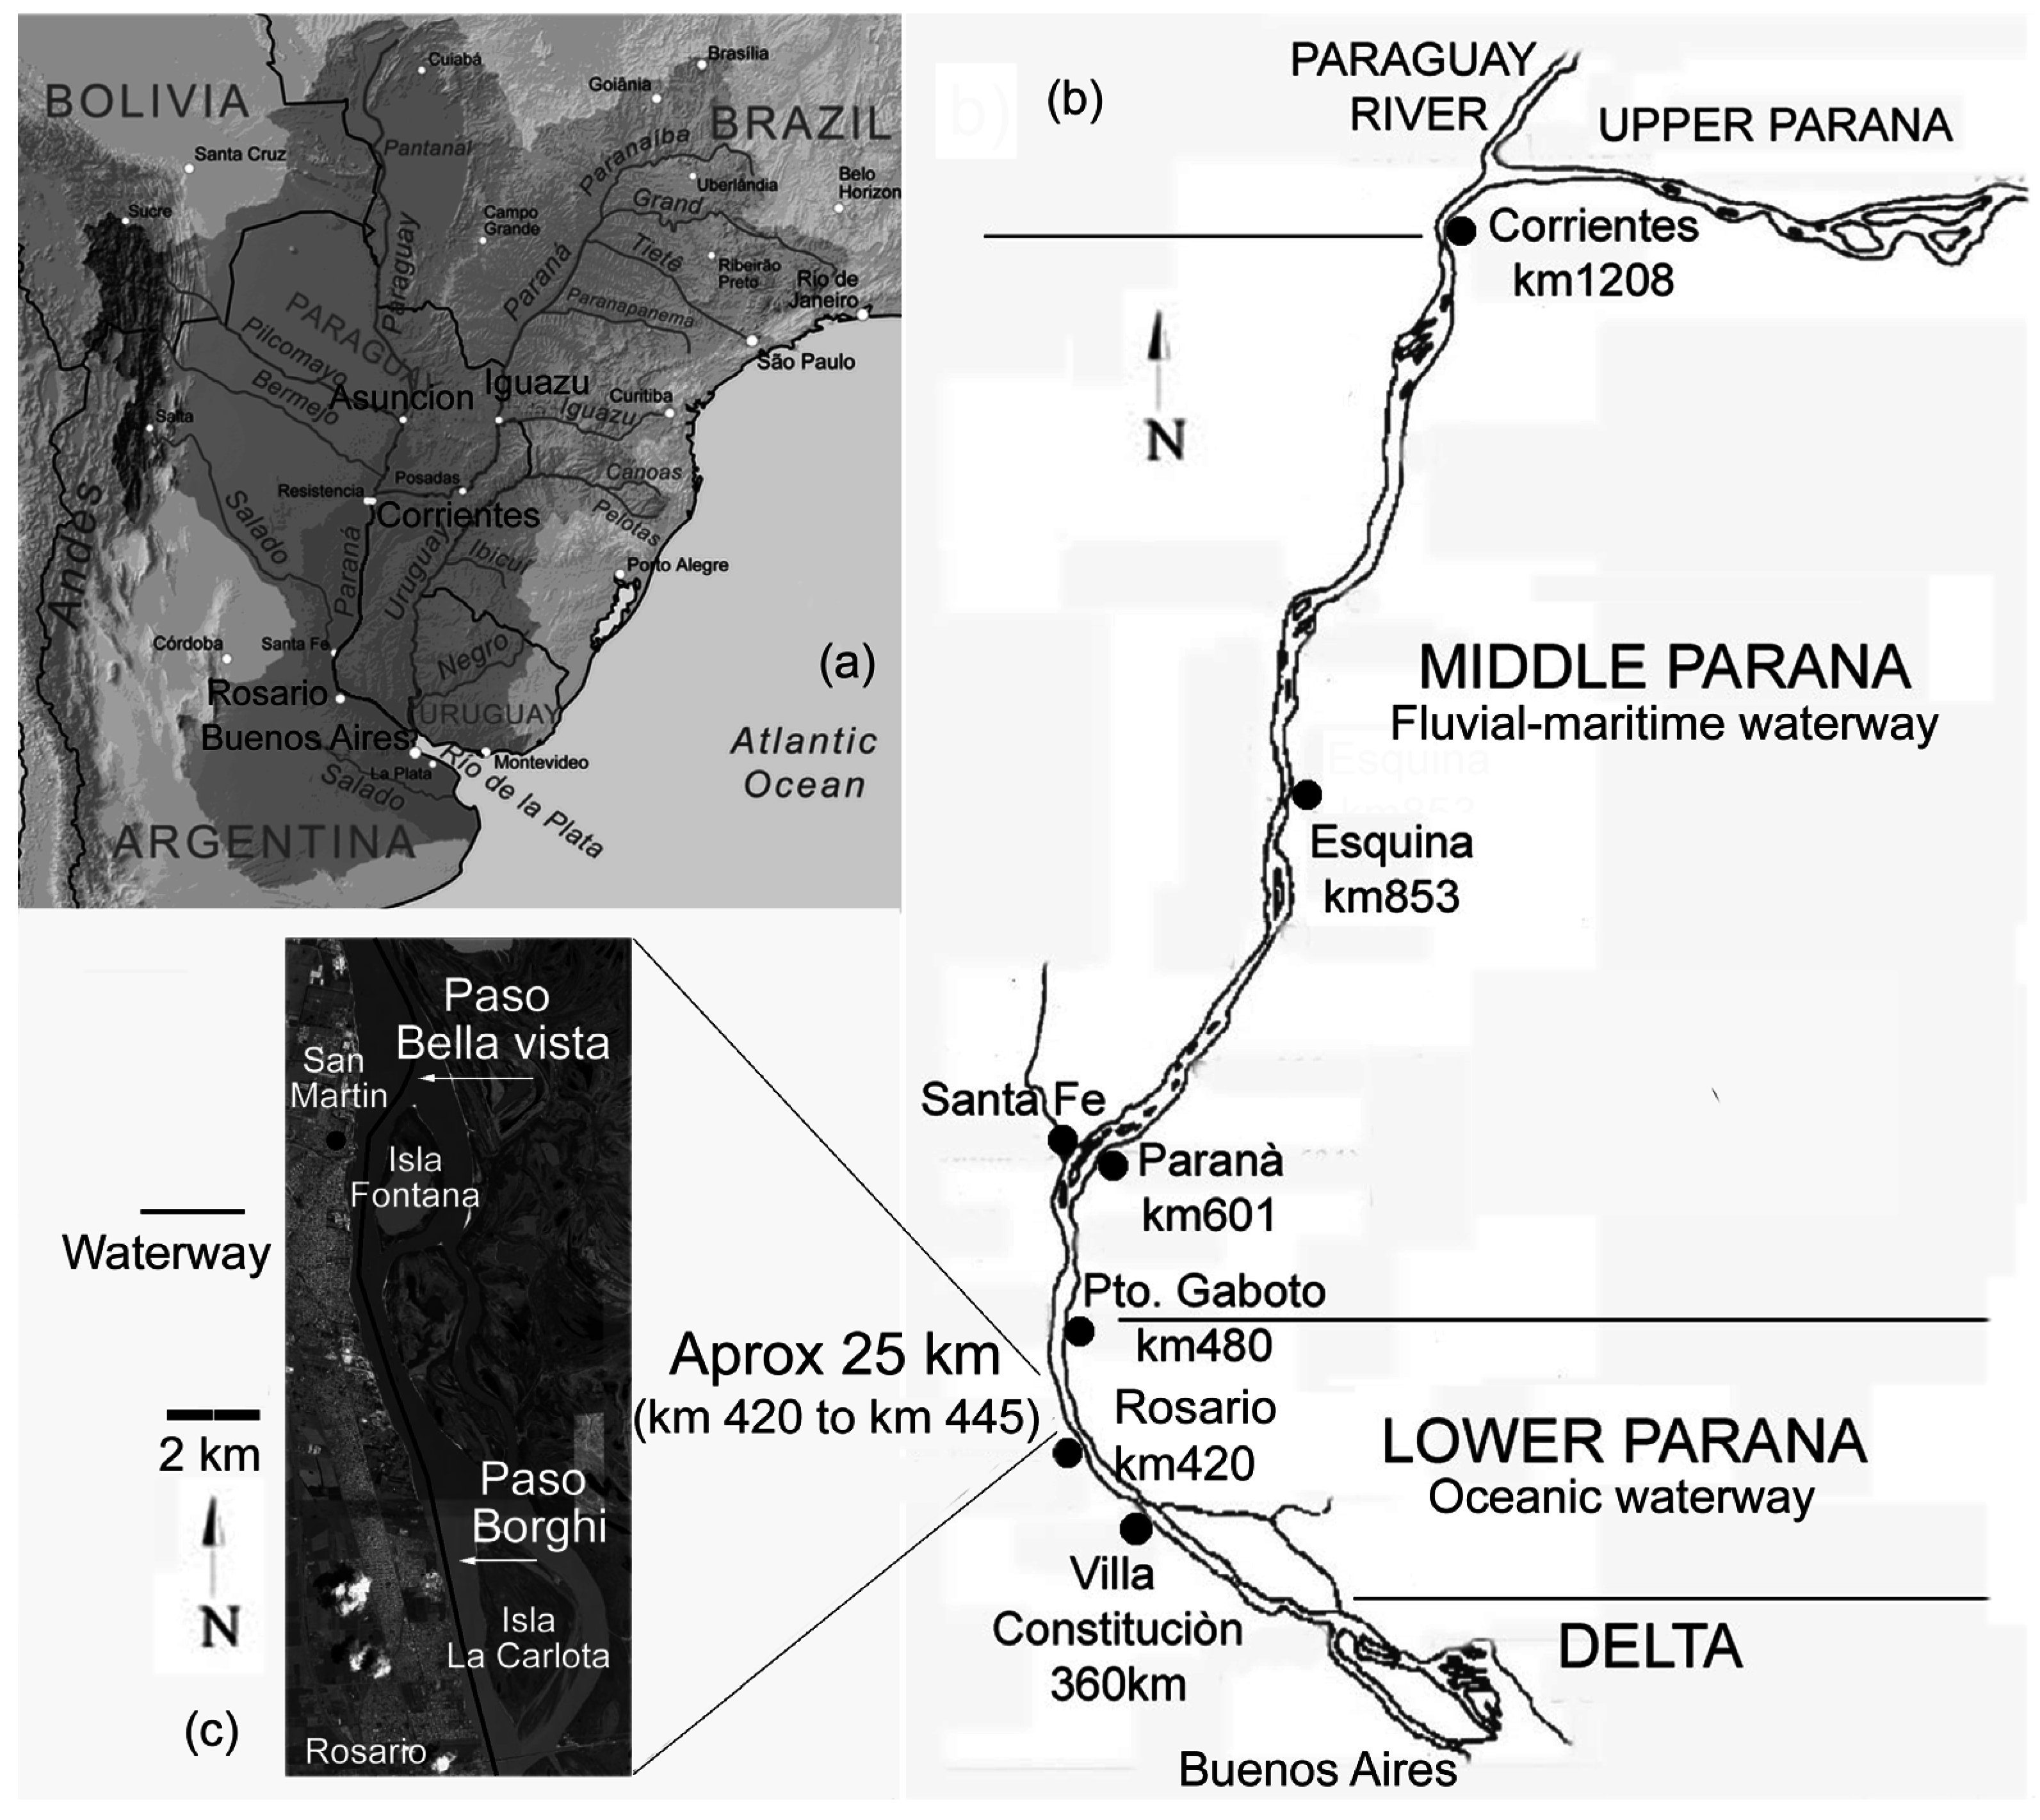
2.1. Study Area

The study area is a 25 km river section, roughly between Rosario and San Martin (Figure 1c), which consists of a main channel and several secondary channels. Figure 1c gives an overview of the study area, also showing two critically shallow pasos in this part of the Parana River: Paso Bella Vista and Paso Borghi. Average dredging loads at these locations are approximately 450,000 m3/year for Paso Borghi and nearly 600,000 m3/year for Paso Bella Vista (derived from Figure 2.6 in [14]). For the main portion of the Parana waterway, i.e., the Oceanic and Fluvial-Maritime channels from Rio de la Plata (Buenos Aires) at the ocean inlet to Santa Fe (Argentina), the volume of dredged sediment is approximately 25 × 106 m3/year [15].
Typical grain sizes of sediment forming the river bed are homogeneously distributed within the range of 0.1 mm–1 mm, with average distribution among the Middle-Lower Parana characterized by grain diameters D84 = 0.4 mm, D50 = 0.3 mm and D16 = 0.2 mm [16,17]. Bed sediment downstream refines to median diameter of 0.25 mm in the study reach of the Lower Parana. Migrating dunes were observed in this reach with 3.5 m mean height and 100 m mean length [18,19].
From Corrientes to the river delta, the mean annual discharge is approximately 12,000–15,000 m3/s [12,20], with increasing values observed since the last part of the twentieth century.

2.2. Hydrodynamic and Morphodynamic Model Settings

We applied the Delft3D-modelling suite [21] to estimate dredging volumes for different dredging and dumping strategies. The flow is simulated in a horizontal plane (2-DH) and sediment transport is computed by the Engelund and Hansen [22] formula. Following the modeling approach as presented in Guerrero et al. [13], we used the single fraction total-load formula by Engelund and Hansen, with 0.26 mm grain size to represent sediment from the river bed and a calibration factor of 0.2. This factor matches the average observed sand concentration loads of 6 mg/L at a discharge of about 14,300 m3/s [23].We used a constant bed roughness value throughout the modeling domain of Manning equal to 0.03, corresponding to a Gaukler-Strickler value of 33. At the downstream boundary of the model, we imposed a stage-discharge relationship based on local water level measurements and discharges measured at station Chapeton (taken from Hydrological Integrated Data Base BDHI from the National Subsecretary of Water Resources, Argentina).
To be able to calculate dredging loads over meaningful time-frames, bed level changes in the river should be simulated for a period of at least several years. However, using a 2-dimensional morphodynamic flow model for such long periods would lead to long-running and costly computations. Instead, a Morphological Acceleration Factor (MF) was used that enables upscaling of calculated results, allowing much shorter computation times. This implied an uncoupled approach: bed level effects after each hydrodynamic time step are multiplied by the MF to estimate the bed effects on longer (morphological) time scales.
The topography of the river reach was represented in detail on a numerical curvilinear grid with cells of approximately 30 m length, dx, and the hydrodynamic time step, dt, was consequently set to 15 s. This time step was fixed to limit the Courant number value (21, CN in Equation (1)) for the expected maximum water depth, h, of about 15 m–20 m:
C N = g h · d t d x 10
For the morphological time scale, in Ranasinghe et al. [24] a criterion is given to estimate the maximum acceptable MF, which is based on a modified Courant-Friedrich-Levy criterion as reported in Equation (2):
M F = 0.05 C b · d x d t
where Cb is the propagation speed in m/s of morphological features such as bars, channels and islands. As an estimate of the maximum MF for the Parana River we assumed a Cb of 0.1 m/day (i.e., 1 × 10⁻⁶ m/s), that corresponds to the observed maximum celerity of the developing bars from repeated bathymetric surveys during the wet month [13]. This resulted in a maximum acceptable MF value of 86,400; in this study we applied a morphological acceleration factor of 1440 which is well below the maximum allowable MF. It corresponds to a six hour morphological time step (i.e., 1440 × 15 s) for the morphodynamics simulation enabling a detailed representation of dredging and dumping operations.
Sediment transport loads, bed level responses, and the need for dredging activities are strongly dependent on flow conditions in the river. Aiming to assist sediment management, a six-year long period from 2004 to 2009 was simulated that was long enough to test the effectiveness in terms of cumulated dredged-volume of different dredging-dumping strategies. At the same time, this period presented appreciable morphological changes of the modeled river reach: overall deepening and shallowing by approximately 1 m were observed in the main and secondary channels, respectively.
The mean of daily discharges in the period 2004–2009 is approximately 18,500 m3/s that reduces to 15,900 m3/s, when considering yearly-averaged values. By considering the entire twentieth century, the yearly average discharges were assessed by means of a precipitation-river runoff model [25,26] with an overall average of 14,000–15,000 m3/s [6]. These yearly values presented a pretty large variability with values lower than the average grouped mostly in the mid-century. The hydrological conditions in the simulated period from 2004 to 2009, reflect the precipitation and discharge increase observed in the last part of the twentieth century and lasting in the first decade of this century.
To be able to reduce computation time for this six-year time-series using the MF, a quasi-steady approach was applied: the discharge time-series was discretized into a limited number of discharge levels. For each of these discrete discharge levels initial flow conditions are available in the entire flow domain, which are re-used (and updated) each time that the particular discharge level appears in the time-series (after e.g., [27,28]). In Figure 2a the daily discharge for station Chapeton is shown (“daily Q”) for the period 2004–2009. From this daily time-series two discretized, or “stepped”, series were derived. First, “yearly Q” gave the yearly-averaged discharge per calendar year. Second, the series “stepped 10-day Q” was derived by smoothing the daily discharge series by taking 10-day averages and then discretizing the smoothed series to five distinct discharge levels. We chose these five discharge levels to best represent the actual range of discharge values that occurred during 2004–2009. The maximum discharge level in the “stepped 10-day Q” was chosen at the 95%-level where the floodplains of the Parana River are just starting to inundate (Q = 20,955 m3/s). Peak values missed, were assumed to poorly affect the river channel morphology because of their short duration and the flow reduction in the river channel corresponding to floodplains inundation. This assumption is consistent with the aim of assisting sediment management in the medium–long term that is mostly affected by frequent hydrological conditions (i.e., the dominant discharge and the related variability) rather than by a single peak event. The lower discharge level was set at the 5% level, where still dredging activities can take place. Overall, the derived series “stepped 10-day Q” covers a range of discharges that captures 90% of the range that occurred over the period 2004–2009. The remaining three of the five discharge levels in “stepped 10-day Q” correspond to 20, 52 and 80 percentile values of the 2004–2009 discharge distribution. The middle discharge-level (52 percentile) was chosen such that in the series “stepped 10-day Q” the overall volume of water over the entire period 2004–2009 is kept the same as in the “daily Q” series (Total volume = 3.018 × 10¹² m3). Figure 2b shows the cumulative distribution of discharge occurring in the period 2004–2009 together with the stepped discharge levels that were used to construct the series “stepped 10-day Q”.
Figure 2. 2004–2009 discharges at the Parana River (station Chapeton): (a) discharge time series and (b) cumulative distribution.
Water 07 03943 g002

2.3. Dredge and Dump Strategies

Within the main channel a navigation channel (Figure 1c and Figure 3) is maintained that should remain at least 10 m deep at all times [29]. The navigation channel is 116 m wide on the bed and has side slopes of 1:5. Assuming that on average the channel is approximately 1 m deeper than surrounding bed elevation means that the upper width of the dredged channel is around 126 m. In our simulation we assumed a dredged navigation channel with vertical walls having channel width of 121 m.
On the Parana River, it is common practice to dump the dredged material to the side of the dredging location. This was the reference dump strategy in our modelling study. Together with two alternative approaches the investigated dump strategies were:
  • Du0—dump to the side (reference strategy);
  • Du1—dump at least 0.5 km downstream (to the side);
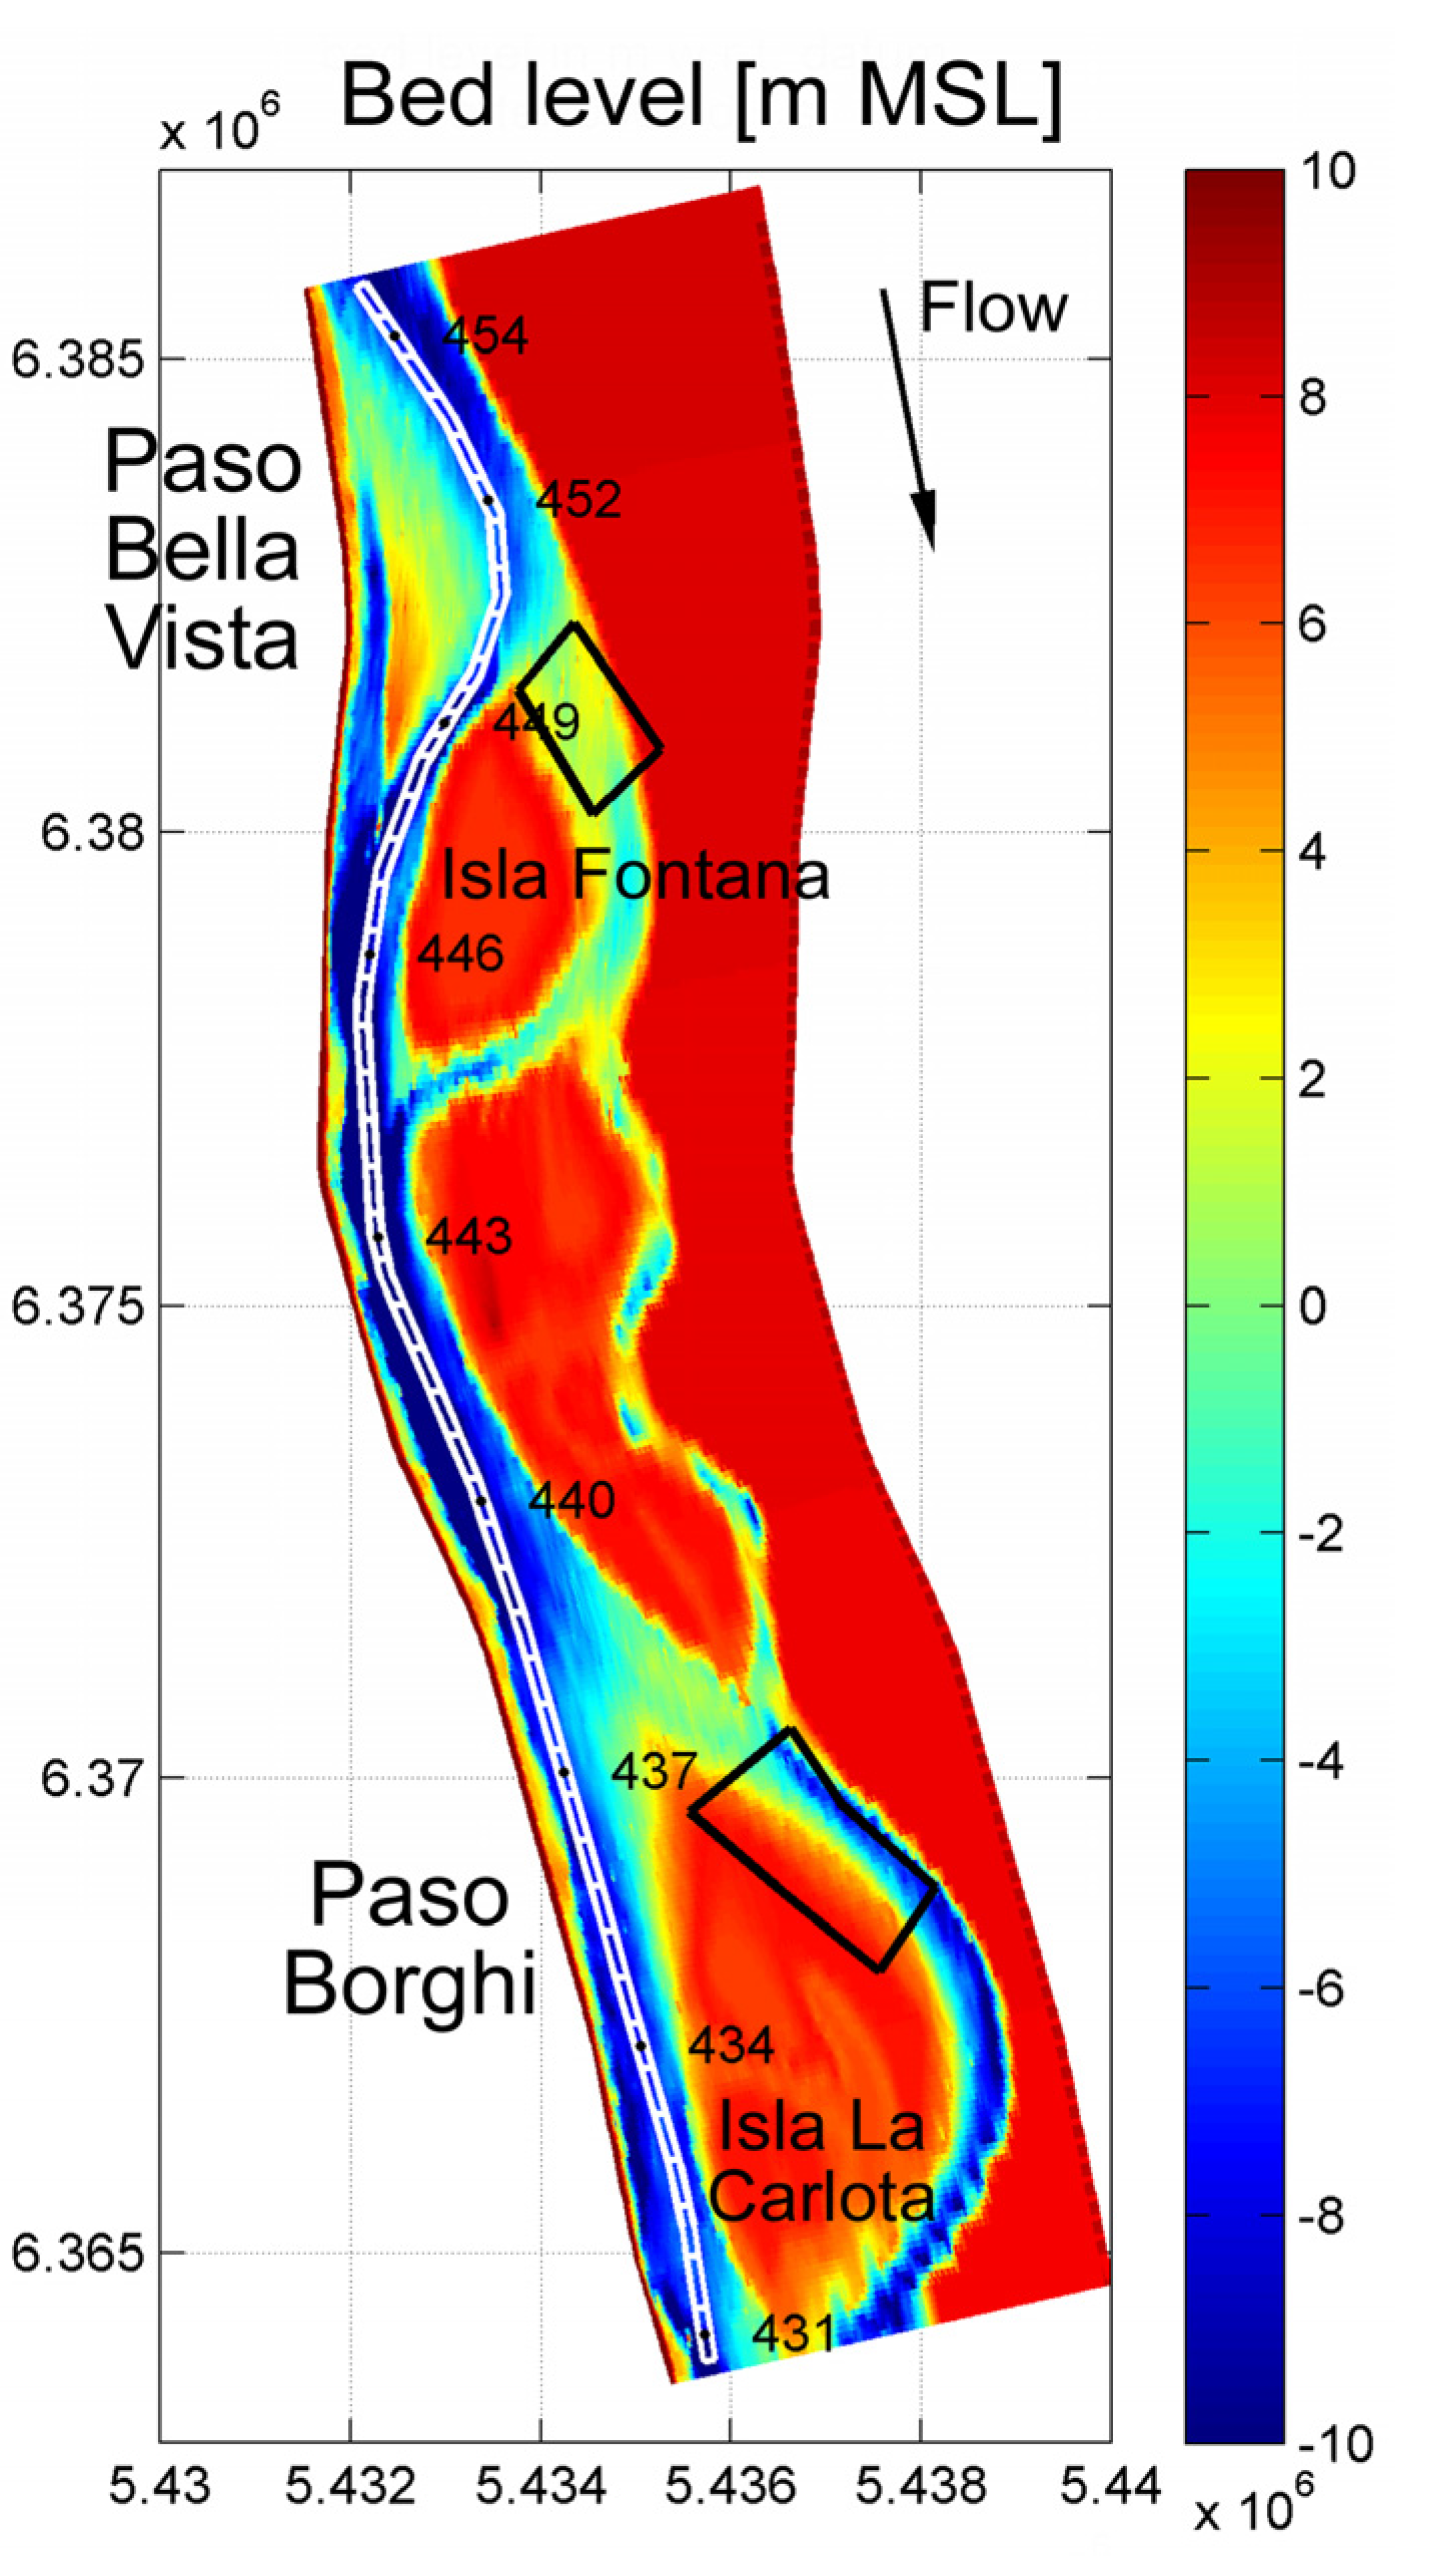
  • Du2—dump in the nearest location in secondary river channels, on the opposite side of the river islands Isla Fontana (near Paso Bella Vista) and Isla la Carlota (near Paso Borghi), see Figure 3.
The latter two strategies (Du1 and Du2) were chosen to investigate whether moving bed material further away from dredging sites helps in decreasing the dredging volumes on the longer term. These three strategies were simulated whenever the flow depth in the navigation channel was less than 10 m, which is the locally maintained navigation depth. In the simulations we defined the procedure such that in Du0 and Du1, dredged material was dumped at the deepest parts to the side of the navigation channel, where preference was given to dumping along the right bank (looking in downstream direction). In the model, sediment was only dumped at a particular location if after dumping at least 3 m depth remains. If dumping at the right bank was not possible, then dredged material was dumped in the deepest parts along the left bank. For strategy Du2, where dredged material was dumped in the side channel next to the island (secondary channels), we cut the domain in two sections. All material that was dredged upstream of km 444.5 was dumped into dump-zone Bella Vista and all material downstream from km 444.5 was dumped in dump-zone Borghi (see Figure 3).
Figure 3. Initial bed level in m above mean sea level (MSL). The white lines indicate the navigation channel, subdivided in 500 m long sections. The black “polygons” indicate dump sites “Bella Vista” and “Borghi”.
Water 07 03943 g003
During dredging of the navigation channel an additional dredging load was used that creates “overdepth”, or “clearance”, to make sure that the navigation channel keeps its required depth of at least 10 m for some time after the dredging effort. In separate dredging strategies this clearance was taken either 0.5 m or 1 m. Table 1 gives an overview of all dredge-and-dump strategies that were considered in this study.
Table 1. Overview of dredge-and-dump strategies.
Simulation RunDredge StrategyDump Strategy
Dr50Du0Dr50 (0.5 m clearance)Du0 (to side)
Dr50Du1Dr50 (0.5 m clearance)Du1 (to side, 0.5 km downstream)
Dr50Du2Dr50 (0.5 m clearance)Du2 (to side-channel)
Dr100Du0Dr100 (1 m clearance)Du0 (to side)
Dr100Du1Dr100 (1 m clearance)Du1 (to side, 0.5 km downstream)
Dr100Du2Dr100 (1 m clearance)Du2 (to side-channel)
Dunes of mean height and length of 3.5 and 100 m, respectively, were observed on the riverbed in the study reach of the Rio Parana [18,19]. These dunes should be taken into account, since their presence can lead to local shallows that need to be dredged as well. Dunes are very dynamic and there is still a lot of debate on how to predict their dimensions, although dune heights on the Parana appear to be significantly correlated with water depth [19]. In this study, we tested some relatively simple approaches to take the presence of dunes into account: (i) increasing the dredging depth by approximately half the dune height (1 m and 1.5 m for the case study); and (ii) using a dune height predicted in Delft3D based on hydro-morphodynamic conditions. For the latter, we used the dune height predictor of Fredsøe [30] based on a sediment transport formula of Meyer-Peter and Müller [31] (see 21 for details).

3. Results

This section includes results of simulations of single flow discharges (i.e., steady conditions) that were to validate the model on the basis of available field data regarding the flow velocity and suspended sediment concentration corresponding to these hydrological conditions (Section 3.1). To achieve a reasonable match with estimated dredging loads from subsequent echo-soundings of the navigation channel we also made several test-runs to choose a suitable dredging-depth criterion (Section 3.2). Finally, results are presented of all simulation runs (dredging scenarios) as listed in Table 1, considering for the reference case “Dr50Du0” both the “stepped” and “yearly Q” discharge hydrographs shown in Figure 2. The remaining dredging strategies from Table 1 were only evaluated using the “stepped 10-day Q” hydrograph (Section 3.3).

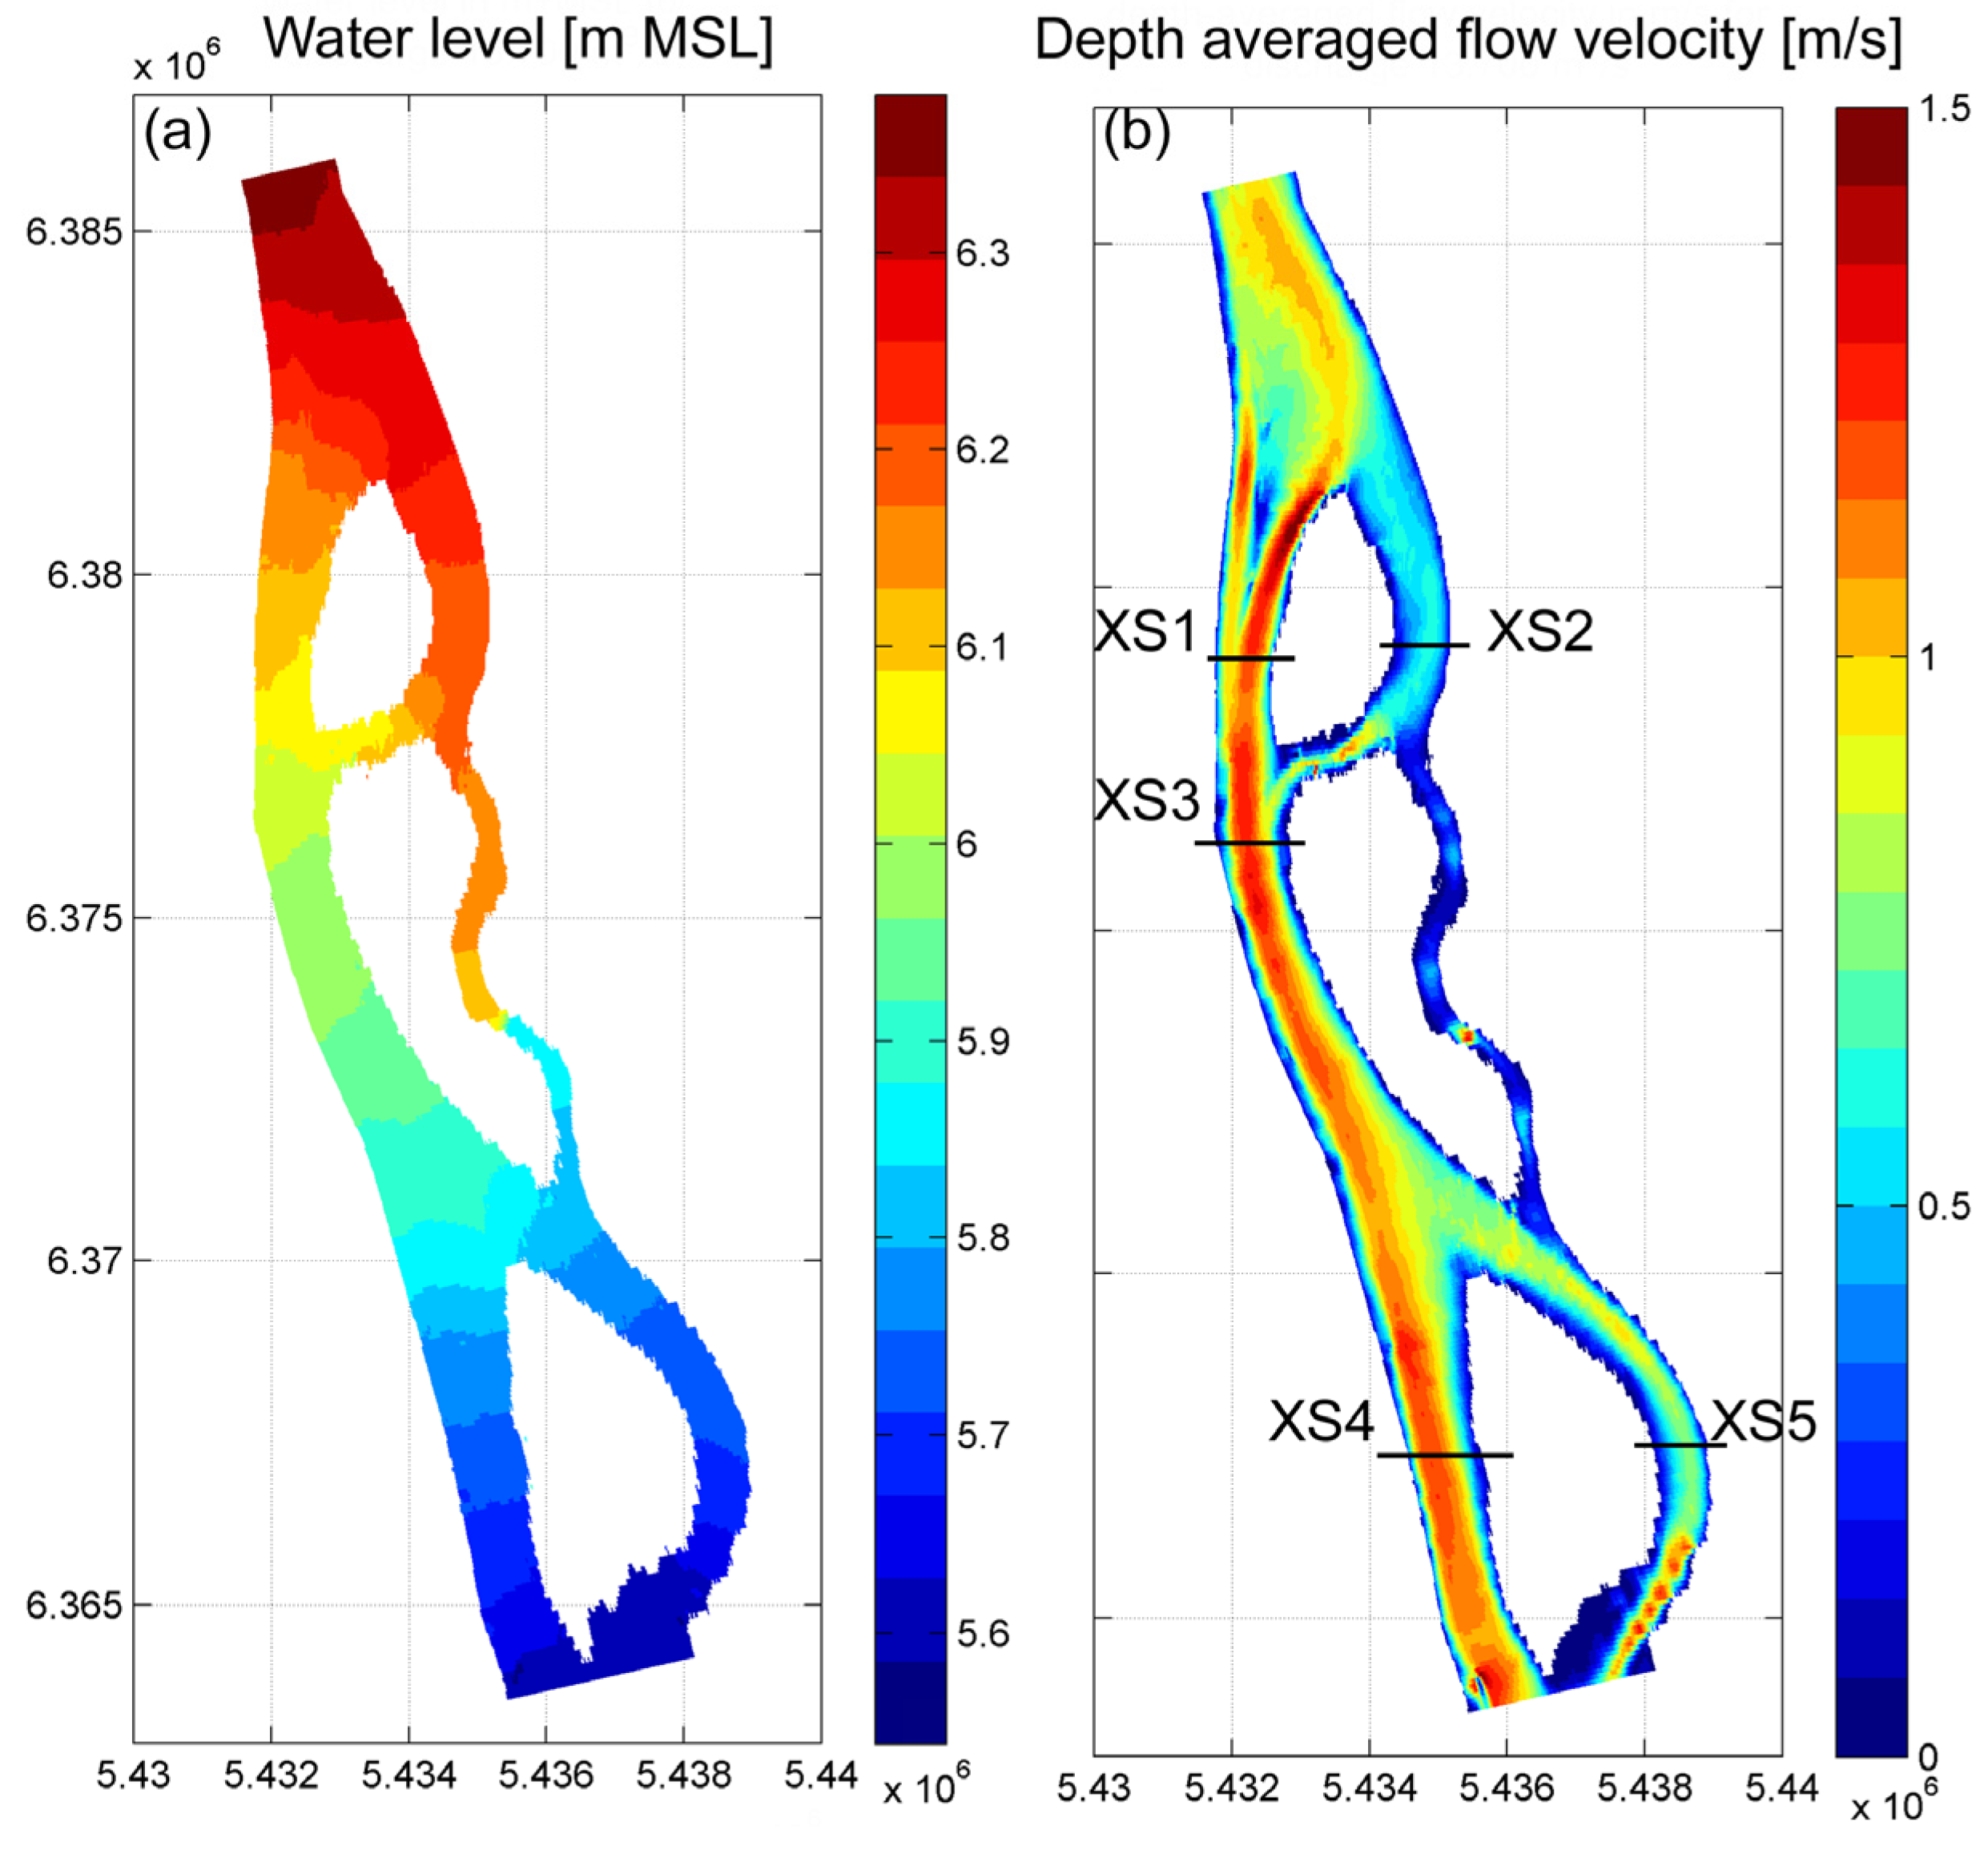
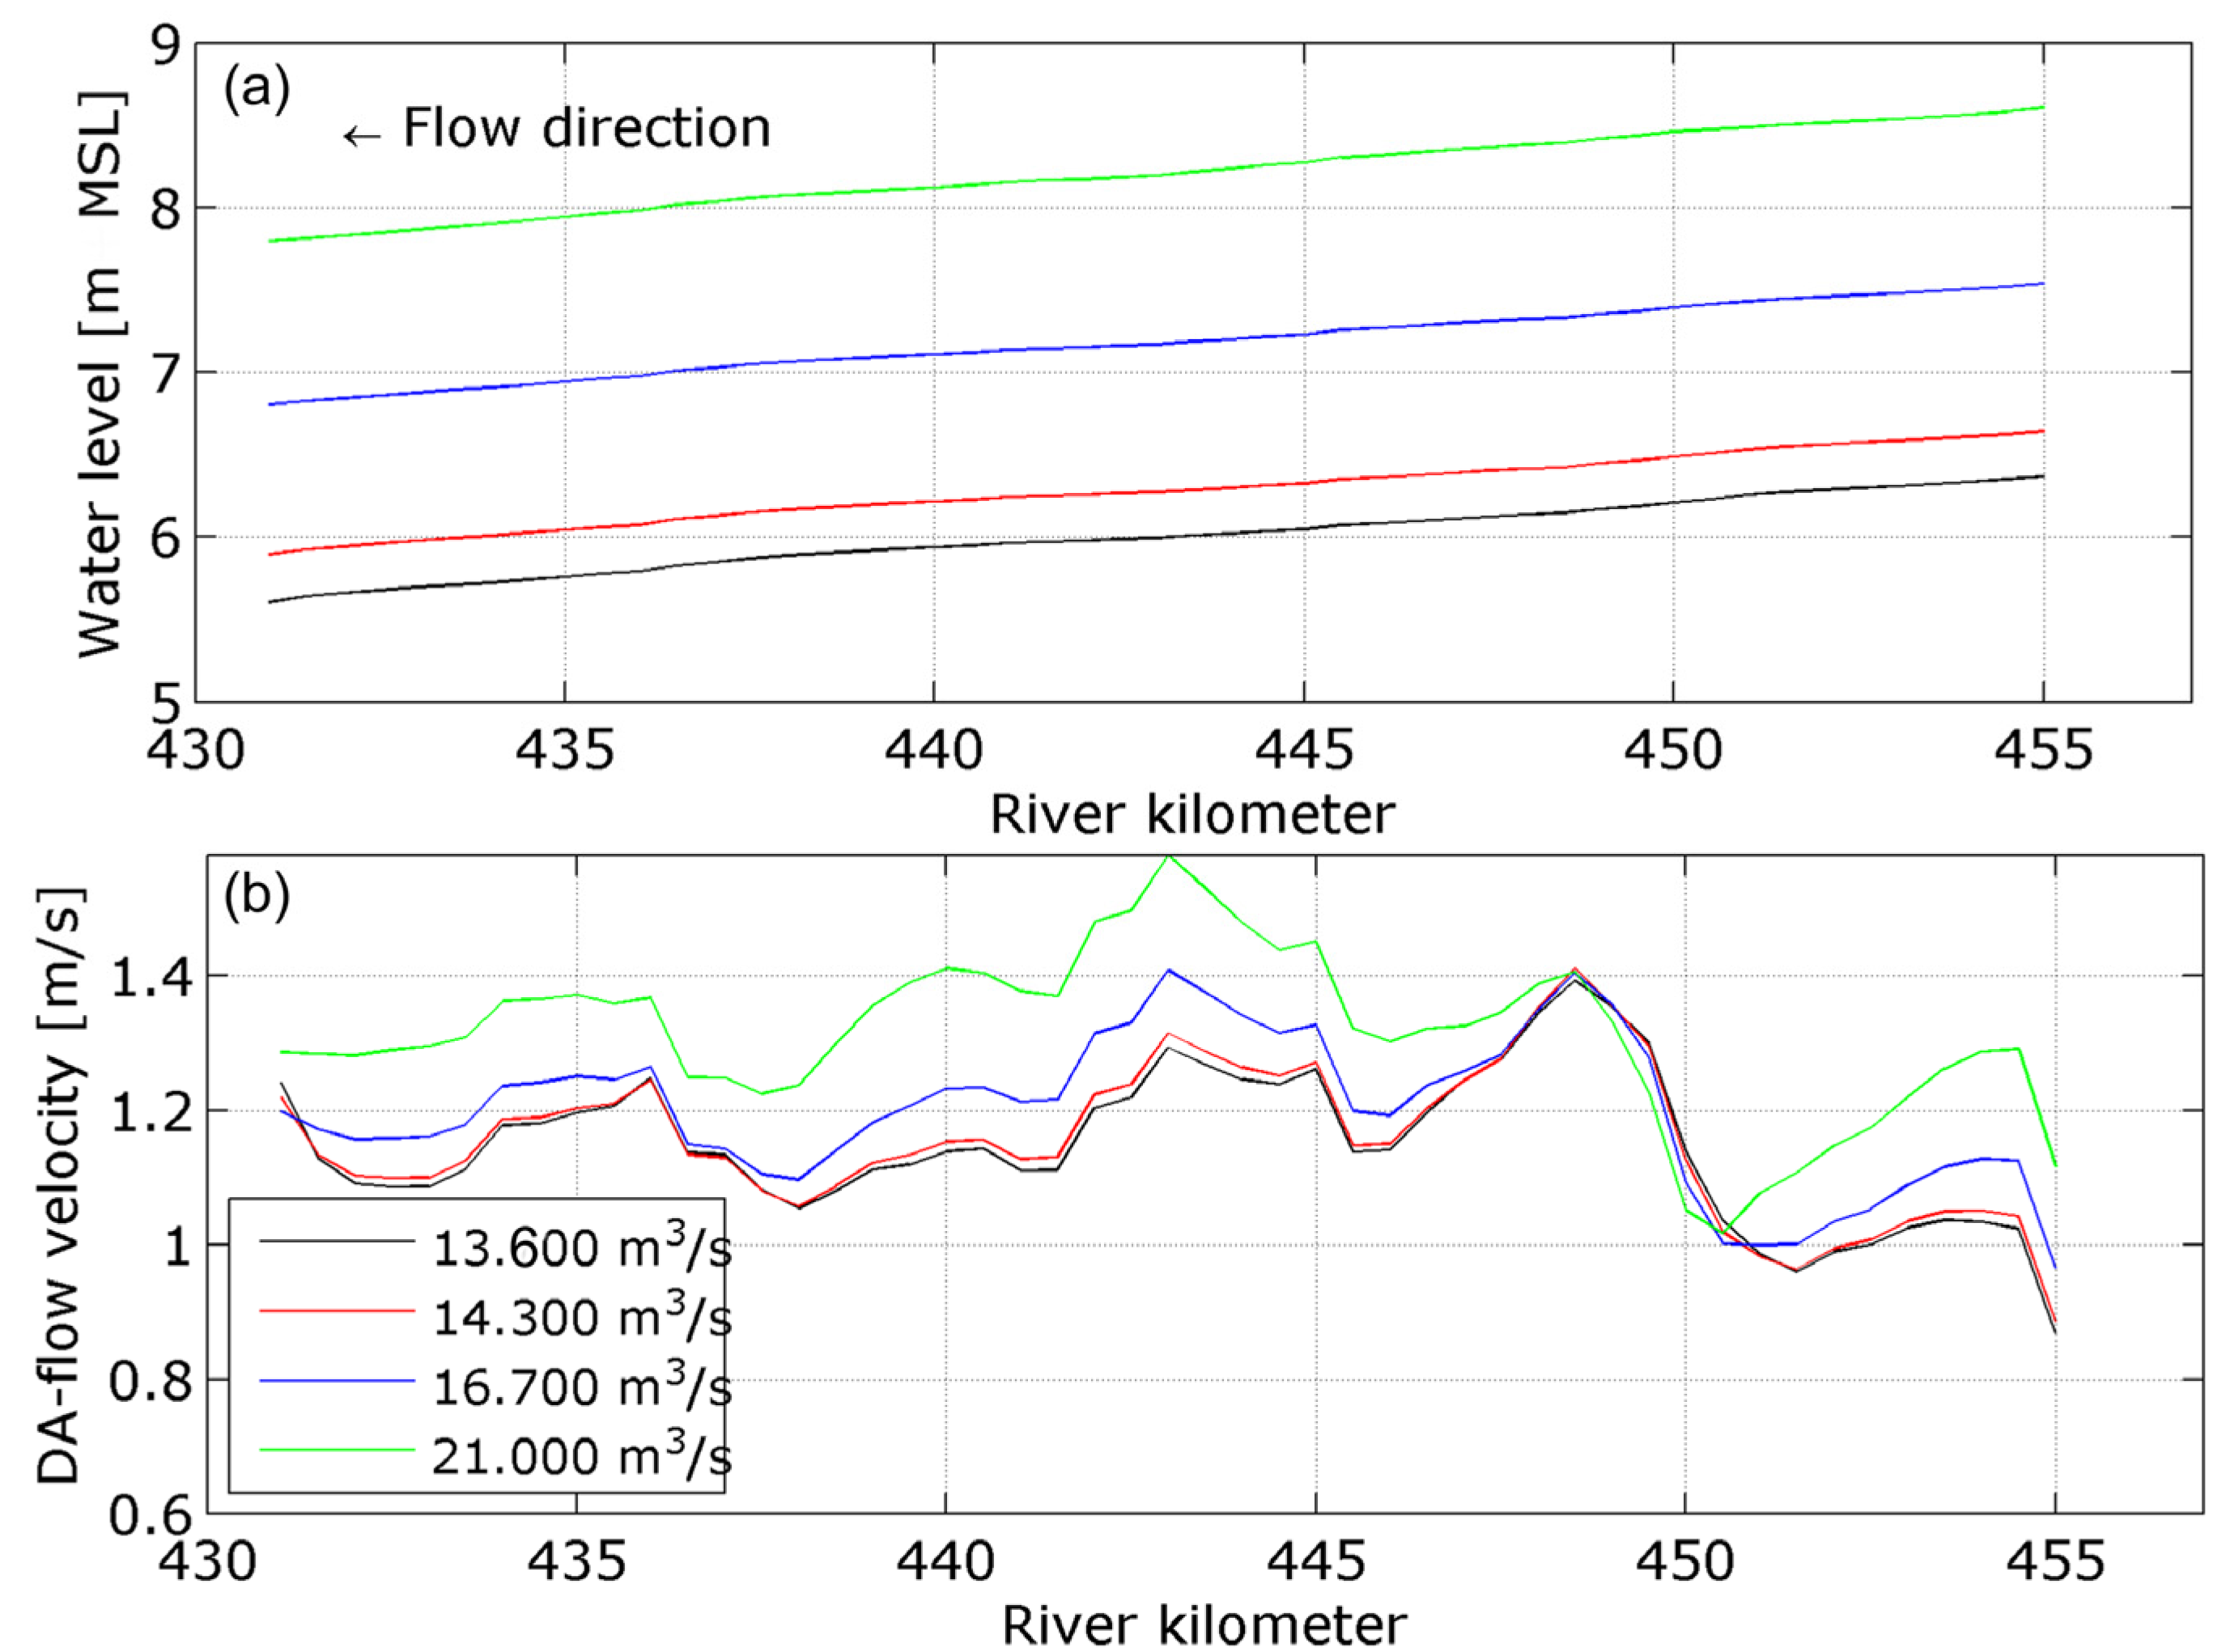
3.1. Hydro-Morphodynamic Validation of Model Results

The computed water level (a) and depth-averaged flow velocity (b) maps are shown in Figure 4 for a discharge of 13,600 m3/s. The water level slope is about 0.8 m/25 km, irrespective of the simulated discharge (Figure 5a). This is in line with previous findings [32,33]. The depth-averaged flow velocity is largest in the main channel, but there is quite significant flow through the secondary channels as well (Figure 4b). In the main channel, the flow velocities are generally between 1.1 and 1.4 m/s (Figure 5b). Table 2 gives a comparison between simulated and measured flow velocities in five cross-sections (XS in Figure 4b) and in the thalweg longitudinal track by using an acoustic Doppler current profiler (ADCP) during a field campaign in 2009 with a discharge of 13,600 m3/s (for further details about this campaign refer to [19]).
Figure 6a shows a map of the computed sediment concentration for a discharge of 14,300 m3/s that correspond to the flow discharge measured during a field campaign in 2010 using ADCPs [23]. In that campaign, suspended sediment and bed samples and acoustic backscatter profiling at two different frequencies were applied eventually inferring the concentration field in the downstream bifurcation (cross-section indicated in Figure 6a) of sediment suspended from the river bed. This concentration field was characterized with an average value of 6 mg/L that is in line with the depth-averaged values simulated in that area (Figure 6a). Figure 6b and c show the cumulative erosion and sedimentation after a one and six year simulation period, respectively (simulation without dredging/dumping). The integration of erosion-deposition patterns resulted in average net erosion and deposition volumes per unit width in the order of few meters for the main and secondary channels, respectively. These morphological changes correspond to observed tendencies from surveyed bathymetries and shore-margin lines as reported for that area by Guerrero et al. [13].
Figure 4. Simulated maps of (a) water level and (b) depth-averaged flow velocity at a river discharge of 13,600 m3/s.
Water 07 03943 g004
Figure 5. (a) Water levels and (b) Depth-averaged (DA) flow velocities at four different discharge levels.
Water 07 03943 g005
Table 2. Comparison between measured and simulated (2009 campaign with an average discharge of 13,600 m3/s) depth-averaged magnitude of flow velocities.
Channel-SectionMaximal and Across Channel Averaged Values (m/s)
ADCP MeasuredSimulation Result
XS11.21–0.931.19–1.02
XS20.55–0.500.85–0.67
XS31.30–0.981.28–1.04
XS41.14–0.961.16–0.97
XS50.73–0.590.92–0.69
Longitudinal track1.44–1.101.37–1.05
Figure 6. Simulated maps of (a) sediment concentration suspended from the riverbed with the indication of the investigated cross-section in 2010 during a flow condition of 14,300 m3/s; (b) simulated cumulative patterns of erosion-deposition after one year (from 2004 to 2005); (c) and after six years (from 2004 to 2009).
Water 07 03943 g006
Although the differences observed between measured and simulated flow velocity distributions in secondary channels (i.e., maximal values in XS2 and XS5), overall, model results are in good agreement with observations regarding flow field, sediment transport, and occurred morphological changes, that indicates the developed Delft3D model of the Parana river-reach can be used for further exploration of dredging strategies. These differences are likely caused by the relatively crude representation of island topography: small channels on the islands were not represented resulting in larger flow velocities in the two major secondary channels.

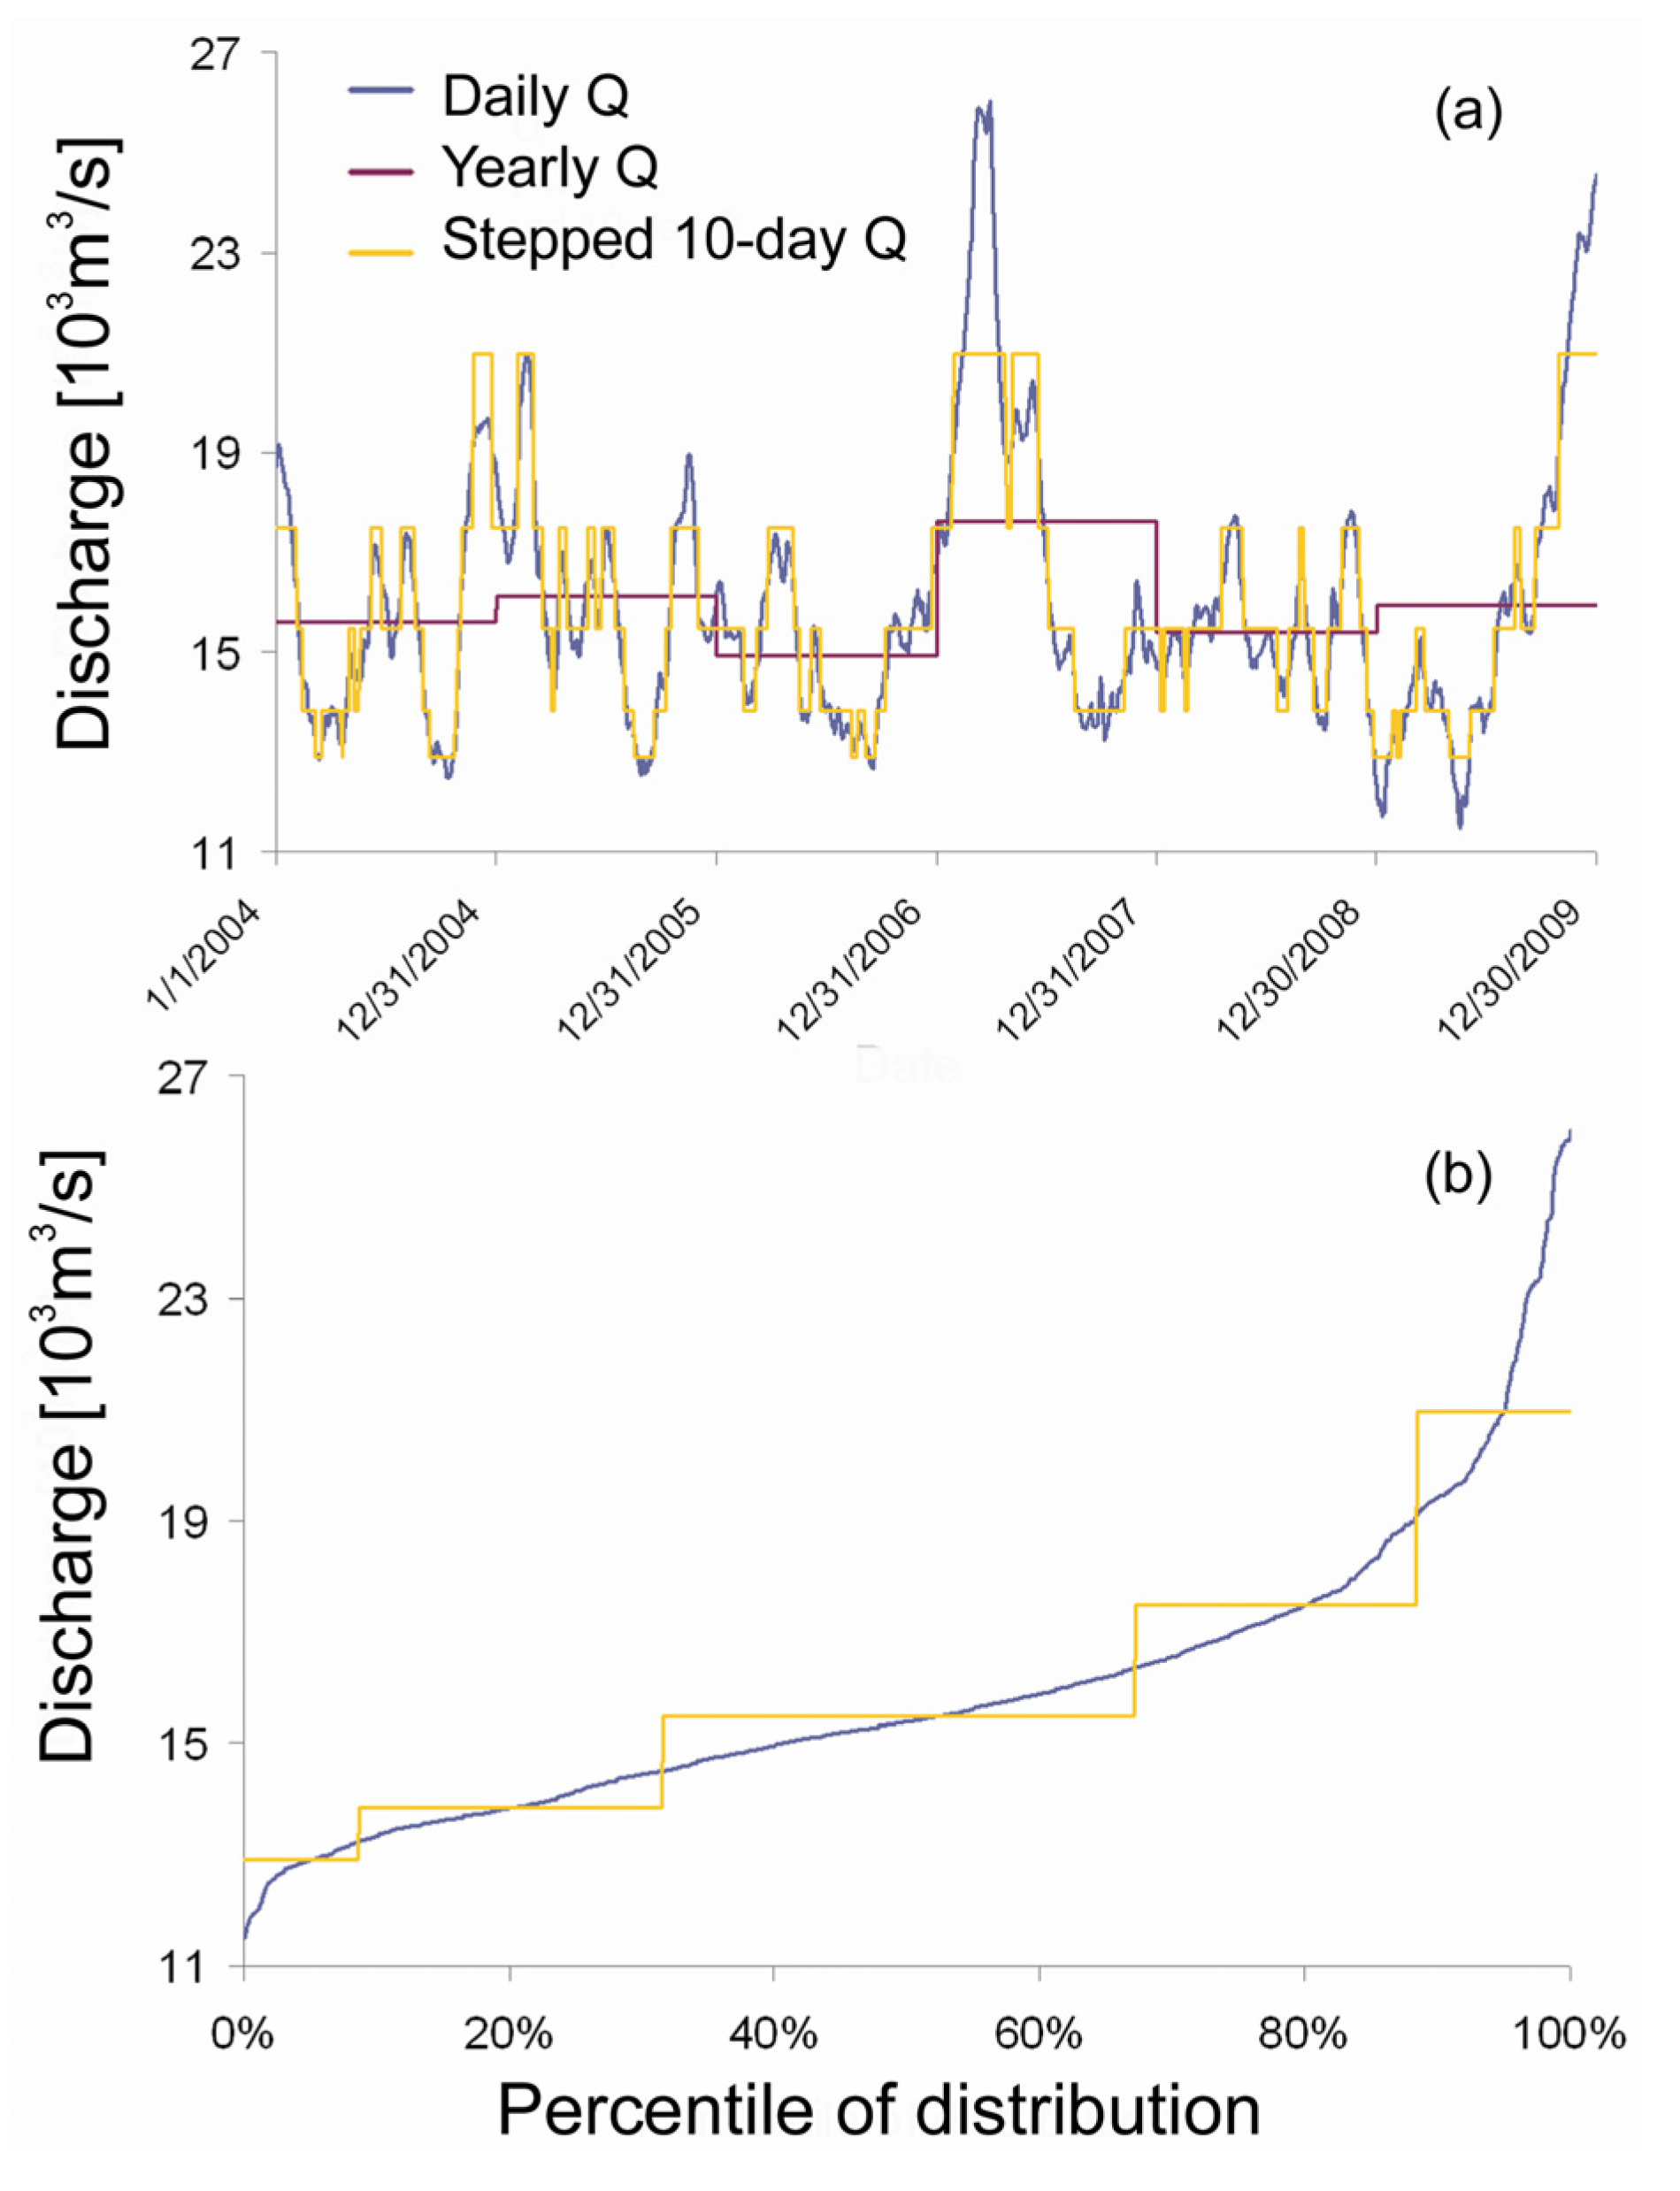
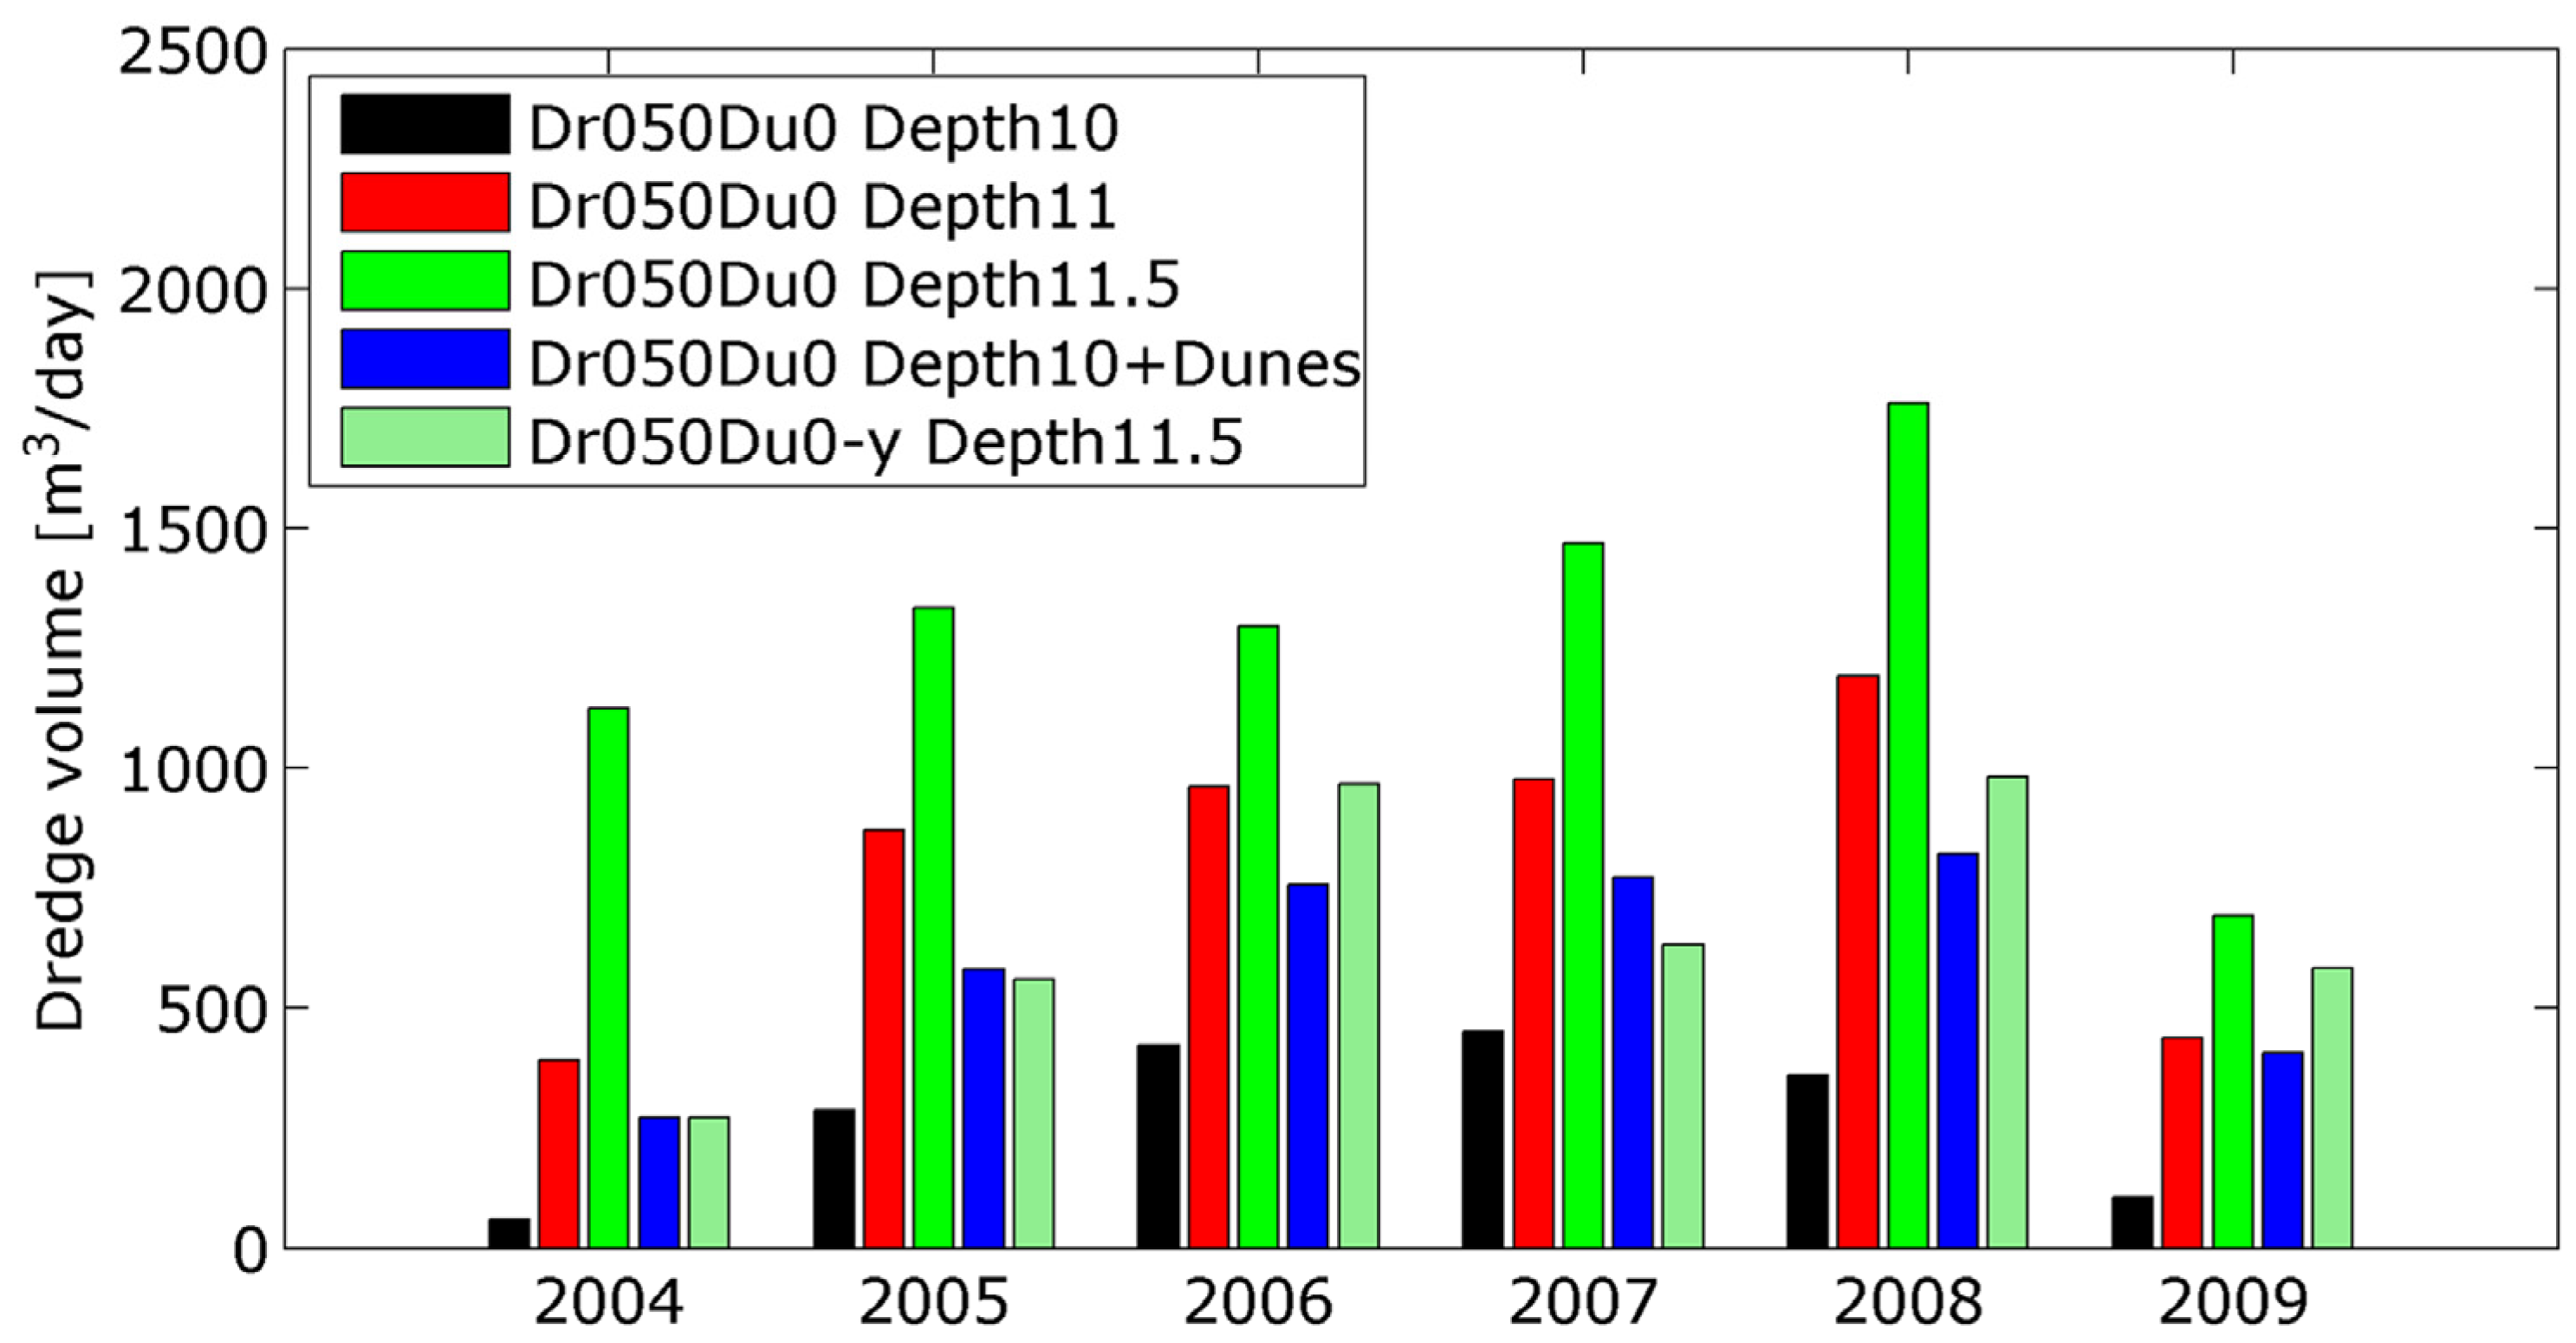
3.2. Selection of Dredging Depth and Effect of “Stepped 10-day Q” Hydrograph

Figure 7 shows total dredging loads for the period 2004–2009 when the depth of 10 m was maintained in the simulation with the “stepped 10-day Q” hydrograph. This resulted in about 300 m3/day (dry sand), or about 150,000 m3/year when considering the total volume of sand-water mixture actually dredged to the hopper that was assumed approximately equal to 1.4 times the volume of dry sand. This result is considerably lower than the amounts of around 1,000,000 m3/year (volume in the dredger, equivalent to 2000 m3/day dry sand) for this river reach, as it was estimated from subsequent echo-soundings of the navigation channel. In reality, by taking into account the presence of dunes resulted in local shallows that needed to be dredged as well. The approaches tested were: (i) increasing the dredging depth by approximately half the dune height (1 m and 1.5 m); and (ii) using a dune height predicted in Delft3D based on hydro-morphodynamic conditions (see Section 2.3 for details). The dredging loads for these different approaches are compared in Figure 7. It appears that best agreement with estimated dredging volumes was obtained by adopting a dredging-depth criterion of maintaining a navigable depth of 11.5 m. Although this criteria resulted in about 1200 m3/day of dry sand dredged in the period 2004–2009, from here onwards we use this criterion for the navigation channel in the study area. The larger estimated volume of 2000 m3/day was considered as an indication about the order of magnitude rather than an accurate assessment; this estimation is affected by inherent inaccuracies in the navigation channel excavation and surveying.
Figure 7. Dredging loads for different dredging-depth criteria. As dredging criterion we used different dredge depths in order to take dunes into account, and one criterion where dunes are explicitly computed in Delft3D (“+Dunes”). For the reference dump strategy, the results for the “yearly-Q” hydrograph were included (light-green, Dr050Du0-y), as well.
Water 07 03943 g007
Huthoff et al. [34] emphasized the importance of discharge variability in morphodynamic simulations. Figure 7 also includes a dredging load estimation obtained with a dredging depth of 11.5 m combined with the stepped “yearly-Q” hydrograph (“Dr050Du0-y Depth11.5”). This resulted in considerably lower dredging loads compared to using the “stepped 10-day Q” hydrograph (compare green and light-green bars). Observed differences in dredging loads are further discussed in the next paragraph.

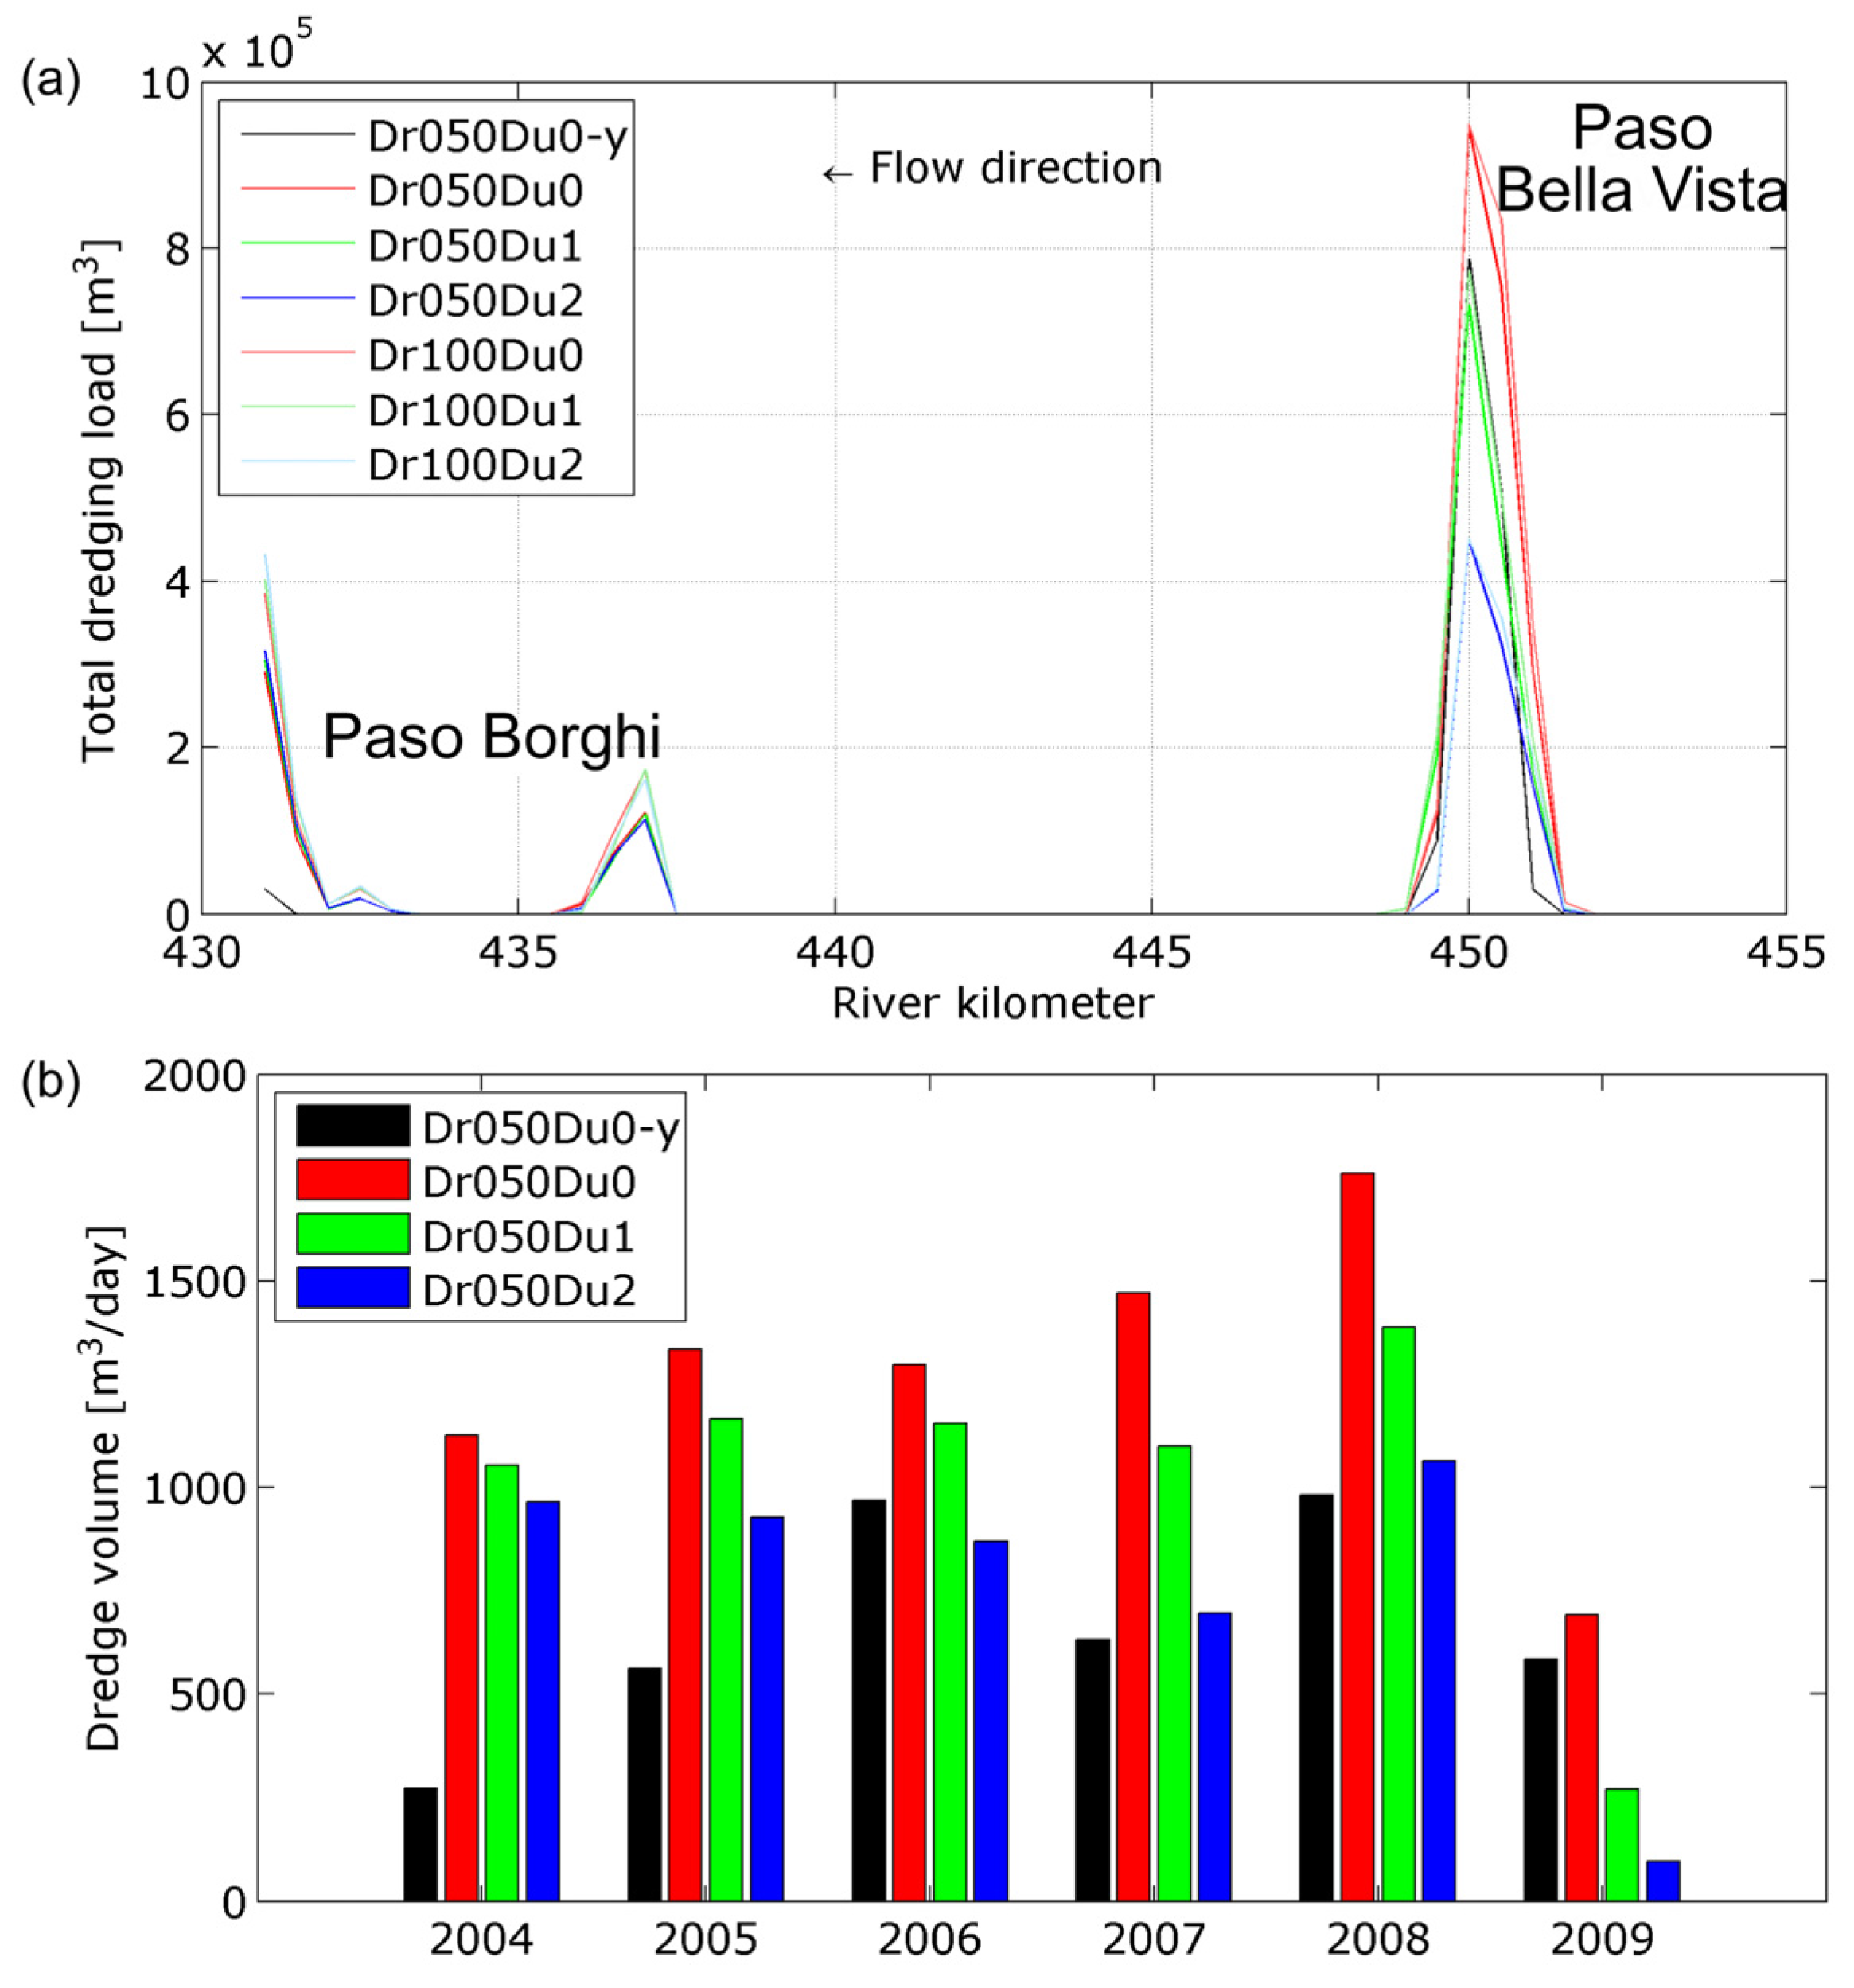
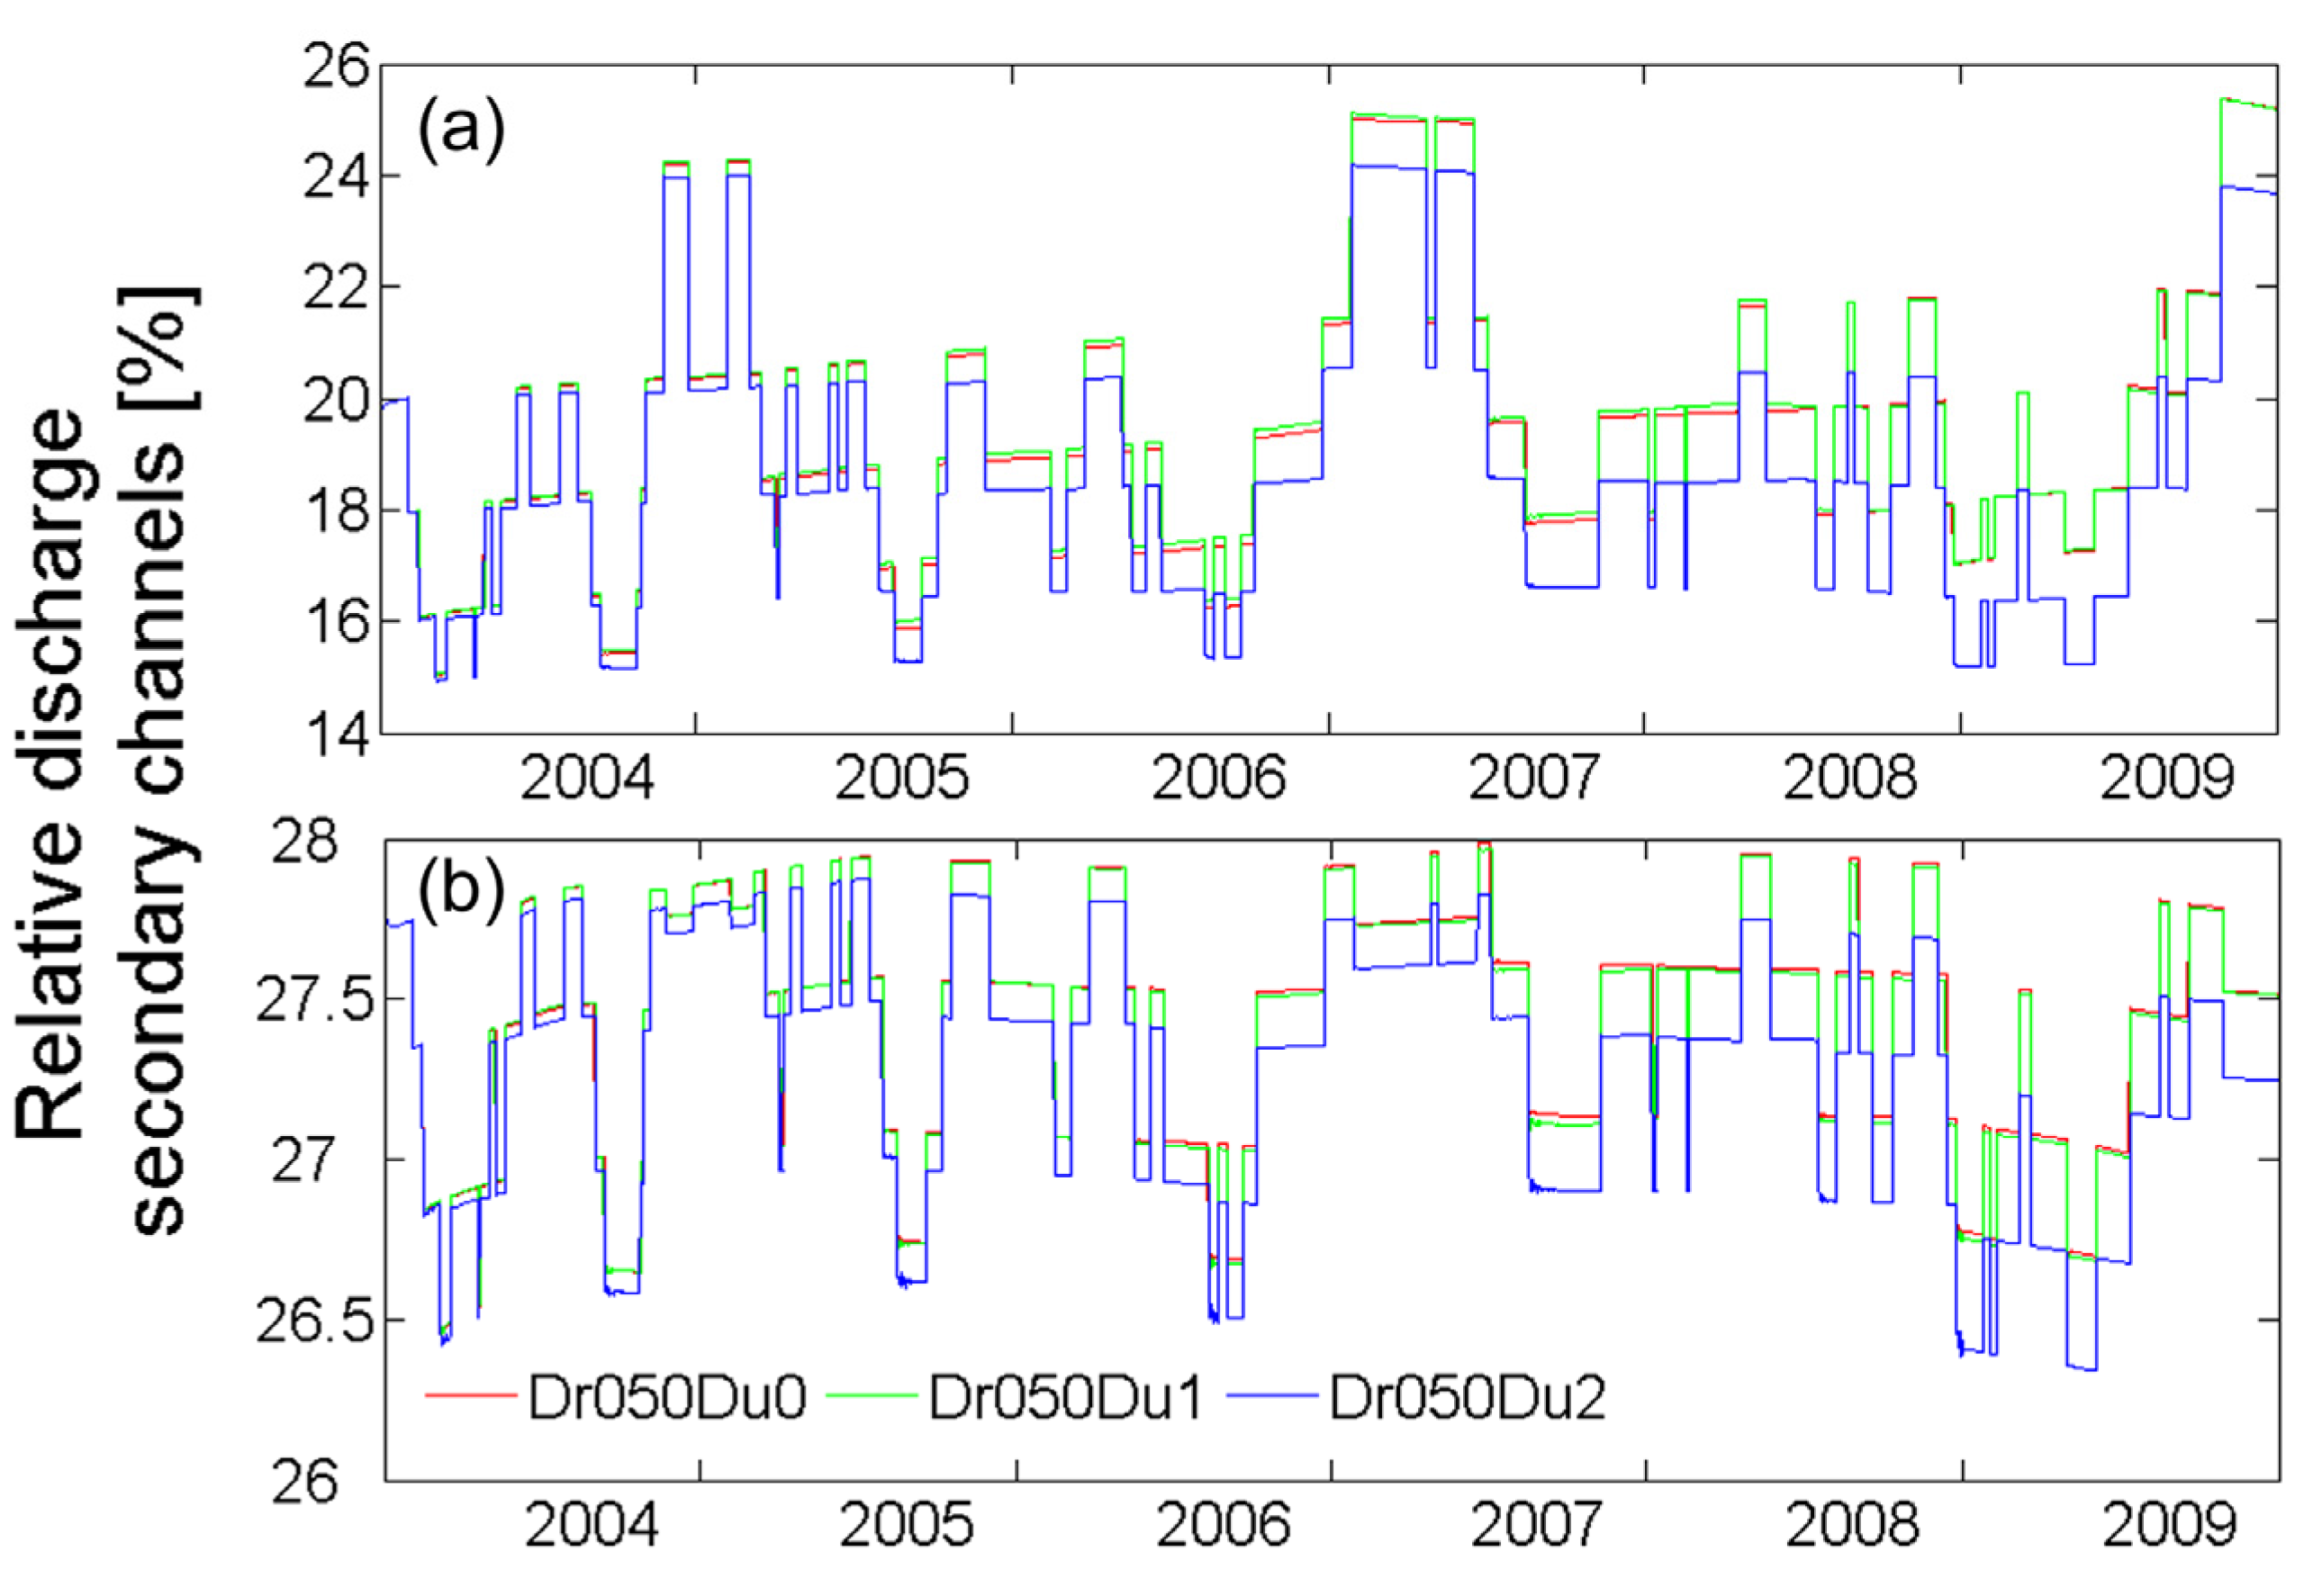
3.3. Comparison of Dredge-and-Dump Strategies

Cumulated dredging load distributions along the simulated reach and over the six year period are compared in Figure 8a, while the corresponding total dredging loads per year are reported in Figure 8b. The two “pasos”, Bella Vista and Borghi, clearly show up in the model results, with most material being dredged at Bella Vista, which is in agreement with estimations from the echo-soundings in the navigation channel. Increasing the clearance depth in dredging activities from 0.5 to 1.0 m (passing from Dr050 to the corresponding Dr100 in Figure 8a) had some effect on dredging loads, but the larger clearance gave only slightly more dredging loads. Apparently, the larger dredged volume for larger clearance depths was partly compensated by the subsequent longer period until renewed dredging needs to take place. Therefore, in subsequent analyses in this paper we focused on a clearance depth of 0.5 m. Two aspects were investigated more deeply: (i) using the “yearly Q” hydrograph resulted in low dredging quantities (compare Dr050Du0-y to Dr050Du0), especially in the upstream part of the study area (i.e., “paso” Bella Vista); and (ii) the two alternative dumping strategies (Du1, dumping downstream and Du2, dumping to the side channels) appeared to have significant impacts on dredging loads. For the six year simulation period, dumping dredged material downstream (Du1) reduced total dredging loads by ~20%, as one can see by comparing Dr050Du0 to Dr050Du1 in Figure 8a,b, probably because it avoided that sediment can return to its original dredging location. Moving the dredged material to distant locations in the side channel (Du2) even yielded a ~40% reduction in dredging loads (compare Dr050Du0 to Dr050Du2).
Figure 8. (a) Total dredging loads over the six year simulation period and (b) corresponding total dredging load for each scenario per year (for the reference dump strategy, the results for the “yearly Q” hydrograph were included that is Dr050Du0-y, as well).
Water 07 03943 g008
The dredging loads are presented in Figure 9 as a function of time. For the reference dump-strategy, the results for the “yearly Q” hydrograph were included, as well. By using the “stepped 10-day Q” hydrograph especially the low water levels trigger dredging, which are not taken into account using the “yearly Q” hydrograph. In 2006, the year-averaged discharge was relatively low. However, the dredging load for the “yearly Q” hydrograph was still lower than using the “stepped 10-day Q” hydrograph. We conclude that it was crucial to take into account the river’s yearly discharge-variability in order to properly represent dredging activities as they are performed in reality.
In 2009, the dredging load was markedly lower than preceding years (Figure 8b). This is because 2008 ends with a low discharge, causing quite a lot of dredged material and reducing the need for dredging a subsequent low discharges in 2009.
Figure 9. Dredging time series showing three dredging strategies (where for Du0 also the “yearly Q” hydrograph is included) (a) in Bella Vista km 448–453 and (b) Borghi km 431–438.
Water 07 03943 g009
Above, we already noted that moving the dredged material to distant locations in the side channel reduced the dredging loads in the navigation channel. Interestingly, this also affects the discharge distribution between the main channel and the side channels. Figure 10a shows that at Bella Vista, on the long run, the dump-strategies where the sediment was dumped near the main channel (Du0 and Du1), resulted in a gradually increasing fraction of the total discharge passing through the secondary channel. In the dump-strategy where sediment was moved further away towards the side channels (Du2), the discharge distribution between the main channel and secondary channel was kept more stable over time. After a period of six years, at Paso Bella Vista 2% of the flow is redirected to the navigation channel in the river main channel as a result of moving sediment away from the navigation channel to the distant secondary channel. At Paso Borghi this effect is also present (Figure 10b), but the effect is smaller (~0.75%) because less dredging (and thus dumping) takes place at this location.
Figure 10. Time-series of relative discharge (a) in the secondary channel near Bella Vista, and (b) in the secondary channel near Borghi.
Water 07 03943 g010

4. Discussion

The study showed that the largest reduction in total dredging load could be achieved by dumping far away from the dredging location, in our case in the secondary channels on the opposite side of local river islands. This strategy included two beneficial effects: (i) it avoided circular dredging, because the dredged material was moved to locations far away, and therefore wasn’t redistributed back into the dredging zone; and (ii) dumping the material in the side channel redirected more flow to the main channel of the river where the navigation channel is located and, hence, lowers sedimentation effects in the main channel. By dumping material in the more distant side channel the flow field was stimulated to follow a path that was beneficial for river navigation, and in the long term could even further reduce dredging loads. On the other hand, it could also lead to undesired closing of the side channel. Aiming to manage sediment budgets to meet both river functions and environmental objectives, those feedbacks of dredging operation on river morphology should be taken into account. Indeed, during the twentieth century, alternative shifts among different levels of the typical anabranching morphology of the Parana River were documented in its middle and lower branches [12,35]. For the middle Parana, the dry period at the middle of the twentieth century has accomplished a reduction in sediment transport and river channel planimetric dimensions, while wet periods, on the contrary, gave rise to island formation within the river channel, eventually promoting a more accentuated anabranching morphology and an increased overall width. Differently, for the lower branch, historical cartography shows a continuous and progressive oversimplification of the river channel planimetric morphology towards a lower width to depth ratio. In this case, in recent observations the river channel did not recover the extremely braided morphology that characterized the wet period in the beginning of the century; on the contrary, exacerbating the mid-century morphodynamic processes, despite the observed increase in precipitations and flow discharge. This difference between middle and lower branches was justified with morphological constraints, such as alluvial plane width and slope. Our findings gave evidence on the dredging impact over river channel morphology that may have been relevant for the lower Parana because of different efforts of dredging at the lower (i.e., the Oceanic waterway) and the middle (i.e., the Fluvial-maritime waterway) Parana. The represented dumping in the side channels redirected more flow to the main channel, actually, though this effect may be partially biased because the modeled morphology did not represent the small secondary channels within islands that should be included for a more accurate numerical simulation, although the detailed survey of these wetted areas appears demanding.
Our findings may be applied to assist the cost evaluation of planned dredging-and-dumping strategies. Extra costs associated with transporting dredged material over larger distances and of related impacts should be compared to the benefit of reduction of dredging loads.
In this study we also explored the benefits of altering the clearance depth in dredging activities, but these investigations did not lead to obvious immediate advantages. As expected, a larger clearance depth (1.0 m instead of 0.5 m) gave increases in total dredging loads (larger clearance gives more dredging volume). However, in some years dredging loads also stayed nearly the same despite different clearance depths. Apparently, the larger dredged volume for larger clearance depths was partly compensated by the subsequent longer period until renewed dredging needed to take place. This means that use of larger clearance depths could lead to less frequent dredging activities, and hence, potentially reduce the hindrance to navigation caused by the presence of dredging vessels. This potential benefit was not further explored in the current study but should deserve more attention in river systems where dredging activities themselves are known to cause hindrance to navigation.
The hydro-morphodynamic conditions that we considered in this study were based on field-observations in the study area. Climate change could result in higher discharges, enhancing sediment transport and channel dynamics, or in more and longer periods of drought with lower river discharges. Both may increase dredging loads.
All these issues require an investigation tool enabling the prediction of feedbacks between designed dredging-dumping strategies and the river morphology in the long-medium term. This investigation tool was tested on the Parana River, but the approach could easily be transferred to other river systems around the globe. It is worth noting that such numerical modelling based tool requires the simulation of long enough periods, rather than of a narrow single hydrological peak, that explains the timescale of river channel morphological changes and the related effects of the represented dredging-dumping operations. The role of peak events on the long term morphodynamics was not considered, although it may potentially be significant. This is an interesting subject for further research efforts.
It is important to note that the study presented here was meant as an exploratory study to investigate potential benefits of strategic dredging and dumping activities, and did not primarily aim at accurately representing all flow and morphological conditions for one particular river. In the investigated case of the Parana River, we chose realistic topographical data to represent the flow boundaries and also adopted plausible modelling choices from an existing Parana morphodynamic model [13]. However, it should be emphasized that model improvements could be made to improve its representations of reality, and also to achieve more accurate estimates of actual dredging loads under various conditions and dredge-and-dump strategies. For example, more sophisticated sediment transport and morphology could be achieved by including graded sediment and influences of dunes on the river bed and a more accurate representation of island topography. Additionally, a spatially-distributed hydraulic roughness is likely more realistic than the currently used homogeneous roughness. Another aspect is that imposing a total discharge at the upstream model boundary exaggerates the erosion of the upstream island, which could be avoided by shifting the boundary in the upstream direction. Nevertheless, sensitivity analyses of several of these input parameters have shown that overall trends in total dredging loads are quite stable, and that general conclusions can be confidently drawn from this study.

5. Conclusions

A computational morphodynamic study was carried out to explore the feedbacks between dredging-and-dumping strategies and river morphology in the medium-long term, which may assist sediment management and the optimization of dredging-and-dumping strategies in river navigation channels where regular and significant maintenance activities are required. For the considered case of a 25 km reach of the Parana River (Argentina) we found that, first, it is crucial to take into account the river’s discharge-variability in order to properly represent dredging activities as they are performed in reality. Also, it appeared that migrating dunes on the river bed may be an important contributor to the total dredging load. Next, by considering different dredge-and-dump strategies we found that a larger clearance in the dredging depth of 0.5 m did not contribute significantly to total dredging loads. The extra dredging volume due to the larger clearance appeared to be partly compensated by the longer period that one does not need to return for renewed dredging. It is recommended to explore optimization of clearance depths in navigation channels where frequent dredging activities themselves are causing hindrance to navigation activities.
The most important lesson of the current study is that strategic dumping of dredged material can significantly reduce total dredging loads and at the same time have significant feedbacks on the streamflow distribution in river channels and the consequent bifurcations morphology. This may explain to some degree the difference between morphological trends observed in the last century at the middle and lower branches of the Parana River, the latter corresponding to the Oceanic waterway, that were subjected to increasing dredging activity as a response to freight transportation development. It was shown that moving dredged material downstream (by 500 m) as opposed to sideway-dumping could reduce total dredging loads by ~20%, because it avoids that sediment returns to its original dredging location. Even larger benefits were achieved by moving the dredged material to distant locations in the secondary channels, yielding ~40% reduction in dredging loads. In the considered case the moved material was not only safe from returning to its dredged shallow zones in the navigation channel, the dumped material also helped to stimulate flow dynamics in the river that aided maintenance of a deep enough, and more stable navigation channel, but eventually modifying the flow distribution at bifurcations and the related morphodynamics, as well. Both effects helped reducing dredging loads, leading to important reductions already starting in the year of implementation of the strategy and leading to even larger reductions in subsequent years.
The investigated dredge-and-dump strategies explored in the current study are not specific for a reach in the Parana River, but can also be applied to drastically reduce dredging activities in navigation channels elsewhere. Studies as these should become standard practice to optimize navigation support in rivers worldwide, not only to help reduce maintenance costs and hindrance to river traffic, but also to harmonize natural river processes with navigation needs in order to ensure a sustainable future of river navigation.

Acknowledgements

The research has been carried out as own funded research in the framework of the research programme RiverCare.

Author Contributions

Fredrik Huthoff and Massimo Guerrero conceived, designed the numerical simulations and analyzed the results including the comparison with data from the field; Andries J. Paarlberg performed the simulations and wrote the paper together with Massimo Guerrero; Mariano Re contributed to the analysis of data from the filed.

Conflicts of Interest

The authors declare no conflict of interest.

References

  1. Asariotis, R.; Benamara, H.; Hoffmann, J.; Misovicova, M.; Núñez, E.; Premti, A.; Sitorus, B.; Valentine, V.; Viohl, B. Review of Maritime Transport 2010; UNCTAD Secretariat: New York, NY, USA; Geneva, Switzerland, 2010. [Google Scholar]
  2. Mead, A.A.; Demas, C.R.; Ebersole, B.A.; Kleiss, B.A.; Little, C.D.; Meselhe, E.A.; Powell, N.J.; Pratt, T.C.; Vosburg, B.M. A water and sediment budget for the lower Mississippi–Atchafalaya River in flood years 2008–2010: Implications for sediment discharge to the oceans and coastal restoration in Louisiana. J. Hydrol. 2012, 432, 84–97. [Google Scholar]
  3. Van Vuren, S.; Paarlberg, A.; Havinga, H. The aftermath of “Room for the River” and restoration works: Coping with excessive maintenance dredging. J. Hydro-Environ. Res. 2015, 9, 172–186. [Google Scholar] [CrossRef]
  4. Mohiuddin, F.A. Effect of increased dredging length of the Gorai river off-take on lean season flow of the Gorai river in Bangladesh. In Proceedings of the 13th IAHR–APD Congress, Singapore, 6–8 August 2002.
  5. Gómez, C.E.; Cáceres, R.A.; Villella, M.A. Varaduras en el río Paraná inferior. Caso estudio: buque Aristeas P. In Proceedings of the VII Congreso Argentino de Ingeniería Portuaria, Buenos Aires, Argentina, 13–15 June 2012. (In Spanish)
  6. Guerrero, M.; Nones, M.; Saurral, R.; Montroull, N.; Szupiany, R.N. Parana river sediment dynamics in the context of climate change. Int. J. River Basin Manag. 2013, 11, 423–437. [Google Scholar] [CrossRef]
  7. Guerrero, M.; Re, M.; Kazimierski, L.D.D.; Menéndez, A.N.; Ugarelli, R. Effect of climate change on navigation channel dredging of the Parana River. Int. J. River Basin Manag. 2013, 11, 439–448. [Google Scholar] [CrossRef]
  8. Alba, J.G.; Gómez, A.G.; Tinoco López, R.O.; Sámano Celorio, M.L.; García Gómez, A.; Juanes, J.A. A 3-D model to analyze environmental effects of dredging operations—Application to the Port of Marin, Spain. Adv. Geosci. 2014, 1, 1–5. [Google Scholar]
  9. Van Maren, D.S.; van Kessel, T.; Cronin, K.; Sittoni, L. The impact of channel deepening and dredging on estuarine sediment concentration. Cont. Shelf Res. 2015, 95, 1–14. [Google Scholar] [CrossRef]
  10. Guerrero, M.; di Federico, V.; Lamberti, A. Calibration of a 2-D morphodynamic model using water-sediment flux maps derived from an ADCP recording. J. Hydroinform. 2013, 15, 813–828. [Google Scholar] [CrossRef]
  11. Miwa, H.; Parker, G. Numerical simulation of low-flow channel evolution due to sediment augmentation. Int. J. Sediment Res. 2012, 27, 351–361. [Google Scholar] [CrossRef]
  12. Amsler, M.L.; Ramonell, C.G.; Toniolo, H.A. Morphologic changes in the Paraná River channel (Argentina) in the light of the climate variability during the 20th century. Geomorphology 2005, 70, 257–278. [Google Scholar] [CrossRef]
  13. Guerrero, M.; Latosinski, F.; Nones, M.; Szupiany, R.N.; Re, M.; Gaeta, M.G. Sediment fluxes investigation for 2-D modelling of large rivers morphodynamics. Adv. Water Resour. 2015, 81, 186–198. [Google Scholar] [CrossRef]
  14. Kazimierski, L.D. Sedimentación en canales de navegación. Caso de estudio: Paso Borghi. Master’s Thesis, Facultad de Ingeniería, Universidad de Buenos Aires, Buenos Aires, Argentina, March 2014. [Google Scholar]
  15. García, S. Vía navegable troncal Santa Fe-Océano, una experiencia exitosa. In Proceedings of the V Seminario Internacional de Ingeniería y Operaciones Portuarias, Concepción, Chile, 20 October 2008. (In Spanish)
  16. Amsler, M.; Schreider, M. Aspectos hidráulicos de la superposición de formas de fondo en el río Paraná (Argentina). In Proceedings of the XV Congreso Latinoamericano de Hidráulica, X Seminario Nacional de Hidráulica e Hidrología, Cartagena, Colombia, 8–12 September 1992. (In Spanish)
  17. Drago, E.C.; Amsler, M.L. Bed sediment characteristics in the Paraná and Paraguay Rivers. Water Int. 1998, 23, 174–183. [Google Scholar] [CrossRef]
  18. Parsons, D.R.; Best, J.L.; Orfeo, O.; Hardy, R.J.; Kostaschuk, R.; Lane, S.N. Morphology and flow fields of three-dimesnional dunes, Rio Paranà, Argentina: Results from simultaneous multibeam echo sounding and acoustic Doppler current profiling. J. Geophys. Res. 2005, 110, 1–9. [Google Scholar]
  19. Guerrero, M.; Lamberti, A. Bed-roughness investigation for a 2-D model calibration: The San Martìn case study at Lower Paranà. Int. J. Sediment Res. 2013, 28, 458–469. [Google Scholar] [CrossRef]
  20. Orfeo, O.; Stevaux, J. Hydraulic and morphological characteristics of middle and upper reaches of the Paranà River (Argentina and Brazil). Geomorphology 2002, 44, 309–322. [Google Scholar] [CrossRef]
  21. Delft3D: Simulation of Multi-Dimensional Hydrodynamic Flows and Transport Phenomena, Including Sediments, Hydro-Morphodynamics; Deltares: Delft, The Netherlands, 2014.
  22. Engelund, F.; Hansen, E. A Monograph on Sediment Transport in Alluvial Streams; Teknisk Vorlag: Copenhagen, Denmark, 1967. [Google Scholar]
  23. Guerrero, M.; Szupiany, R.N.; Latosinski, F. Multi-Frequency acoustic for suspended sediment studies: An application in the Parana River. J. Hydraul. Res. 2013, 51, 696–707. [Google Scholar] [CrossRef]
  24. Ranasinghe, R.; Swinkels, C.; Luijendijk, A.; Roelvink, J.A.; Bosboom, J.; Stive, M.J.F.; Walstra, D.J.R. Morphodynamic upscaling with the MorFac approach: Dependencies and sensitivities. Coast. Eng. 2011, 58, 806–811. [Google Scholar] [CrossRef]
  25. Su, F.; Lettenmaier, D. Estimation of surface water budget of La Plata Basin. J. Hydrometeorol. 2009, 10, 981–998. [Google Scholar] [CrossRef]
  26. Saurral, R. The hydrologic cycle of the La Plata Basin in the WCRP-CMIP3 multimodel dataset. J. Hydrometeorol. 2010, 11, 1083–1102. [Google Scholar] [CrossRef]
  27. Sloff, K.; Giri, S.; Zagonjolli, M.; Yossef, M.; Paarlberg, A. Continued Development and Application of Morphological Model DVR Part 3: Case Studies; Deltares Report Q4634/1002069; Deltares: Delft, The Netherlands, 2009. [Google Scholar]
  28. Yossef, M.; Giri, S.; van der Mark, R. Voorspelinstrument Duurzame Vaardiepte Rijndelta. DVR-Model Update 2010 (DVR-2010); Deltares Report 1202433-000; Deltares: Delft, The Netherlands, 2010. [Google Scholar]
  29. Re, M.; Kazimierski, L.D.; Menéndez, A.N. Sedimentación en canales de navegación en el contexto del cambio climático. Tecnol. Cienc. Agua 2014, 5, 5–21. (In Spanish) [Google Scholar]
  30. Fredsøe, J. Shape and dimensions of stationary dunes in rivers. J. Hydraul. Div. 1982, 108, 932–947. [Google Scholar]
  31. Meyer-Peter, E.; Müller, R. Formulas for bed-load transport. In Proceedings of the 2nd IAHR Congress, Stockholm, Sweden, 7–9 June 1948.
  32. Amsler, M.L.; Prendes, H. El Río Paraná en su Tramo Medio. In Transporte de Sedimentos y Procesos Fluviales Asociados; Paoli, C., Schreider, M., Eds.; Universidad Nacional del Litoral: Santa Fe, Argentina, 2000; pp. 233–306. [Google Scholar]
  33. Latrubese, E. Patterns of anabranching channels: The ultimate end-member adjustment of mega rivers. Geomorphology 2008, 101, 130–145. [Google Scholar] [CrossRef]
  34. Huthoff, F.; van Vuren, S.; Barneveld, H.J.; Scheel, F. On the importance of discharge variability in the morphodynamic modeling of rivers. In Proceedings of the Fifth International Conference on Fluvial hydraulics—Riverflow, Braunschweig, Germany, 8–10 September 2010.
  35. Castro, S.L.; Cafaro, E.D.; Gallego, M.G.; Ravelli, A.M.; Alarcón, J.J.; Ramonell, C.G.; Amsler, M.L. Evolución morfológica histórica del cauce del río Paraná en torno a Rosario (km 456–406). In Proceedings of the XXI Congreso Nacional del Agua, Tucumán, Argentina, 15–19 May 2007. (In Spanish)

