Article

Estimating the Rainwater Potential per Household in an Urban Area: Case Study in Central Mexico

by
Liliana Lizárraga-Mendiola
1,*,
Gabriela Vázquez-Rodríguez
2,
Alberto Blanco-Piñón
3,
Yamile Rangel-Martínez
1 and
María González-Sandoval
1
1
Académica de Ingeniería, Universidad Autónoma del Estado de Hidalgo, Carr. Pachuca-Tulancingo km 4.5 Col. Carboneras, Mineral de la Reforma 42184, Mexico
2
Académica de Química, Universidad Autónoma del Estado de Hidalgo, Carr. Pachuca-Tulancingo km 4.5 Col. Carboneras, Mineral de la Reforma 42184, Mexico
3
Académica de Ciencias de la Tierra y Materiales, Universidad Autónoma del Estado de Hidalgo, Carr. Pachuca-Tulancingo km 4.5 Col. Carboneras, Mineral de la Reforma 42184, Mexico
*
Author to whom correspondence should be addressed.
Water 2015, 7(9), 4622-4637; https://doi.org/10.3390/w7094622
Submission received: 24 June 2015 / Accepted: 13 August 2015 / Published: 27 August 2015

Abstract

:
In cities with problems of aridity and a shortage of drinking water supply, there is an urgent need to establish alternatives for an adequate water management program. This study proposes an estimation through which users can select a rainwater harvesting system for non-drinking water consumption. For the cities of Pachuca and Mineral de la Reforma, State of Hidalgo, Central Mexico, the historical record of rainfall analyzed covers a period of 33 years (1980–2013). We calculated the monthly volume of rainwater harvestable from roof areas (VR, m3) with household roof areas (Hra) of 45 m2, 50 m2, 100 m2 and 200 m2. It is proposed to replace in each single house the flush toilets and washing machine with ecological devices with consumptions of 4.8 L/flush and 70 L/load, respectively. Furthermore, a maximum and a minimum consumption of eight and six flushes/day/person (flush toilets) and five and four loads/week (washing machine), respectively, are proposed. From these considerations, our estimations of the harvestable rainwater showed that households with Hra of 45 m2 and 50 m2 would depend on the water supply system of the public network during part of the year. On the other hand, households with Hra of 100 m2 and 200 m2 might be able to store enough water to meet other needs besides toilet flushing and laundry.

1. Introduction

Population growth, urbanization and global climate change represent a very important pressure on urban water resources. These factors require that the water administrators consider immediately other options that counteract the water stress that the population is facing [1]. For this reason, it is becoming increasingly more recurrent to take advantage of rainwater in urban areas, mainly to meet consumption needs for which the use of drinking water is not imperative [2].
The African Development Bank [3] defines rainwater harvesting as “the collection of the runoff for productive use”, particularly in areas where rainfall varies between 200 and 1000 mm; while for Sapkota et al. [4] and Liaw and Chang [5], it is the collection and use of rainwater for domestic purposes. Villarreal and Dixon [6] mentioned that, although in Sweden, only 0.5% of the available water is used, large amounts of rainwater are consumed at the household level in an area where the annual rainfall is as high as 508 mm. These authors studied a housing development made up of buildings, where the rainwater was collected from roof areas. They identified that the volume of rainwater harvested would help to save a significant amount of drinking water, especially if also ecological or water-saving devices replaced the regular flush toilets.
Khastagir and Jayasuriya [7] conducted a study in Melbourne, Southwestern Australia, where rainfall varies from 450 to 1050 mm per year and a drought of 12 consecutive years (1997–2009) has been experienced. These authors designed a methodology to determine the size of tanks of rainwater storage at the household level, considering that the distribution of rainfall can vary from one point to another of the city. Concerning their storage capacity, Imteaz et al. [8,9] and Rahman et al. [10] indicated that daily rainfall analysis is expected to produce more realistic rainwater tank sizing than using monthly rainfall data.
Through a probabilistic relationship, Su et al. [11] found that the efficiency of rainwater collecting systems depends on the temporal distribution of rainfall and the water demand. Jones and Hunt [12] designed a system for rainwater harvesting based on rainfall historical records in two cities of North Carolina, Southeastern United States. Their main interest was to determine an optimal balance between the roof surface, the size of the tank, as well as the water consumption.
In Mexico, the harvesting of rainwater would make a major contribution to reduce the water supply shortage that occurs in large areas of the country. In Guanajuato, Central Mexico, a project was conducted to harvest rainwater using the roof areas of the houses in a community with an average annual rainfall of 455.3 mm. Water storage tanks of a 2.5 m3 capacity were installed in roofs of 74 m2 [13]. In Mexico City and in rural areas of the country, there are hundreds of catchment systems already installed [14]. All of these study cases have had successful results at both the individual and local levels.
In 2002, Biswas [15] indicated that the federal government in Mexico had solved the problems of water shortage through the development of infrastructure intended to increase the water supply. However, the same author mentioned that federal institutions do not consider the social, cultural and economic conditions of one of the most populated regions of the country, i.e., Mexico City. The reason is that these measures are often implemented when the problems are already critical or when the situation is unsustainable. Mazari-Hiriart and Mazari-Menzer [16] and Salazar-Adams and Pineda-Pablos [17] agreed on the impact that the increase in the population of Mexico has had on the natural water availability. In 1950, the person availability was 17,742 m3 in this country, while in 2013, it decreased to 3982 m3 [18]. At the current rate of population growth, in 2030, the water availability will be reduced to 3783 m3 per person [18].
The cities of Pachuca and Mineral de la Reforma (Central Mexico) are located in the northern zone of the Cuautitlan-Pachuca aquifer, and their population shares the water pumped from it with the population of the metropolitan area of Mexico City. In accordance with Neri-Ramírez et al. [19], the recharge of this aquifer was 356.7 Hm3/year during 2009. In agreement with these authors, the average annual abatement of the static level during the past 40 years has been 2.1 m/year, which has reduced its recharge ability by 45%. The main reason for this problem is the growth of urban sprawl and the rapid land use change, which have reduced the capacity of infiltration. Galindo-Castillo et al. [20] pointed out that the northern part of this aquifer presents the greatest risk of overexploitation. In addition, the preservation of the hydrological resource represents a major challenge to the authorities of these two cities, because this aquifer is one of their main sources of water supply.
Amaya-Ventura [21] carried out an analysis of the water management system in these cities and found several problems at the administration level, leading to frequent shortages of the water supply. Nowadays, the same problems are still present. For example, it was necessary to limit the service some hours per day due to poor planning in the system of distribution and supply, which has not been modernized. This type of limited service represents up to 40% of the capacity of the service distributed to the population.
Due to the foregoing, there is an urgent need to propose strategies helping to lessen the problem of water shortage that the population of Pachuca and Mineral de la Reforma are currently facing. To this end, the objective of this paper is to propose an estimation through which users can select a rainwater harvesting system for non-drinking water consumption. Furthermore, depending on their catchment area, we calculated the amount of non-drinking water required (i.e., the water consumed by flush toilets or washing machines) that can be replaced with rainwater.

2. Description of the Study Area
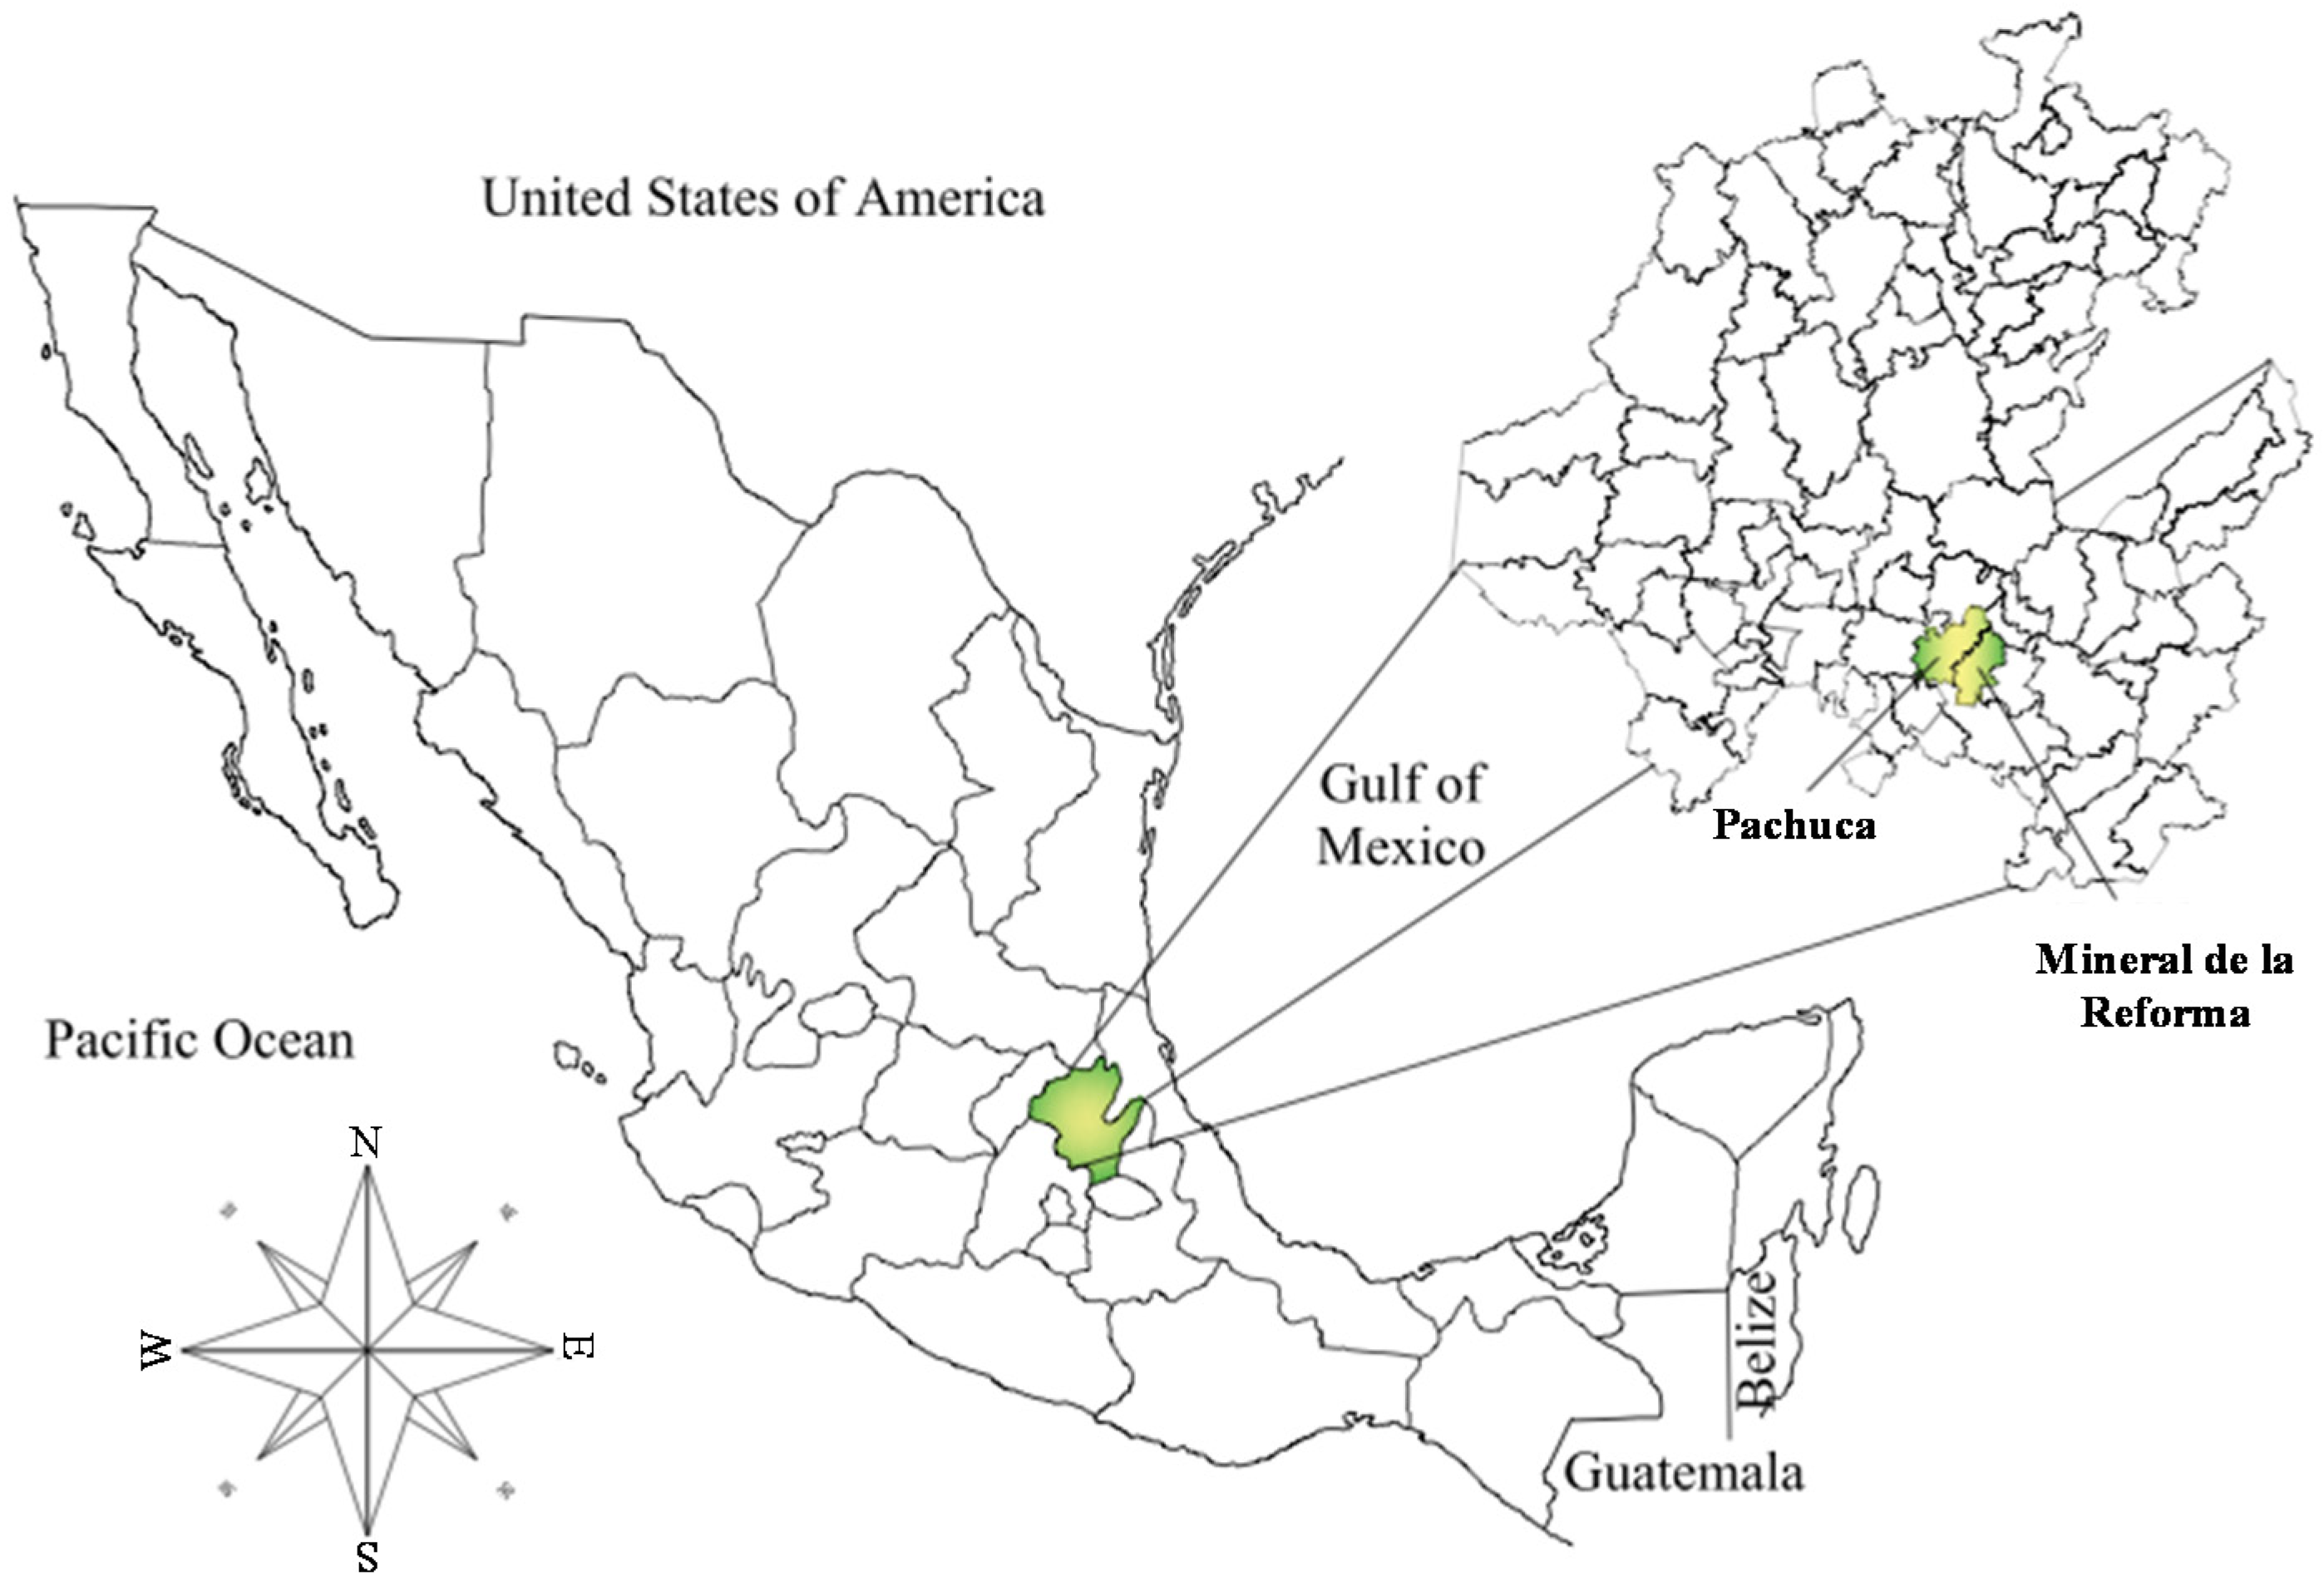
2.1. Location

Pachuca and Mineral de la Reforma are located in the south-central region of the State of Hidalgo, approximately 80 km to the north of the Mexico City metropolitan area. The city of Pachuca is placed between the coordinates 20°07′21″ north latitude and 98°44′09″ west longitude. The city of Mineral de la Reforma is located between the coordinates 20°08′08″ north latitude and 98°40′19″ west longitude (Figure 1). Due to its proximity, both cities share hydraulic infrastructure and the same local water supply system.
Figure 1. Location of the study area.
Water 07 04622 g001

2.2. Hydrology

The area of Pachuca-Mineral de la Reforma is located within the Pánuco Basin, regionally within the basin of Mexico, and internally in the sub-basin Río de las Avenidas [22]. The average natural availability of water (year 2013) was 152 m3/person. This availability corresponds to “water stress” [13]. Runoffs are predominantly of dendritic morphology and have their origin in the peaks of the Sierra of Pachuca. The most important surface runoff is known as Río de las Avenidas, which passes through the center of the city of Pachuca in the NE-SW direction. This river behaves as an intermittent stream during most of the year, although after extraordinary rainfalls, it becomes an important drain for the city.

2.3. Climate

In both locations, the average annual rainfall is 376.96 mm (1980–2013); the average temperature is 16 °C/year; and the rainy season occurs mainly from May to September [23].

2.4. Population and Drinking Water Service

The population densities of the cities of Pachuca and Mineral de la Reforma are 1371 and 1201.92 person/km2, respectively; both cities have an average annual growth rate of 2.16% and 8.48%, respectively; and total population is 267,862 and 105,870, respectively [24,25].
A total of 134,053 households having a drinking water supply was estimated in the study area. Among these, only 42% has a continuous service (24 h a day); the remaining 58% has a limited water supply, which can vary from a few hours a day throughout the week to only three times per week [25].

3. Materials and Methods

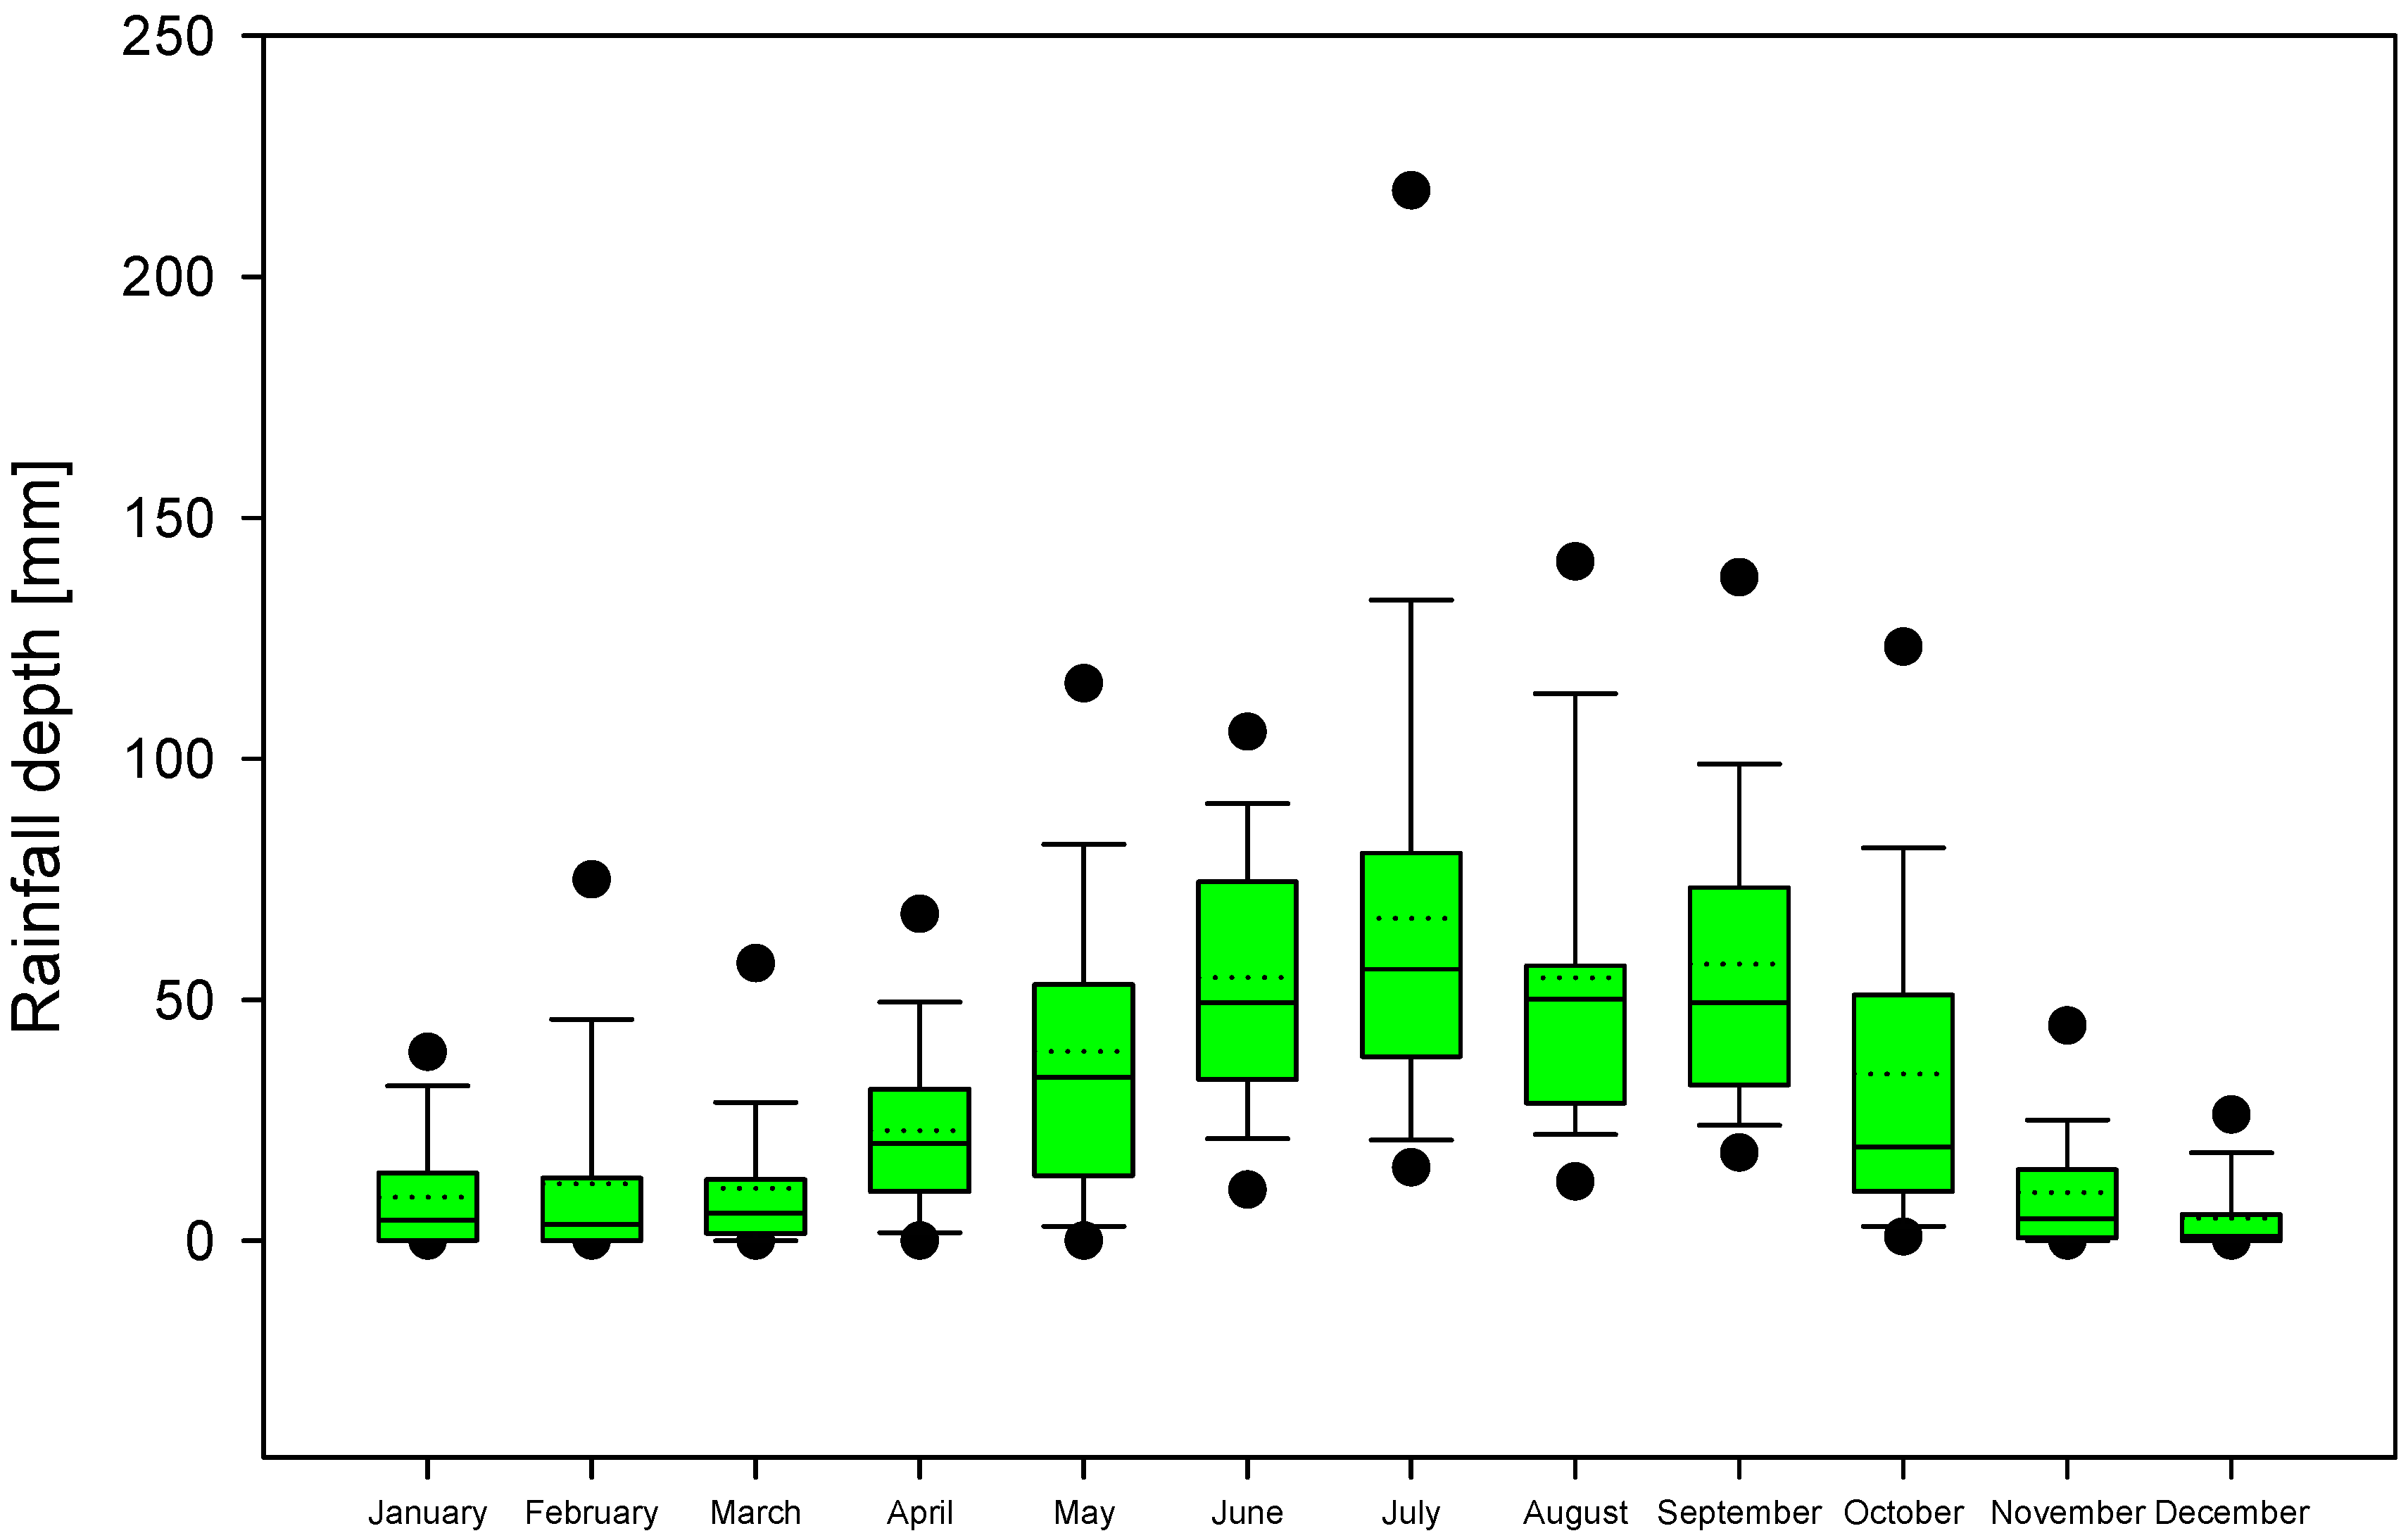
3.1. Temporary Distribution of Rainwater

To study the potential for rainwater harvesting from roof areas, daily, monthly and annual average rainfall data for the years 1980–2013 were analyzed [23]. From this period, the rainiest year was selected to estimate monthly rainwater harvesting (volume of rainwater (VR)). In addition, the main patterns of rain and drought during the studied period were identified. The intra-annual rainfall variation was determined through the coefficient of variation of the monthly rainfall (CVm) according to Aladenola and Adeboye [26] (Equation (1)):
C V m =   S v V a
where:
  • CVm is the coefficient of variation of the monthly rainfall;
  • Sv is the standard deviation of the monthly rainfall (mm);
  • Va is the mean of the monthly rainfall (mm).
Furthermore, a descriptive statistical analysis was applied to rainfall data to examine their central tendency (mean, asymmetry and variance), variability (standard deviation) and peakedness (kurtosis). We assumed the annual monthly maximum rainfall data as a normal distribution and considered a single-tailed test. This analysis was performed according to the methodology proposed by Ahammed et al. [27]. Standardization of data was performed in order to eliminate potential data redundancy and inconsistent dependencies in a historic record rainfall (1980–2013) based on Ahammed et al. [27].

3.2. Potential of Rainwater Harvesting and Water Demand per Household

The potential of monthly rainwater harvesting from rooftops (VR) at the household level was determined using the method proposed by Aladenola and Adeboye [27] (Equation (2)):
V R =   R × H r a × R c 1000
where:
  • VR is the monthly volume of rainwater harvested per household (m3);
  • R is the monthly rainfall depth (mm);
  • Hra is the household roof area (m2);
  • Rc is the runoff coefficient (without units) = 0.70. This value indicates a 30% loss.
For the design of the systems for rainwater harvesting and storage, United Nations Environment Programme (UNEP) [28] recommends considering the “first flush” by subtracting the first 0.50 mm of rainfall. Khastagir and Jayasuriya [7] and Su et al. [11] suggested subtracting the first 0.33 mm of the daily rainfall to improve of the quality of the water stored. For this study, the first 0.33 mm of rainfall were subtracted.
To determine the household roof area available for rainwater harvesting, we identified the main types of household prevailing in Mexico. The National Housing Federal Agency [29] classifies four types of household roof areas according to their socioeconomic level: (1) social (45 m2); (2) popular (50 m2); (3) middle residential (100 m2) and (4) residential (200 m2); see Table 1. Furthermore, it was taken into account that the roof material is usually concrete.
The average water consumption required in households (Wnc, m3/month) was calculated from Equation (3), according to Khastagir and Jayasuriya [7]:
W n c = ( W c p c   × n ) / 1000
where: Wcpc is the water consumption per person. According to the local water administration, this is 125 L/person/day [25]; n is the number of persons per household [29].
Table 1. Classification of the household type and average water consumption required (Wnc) per month [29]. Hra = household roof area, m2; n = number of person per household; Wnc = average water consumption required in households per month.
Hra (m2)nWnc (m3/month)
453.714.067
504.115.588
1004.517.109
2005.119.390
In addition to the household roof area (Hra), the average number of person per household (n) and the amount of water required for consumption per person per day (Wcpc), the average daily consumption of flush toilets and the average weekly consumption of washing machines considered as water-saving or ecological were estimated according to National Institute of Ecology and Climatic Change [30]. Both types of ecological device were selected because they represent an important consumption of water in any household and do not require drinking water for their operation. Furthermore, this is a simple practice to implement among the population. For this analysis, two scenarios were considered: (1) the minimum (Avcmin) and (2) the maximum (Avcmax) number of times per week that the flush toilets and the washing machine are used (Table 2).
Table 2. Average consumption of ecological devices (Avc) [29]. Avcmax = average maximum number of times; Avcmin = average minimum number of times.
Ecological DeviceConsumption in LAvcmaxAvcmin
Flush toilet4.8 L/flush8 flushes/day/person6 flushes/day/person
Washing machine70 L/load5 loads/week4 loads/week
From these data, water consumption was assessed weekly and monthly (over twelve months of the year) considering the separate use of the flush toilet and the washing machine, as well as the total consumption of the two ecological devices combined (the sum of flush toilet and washing machine consumptions). The basic monthly balance (m3/month) was estimated using the Equation (4):
W a = V R I v
where:
  • Wa is the available water (m3/month);
  • VR is the monthly volume of rainwater harvested from roof areas (m3);
  • Iv is the initial volume in storage that is equal to the monthly volume necessary for the flush toilet, washing machine and their combined use (m3).

4. Results and Discussion

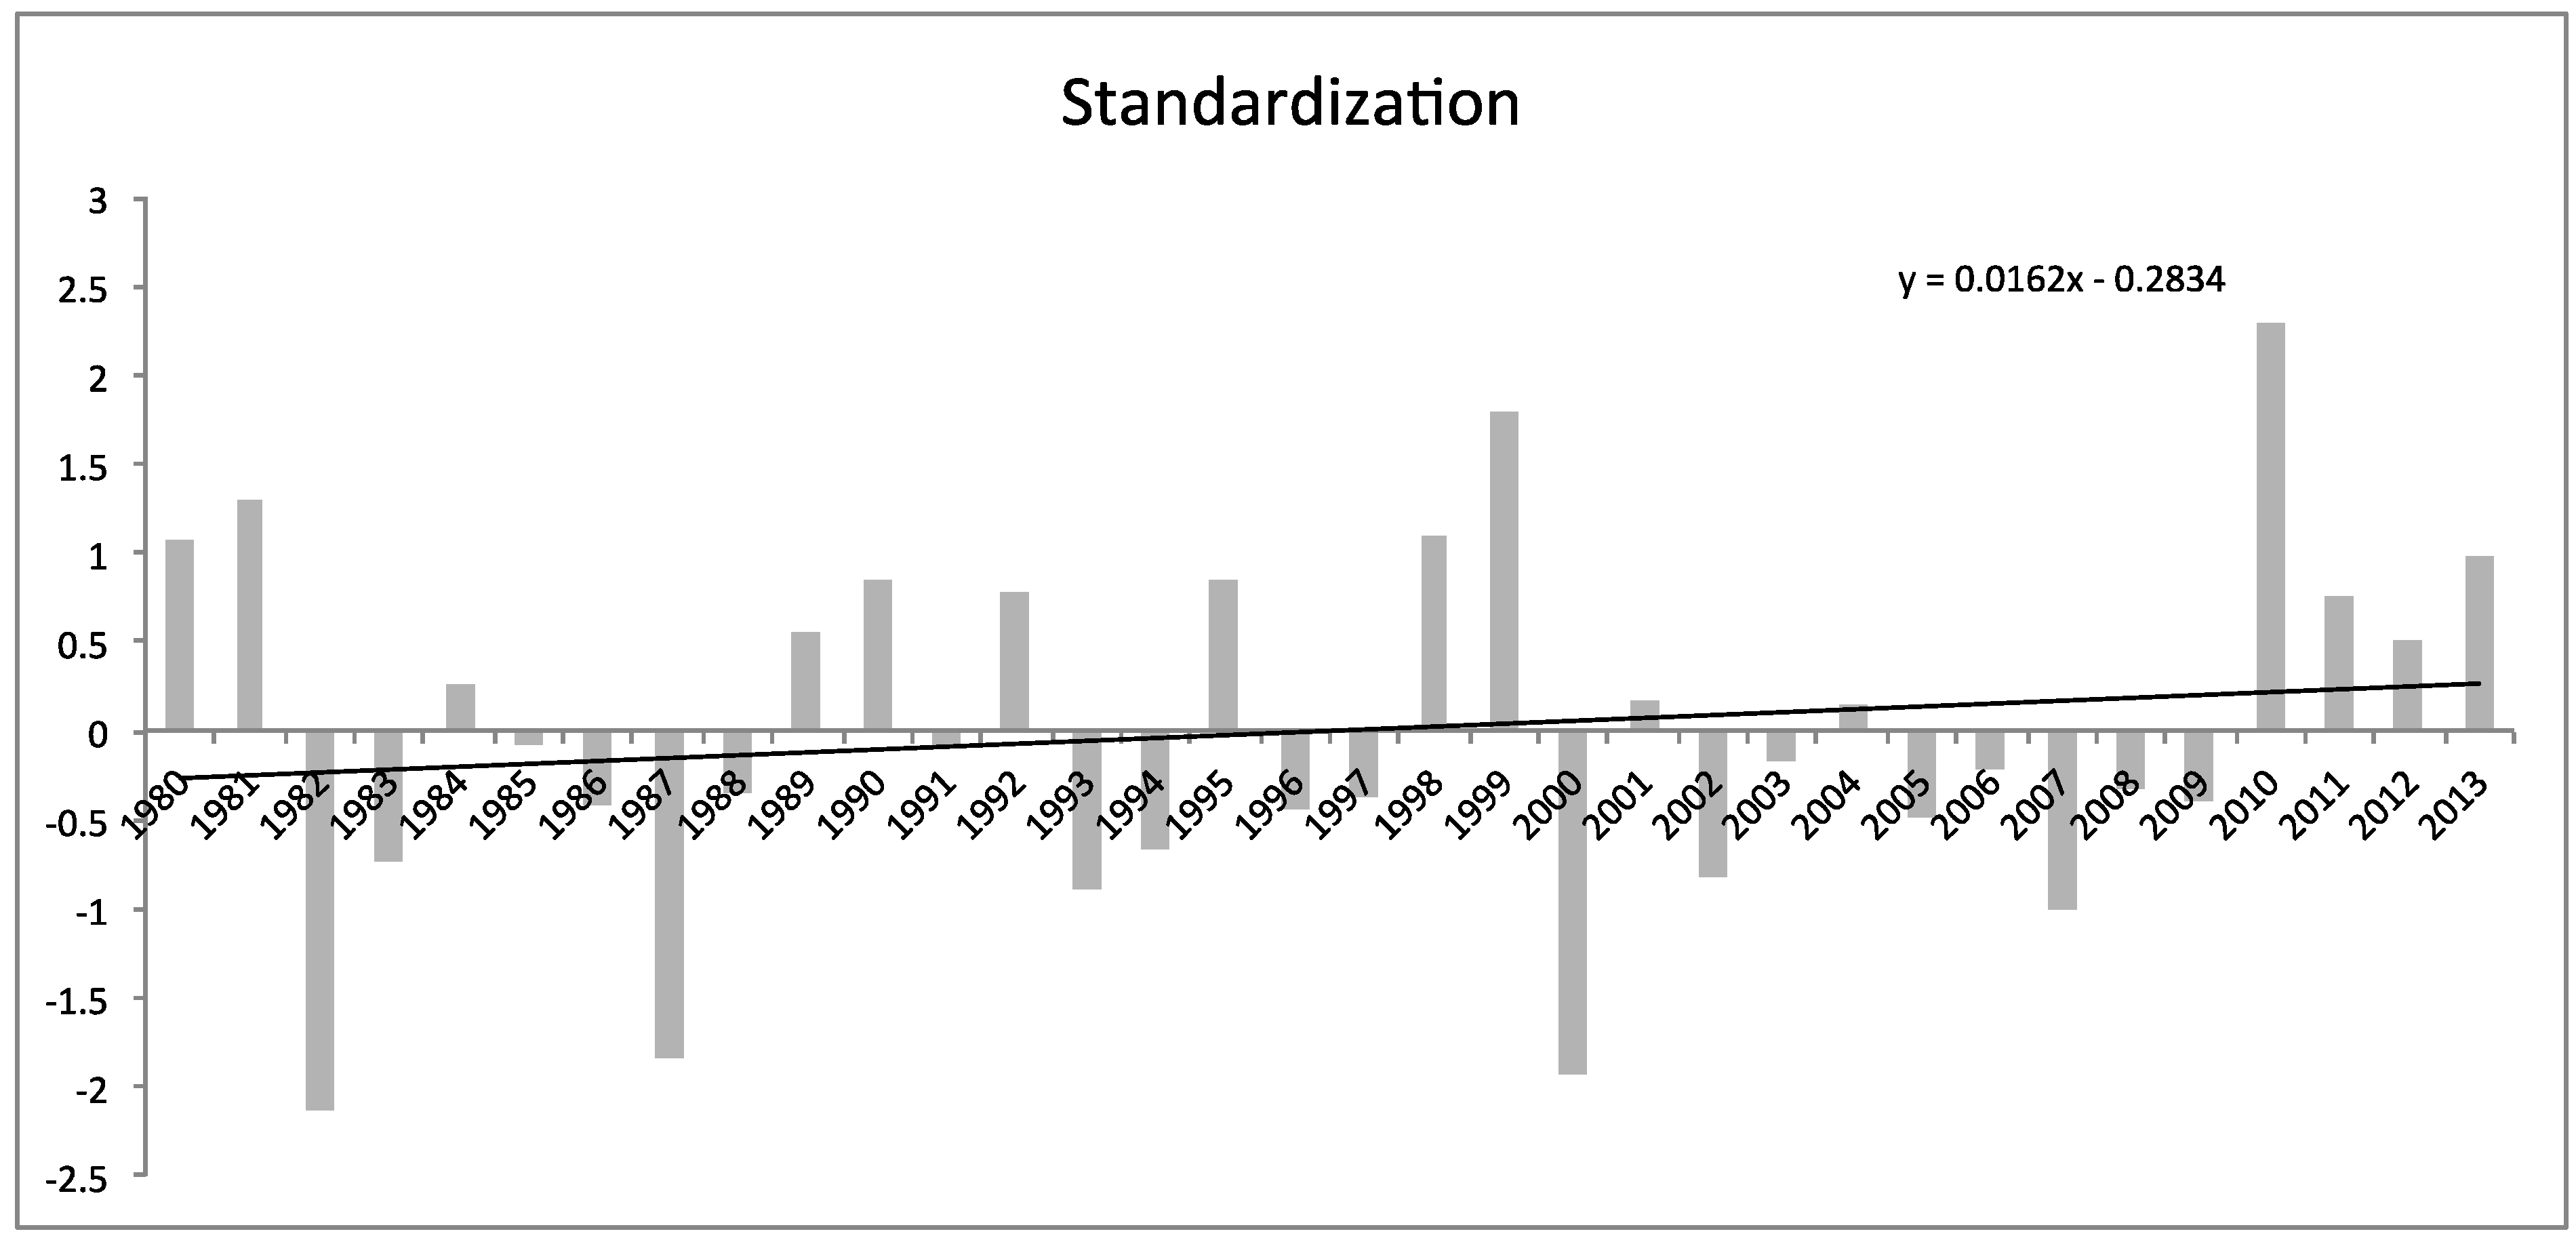
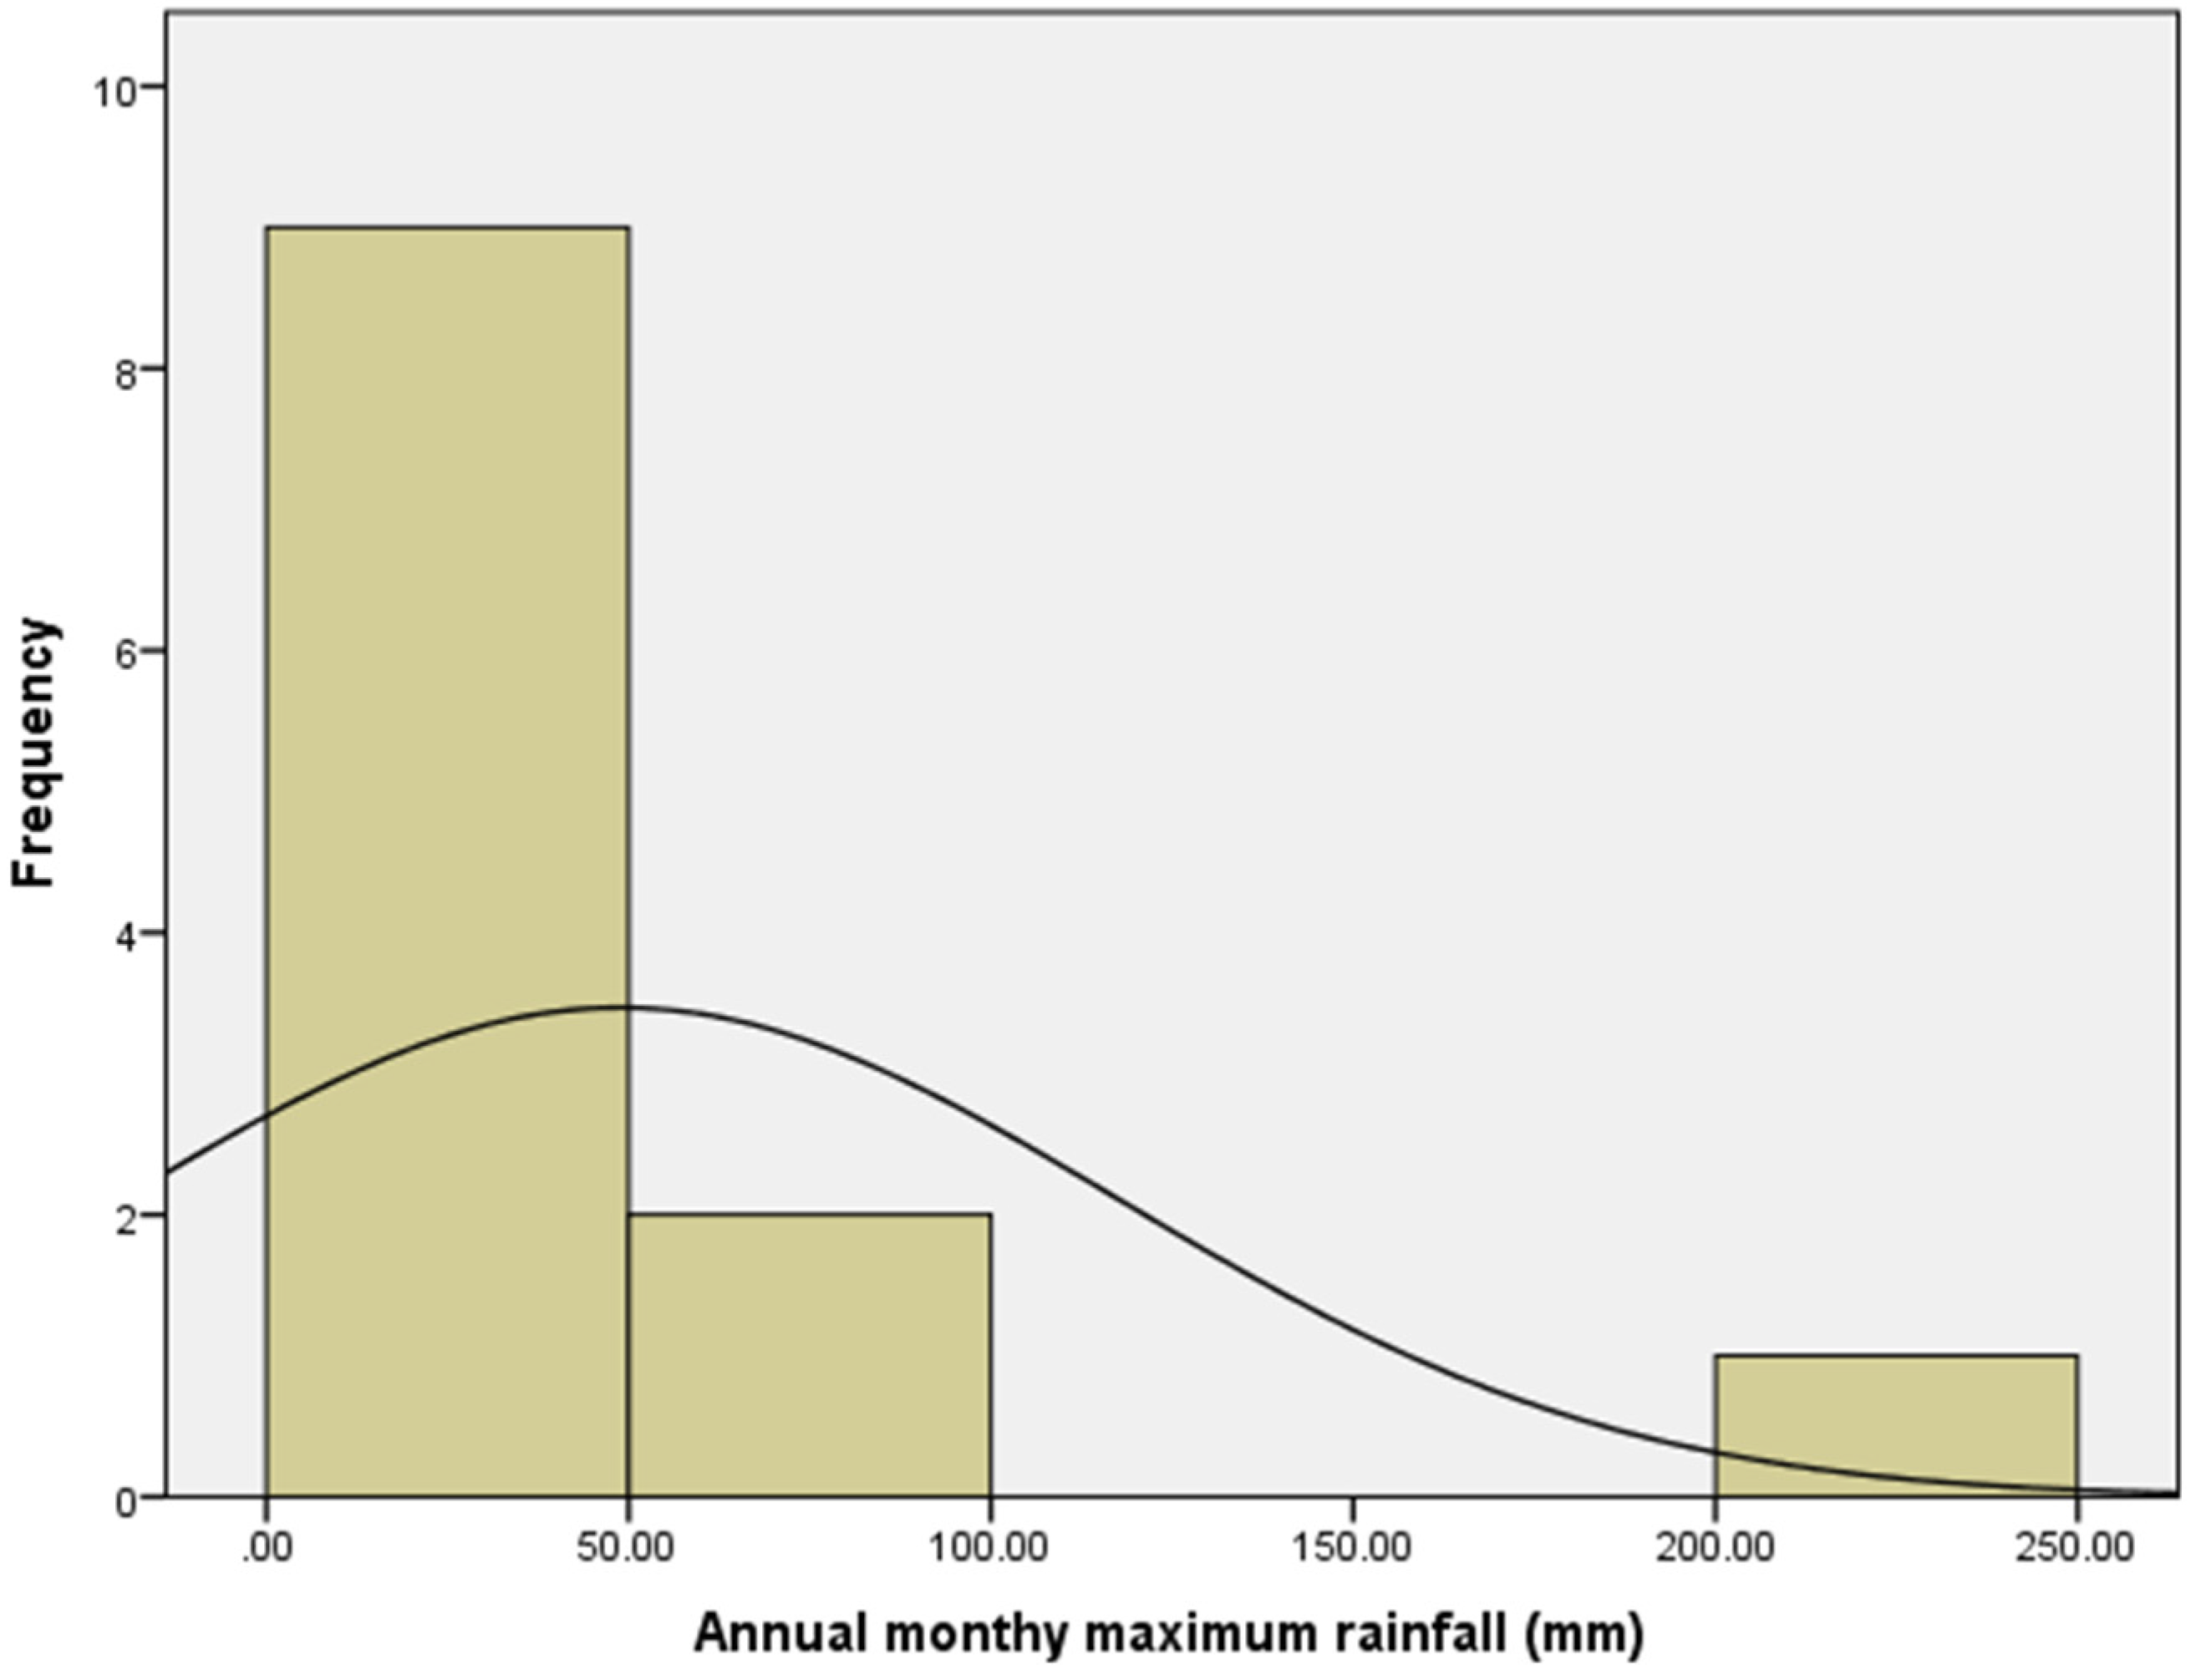
4.1. Rainfall Temporary Distribution

The bimodal rainfall pattern in the study area is shown in Figure 2. The highest variability occurs during the rainiest months (May–October), while months with the lowest variability are the driest (rainfall from 0 to 50 mm). Anaya-Garduño [31] mentioned that for every 100 mm of rainfall in catchment surfaces of 100 m2, it is possible to collect up to 10 m3. These observations indicate that the rainwater harvesting practice can be a good option to alleviate water supply deficiencies in the study area.
Figure 2. Monthly rainfall distribution. The dotted and continuous lines inside the boxes represent the mean and median values, respectively. The boundaries of the boxes represent the 25th and 75th percentiles. Error bars above and below the boxes indicate the 90th and 10th percentiles, respectively. The points represent the outline values measured for each month.
Water 07 04622 g002
The behavior of rainfall through the historical standardized period (1980–2013) shows the following: the standard deviation and variance values are one, and the kurtosis value is 0.149400907. These values indicate that in comparison to the normal distribution, the central peak is flatter and wider (Table 3).
Table 3. Descriptive statistics of the standardized rainfall pattern in the study area.
Annual Average Rainfall (mm)
Mean1.56737 × 10−16
Variance1
Asymmetry−0.030880758
Kurtosis0.149400907
Standard deviation1
The lowest average annual rainfall was recorded in 1982 (181.10 mm), whereas the highest average annual rainfall was recorded in 2010 (585.60 mm). The average rainfall for the historical period is 376.96 mm. The variability analysis through the historical period indicates that rainfall started to increase since 1997 to the present (Figure 3). If this tendency continues, it represents a good opportunity to implement an extensive rainwater harvesting system at the household level in order to save potable water through its substitution for some specific purposes (flush toilet, laundry, garden irrigation, among others). For this study, the rainiest year (2010) was selected to estimate monthly VR at the household level (Figure 4). The rainwater harvesting in areas with low precipitation (508 mm) has been demonstrated to have successful results by Villarreal and Dixon [6]. They identified that the volume of rainwater harvested from the roof area of a residential building would help to save a significant amount of drinking water, especially if also ecological or water-saving devices replaced the flush toilets. In other study, in Guanajuato, Central Mexico, United Nations Development Programme [13] developed a project in a small town with 455.3 mm of rainfall, and their results indicated that it is possible to store 2.5 m3 at the household level.
Figure 3. Standardized trend of the historical record of rainfall in mm based on Ahammed et al. [27]. Y axis: Frequency of rainfall events for the period 1980–2013.
Water 07 04622 g003
After the first 0.33 mm were subtracted from the daily rainfall in this study, the annual monthly variation (year 2010) was analyzed (Figure 3). The results from the analysis show a non-normal behavior, which indicates that during nine months of the year, the rainfall varies from 0 mm to 50 mm; two months per year present between 50 mm to 100 mm of rainfall; and only one month receives between 200 mm to 250 mm (Figure 4).
The intra-annual variation was calculated (CVm) and ranged between 0.50 and 1.73. This difference shows that there is a high variability in the rainfall distribution [26]. This high variability could reduce rainwater harvesting potential during the driest months; however, if there is water availability during the rainiest months, water can be saved and used further.
Figure 4. Histogram of annual monthly maximum rainfall data.
Water 07 04622 g004

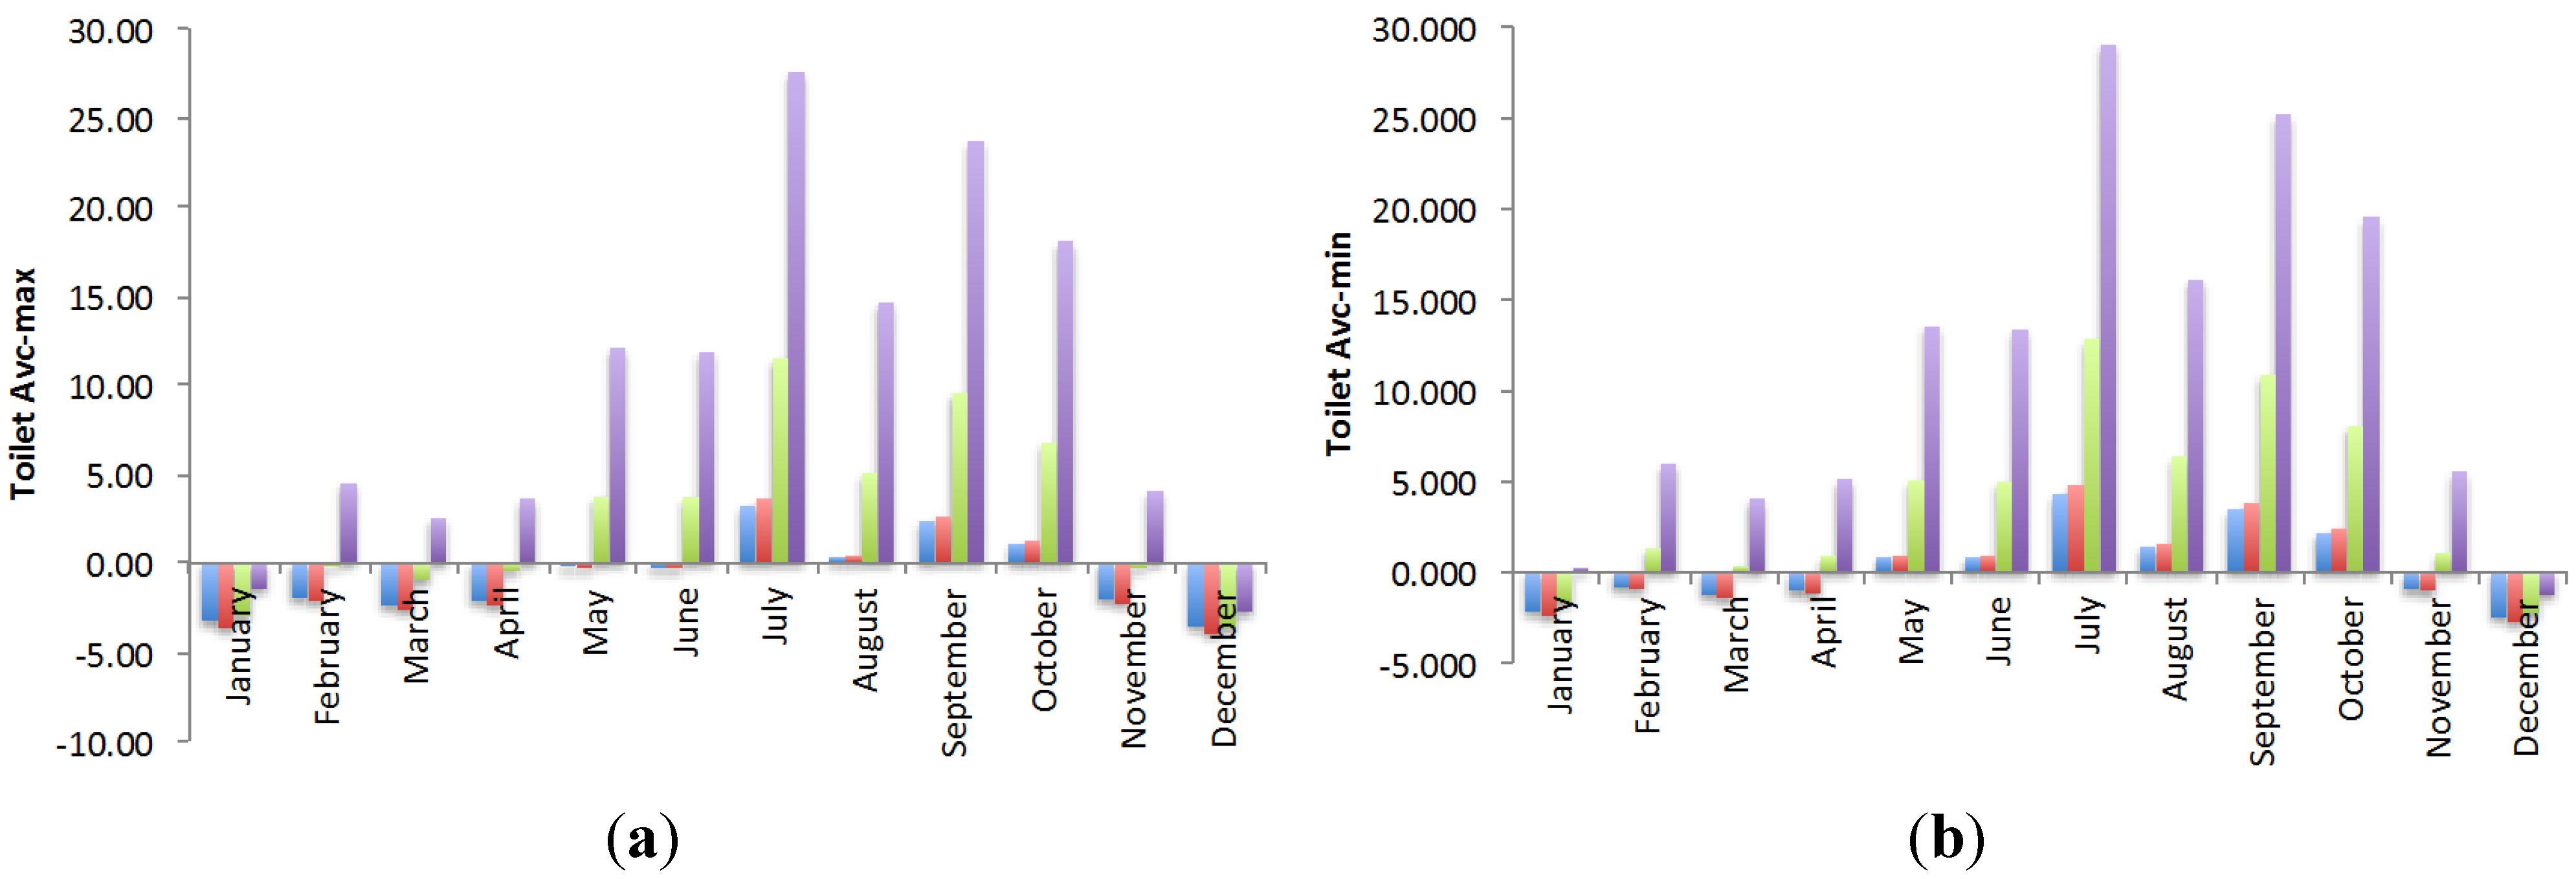
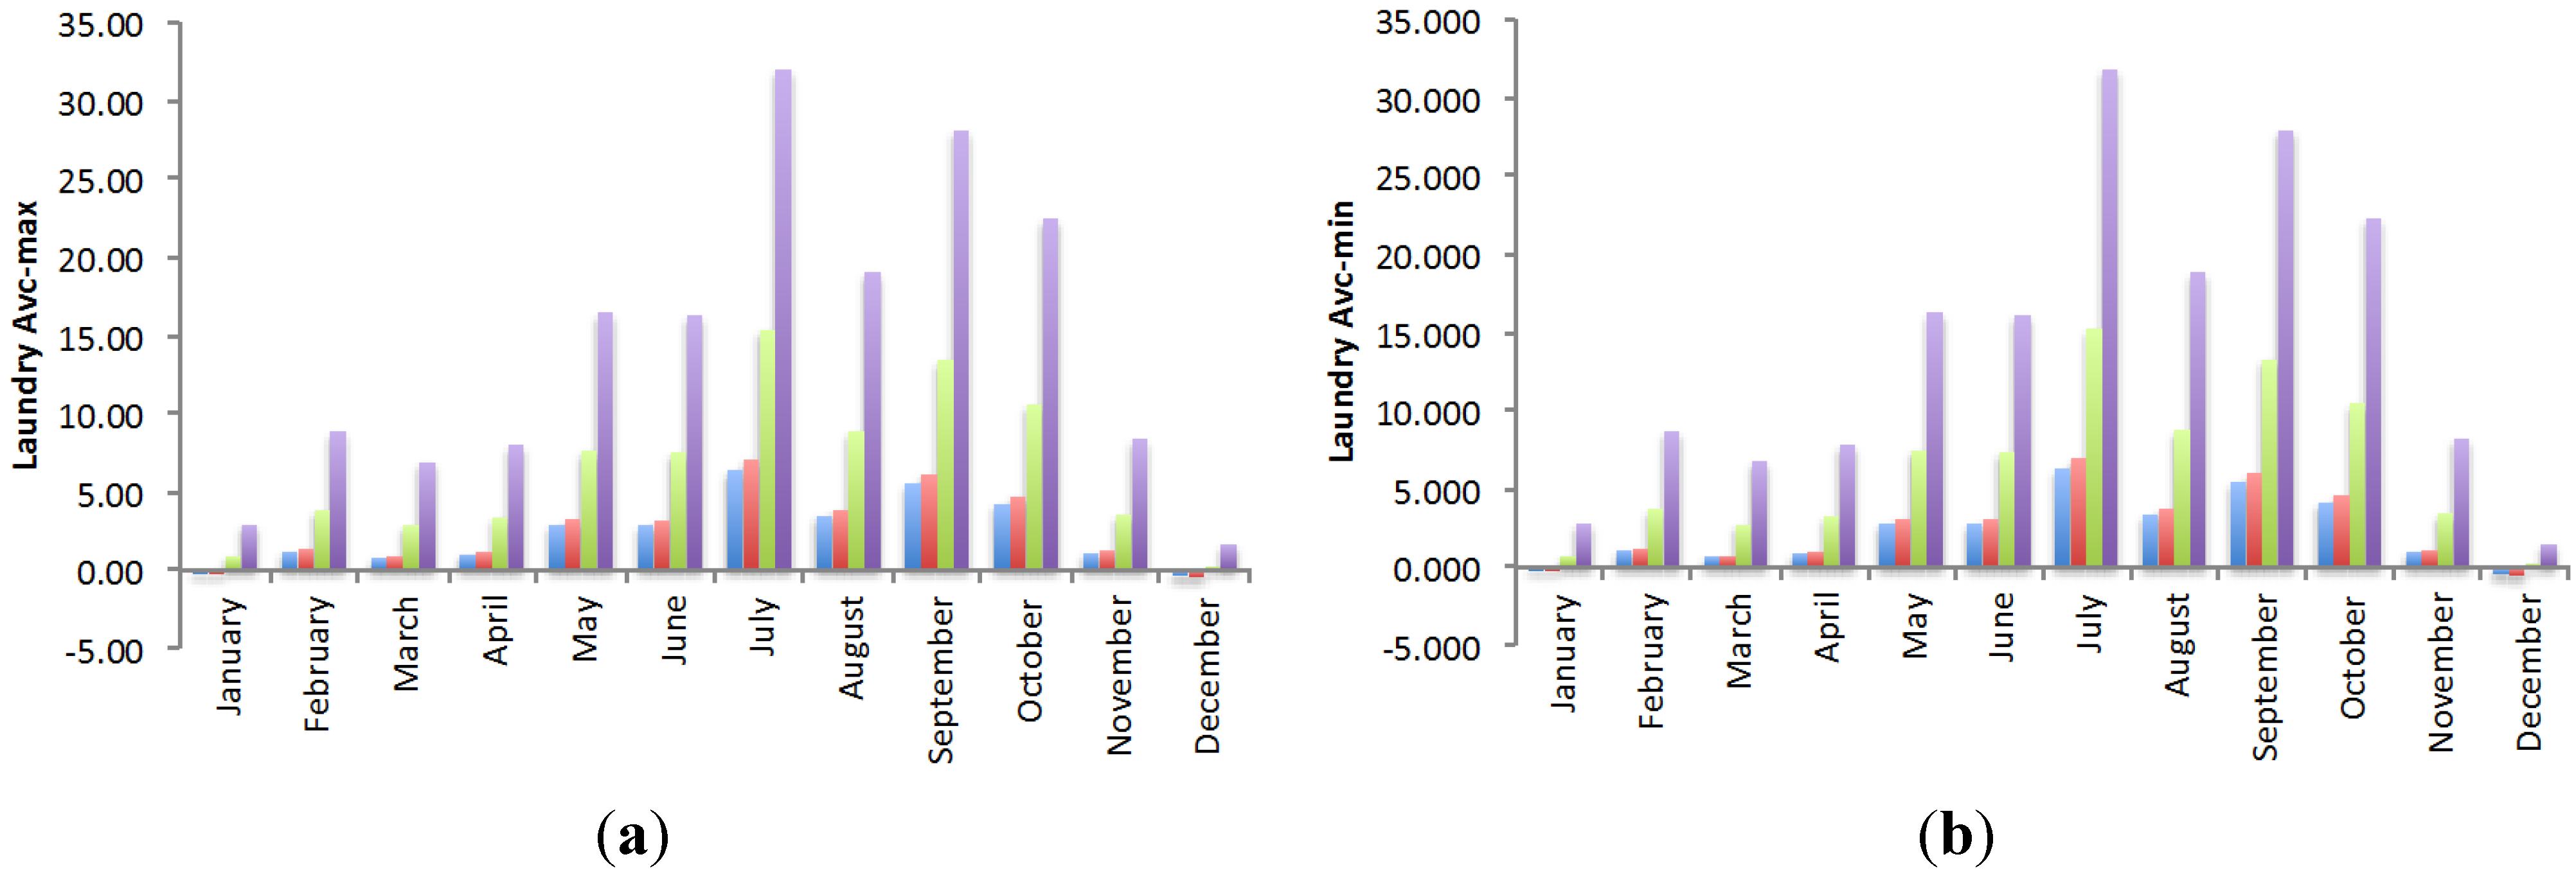
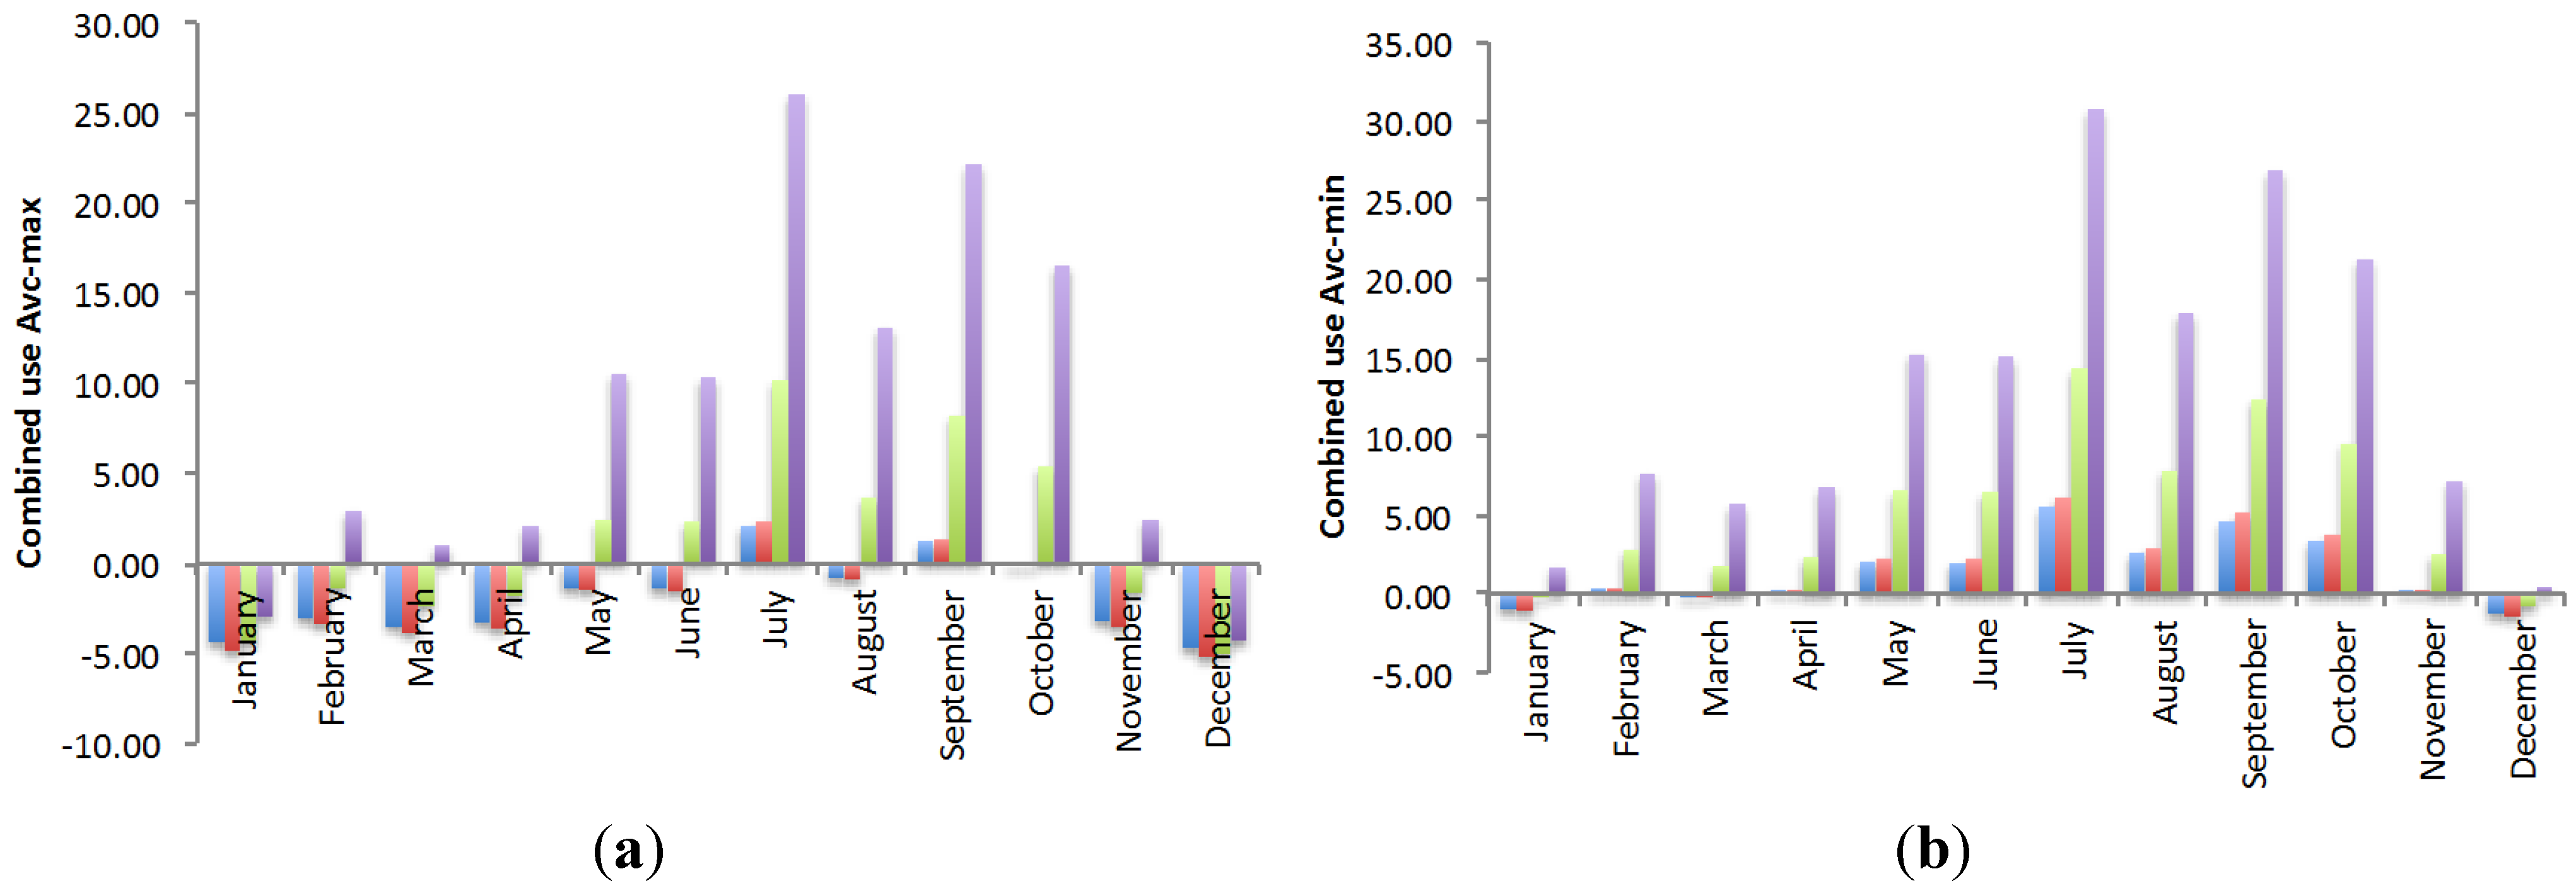
4.2. Potential of Rainwater Harvesting and Water Consumption per Household

The volume of rainwater harvestable from roof areas (VR, in m3) that could be collected monthly according to the type of household roof area (Hra) is listed in Table 4.
Table 4. Monthly volume of rainwater harvestable (VR, in m3) as a function of the household roof area (Hra = 45 m2, 50 m2, 100 m2 and 200 m2).
Month45 m250 m2100 m2200 m2
January1.0101.1222.2444.489
February2.3492.6105.21910.439
March1.9082.1204.2398.479
April2.1502.3894.7789.557
May4.0504.5008.99917.999
June4.0094.4548.90817.817
July7.5408.37816.75533.511
August4.6265.14010.28020.561
September6.6647.40514.80929.619
October5.4016.00112.00224.005
November2.2382.4874.9749.949
December0.7200.8001.6003.201
Table 4 shows that even during the months with less rainfall, it is still possible to harvest rainwater. For instance, in the driest month (December), it is possible to store a limited water volume (less than 1 m3), even in households with Hra of 45 m2 and 50 m2. However, this low volume of water harvested can be compensated by the water stored during the rainy season.
The volume of water required for flush toilets and washing machines, as well as for both uses combined (Table 5) was estimated considering the maximum and minimum consumption necessary for ecological devices (Avc, m3/month) (Table 2). Table 5 also shows the average water consumption required (Wnc, m3/month) for each type of household, which was calculated using Equation 3.
With regard to the water consumption required per month (Wnc) for each type of household, the maximum and minimum consumption of the ecological devices represent the following percentages with respect to the total consumption, respectively: (1) flush toilets (30.71% and 23.03%); (2) washing machine (8.79% and 7.99%); and (3) combined use (38.72% and 14.23%). Concerning the use of conventional flush toilet (6 L/flush) and laundry machine (120 L/load), the use of these ecological devices represents water savings up to 20% and 25% (maximum and minimum flush toilet volumes, respectively) and 97% and 43% (maximum and minimum washing machine volumes, respectively). In the case that rainwater harvesting at the household level was implemented, the water savings could contribute to alleviating the current problem of water scarcity that the population is facing.
Table 5. Maximum and minimum water consumption of ecological devices (Avc, m3/month) depending on the type of household roof area (Hra = 45 m2, 50 m2, 100 m2 and 200 m2).
Water Consumption of Ecological Devices45 m250 m2100 m2200 m2
Wnc (m3/month)14.0715.5917.1119.39
Toilet, Avcmax4.324.785.255.95
Toilet, Avcmin3.243.593.944.46
Washing machine, Avcmax1.231.371.501.70
Washing machine, Avcmin1.121.241.361.55
Combined use, Avcmax5.446.036.627.50
Combined use, Avcmin2.002.212.432.76
The volume of rainwater harvestable monthly from the roof area (VR) was compared to the water consumption necessary for the flush toilet (toilet, Avcmax; and toilet, Avcmin), washing machine (washing machine, Avcmax; and washing machine, Avcmin), as well as for combined use (combined use, Avcmax; and combined use, Avcmin). Figure 5, Figure 6 and Figure 7 depict the maximum and minimum consumption associated with the flush toilet, washing machine and the combined use of both ecological devices, respectively.
The balance between the rainwater harvesting volume collected from the roof area (VR) and the volumes of maximum consumption of flush toilets (toilet, Avcmax), indicate that during the months of December and January, there is no available water (Wa) in any type of household. For Hra of 200 m2, there is Wa for other uses from February–November; for Hra of 100 m2, there will be Wa only from May–October; while for Hra of 45 m2 and 50 m2, there will only be Wa for other uses than the flush toilet in the months of July, September and October (Figure 5).
It was also observed that during the months of November, January, February, March and April, the balance between the volume of rainwater harvested (VR) and the water used in the flush toilet (toilet, Avcmin) is negative, except for Hra of 200 m2. For Hra of 100 m2, there will be available water (Wa) from May to October; for Hra of 45 m2 and 50 m2, only during the months of July, September and October, there would be Wa after consumption from flush toilets (Figure 5).
Figure 5. Monthly balance of rainwater per household type (available water (Wa) in m3/month) after flush toilet (a) Toilet, Avcmax; (b) Toilet, Avcmin blue: Hra = 45 m2; red: Hra = 50 m2; green: Hra = 100 m2; purple: Hra = 200 m2).
Water 07 04622 g005
The maximum consumption for the washing machine (washing machine, Avcmax) for Hra of 200 m2 could be covered the entire year. Households with Hra of 100 m2, 50 m2 and 45 m2 could satisfy this need only from February to November. The months of December and January could be covered at 100% with the volume stored during the other months (Figure 6).
Figure 6. Monthly balance of rainwater per household type (Wa in m3/month) after washing machine consumption, (a) Laundry, Avcmax; (b) Laundry, Avcmin (blue: Hra = 45 m2; red: Hra = 50 m2; green: Hra = 100 m2; purple: Hra = 200 m2).
Water 07 04622 g006
The household roof area (Hra) of 200 m2 could satisfy the minimum consumption for the washing machine (washing machine, Avcmin) throughout the year, and it would provide a volume of available water (Wa) after the balance. The Hra of 100 m2 would yield Wa all year, except in December. For Hra of 50 m2 and 45 m2, all of their water consumption could be covered from February to November; the Wa stored during these months would be sufficient to cover the demand during the months of December and January (Figure 6).
In the case of the maximum combined consumption (combined use, Avcmax), for Hra of 200 m2, there would be an available water volume (Wa) from February to November; from May to October, volumes greater than 10 m3 could be stored, which would be enough to cover the volume necessary for the rest of the months. For Hra of 100 m2, there would be Wa from May to October; with the volume stored during those months, the requirements of the five other months of the year could be met. For Hra of 50 m2 and 45 m2, only during the rainiest months (July and September) could volumes of 1.22 m3 and 2.09 m3 be stored, which could be used partially for at least another month (Figure 7).
In the case of minimum combined consumption (combined use, Avcmin) for Hra of 200 m2, volumes (Wa) greater than 1 m3/month could be stored from January to November; while in the months of February, March, April and November, available volumes greater than 5 m3/month could be obtained. In May and June, Wa is higher than 15 m3/month, >30 m3/month in July, >17 m3/month in August, >25 m3/month in September and >20 m3/month in October. For Hra of 100 m2, water could be stored from February to November (between 1 m3/month and 14 m3/month). For Hra of 45 m2 and 50 m2, there is Wa from May to October (between 2 m3/month and 6 m3/month, respectively), sufficient to cover other months of the year (Figure 7).
Figure 7. Monthly balance of rainwater per household type (Wa in m3/month) after combined use (a) Combined use, Avcmax; (b) Combined use, Avcmin (blue: Hra = 45 m2; red: Hra = 50 m2; green: Hra = 100 m2; purple: Hra = 200 m2).
Water 07 04622 g007

4.3. Discussion

The harvesting of rainwater through its interception on rooftops represents an important option to take advantage of rainfall in places facing problems of water stress. In the study area of Pachuca-Mineral de la Reforma, with an average annual rainfall of 585.60 mm, the results obtained indicated the following:
If VR is utilized only for the maximum consumption of flush toilets (toilet, Avcmax), only in households with Hra of 100 m2 and 200 m2 would the needs all year round be met. If the consumption of the flush toilet is considered with the minimum volumes quantified (toilet, Avcmin), the four types of household analyzed cover 100% of their necessary consumption. In addition, there would be available water volumes (Wa) from 1 m3/month up to 135 m3/month to be used in other non-drinking uses throughout the year.
If the rainwater collected is solely used for laundry (washing machine, Avcmax; washing machine, Avcmin), 100% of the consumption of any type of household would be covered. In addition, there would be water volumes (Wa) from 28.9 m3/month to 171 m3/month, depending on the Hra, available for other non-potable purposes during the year.
On the other hand, if a maximum combined consumption (combined use, Avcmax) in flush toilets and washing machines is chosen in homes with Hra of 45 m2 and 50 m2, Wa to be stored during the period of drought only would cover 12.7% and 12.9%, respectively, of the necessary consumption in those months. In households with Hra of 100 m2, the Wa obtained during the rainy season is enough to cover the needs for the rest of the year, and there would be a Wa of 15 m3/month useful for other non-drinking purposes. Regarding the households with Hra of 200 m2, besides covering the maximum combined consumption (combined use, Avcmax) there would be spare available Wa of 98.55 m3/month, possibly enough to cover other non-drinking purposes throughout the year.
If a combined minimum consumption is selected (combined use, Avcmin), any type of Hra analyzed would cover its consumption throughout the year. In addition, they would have Wa from 18 m3/month (Hra of 45 m2) to 156 m3/month (Hra of 200 m2). In the latter type of household, with such an available volume, it is advisable to install a purification system, which would make this type of home almost completely independent of the public potable water supply. However, if rainwater harvesting is implemented in order to satisfy at least the volume consumption required for a combined use in flush toilets and washing machines, this alternative could be sufficient to reduce the problem of water shortage from which the population of the study area suffers.

5. Conclusions

This study confirms that rainwater harvesting on household roof areas is a viable option, even in arid areas, such as that studied in this paper, where the average annual rainfall is 585.6 mm.
By estimating the daily and monthly rainfall, it was possible to determine that harvestable volumes are sufficient to meet flush toilet consumption, washing machines, as well as their combined use throughout the year, depending on the household roof area (Hra). However, if daily or hourly rainfall data were used, these results could provide more accurate interpretations that would help to quantify the storage tank with reliability.
However, households with roof areas of (Hra) 45 m2 and 50 m2 still depend on the water supply system of the public network during part of the year. On the other hand, in households with roof areas (Hra) of 100 m2 and 200 m2, besides covering the consumption of flush toilets and washing machines throughout the year, harvested rainwater still might be stored to meet other needs. Even the drinking use of this water is feasible, but proper treatment systems must be installed.
Therefore, it can be concluded that it is possible to establish indicators that help users to estimate the minimum capacity necessary for installing a storage system in their homes. In addition, it is recommended that the users take into account that, for the installation of the storage system, they must have filters that separate the organic matter and the dust that may accumulate on the roof area. In the case of the Hra of 100 m2 and 200 m2, it is also recommended to consider commercial systems for drinking water purification at the household level.

Acknowledgments

The first author thanks Carlos Alexander Lucho Constantino for the descriptive statistical analysis. The authors thank the four anonymous reviewers for their timely review and helpful comments.

Author Contributions

Liliana Lizárraga-Mendiola proposed the conceptual framework of the paper, carried out the data analysis and prepared the first draft of the paper. Gabriela Vázquez-Rodríguez checked the first draft of the paper and results and enhanced the discussion and writings of the paper. Alberto Blanco-Piñón reviewed bibliography related with rainwater harvesting. Yamile Rangel-Martínez analysed the national household classification and water consumption. María González-Sandoval reviewed the methods proposed and the final version of the paper.

Conflicts of Interest

The authors declare no conflict of interest.

References

  1. Willuweit, L.; O’Sullivan, J.J. A decision support tool for sustainable planning of urban water systems: Comes across the dynamic urban water simulation model. Water Res. 2013, 47, 7206–7220. [Google Scholar] [CrossRef] [PubMed]
  2. Belmeziti, A.; Coutard, O.; de Gouvello, B. A new methodology for evaluating potential for potable water savings (PPWS) by using rainwater harvesting at the urban level: The case of the municipality of Colombes (Paris Region). Water 2013, 5, 312–326. [Google Scholar] [CrossRef]
  3. African Development Bank. Rainwater Harvesting Handbook: Assessment of Best Practices and Experience in Water Harvesting; African Development Bank: Abidjan, Côte d’Ivoire, 2008. [Google Scholar]
  4. Sapkota, M.; Arora, M.; Malano, H.; Moglia, M.; Sharma, A.; George, B.; Pamminger, F. An overview of hybrid water supply systems in the context of urban water management: Challenges and opportunities. Water 2015, 7, 153–174. [Google Scholar] [CrossRef]
  5. Liaw, C.H.; Chiang, Y.C. Dimensionless analysis for designing domestic rainwater harvesting systems at the regional level in northern Taiwan. Water 2014, 6, 3913–3933. [Google Scholar] [CrossRef]
  6. Villarreal, E.L.; Dixon, A. Analysis of a rainwater collection system for domestic water supply in Ringdansen, Norrköping, Sweden. Build. Environ. 2005, 40, 1174–1184. [Google Scholar] [CrossRef]
  7. Khastagir, A.; Jayasuriya, N. Optimal sizing of rain-water tanks for domestic water conservation. J. Hydrol. 2010, 381, 181–188. [Google Scholar] [CrossRef]
  8. Imteaz, M.A.; Adeboye, O.B.; Rayburg, S.; Shanableh, A. Rainwater harvesting potential for southwest Nigeria using daily water balance model. Resour. Conserv. Recycl. 2012, 62, 51–55. [Google Scholar] [CrossRef]
  9. Imteaz, M.A.; Ahsan, A.; Shanableh, A. Reliability analysis of rainwater tanks using daily water balance model: Variations within a large city. Resour. Conserv. Recycl. 2013, 77, 37–43. [Google Scholar] [CrossRef]
  10. Rahman, A.; Keane, J.; Imteaz, M.A. Rainwater harvesting in greater Sydney: Water savings, reliability and economic benefits. Resour. Conserv. Recycl. 2012, 61, 16–21. [Google Scholar] [CrossRef]
  11. Su, M.D.; Lin, C.H.; Chang, L.F.; Kang, J.L.; Lin, M.C. A probabilistic approach to rainwater harvesting systems design and evaluation. Resour. Conserv. Recycl. 2009, 53, 393–399. [Google Scholar] [CrossRef]
  12. Jones, M.P.; Hunt, W.F. Performance of rainwater harvesting systems in the Southeastern United States. Resour. Conser. Recycl. 2010, 54, 623–629. [Google Scholar] [CrossRef]
  13. United Nations Development Programme (UNDP). Pilot Deployment of Harvesting of Rain-Water, as a Measure of Adaptation to Climate Change; University of Guanajuato: Guanajuato, Mexico, 2013. [Google Scholar]
  14. Lluvia Para Todos: Por un Mexico Sustenable en Agua. Available online: http://islaurbana.mx/contenido/biblioteca/presentaciones/IslaUrbana-CaptaciondeLluvia.pdf (accessed on 10 March 2015). (In Spanish)
  15. Water Management in the Metropolitan Area of Mexico City: The Hard Way to Learn. Available online: http://hydrologie.org/ACT/Marseille/works-pdf/wchp5-3.pdf (accessed on 3 April 2015).
  16. Mazari-Hiriart, M. Water Latin America. Inter-American Association of Sanitary and Environmental Engineering (AIDIS). Available online: http://www.preventionweb.net/english/professional/contacts/v.php?id=3650 (accessed on 23 June 2015).
  17. Salazar-Adams, A.; Pineda-Pablos, N. Factors that affect the water demand for domestic use in Mexico. Reg. Soc. 2010, 49, 3–16. [Google Scholar]
  18. Estadísticas del Agua en México. Available online: http://www.conagua.gob.mx/CONAGUA07/Publicaciones/Publicaciones/EAM2014.pdf (accessed on 2 February 2015). (In Spanish).
  19. Neri-Ramírez, E.; Rubiños-Panta, J.E.; Palacios-Velez, O.L.; Oropeza-Mota, J.L.; Flores-Magdaleno, H.; Ocampo-Fletes, I. Evaluation of the sustainability of the aquifer Cuautitlan-Pachuca through the use of the MESMIS methodology. Chapingo Mag. 2013, 19, 273–285. [Google Scholar]
  20. Galindo-Castillo, E.; Otazo-Sanchez, E.M.; Gordillo-Martínez, A.J.; Arellano-Islas, S.; González-Ramírez, C.A.; Reyes-Gutierrez, L.R. Impact, technology and environmental toxicology. In Depletion of the Aquifer Cuautitlan-Pachuca: Water Balance 1990–2010; Universidad Autónoma del Estado de Hidalgo: Pachuca, Mexico, 2011. [Google Scholar]
  21. Amaya-Ventura, M.L. Institutional aspects of water management in Pachuca, Hidalgo. Mex. J. Soc. 2011, 73, 509–537. [Google Scholar]
  22. Huizar-Álvarez, R. Hydrogeological map of the Río de las Avenidas basin in Pachuca, Mexico. Invest. Geogr. Geol. Inst. Bull. 1993, 27, 95–131. [Google Scholar]
  23. National Water Comission-Meteorological National Service. Available online: http://smn.cna.gob.mx (accessed on 8 December 2014).
  24. Consejo Estatal de Población de Hidalgo. Available online: http://www.conapo.gob.mx/es/CONAPO/Hidalgo (accessed on 31 January 2015). (In Spanish)
  25. Comisión De Agua Y Alcantarillado De Sistemas Intermunicipales. Available online: http://caasim.hidalgo.gob.mx (accessed on 12 November 2014). (In Spanish)
  26. Aladenola, O.O.; Adeboye, O.B. Assessing the potential for rainwater harvesting. Water Resour. Manag. 2010, 24, 2129–2137. [Google Scholar] [CrossRef]
  27. Ahammed, F.; Alankarage-Hewa, G.; Argue, J.R. Variability of annual daily maximum rainfall of Dhaka, Bangladesh. Atmos. Res. 2014, 137, 176–182. [Google Scholar] [CrossRef]
  28. United Nations Environment Programme. Potential for Rainwater Harvesting in Africa: A GIS Overview. Available online: http://www.unep.org/pdf/RWH_in_Africa-final.pdf (accessed on 8 January 2015).
  29. Secretaria de Desarrollo Agrario, Territorial Y Urbano. Available online: http://www.conavi.gob.mx/images/documentos/plan_nacional_desarrollo_2013/2014/programa_nacional_de_vivienda_2014-2018.pdf (accessed on 2 December 2014). (In Spanish)
  30. National Institute of Ecology and Climatic Change. Sustainable Household. Habits and Bathroom Technologies. Available online: http://www.inecc.gob.mx (accessed on 8 January 2015).
  31. Anaya-Garduño, M. Rainwater Harvesting. Solution Fall from Heaven; National Institute of Ecology and Climatic Change: Mexico City, Mexico, 2011. [Google Scholar]

