Article

Roles of N:P Ratios on Trophic Structures and Ecological Stream Health in Lotic Ecosystems

Department of Bioscience and Biotechnology, Chungnam National University, Daejeon 305-764, Korea
*
Author to whom correspondence should be addressed.
Water 2016, 8(1), 22; https://doi.org/10.3390/w8010022
Submission received: 2 November 2015 / Revised: 23 December 2015 / Accepted: 7 January 2016 / Published: 16 January 2016

Abstract

:
Little is known about the functions of N:P ratios in determining trophic structures and ecological health in lotic ecosystems, even though N:P ratios have been frequently used as a stoichiometric determinant in ambient water for trophic allocation of low-level organisms such as phytoplankton or zooplankton. In this study, nutrients (N, P) and sestonic chlorophyll (CHL) from 40 different streams in the Geum-River watershed were measured from 2008 to 2011. Fish compositions and stream health were also assessed, based on the multi-metric modeling of an index of biological integrity. Land use patterns in these watersheds were a key factor regulating nutrient contents and N:P ratios in ambient water, and also influenced empirical relationships between N:P ratios (or nutrients) and sestonic CHL. Land use patterns in forested, urban and wastewater treatment plant regions were associated with significant differences in stream N:P ratios, and the ratios were mainly determined by phosphorus. Sestonic CHL was significantly correlated with nutrient level (N, P); the ratios had a positive linear relationship with the proportion of omnivores, and a negative relationship with the proportion of insectivores. A similar trend in the N:P ratios was observed in indicator fishes such as N. koreanus and Z. platypus. Overall, the N:P ratio may be a good surrogate variable of ambient concentrations of N or P in assessing trophic linkage and diagnosing the ecological stream health in aquatic ecosystems.

1. Introduction

During the past two decades, nutrient regime of nitrogen (N) or phosphorus (P) in freshwater ecosystems is one of the most important factors regulating the ecosystem production and biological diversity [1,2]. Thus, the concept of nutrient loading as a factor controlling trophic state has been a key theory in numerous studies of aquatic ecosystems [3]. Furthermore, the importance of 16N:1P molar ratios as well as ambient nutrient concentrations in aquatic ecosystems [4], and suggested their key roles in primary production, nutrient cycling, resource competition, and animal growth in the systems, in spite of partial limitation on biological unavailability of some forms of nutrients. The various roles of N:P ratios, therefore, have been frequently tested in various trophic linkages as criteria of nutrient limitation on phytoplankton growth (i.e., bluegreens; Smith [5]), invertebrate compositions [6], consumer-resource [7], and fish trophic guilds [8,9], and the ecological stream health [8]. In other words, the N:P ratios determined the production of primary producers [10], and this influenced the compositions and guilds in the higher trophic consumers. The ratios of N:P are associated with differences in biotic components between ecosystems and are closely linked with land use activities [11]. Therefore, these ratios have been used as a stoichiometric determinant in ambient water for trophic allocation of low-level organisms [5,12] through to higher trophic level organisms [6,7,9]. Previous studies on lotic ecosystems have demonstrated that the complexity of the in-stream environment is largely influenced by land use patterns within the watershed. Wastewater disposal plants and urban runoff or cropland, as significant non-point or point sources, increase N and P enrichment in stream and river environments [13,14], resulting in an alteration of mass N:P ratios in ambient water [15].
Rapid industrialization and dense industrial complexes have caused chemical pollution and habitat disturbances in urban regions, along with intense agricultural activities. Wastewater treatment plants (WTPs) are needed to reduce nutrient (N, P) and organic matter discharge from urban polluted water [16]. Haggard et al. [17] and Ekka et al. [18] demonstrated that the most significant sources of N and P are point-sources of WTPs, even though nutrient contents vary largely depending on the treatment methods of effluents [16,19]; furthermore, the effluents may directly or indirectly influence chemical pollution and biological disturbances downstream in the watershed [20]. Under these conditions, nitrogen and phosphorus levels are generally high [18,21] and the N:P ratios are relatively low in stream and river ecosystems. For this reason, a low N:P ratio may be a good surrogate variable of ambient concentrations of N or P in diagnosing and assessing anthropogenic nutrient pollution and eutrophication in lentic [22] and lotic ecosystems [15].
N:P ratios have also been used as ecological indicators to identify how aquatic organisms are regulated by N:P stoichiometry, through thresholds and spectrums. Redfield [23] found that the stoichiometric threshold for phytoplankton growth was identified as 16N:1P molar ratio, which is frequently considered to be a trophic interaction from an ecological perspective. Numerous studies on lentic ecosystems [24,25,26,27] have demonstrated that N:P ratios are a key index of nitrogen or phosphorus limitation in algal populations. However, these stoichiometric thresholds vary according to N-limitation and P-limitation criteria in aquatic ecosystems [10,28], as frequently shown by actual field data. Despite regional and seasonal variations in stoichiometric indices of the N:P ratio, it has been used to determine the abundance of specific taxa and trophic levels in the food chain [12,29,30]. Typical examples of N:P ratios are shown by bluegreen algae dominance when the ratios drop below 30 [5], and by empirical models of bluegreen algae [31]. Similarly, specific taxa of lotic periphyton [12] are regulated directly by N and P stoichiometry, and aquatic biota is associated with specific optimal N:P ratios [32]. Within high trophic organisms, their growth and abundance may be affected by stoichiometric N:P ratios as well as by absolute ambient nutrients; furthermore, N:P ratios may determine the food quality of aquatic insects [7] and fishes [8,9]. These studies have shown that trophic interactions, in functional taxa at the species level, are related to specific N:P ratios in aquatic environments. The trophic dynamic concept [33] has been used to demonstrate bioavailable energy and nutrient transfers to higher trophic organisms, representing both specific trophic interactions and the effects of community on aquatic ecosystems; however, the role of N:P ratios is unknown in the context of trophic interactions. Despite the importance of N:P ratios in terms of trophic linkages within the food chain/web of aquatic ecosystems, little is known about the effects of trophic compositions and fish tolerance on the range of N:P ratio values in ambient stream water [8].
Aquatic environmental stressors such as nutrients and N:P ratios may affect aquatic biota of low trophic levels and/or higher trophic level organisms and their stoichiometry, and are regarded as being among the most important regulating factors of stream ecosystems [8]. The nutrient regime regulates various fish compositions and their abundance in aquatic ecosystems [34], and these parameters may be closely associated with the eutrophication processes of N or P, and with N:P ratios. Primary productivity, regulated by the N or P contents and N:P ratios, increased as fish abundance increased [35] or decreased [36], depending on the regional scale and fish species. Tolerance, or trophic levels of fish related to nutrient regimes, has been used to assess stream conditions ranging from pristine to polluted [35]. Conventional criteria of fish tolerance (divided into three categories: sensitive, intermediate, and tolerant species [37,38]) are closely associated with eutrophication in water bodies, which are judged according to N or P contents or N:P ratios [8,39]. Noble et al. [40] demonstrated that the trophic compositions of fish were affected by their available food items and feeding habitats, and that changes in nutrient regimes or N:P ratios may modify the proportions of insectivorous and omnivorous fish due to changes in their feeding resources (in accordance with water chemistry [8,40]). These findings suggest that nutrients and stoichiometric N:P ratios may alter species compositions, tolerance level, and trophic compositions in aquatic ecosystems.
The objectives of this study were to assess the influence of land use patterns on nutrient contents and N:P ratios in stream ecosystems, and to determine the empirical relationships between N:P ratios and nutrients (total phosphorous; TP) and sestonic algal biomass (chlorophyll-a; CHL). Furthermore, the influence of the chemical regime on stoichiometric N:P ratios was elucidated by analyzing trophic composition and fish tolerance, and the fish bio-indicators of pollution, in lotic ecosystems.

2. Materials and Methods

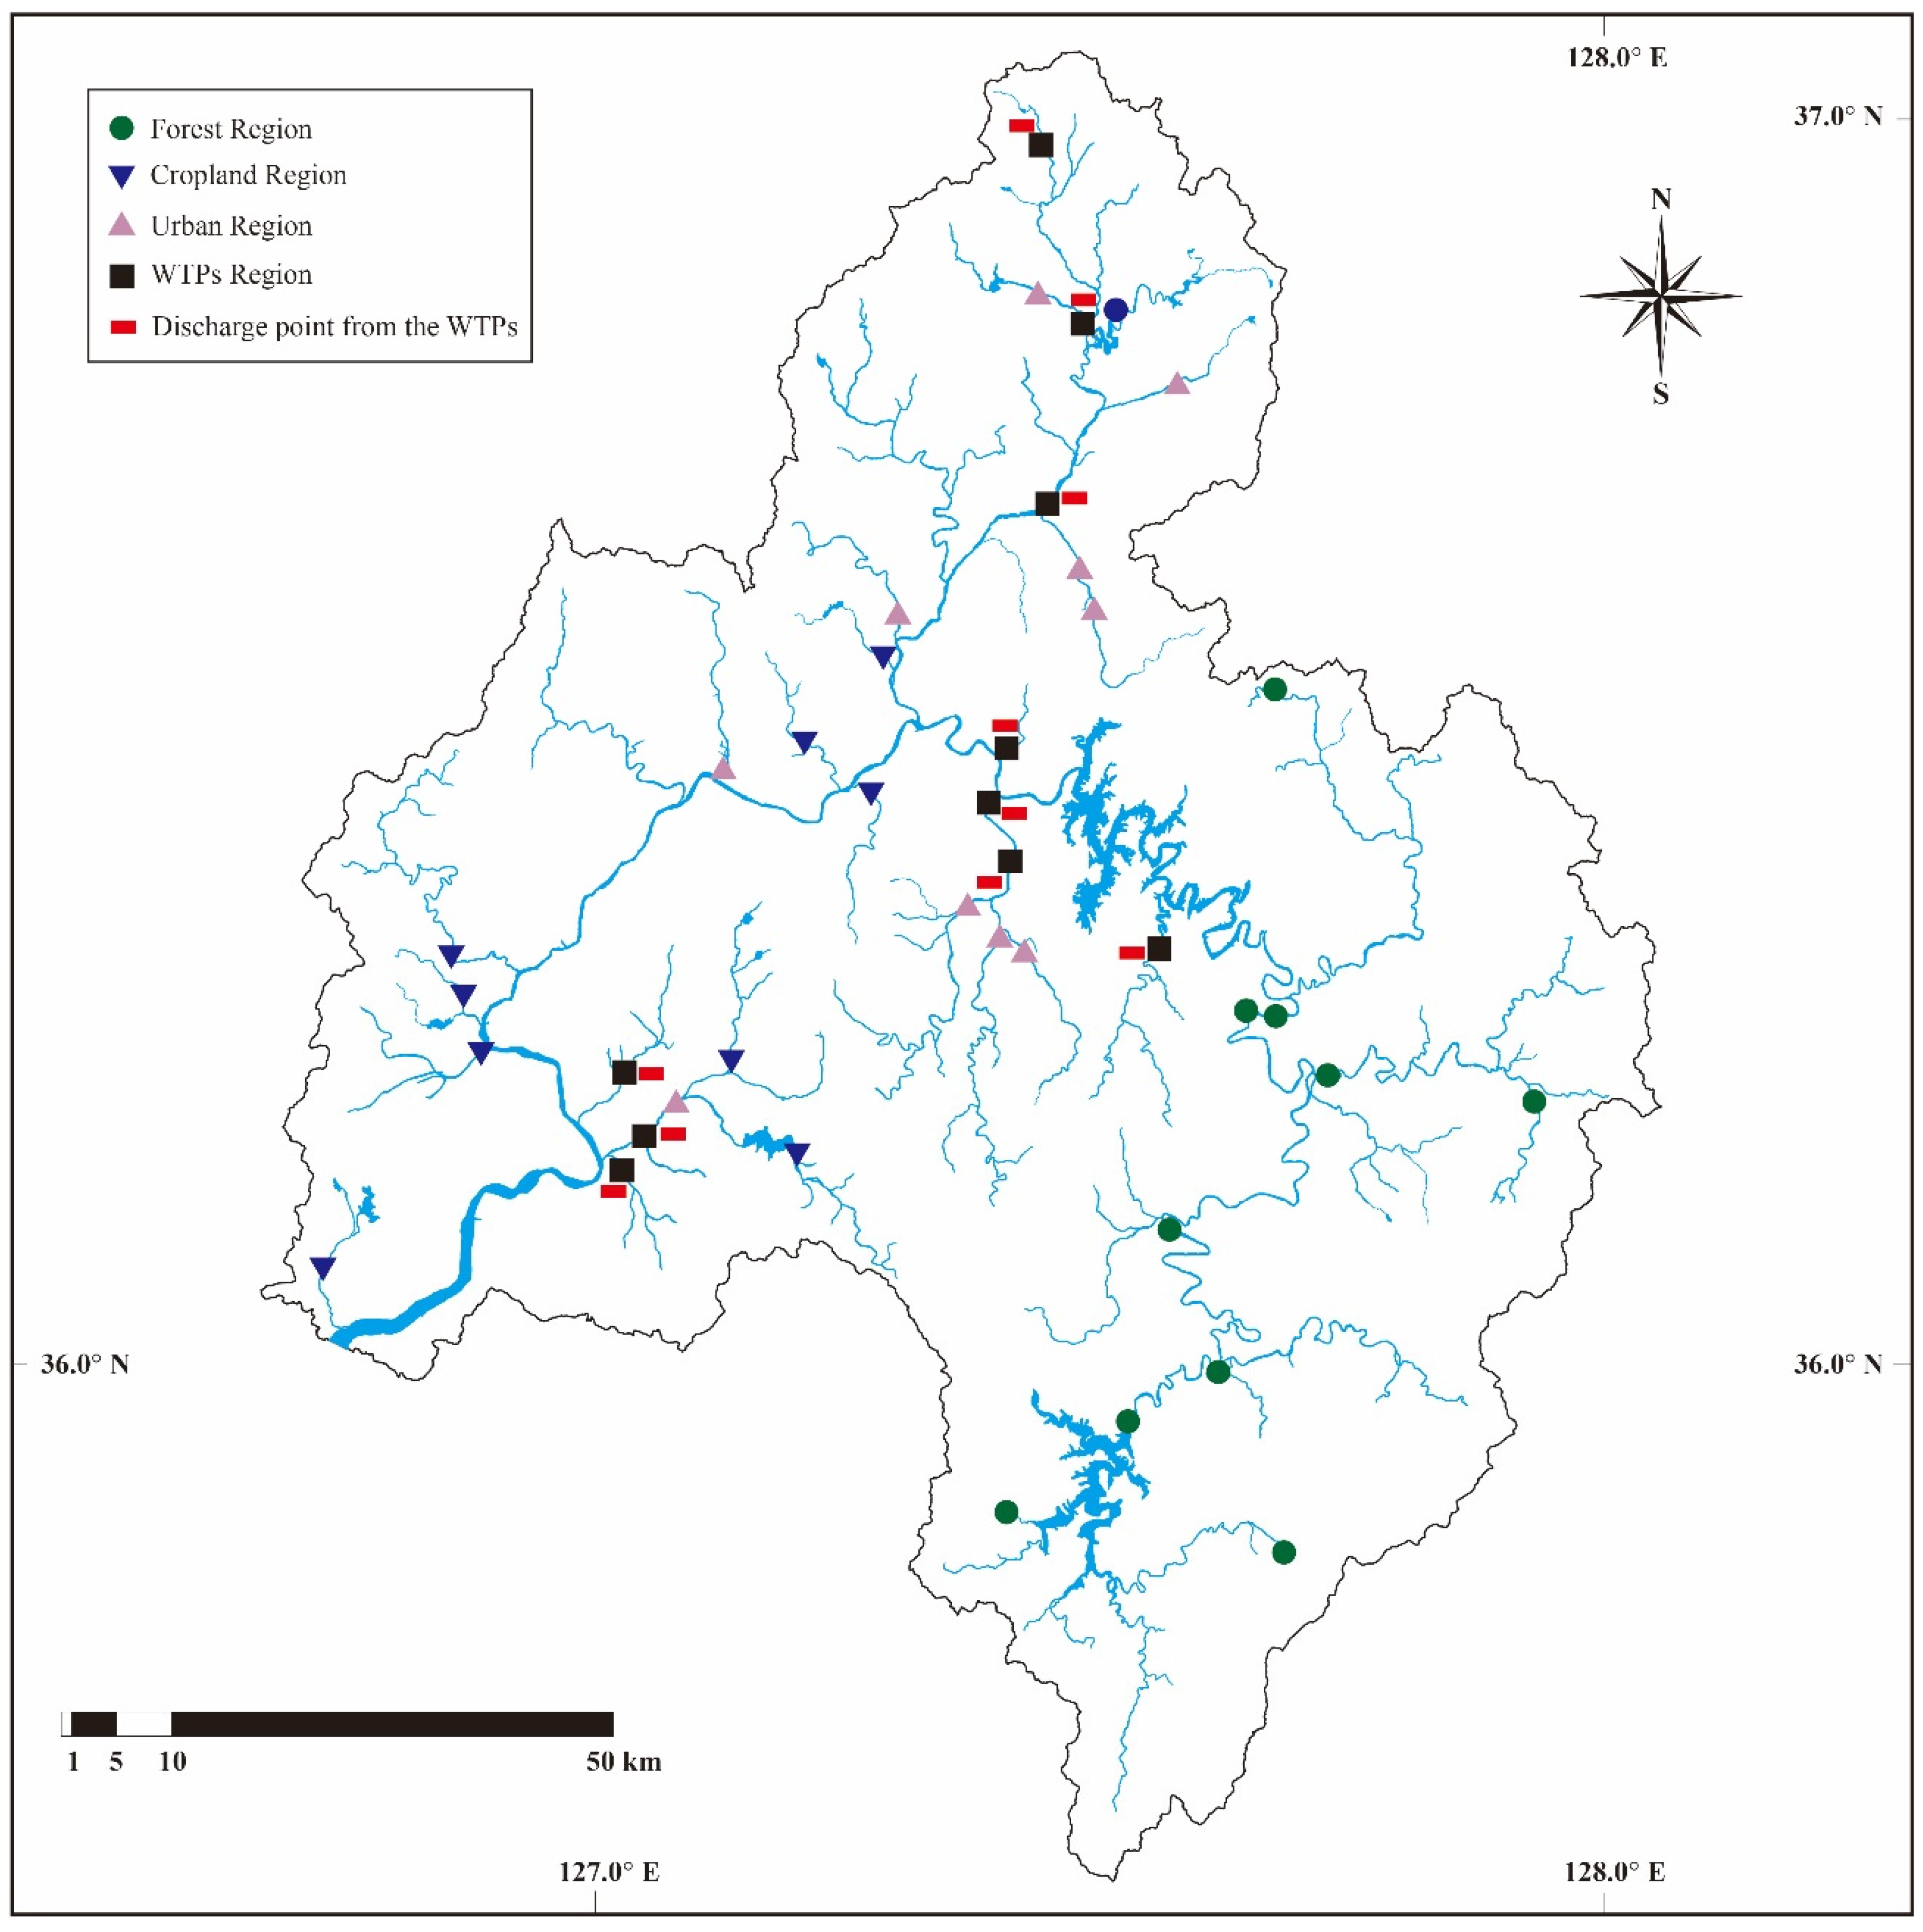
2.1. Study Area and Selection of Sampling Site

This study was conducted in the Geum-River watershed, South Korea (Figure 1). The Geum-River watershed (36°–37° N; 127°–128° E) is located in the mid-western part of South Korea, and consists of a main stem length of 414 km and catchment area of 9886 km2. Concerning the sampling site, both the site and the land use patterns were considered to be possible factors affecting the aquatic environment. This research was an ideal case study because of the morphology with longitudinal gradients and the diversity of land uses.
Figure 1. Catchment-scale map showing the location of the four different land types, among the 40 sampling sites of the Geum-River watershed.
Water 08 00022 g001
Land use patterns were analyzed by calculating the proportion of forest, cropland, and urban land (a 500-m buffer) around the stream boundaries [11]. Land use for the sampling site was categorized according to the dominant land cover type: forest region (proportion of forest cover >50%), cropland region (proportion of cropland cover >50%), or urban region (proportion of urban cover >50%). Municipal WTPs were regarded only as the point source for defining the WTP region. The regions were divided equally into 10 sampling sites.

2.2. Analysis of Water Quality

Physicochemical and biological water quality data for the sampling sites were obtained from the National Institute of Environmental Research (NIER). Stream water sampling (surface water at 0.5 m) was conducted monthly from 2008 to 2010 in 40 different streams, and electrical conductivity (EC) was simultaneously measured using a portable multiparameter analyzer (YSI Sonde Model 6600: Yellow Springs, OH, USA). TP was determined using the ascorbic acid method after persulfate oxidation [41], and total nitrogen (TN) was determined using the second derived procedure after persulfate digestion [41]. Biological oxygen demands at 5 days (BOD5) were measured per the method of Eaton and Franson [41]. Sestonic CHL concentrations were determined using a spectrophotometer (DU-530; Beckman Coulter Inc., Brea, CA, USA) after sampled water was processed through a GF/C filter and ethanol extraction in hot water [42]. Nutrient (N, P) and sestonic CHL analyses were performed in triplicate; EC and BOD5 were applied in duplicate.

2.3. Analysis of Physical Habitat Conditions

Physical habitat conditions at the sampling sites were assessed using a qualitative health evaluation index (QHEI). The QHEI assessment was conducted in 2009; this study used a 6-metric model of QHEI for application at a regional level [43,44,45], modified from the original 10-metric model [46,47]. To assess the physical habitat condition, primary, secondary, and tertiary attributes were included in the model and their metrics were composed of substrate structure and vegetation coverage, channel and bank characteristics, and bank structure. All metric characteristics have been described previously [43,48]. The metrics of QHEI comprised M1–M6, evaluating epifaunal substrate cover, pool substrate, channel flow status, channel alteration, and sediment deposition. An additional metric was also included to account for the effects of dam construction. The health conditions of the habitat were evaluated by summing the scores obtained from the six metric scores (M1–M6) and then categorizing the system as “excellent” (A; score 120–96), “good” (B; 80–66), “fair” (C; 60–36), or “poor” (D; 30–6) based on the recommendations of MOE/NIER [44]. The final scores were transformed to a 0–1 scale for more comparable analysis.

2.4. Fish Collection and Sampling Method

Fish assemblages were collected twice at each site from 2008 to 2011 during the pre- and post-monsoon seasons; these seasons produce a hydrologically-stable aquatic environment. The sampling approach followed the modified protocols of the Ohio Environmental Protection Agency [49]. Casting nets (mesh size, 5 × 5 mm) and kick nets (mesh size, 4 × 4 mm) were used for sample collection, following the standard method for ecological fish health assessment proposed by the MOE/NIER [43]. Casting nets were used in various types of deep (2–3 m) and shallow (<0.5 m) habitat, and kick nets were used at locations with fast current velocities or in stream vegetation zones [43]. The sampling and handling techniques were based on catch per unit effort methods [50], with a sampling period of 50–60 min at each location. Fish were collected from all types of habitat, including riffles, runs, and pools, using the wading method [49]. All fish specimens were preserved in neutral-buffered 10% formalin and returned to the laboratory for identification [51,52]. Currently used scientific names, such as genus Nipponocypris, Tanakia spp., were employed [53]. The external characteristics of individual fish were examined in the laboratory for deformities, erosions (skin, barbels), lesions (open sores, ulcerations) and tumors [54].

2.5. Analysis of Trophic Composition and Tolerance Level

For the classification of fish trophic compositions and tolerance levels, the approach of the US EPA [49] and Karr [55] was used. Trophic composition was classified into four categories: insectivores, omnivores, piscivores, and herbivores, all of which were determined in accordance with the primary feeding resource. Tolerance levels were classified into sensitive, intermediate and tolerant species; this approach was based on the principle that an increase in the number of species and individuals in the first two categories indicates better ecosystem health, whereas an increase in omnivores indicates a degradation of ecosystem health [49]. Information on the classification of guild compositions for freshwater fishes in both trophic categories and tolerance levels are available [52].

2.6. Multi-Metric Fish Index of Biological Integrity (IBI) Model

The biological health of the lotic ecosystem was evaluated using the multi-metric fish IBI model. Ten metric models of IBI [55,56] were developed on the basis of regional application [38,48,56]. The metrics consisted of the three major ecological characteristics: species richness with magnitude of stream order (M1, M2 and M7), trophic/tolerance guild compositions (M3–M6), and fish abundance according to health conditions (M8). The following metrics were used: M1, total number of native species; M2, number of riffle-benthic dwelling species; M3, number of sensitive species; M4, proportion of tolerant species; M5, proportion of omnivorous species; M6, proportion of native insectivorous species; M7, total number of native individuals; and M8, proportion of abnormal individuals. Each metric was assigned a score of 1, 3, or 5, and five classification criteria—“excellent” (A; score = 40–36), “good” (B; 34–28), “fair” (C; 26–20), “poor” (18–14), and “very poor” (13 or below)—were used. Detailed descriptions of specific metric characteristics and scoring criteria for the model are available [38].

2.7. Statistical Analysis

A one-way analysis of variance (ANOVA), with Scheffe’s post-hoc test applied, was used to assess differences in water quality, habitat conditions, and biological components between the different regions (forest, cropland, urban, and WTP regions), using the SPSS in the Windows software package (ver. 22.0; IBM Corp., Armonk, NY, USA). Simple linear regression analysis and Spearman’s correlation analysis were also conducted.

3. Results and Discussion

3.1. Influence of Land Use on Water Chemistry, Habitat Conditions, and Biological Components

The effects of land use pattern on water chemistry, habitat conditions, and biological components are shown in Table 1. TP, BOD5 and EC were lowest in the forest region, and were significantly higher (Scheffe’s test, p < 0.001) in the WTP region compared to all forest, cropland, and urban regions. The mean mass ratio of N:P was highest in the forest region, and lowest in the WTP region (Scheffe’s test, p < 0.001); these results indicate that water chemistry was directly influenced by the type of land in the watershed. Physical habitat health, based on QHEI scores, was superior for the forest area than for any other region, but the differences were not significant (Table 1). Biological components of sestonic CHL (as a primary producer) and the IBI (based on fish assemblages) reflected the water chemistry, and were directly influenced by the type of land. Thus, the mean value of IBI was significantly greater, and the sestonic CHL significantly lower, in the forest region than in any other region (both p < 0.05; Table 1).
Table 1. Water chemistry, physical habitat condition, and biotic components according to the type of land in the Geum River watershed. Data are provided as means ± SE (range: 5%–95%) in each region. The superscript letters indicate significant post-hoc differences according to land use type.
VariablesForest RegionCropland RegionUrban RegionWTPs Region
Mean ± SEMean ± SEMean ± SEMean ± SE
RangeRangeRangeRange
Total nitrogen (μg·L−1)1821 ± 33 a1740 ± 52 a2605 ± 65 b6792 ± 225 c
(1130–2836)(545–3454)(1002–5024)(1713–14782)
Total phosphorus (μg·L−1)26 ± 2 a67 ± 4 a, b85 ± 3 b462 ± 27 c
(4–76)(11–164)(21–212)(66–1698)
N:P ratios in ambient water143 ± 8 c53 ± 4 b46 ± 3 b24 ± 1 a
(29–388)(5–175)(10–110)(5–58)
Electrical Conductivity (μs·cm−1)136 ± 2 a210 ± 4 b263 ± 4 c482 ± 13 d
(74–212)(133–342)(148–383)(237–935)
BOD5 (mg·L−1)0.9 ± 0.02 a1.9 ± 0.08 b2.5 ± 0.10 c4.1 ± 0.16 d
(0.4–1.4)(0.5–4.4)(0.9–5.5)(1.1–9.6)
QHEI90 ± 5 b67 ± 5 a61 ± 5 a72 ± 6 a,b
(70–108)(45–87)(40–82)(47–92)
Sestonic CHL (μg·L−1)2.4 ± 0.2 a3.4 ± 0.3 a7.0 ± 0.7 a18.9 ± 2.4 b
(0.2–7.9)(0.1–10.5)(0.2–30.7)(0.1–182.4)
Sestonic CHL:TP0.15 ± 0.010 b0.08 ± 0.007 a0.10 ± 0.008 a0.08 ± 0.009 a
(0.00877–0.44200)(0.00095–0.27789)(0.00313–0.42713)(0.00035–0.44106)
Sestonic CHL:TN0.0015 ± 0.0001 a0.0025 ± 0.0003 a,b0.0039 ± 0.0005 b0.0039 ± 0.0004 b
(0.00006–0.00485)(0.00004–0.01016)(0.00006–0.01919)(0.00002–0.01967)
Index of biotic integrity32 ± 0.7 c23 ± 0.6 b19 ± 0.5 a20 ± 0.6 a
(24–38)(16–30)(12–24)(14–26)
Notes: WTPs, wastewater treatment plants; QHEI, Qualitative Habitat Evaluation Index; BOD5, biological oxygen demand at 5 days; a. statistical result (post hoc test) of the smallest value on the land use, b (or c,d.)statistical result (post hoc test) of the largest value on the land use

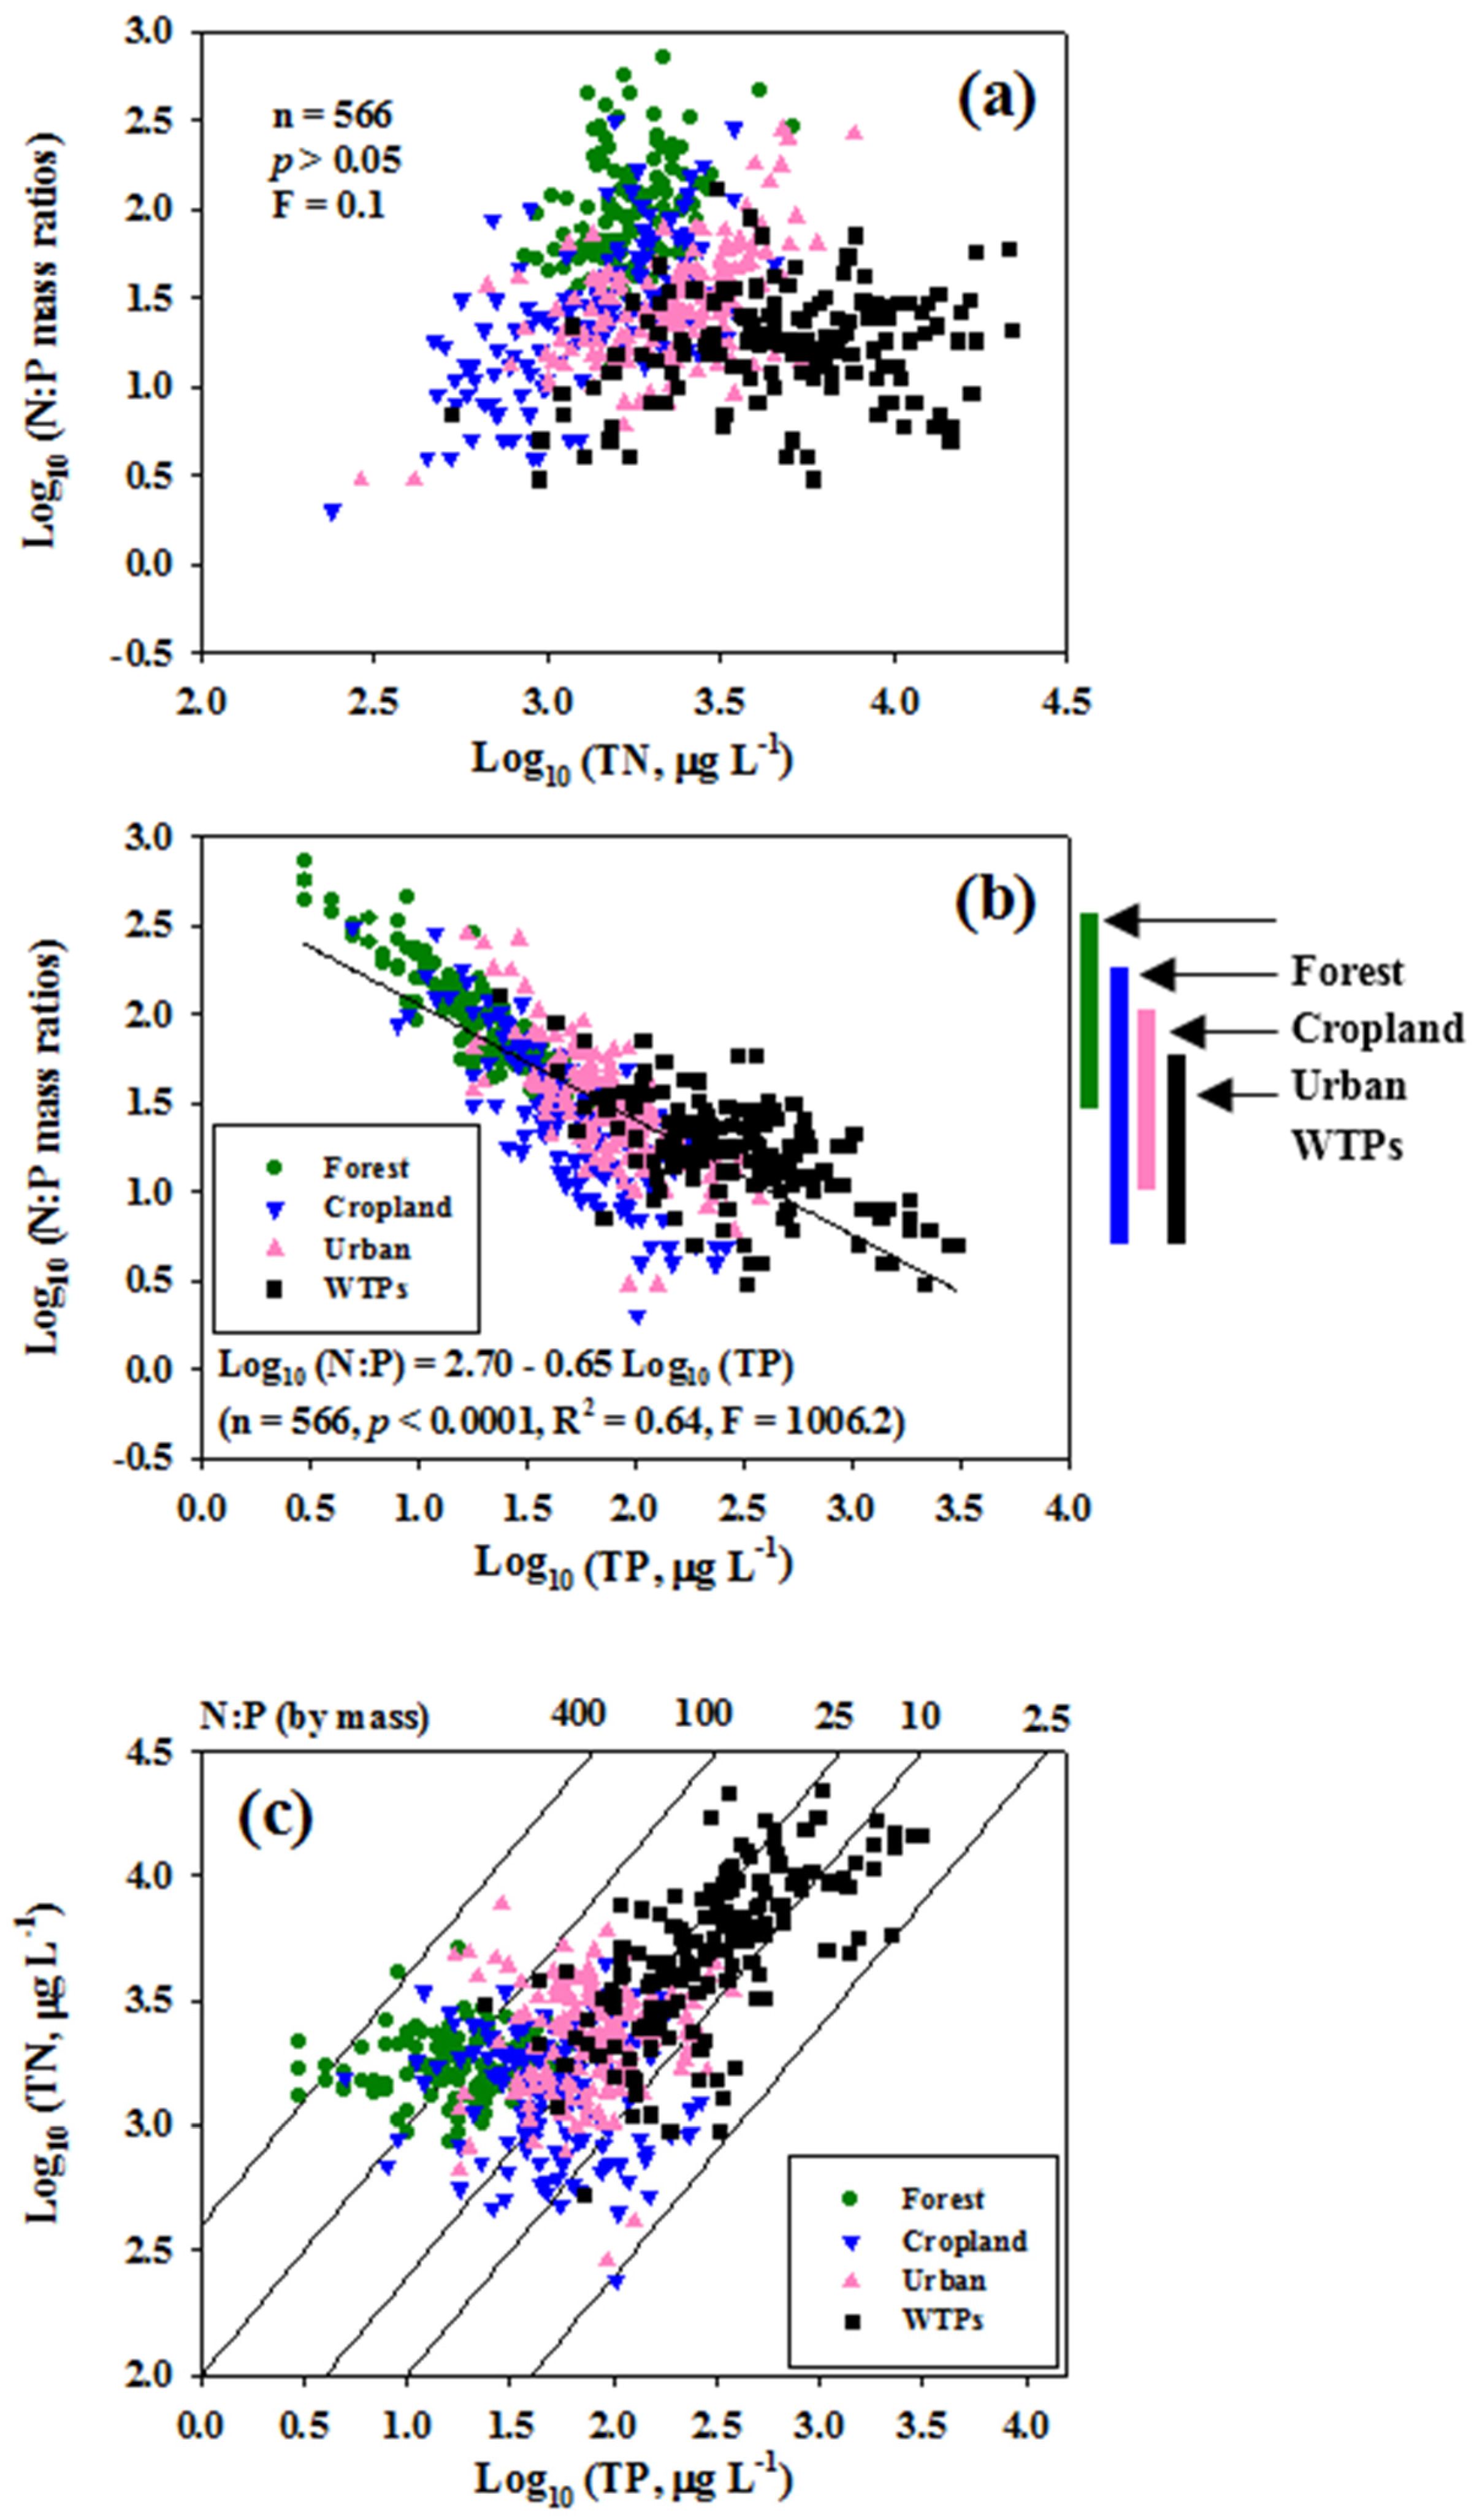
3.2. Effect of Mass Ratios of N:P on Nutrient Regimes and Their Influence on Land Use

The average concentration of TP in the WTPs region was 462 ± 27 μg·L−1, which was 10 times greater than the TP in the forest region (Table 1). TN concentrations were much higher than TP concentrations among all of the different types of land, and the regional mean N:P ratios were greater than 24–143, indicating a nitrogen-rich system. In fact, concentrations of TN had a weak relation with TP in the watershed, and the relation of TN vs. TP showed that the N:P ratios were mainly distributed in the range of 100–400 in the forest area but in the range of 10–20 in the region of WTPs. (Figure 2). Regression analysis of the association between log-transformed N:P ratios and nutrients (Figure 2) indicated that the N:P ratios were directly affected by TP, but not by TN. The N:P ratios, which are widely used as an index of nutrient limitations, were negatively related to TP (p < 0.001, F = 1009.1, R2 = 0.64), but were not related to TN (n = 569, p > 0.05). Thus, the association between N:P ratios and TP was strongest in the forest regions (the green circles in Figure 2b) and lowest in the WTP region (dark squares in Figure 2b), indicating that the variation in N:P ratios is explained by the land use patterns in this watershed. Strong negative regression coefficients (R2 = 0.64, p < 0.001) for the N:P ratios on TP were found in numerous lentic ecosystems [22,57]. These studies indicated that the N:P ratio is a key regulator of the nutrient regime, and of primary production, in ambient water [11,12,58], and is also a major indicator of ecological river health in multi-metric fish models [8]. Our results indicate that the N:P ratios in forest region (high N:P) were clearly segregated from the WTPs region (low N:P), but partial overlaps in the N:P ratios were also shown in the cropland and urban regions.
Figure 2. Relationships between log10-transformed N:P ratios and total nutrient concentrations (TN = total nitrogen, TP = total phosphorus), and between log10-transformed TN and TP in the Geum River. (a) log10 (TN)–log10 (N:P mass ratios); (b) log10 (TP)–log10 (N:P mass ratios); and (c) log10 (TP)–log10 (TN). Vertical bar (right side of panel b) indicates N:P mass ratios on the relations of TN vs. TP among the different land uses.
Water 08 00022 g002

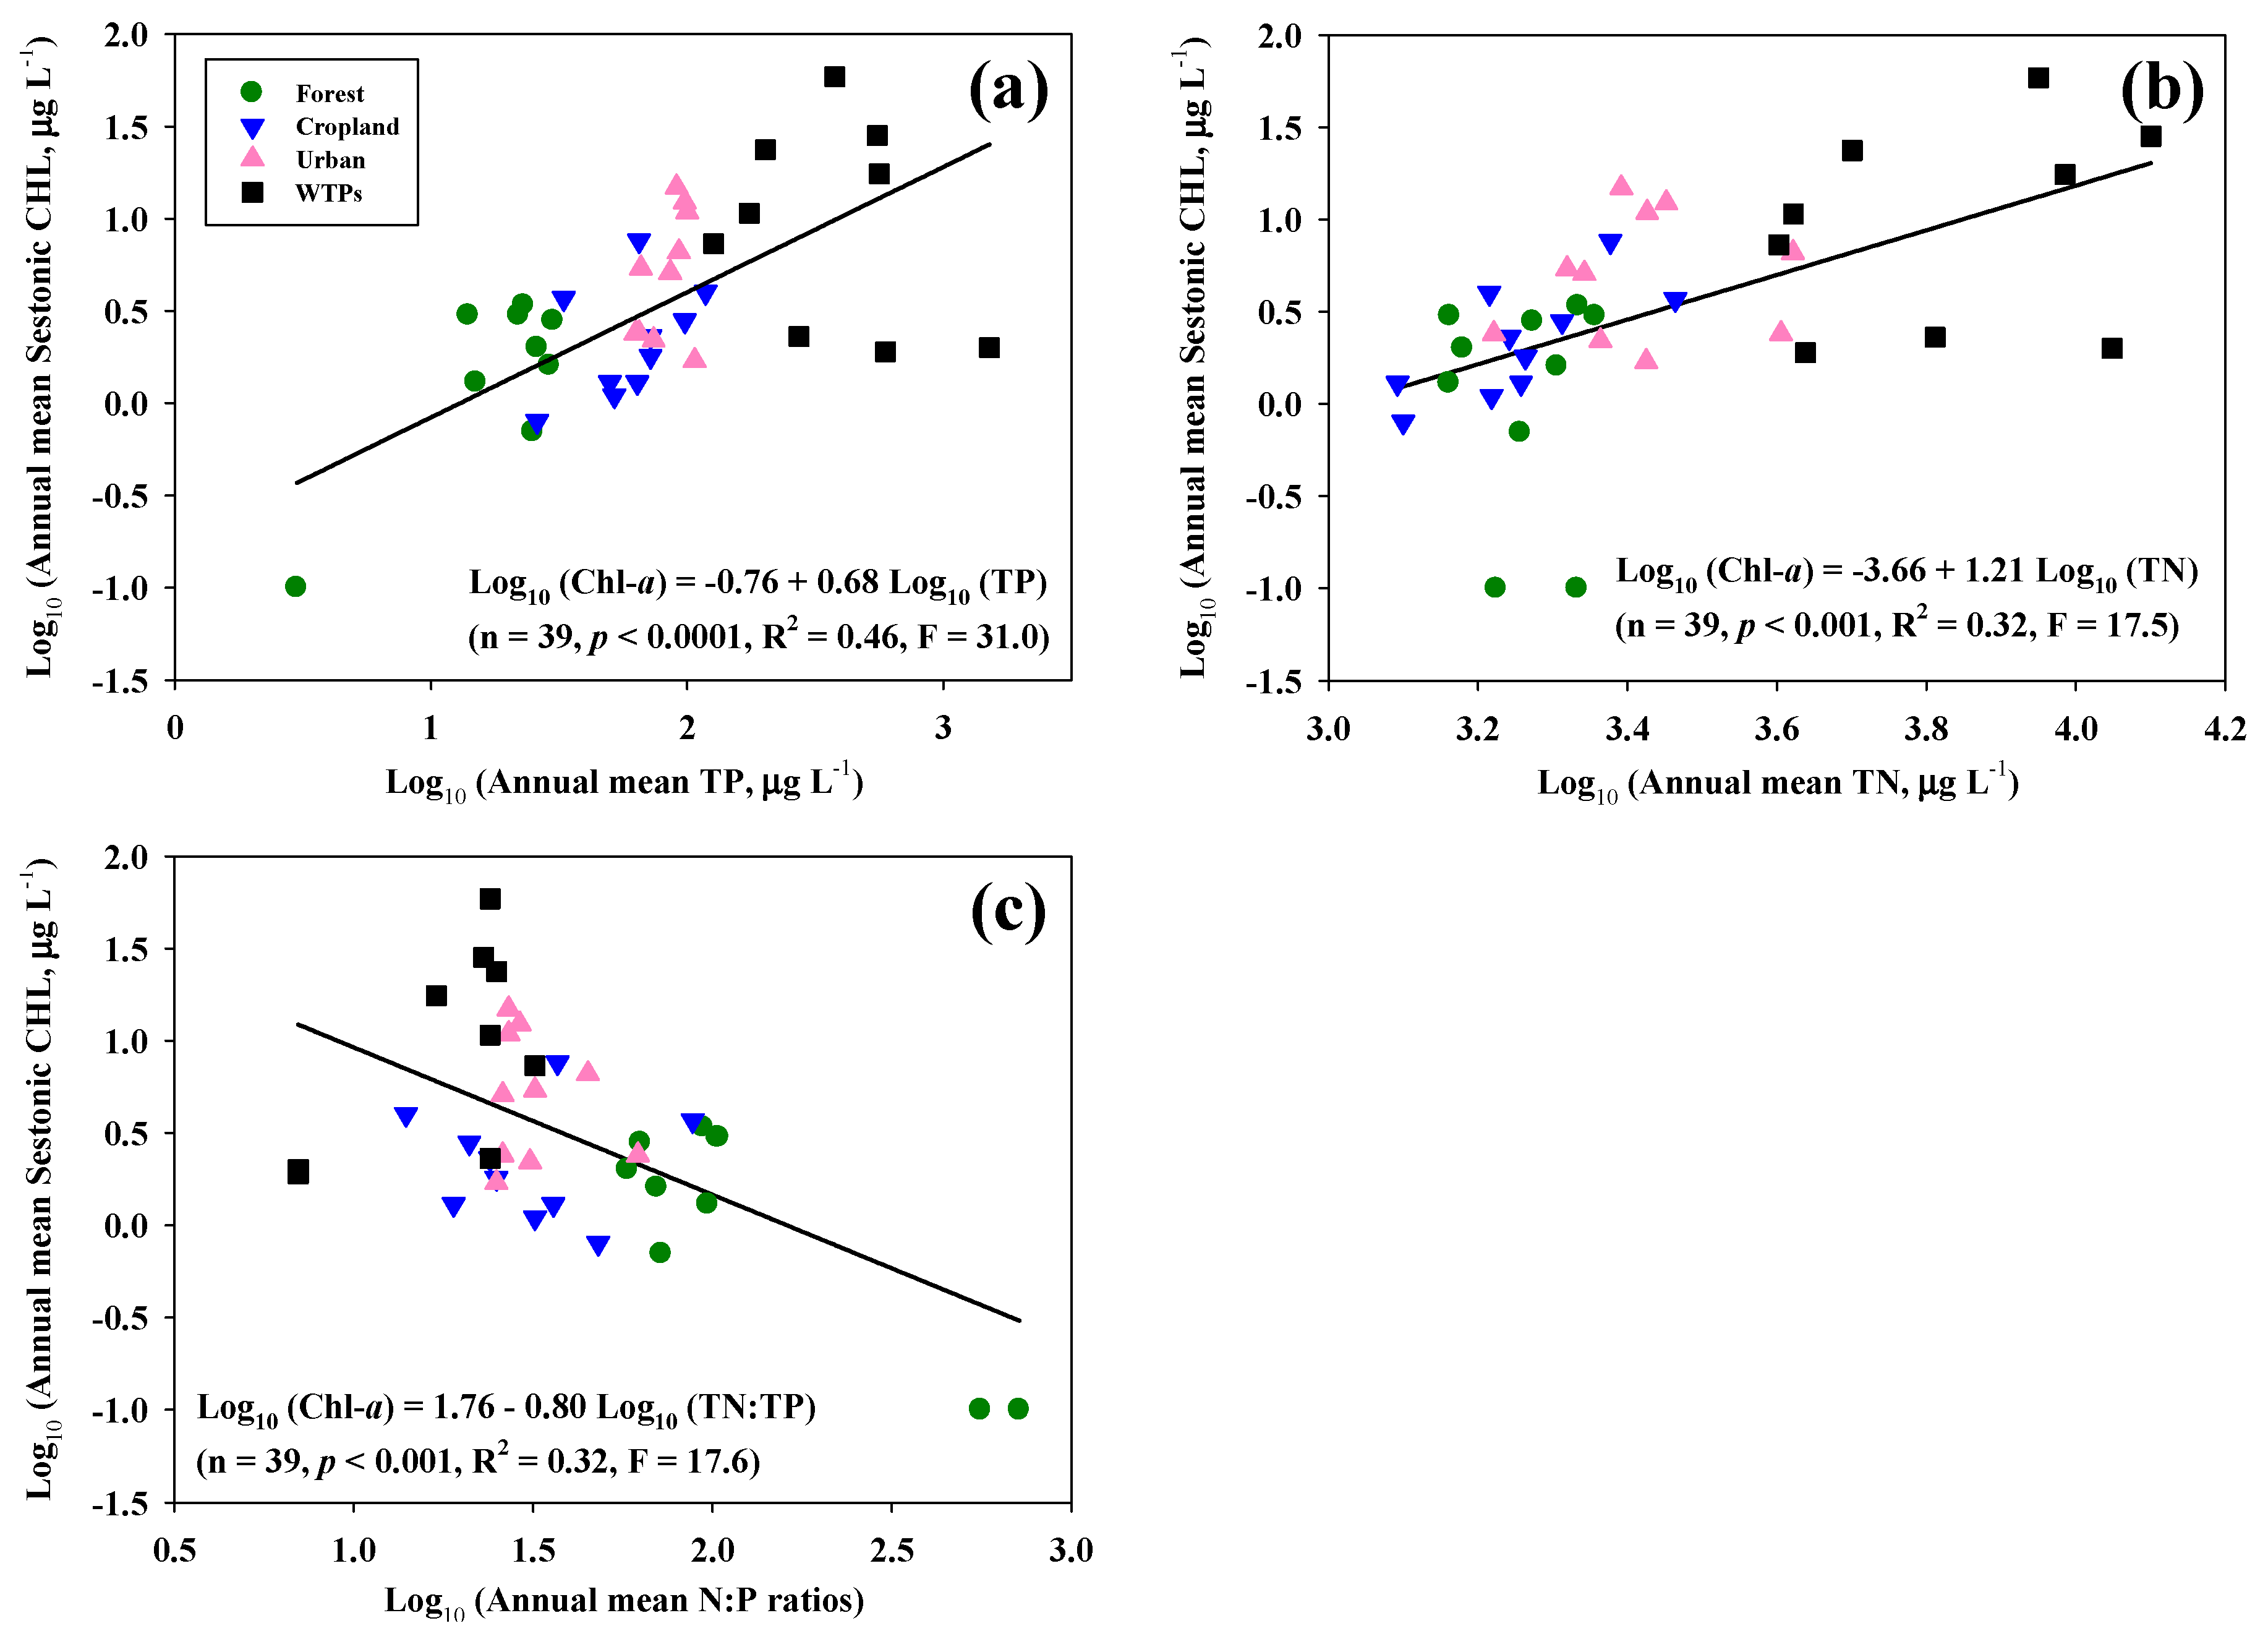
3.3. Effects of Nutrients and N:P Ratios on Sestonic CHL

Sestonic CHL concentrations were more affected by nutrients in ambient water, and the variations in sestonic CHL were better explained by variations in TP (p < 0.001, F = 31.0, R2 = 0.46) than TN (p < 0.001, F = 17.5, R2 = 0.32; Figure 3a,b). When the log-transformed TP values were high, as seen in WTP regions, sestonic CHL values were also high (>46 μg·L−1). Similar patterns were observed with TN, except for differences in R2 values (Figure 3b). In contrast, sestonic CHL values were low (<2.2 μg·L−1) in the forest regions when N:P ratios were high (>60; Figure 3c). The regression coefficients (R2) for the relationship between sestonic CHL and TP, TN, and the N:P ratios, were 0.46, 0.32, and 0.32, respectively (Figure 3a–c). The nutrients N and P were also important limiting factors influencing algal productivity, although current velocity and the light regime in a lotic environment are primary physical factors regulating sestonic phytoplankton and algal biomass. These results suggest that sestonic CHL in the watershed was increased by high P or N and low N:P [59].
Figure 3. Simple linear regression models of log10-transformed annual mean (a) TP-sestonic CHL; (b) TN-sestonic CHL; and (c) N:P mass ratios-sestonic CHL.
Water 08 00022 g003

3.4. Relationships between Fish Communities and Compositions and N:P Ratios

Fish communities and community structures in the watershed were reflected in the type of land (Table 2). The forest region was designated as a Nipponocypris-Zacco community, whose dominant species was Nipponocypris koreanus (34.5% of the total), a sensitive species that is known to dwell in pristine chemical conditions. The average N:P ratio in ambient waters of the forest region was 143, which was higher than in any other type of land. In contrast, the dominant species in the WTPs region were Zacco platypus, (51.1%) and Hemiculter eigenmanni (6.2%), which are tolerant, omnivorous species with high abundance in polluted aquatic environments. The N:P ratio was lowest (24) in the Zacco-Hemiculter community due to the high degree of phosphorus enrichment from the effluents of WTPs. The forest region contained the largest proportion of insectivorous species (56.2%) and sensitive species (47.0%) (Figure 4a), whereas the WTP region showed a predominance of omnivorous species (76.8%) and tolerant species (78.6%) (Figure 4d). These preliminary results indicate that the type of land directly affects both trophic compositions and fish tolerance guilds [38,47]. In the meantime, other physical factors as well as the land use pattern might also have influenced the fish community and species compositions, even if we did not put the data of physical variables such as stream discharge, water temperature, dissolved oxygen(DO), mean depth, and canopy cover, etc.
Table 2. N:P ratios in the ambient water (means ± SE), fish community, and fish compositions (including tolerance level and trophic composition) according to type of land in the Geum River watershed.
Type of LandN:P Ratios in the Ambient WaterCommunity GroupFish SpeciesTolerance LevelTrophic CompositionsRA (%)
Forest Region143 ± 8Nipponocypris-Zacco communityNipponocypris koreanusSsIs34.5
Zacco platypusTsOm24.1
Tanakia koreensisInOm6.0
Coreoleuciscus splendidusSsIs4.8
Pungtungia herziInIs4.2
Other species (43)26.4
Cropland region53 ± 4Zacco-Tridentiger communityZacco platypusTsOm38.0
Tridentiger brevispinisInIs13.8
Pseudogobio esocinusInIs6.1
Tanakia lanceolatusIntOm5.1
Opsarichthys uncirostris amurensisTsCa3.3
Other species (51)33.8
Urban Region46 ± 3Zacco-Carassius communityZacco platypusTsOm52.5
Carassius auratusTsOm9.5
Pseudogobio esocinusInIs6.8
Tanakia lanceolatusInOm5.7
Opsarichthys uncirostris amurensisTsCa2.9
Other species (41)22.5
WTPs region24 ± 1Zacco-Hemiculter communityZacco platypusTsOm51.1
Hemiculter eigenmanniTsOm6.2
Pseudogobio esocinusInIs6.1
Carassius auratusTsOm5.7
Hemibarbus labeoTsIs5.0
Other species (46)25.9
Notes: Ss, sensitive species; In, intermediate species; Ts, tolerant species; Is, insectivore; Om, omnivore; Ca, carnivore; RA, relative abundance; WTPs, wastewater treatment plants.
Figure 4. Trophic composition (left panel) and tolerance level (right panel) of fish communities in the Geum River watershed. % Is, proportion of insectivores; % Om, proportion of omnivores; % Ss, proportion of sensitive species; % Ts, proportion of tolerance species. (a) Nipponocypris-Zacco community (forest); (b) Zacco-Tridentiger community (Cropland); (c) Zacco-Carassius community (urban); and (d) Zacco-Hemiculter community (WTPs).
Water 08 00022 g004

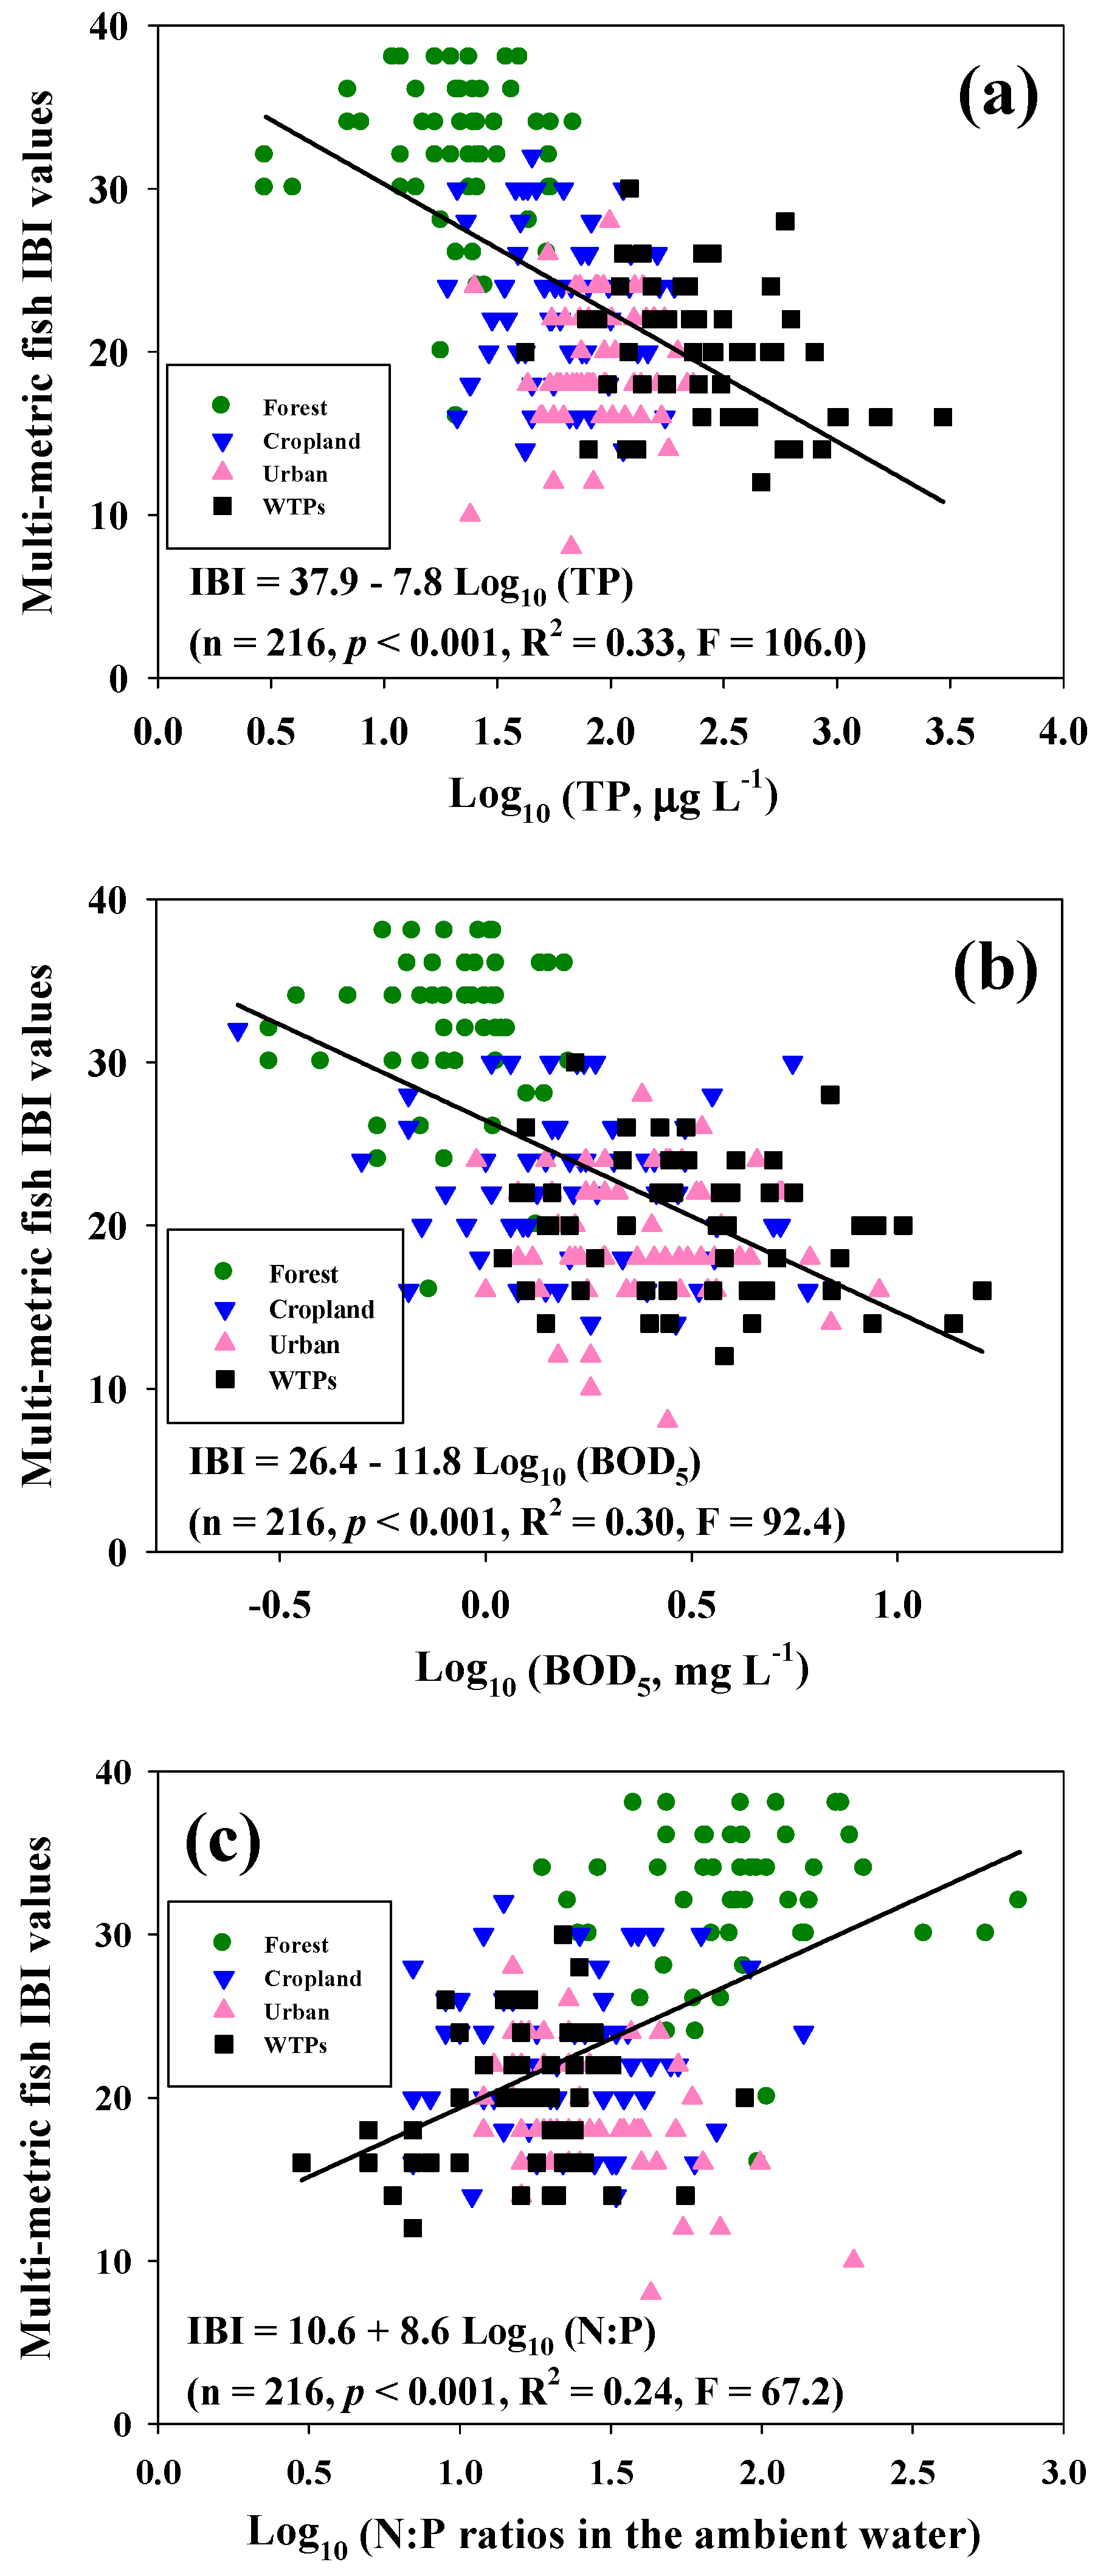
3.5. Multi-Metric IBI Model and Its Chemical Effects

The multi-metric river health model, based on the IBI, showed that IBI values were determined by land use patterns (Table 3). The mean value of the IBI model was 32.3 ± 4.6 in the forest region, which was judged to be in a “fair-excellent condition” with respect to river health. In contrast, the mean IBI value ranged from 19.2 to 22.6 in the cropland, urban, and WTP regions; the mean IBI values in all three of these regions was significantly (Scheffe’s test, p < 0.05) lower than that of the forest region. However, there were no significant differences (one-way ANOVA, p < 0.001) in the mean IBI values of the cropland, urban and WTP regions (Table 3). Statistical analysis of each model parameter showed that there were significant differences (one-way ANOVA, p < 0.001) for M1‒M6, and M8, but not for M7 (Table 3). In the forest region, the highest IBI values occurred at M3 and M6 (Scheffe’s test, p < 0.01), and the lowest values occurred at M4 and M5 (Scheffe’s test, p < 0.01).
Multi-metric IBI values, as an indicator of river health, had negative relationships with TP and BOD5, and a positive relationship with the N:P ratio (Figure 5). In other words, the river health on IBI was directly affected by nutrient level (P) and organic matter (BOD5) in the lotic ecosystem (Figure 5). Regression analysis of IBI on TP and BOD5 showed that the variation in river health (IBI) was accounted for by variations in log10-transformed TP (33%; n = 216, F = 106.0, p < 0.001), and log10-transformed BOD5 values (33%; n = 216, F = 92.4, p < 0.001; Figure 5). For the linear models of IBI, the mean IBI value was 37.9 − 7.8 log10 (TP), and the mean IBI value was 26.4 − 11.8 log10 (BOD5). Mass ratios of N:P in the ambient water had a positive linear relationship with IBI values (mean IBI = 10.6 + 7.8 log10 (N:P), p < 0.001), indicating that N:P ratios are an important determinant of river health. Mean IBI had no significant relationship with TN, due to the systems being nitrogen-rich in this watershed regardless of sampling location or season.
Figure 5. Relationships between multi-metric fish index of biological integrity (IBI) values and log10-transformed (a) TP; (b) BOD5; (c) N:P ratios in the ambient water.
Water 08 00022 g005
Table 3. Model metrics and scoring criteria of the multi-metric fish index of biological integrity values according to type of land. The superscript letters indicate significant differences among the four regions on Scheffe’s post-hoc test.
CategoryModel MetricScoring CriteriaForestCroplandUrbanWTPsF-Valuep-Value
531
Species richness and compositionM1: total number of native fish speciesExpectations of M1 vary with stream order12.2 ± 4.4 b10.1 ± 3.2 a9.7 ± 3.2 a9.8 ± 4.6 a8.5***
(3.8 ± 1.1)(4.0 ± 1.2)(3.4 ± 1.2)(3.3 ± 1.5)
M2: number of riffle benthic dwelling speciesExpectations of M2 vary with stream order2.7 ± 1.5 b1.2 ± 1.1 a0.8 ± 0.8 a0.9 ± 1.1 a38.3***
(3.6 ± 1.6)(1.7 ± 1.3)(1.2 ± 0.6)(1.6 ± 1.3)
M3: number of sensitive speciesExpectations of M3 vary with stream order3.9 ± 1.6 b0.1 ± 0.3 a0.1 ± 0.3 a0.1 ± 0.4 a308.3***
(3.7 ± 1.2)(1.0 ± 0.0)(1.0 ± 0.0)(1.0 ± 0.0)
M4: proportion of individuals as tolerant species<55–20>2024.2 ± 21.4 a56.3 ± 21.5 b72.3 ± 19.6 c74.6 ± 18.0 c62.7***
(4.2 ± 1.1)(2.6 ± 1.3)(1.9 ± 1.1)(1.8 ± 1.1)
Trophic compositionM5: proportion of individuals as omnivore species<2020–45>4535.7 ± 24.3 a63.7 ± 19.6 b70.4 ± 22.8 b72.5 ± 20.1 b26.9***
(3.6 ± 1.3)(2.3 ± 1.2)(2.0 ± 1.3)(1.8 ± 1.1)
M6: proportion of individuals as native insectivore species>4520–45<2059.1 ± 25.2 b27.2 ± 18.3 a23.2 ± 18.9 a19.5 ± 17.0 a36.4***
(4.2 ± 1.2)(2.5 ± 1.4)(2.3 ± 1.5)(1.9 ± 1.4)
Fish abundance and conditionM7: total number of native individualsExpectations of M7 vary with stream order191.1 ± 86.3165.2 ± 130.3170.7 ± 131.4194.3 ± 146.50.9NS
(4.3 ± 1.0)(4.1 ± 1.4)(3.7 ± 1.6)(4 ± 1.4)
M8: proportion of individuals as abnormalities00–1>10.0 ± 0.0 a0.3 ± 0.8 a1.2 ± 2.6 b0.5 ± 1.8 a,b5.1**
(5.0 ± 0.0)(4.4 ± 1.4)(3.7 ± 1.7)(4.3 ± 1.2)
Scores (criteria of multi-metric fish IBI model) 32.3 ± 4.6 c22.6 ± 4.7 b19.2 ± 3.9 a19.7 ± 4.1 a99.2***
Fair-excellentPoor-fairPoor-fairPoor-fair
Notes: The values in parentheses indicate the mean ± SD of the Mn metric (n ranges from 1 to 8); F- and p-values are from one-way ANOVA; ** significant at the 0.01 probability level; *** significant at the 0.001 probability level and below; NS, non-significant (p > 0.05); WTPs, wastewater treatment plants; IBI, index of biological integrity;a. statistical result (post hoc test) of the smallest Mn value on land use, b. or c. statistical result (post hoc test) of the largest Mn value on land use.

3.6. Influence of Sestonic CHL on Trophic Compositions and River Health

Sestonic CHL, as a measure of primary production, affected the food chain at higher trophic levels, which in turn influenced the trophic compositions (Figure 6). Concentrations of sestonic CHL had inverse linear relationships with % Is (R2 = 0.28, F = 14.7, p < 0.001) and the IBI model values for stream health (R2 = 0.21, F = 9.8, p < 0.01). The results of simple linear models of insectivores and IBI values were as follows: % Is = 44.9 − 22.5 log10 (CHL) and IBI = 25.9 − 5.0 log10 (CHL). In contrast, sestonic CHL had a positive linear relationship (R2 = 0.25, p < 0.01) with the proportion of omnivore species (% Om); the result of the simple linear model was as follows: % Om = 49.0 + 20.6 log10 (CHL). Even if the regression coefficients of both dependent variables were <0.30, increases in sestonic CHL generally decreased the insectivore fish in the oligo- or meso-trophic state [60], and increased the degree of impairment of stream health as shown by the IBI model values [61]. Our results are supported by the studies of Robertson et al. [62], who showed that increases in organic solids (such as phytoplankton CHL) reduce the abundance of insectivores, and increase the abundance of omnivores in stream ecosystems. These results indicate that organic solids that originate from the sestonic CHL increase the contents of organic matters; furthermore, their accumulation on the stream bottom favors omnivorous species and affected insectivores, resulting in rapid impairment of stream health.
Figure 6. Simple linear regression models of (a) log10-transformed annual mean sestonic CHL–% Is; (b) log10-transformed annual mean sestonic CHL−% Om; (c) log10-transformed annual mean sestonic CHL−multi-metric fish IBI values, respectively.
Water 08 00022 g006

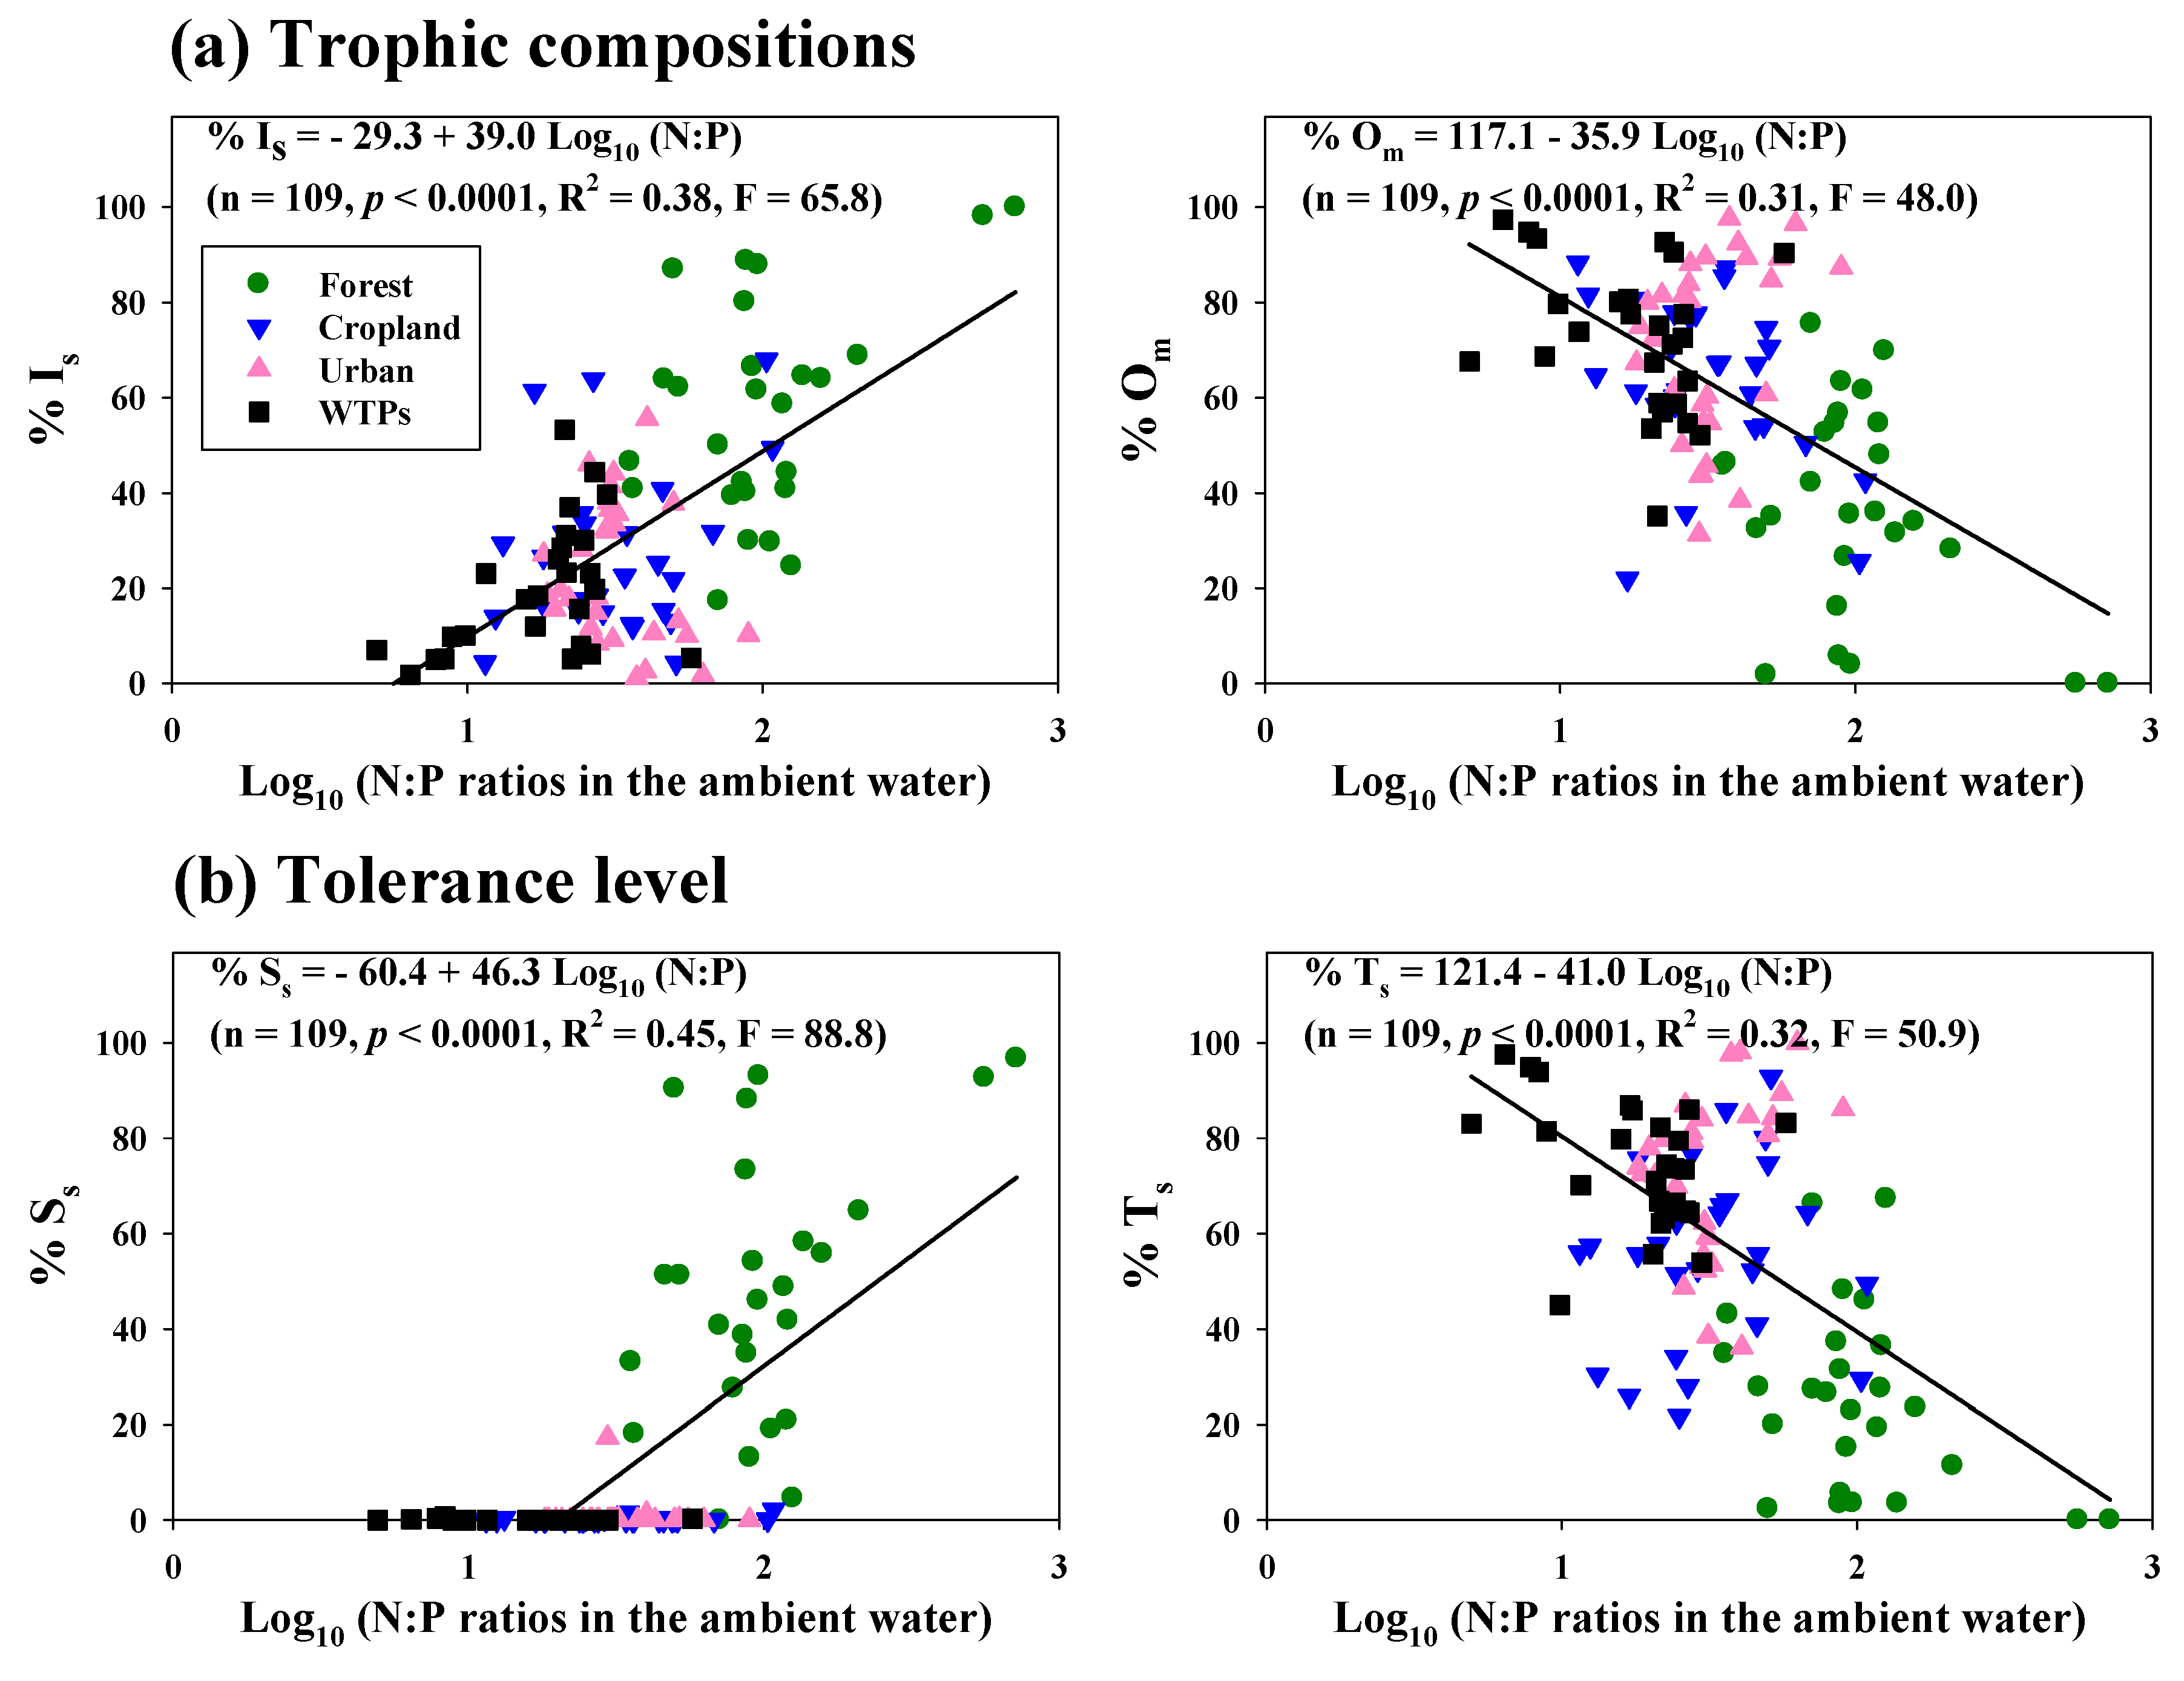
3.7. Relationships among Lotic N:P Ratios, Trophic Composition and Tolerance Level

Fish trophic compositions closely associated with the food chain were directly affected by the N:P ratios [9], which is directly determined by P rather than N (Figure 7). When N:P ratios in ambient water were less than 30, % Is was also under 30%; when N:P ratios were greater than 200, the proportion of insectivores exceeded 60%. The variation in % Is was largely (93%) related to variation in mean N:P ratios (R2 = 0.93, p < 0.01). The linear regression results were as follows: % Is = 13.0 + 10.5 log10 (N:P). This effect of N:P ratios was modified by % Om; the variation in % omnivores was largely related (90%) to variation in the mean N:P ratios (R2 = 0.90, p < 0.01) and the linear regression result was as follows: % Om = 77.4 - 9.1 Log10 (N:P). Thus, mean N:P ratios had a positive relationship with % Om in these streams (Figure 7). The trophic compositions of insectivores and omnivores were matched with fish tolerance. The proportion of sensitive species (% Ss) had a positive relationship with N:P ratios (R2 = 0.95, p < 0.01; % Ss = -16.4 + 15.2 Log10 (N:P)). In contrast, the proportions of tolerant species (% Ts) had a negative relationship with N:P ratios [R2 = 0.91, p < 0.05; % Ts = 75.4 - 10.4 Log10 (N:P)]. These outcomes suggest that N:P ratios determined the degree of fish tolerance (Ss, Ts) as well as trophic compositions (Is, Om).
Figure 7. Mass ratios of the N:P interval in ambient water, in relation to means ± SE of (a) trophic composition (Is = Insectivore sp., Om = Omnivore sp.); (b) tolerance level (Ss = Sensitive sp., In = Intermediate sp., Ts, = Tolerant sp.) in the Geum River watershed. % Is, proportion of insectivores; % Om, proportion of omnivores; % Ss, proportion of sensitive species; % In, proportion of intermediate species; % Ts, proportion of tolerance species.
Water 08 00022 g007

3.8. Influence of Land Use Pattern on N:P Ratios and Linkage with Trophic Compositions and Fish Tolerance

Land use patterns influenced the N:P ratios in ambient water, and determined the trophic compositions and fish tolerance in this study (Figure 8). The N:P ratios in the forest region averaged 143 and ranged from 29 to 388. In contrast, the N:P ratios in the WTP region averaged 24 and ranged from 5 to 58. This indicates that N:P ratios are high in the pristine forest region, and are low in the nutrient-rich WTP regions. Thus, when the N:P ratios were above 130, % Is was high (79.1%), and the proportion of sensitive species (% Ss) was also high (73.6%). Conversely, when the N:P ratios were below 9, the proportions of both the insectivores (5.8%) and sensitive species (0.3%) were low (Figure 8). Conversely, in the WTPs regions, the % Om and tolerant species (% Ts) in the WTPs regions were 84.4% and 90.2%, respectively, indicating that omnivore and/or tolerant fish species dominated the fish community in the point-source region with low N:P ratios.
Regression analysis of the association between trophic compositions and fish tolerance and N:P ratios indicated that log10-transformed N:P ratios were significantly (p < 0.001) associated with these variables (Figure 8). In the analysis of trophic compositions, the variation in insectivore proportions was positively associated (R2 = 0.38, p < 0.001) with the N:P ratios, as follows: % Is = −29.3 + 39.0 Log10 (N:P). However, the proportion of omnivores was negatively associated (R2 = 0.31, p < 0.001) with the N:P ratios, as follows: % Om = 117.1 − 35.9 log10 (N:P). In the analysis of tolerance guilds, the variation in sensitive species was positively associated (R2 = 0.45, p < 0.001) with the N:P ratios, as follows: % Ss = −60.4 + 46.3 Log10 (N:P). The variation in tolerant species was negatively associated (R2 = 0.32, p < 0.001) with the N:P ratios, as follows: % Ts = 121.4 − 41.0 Log10 (N:P).

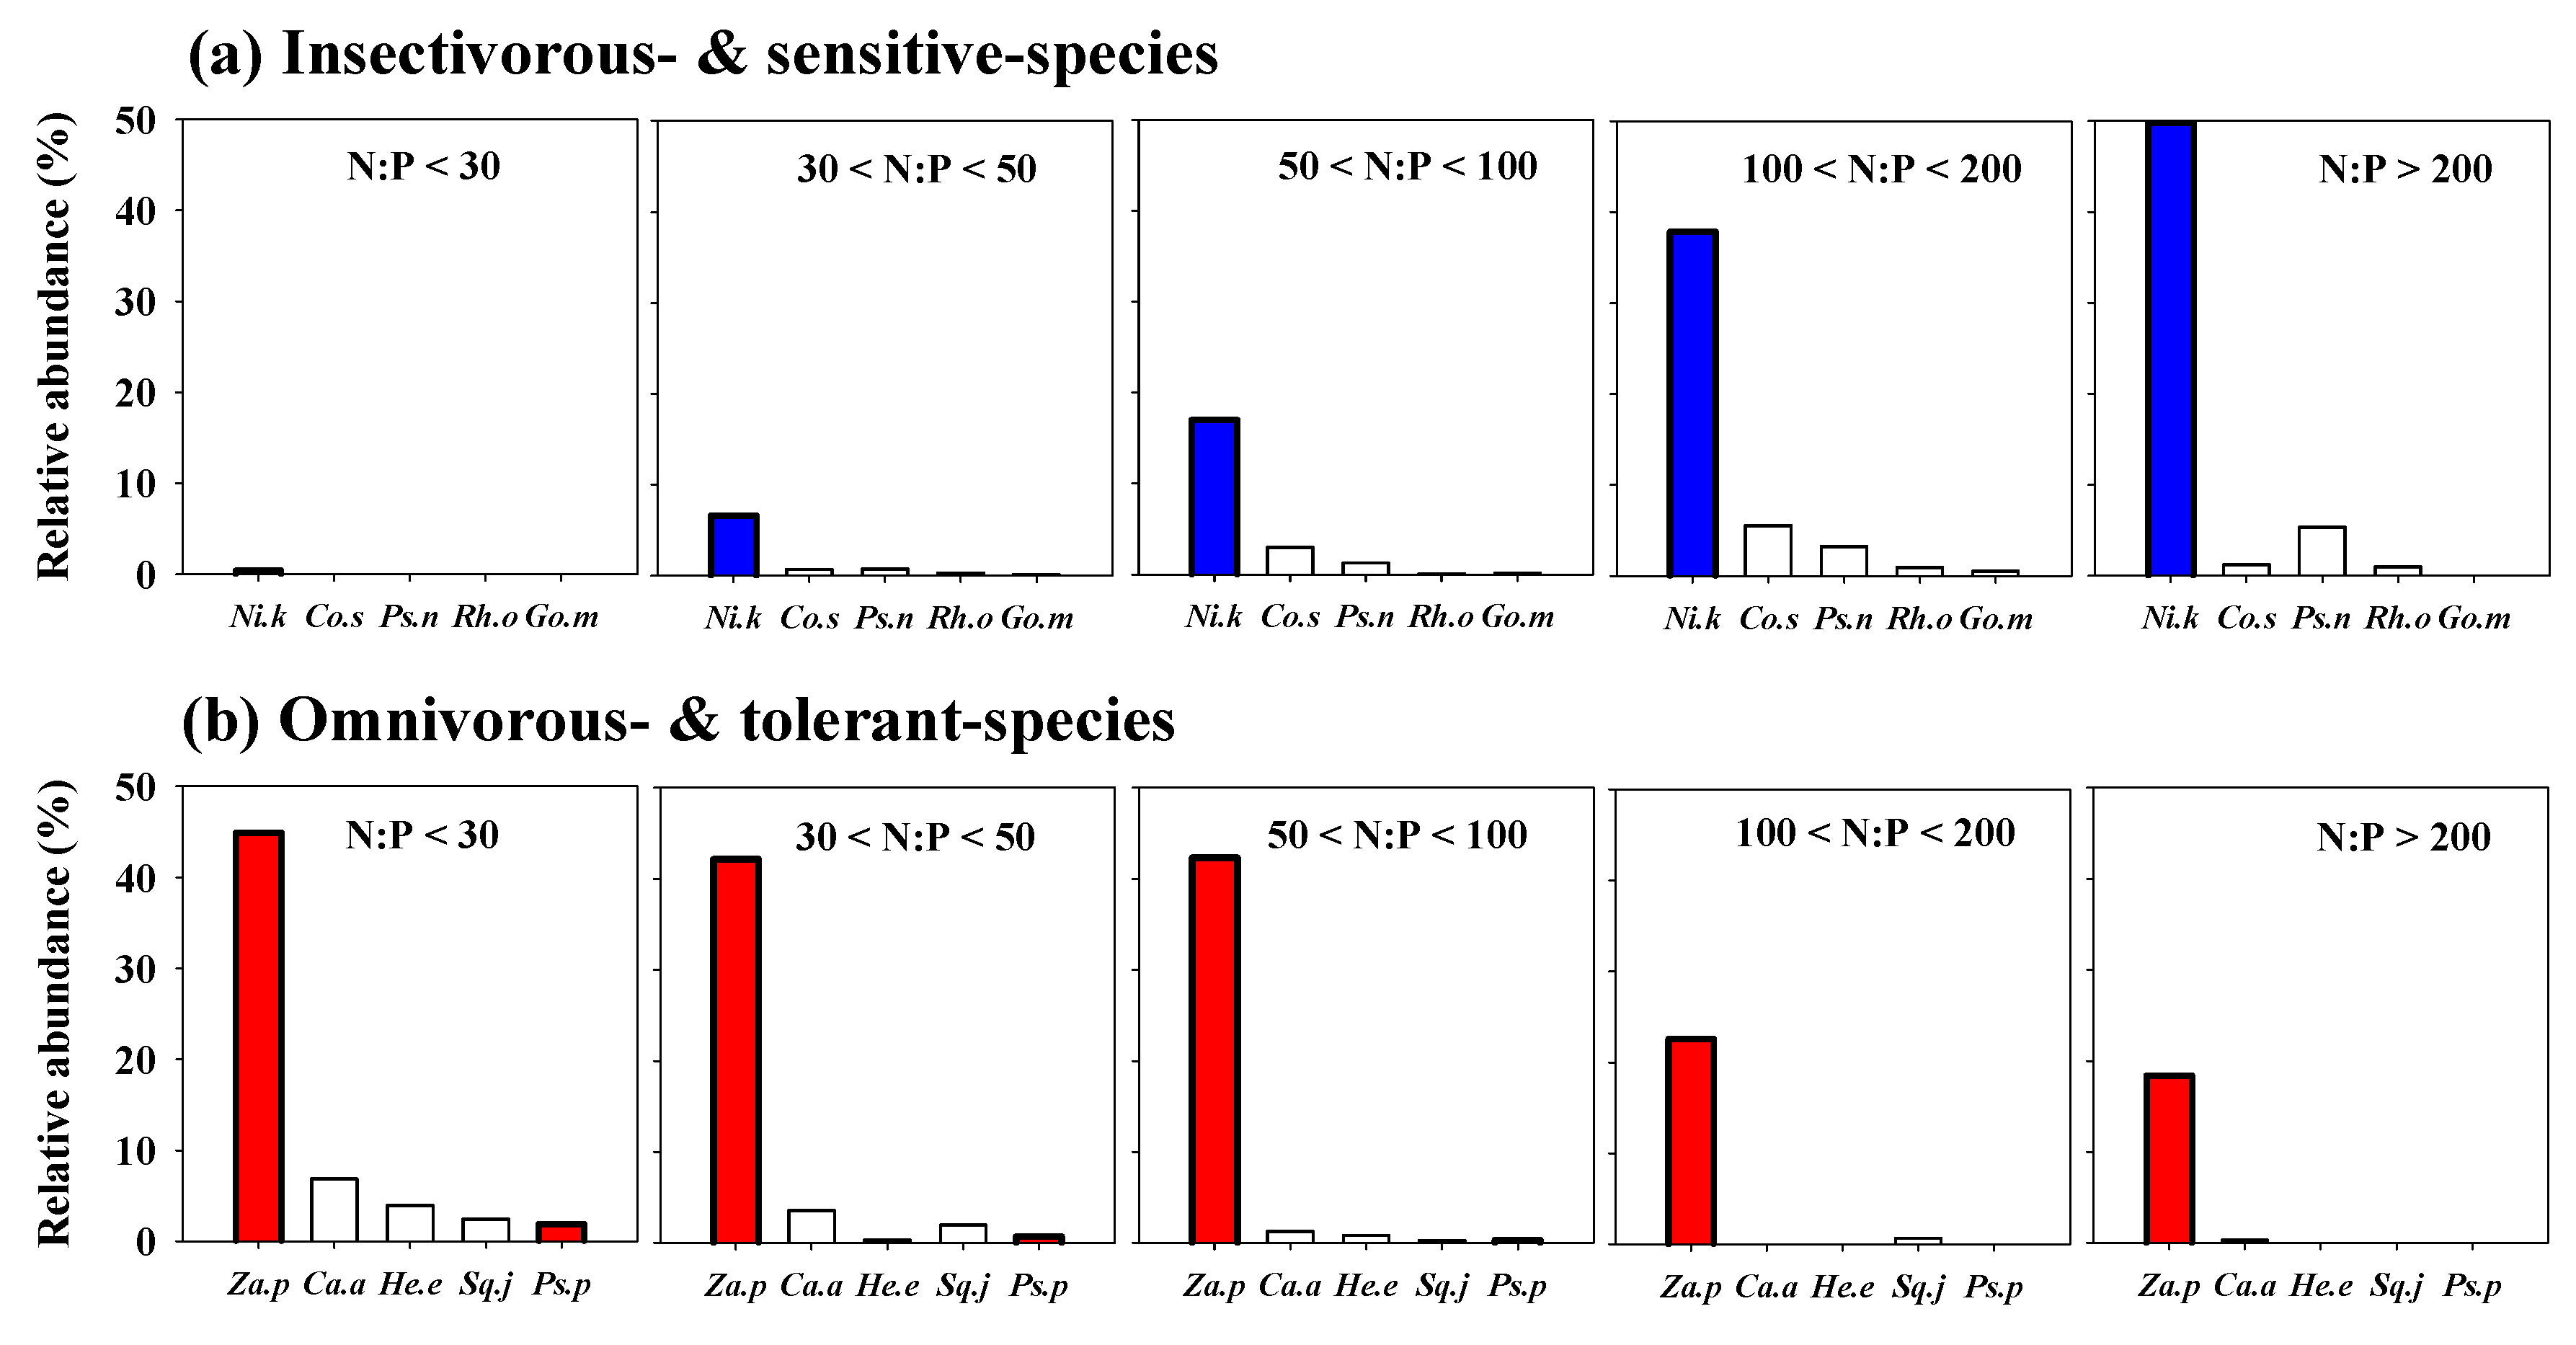
3.9. Influence of N:P Ratios on Fish Species Indicators

The N:P ratios in ambient water determined the indicator fish species in each fish community, as shown in Figure 9. The dark chub, Nipponocypris koreanus, which is known to be dominant in clean water environments [45], preferred high N:P ratios (>200); under these conditions, the relative abundance (RA) of the dark chub was 49.8%. In contrast, when the N:P ratios were < 30, the mean value of RA was only 0.4%. Thus, the abundance of N. koreanus was significantly increased (p < 0.05, r = 0.36) with high N:P ratios (Figure 9). The pale chub, Zacco platypus, which is known to be a dominant species in polluted environments [63], preferred low N:P ratios of <30; under these conditions, the relative abundance (RA) of the pale chub was 44.9%. In contrast, when the N:P ratios were >200, the mean value of RA was only 18.4%. Thus, the abundance of Z. platypus was significantly increased (p < 0.05, r = −0.18) with low N:P ratios. These results suggest that the N:P ratio should be considered as an important factor in determining the indicator fish (sensitive or tolerant species) in fish communities.
Figure 8. Scatter and simple linear regression models of (a) log10-transformed N:P ratios-trophic composition (% Is, left; % Om, right); and (b) log10-transformed N:P ratios–tolerance level (% Ss, left; % Ts, right) in the Geum River watershed. Forest = (closed circle); cropland = (closed triangle down); urban = (closed triangle up); wastewater treatment plants = ■ (closed square).
Water 08 00022 g008
Figure 9. Mass ratios in the stream water of the N:P interval, plus the trophic composition and tolerance level of relative abundance (RA) (%). Upper panels indicate a combination of (a) insectivorous and sensitive species of RA (%); (b) omnivorous and tolerance species of RA (%). Pearson’s correlations of N:P ratios with RA (%) indicate a significant increase (p < 0.05, r > 0; closed vertical blue bar: ( ), a significant decrease (p < 0.05, r < 0; closed vertical red bar: ( ), and no significant change (p > 0.05; opened vertical bar: (□). Abbreviations: Za.P, Zacco platypus; Ca.a, Carassius auratus; He.e, Hemiculter eigenmanni; Sq.j, Squalidus japonicas coreanus; Ps.p, Pseudorasbora parva; Ni.k, Nipponocypris koreanus; Co.s, Coreoleuciscus splendidus; Ps.n, Pseudopuntungia nigra; Rh.o, Rhynchocypris oxycephalus; Go.m, Gobiobotia macrocephala.
Water 08 00022 g009

4. Conclusions

This study examined the N:P ratios and biological components from low trophic level of phytoplankton to high trophic level of fish, which are influenced by land use patterns and point/nonpoint sources in the watershed of Geum River. In this watershed, nutrient regime (N, P) influenced by land use patterns (① [14]) and flow regimes (② [64]), as well as point/nonpoint sources (①, ③ [14,17]), altered the ratios of N:P (④ [22]; Figure 10) and higher trophic linkage. The N:P ratios were directly or indirectly associated with the trophic level of phytoplankton production (sestonic CHL; ⑤, ⑥ [32,65]) and were determined by P rather than N, suggesting that differences in TP and N:P ratios were related to land use patterns and the location of WTPs. Furthermore, fish trophic compositions (⑭ [8]), tolerance guilds (⑭ [8]), and fish community (⑮ [9]) were determined by the availability of food resources (⑬ [66]), which are directly influenced by N:P ratios or nutrient regimes (N, P). In other words, the N:P ratios determined the sestonic CHL, which was associated with the food chain at higher trophic levels. Fish trophic compositions and tolerance guilds (⑭ [8]) were closely associated with the food chain and were directly affected by N:P ratios in ambient water, resulting in a modification of stream ecosystem health (based on the IBI multi-metric model, ⑭ [8]). Overall, the N:P ratio may be a good surrogate variable of ambient concentrations of N or P in assessing trophic linkage and diagnosing the ecological stream health in aquatic ecosystem.
Figure 10. Schematic diagram on the control of N:P ratios on their environmental and ecological variables in aquatic ecosystems.
Water 08 00022 g010

Acknowledgments

This research was supported by the Basic Science Research Program through the National Research Foundation of Korea (NRF) funded by the Ministry of Education (No. 2013R1A1A4A01012939).

Author Contributions

Young-Jin Yun performed the data analysis and prepared illustrations. Kwang-guk An provided constructive suggestions in the preparation of this manuscript.

Conflicts of Interest

The authors declare no conflict of interest.

References

  1. Hecky, R.E.; Kilham, P. Nutrient limitation of phytoplankton in freshwater and marine environments: A review of recent evidence on the effects of enrichment. Limnol. Oceanogr. 1988, 33, 796–822. [Google Scholar] [CrossRef]
  2. Elser, J.J.; Marzolf, E.R.; Goldman, C.R. Phosphorus and nitrogen limitation of phytoplankton growth in the freshwaters of North America: A review and critique of experimental enrichments. Can. J. Fish. Aquat. Sci. 1990, 47, 1468–1477. [Google Scholar] [CrossRef]
  3. Vollenweider, R.A. Advances in defining critical loading levels for phosphorus in lake eutrophication. Mem. 1st. Ital. Idrobiol. 1976, 33, 53–83. [Google Scholar]
  4. Redfield, A.C. On the proportions of organic derivations in sea water and their relation to the composition of plankton. In James Johnstone Memorial Volume, 1st ed.; Daniel, R.J., Ed.; University Press of Liverpool: Liverpool, UK, 1934; pp. 177–192. [Google Scholar]
  5. Smith, V.H. Low nitrogen to phosphorus ratios favor dominance by blue-green algae in lake phytoplankton. J. Am. Water Resour. Assoc. 1983, 221, 669–671. [Google Scholar] [CrossRef] [PubMed]
  6. Frost, P.C.; Tank, S.E.; Turner, M.A.; Elser, J.J. Elemental composition of littoral invertebrates from oligotrophic and eutrophic Canadian lakes. J. N. Am. Benthol. Soc. 2003, 22, 51–62. [Google Scholar] [CrossRef]
  7. Cross, W.F.; Benstead, J.P.; Rosemond, A.D.; Bruce Wallace, J. Consumer-resource stoichiometry in detritus-based streams. Ecol. Lett. 2003, 6, 721–732. [Google Scholar] [CrossRef]
  8. An, K.-G.; Choi, J.-W.; Lee, Y.-J. Modifications of ecological trophic structures on chemical gradients in lotic ecosystems and their relations to stream ecosystem health. Anim. Cells Syst. 2013, 17, 53–62. [Google Scholar] [CrossRef]
  9. Kim, S-.Y.; An, K-.G. Nutrient regime, N:P ratios and suspended solids as key factors influencing fish tolerance, trophic compositions, and stream ecosystem health. J. Ecol. Environ. 2015, 38, 505–515. [Google Scholar]
  10. Guildford, S.J.; Hecky, R.E. Total nitrogen, total phosphorus, and nutrient limitation in lakes and oceans: Is there a common relationship? Limnol. Oceanogr. 2000, 45, 1213–1223. [Google Scholar] [CrossRef]
  11. Choi, J.-W.; Han, J.-H.; Park, C.-S.; Ko, D.-G.; Kang, H.-I.; Kim, J.Y.; Yun, Y.-J.; Kwon, H.-H.; An, K.-G. Nutrients and sestonic chlorophyll dynamics in Asian lotic ecosystems and ecological stream health in relation to land-use patterns and water chemistry. Ecol. Eng. 2015, 79, 15–31. [Google Scholar] [CrossRef]
  12. Stelzer, R.S.; Lamberti, G.A. Effects of N: P ratio and total nutrient concentration on stream periphyton community structure, biomass, and elemental composition. Limnol. Oceanogr. 2001, 46, 356–367. [Google Scholar] [CrossRef]
  13. Perkins, B.D.; Lohman, K.; van Nieuwenhuyse, E.; Jones, J.R. An examination of land cover and stream water quality among physiographic provinces of Missouri, U.S.A. Verh. Int. Verein. Limnol. 1998, 26, 940–947. [Google Scholar]
  14. Tran, C.P.; Bode, R.W.; Smith, A.J.; Kleppel, G.S. Land-use proximity as a basis for assessing stream water quality in New York State (USA). Ecol. Indic. 2010, 10, 727–733. [Google Scholar] [CrossRef]
  15. Loehr, R.C. Characteristics and comparative magnitude of non-point sources. J. Water Pollut. Control Fed. 1974, 46, 1849–1872. [Google Scholar]
  16. Carey, R.O.; Migliaccio, K.W. Contribution of wastewater treatment plant effluents to nutrient dynamics in aquatic systems: A review. Environ. Manag. 2009, 44, 205–217. [Google Scholar] [CrossRef] [PubMed]
  17. Haggard, B.E.; Stanley, E.H.; Storm, D.E. Nutrient retention in a point-source-enriched stream. J. N. Am. Benthol. Soc. 2005, 24, 29–47. [Google Scholar] [CrossRef]
  18. Ekka, S.A.; Haggard, B.E.; Matlock, M.D.; Chaubey, I. Dissolved phosphorus concentrations and sediment interactions in effluent-dominated Ozark streams. Ecol. Eng. 2006, 26, 375–391. [Google Scholar] [CrossRef]
  19. Tchobanoglous, G.; Burton, F.L.; Stensil, H.D. Wastewater Engineering: Treatment and Reuse, 4th ed.; McGraw-Hill: New York, NY, USA, 2003. [Google Scholar]
  20. Ra, J.S.; Kim, S.D.; Chang, N.I.; An, K.-G. Ecological health assessments based on whole effluent toxicity tests and the index of biological integrity in temperate streams influenced by wastewater treatment plant effluents. Environ. Toxicol. Chem. 2007, 26, 2010–2018. [Google Scholar] [CrossRef] [PubMed]
  21. Andersen, C.B.; Lewis, G.P.; Sargent, K.A. Influence of wastewater-treatment effluent on concentrations and fluxes of solutes in the Bush River, South Carolina, during extreme drought conditions. Environ. Geosci. 2004, 11, 28–41. [Google Scholar] [CrossRef]
  22. Downing, J.A.; McCauley, E. The nitrogen: Phosphorus relationship in lakes. Limnol. Oceanogr. 1992, 37, 936–945. [Google Scholar] [CrossRef]
  23. Redfield, A.C. The biological control of chemical factors in the environment. Am. Sci. 1958, 46, 205–221. [Google Scholar]
  24. Sakamoto, M. Primary production by phytoplankton community in some Japanese lakes and its dependence on lake depth. Arch. Hydrobiol. 1966, 62, 1–28. [Google Scholar]
  25. Forsberg, C.; Ryding, S.O. Eutrophication parameters and trophic state indices in 30 Swedish waste receiving lakes. Arch. Hydrobiol. 1980, 89, 189–207. [Google Scholar]
  26. Huber, W.C.; Brezonik, P.L.; Heaney, J.P.; Dickinson, R.E.; Preston, S.D.; Dwornik, D.S.; DeMaio, M.A. A Classification of Florida Lakes, 1st ed.; Water Resources Research Center, University of Florida: Tallahassee, FL, USA, 1982; pp. 1–547. [Google Scholar]
  27. Canfield, D.E. Prediction of chlorophyll a concentrations in Florida lakes: The importance of phosphorus and nitrogen. J. Am. Water Resour. Assoc. 1983, 19, 255–262. [Google Scholar] [CrossRef]
  28. Biggs, B.J. Eutrophication of streams and rivers: Dissolved nutrient-chlorophyll relationships for benthic algae. J. N. Am. Benthol. Soc. 2000, 19, 17–31. [Google Scholar] [CrossRef]
  29. Volk, C.; Kiffney, P. Comparison of fatty acids and elemental nutrients in periphyton, invertebrates, and cutthroat trout (oncorhynchus clarki) in conifer and alder streams of western washington state. Aquat. Ecol. 2012, 46, 85–99. [Google Scholar] [CrossRef]
  30. Deans, C.A.; Behmer, S.T.; Kay, A.; Voelz, N. The importance of dissolved N:P ratios on mayfly (baetis spp.) growth in high-nutrient detritus-based streams. Hydrobiologia 2014, 742, 15–26. [Google Scholar] [CrossRef]
  31. Smith, V.H. Predictive models for the biomass of blue-green algae in lakes. J. Am. Water Resour. Assoc. 1985, 21, 433–439. [Google Scholar] [CrossRef]
  32. Klausmeier, C.A.; Litchman, E.; Daufresne, T.; Levin, S.A. Optimal nitrogen-phosphorus stoichiometry of phytoplankton. Nature 2004, 429, 171–174. [Google Scholar] [CrossRef] [PubMed]
  33. Lindeman, R.L. The trophic-dynamic aspect of ecology. Ecology 1942, 23, 399–417. [Google Scholar] [CrossRef]
  34. Jeppesen, E.; Peder Jensen, J.; SØndergaard, M.; Lauridsen, T.; Landkildehus, F. Trophic structure, species richness and biodiversity in Danish lakes: Changes along a phosphorus gradient. Freshw. Biol. 2000, 45, 201–218. [Google Scholar] [CrossRef]
  35. Bachmann, R.W.; Jones, B.L.; Fox, D.D.; Hoyer, M.; Bull, L.A.; Canfield, D.E., Jr. Relations between trophic state indicators and fish in Florida (USA) lakes. Can. J. Fish. Aquat. Sci. 1996, 53, 842–855. [Google Scholar] [CrossRef]
  36. Rohlich, G.A. Fish as indices of eutrophication. In Eutrophication: Causes, Consequences, Correctives, Proceedings of a Symposium, 1st ed.; Larkin, P.A., Northcote, T.G., Eds.; National Academy of Sciences: Washington, DC, USA, 1969; Volume 1, pp. 256–273. [Google Scholar]
  37. Oberdorff, T.; Pont, D.; Hugueny, B.; Porcher, J.-P. Development and validation of a fish-based index for the assessment of “river health” in France. Freshw. Biol. 2002, 47, 1720–1734. [Google Scholar] [CrossRef]
  38. Choi, J.-W.; Kumar, H.K.; Han, J.-H.; An, K.-G. The development of a regional multimetric fish model based on biological integrity in lotic ecosystems and some factors influencing the stream health. Water Air Soil Pollut. 2011, 217, 3–24. [Google Scholar] [CrossRef]
  39. Frey, J.W.; Bell, A.H.; Hambrook Berkman, J.A.; Lorenz, D.L. Assessment of Nutrient Enrichment by Use of Algal-, Invertebrate-, and Fish Community Attributes in Wadeable Streams in Ecoregions Surrounding the Great Lakes; U.S. Geological Survey Scientific Investigations Report 2011–5009; U.S. Geological Survey: Reston, WV, USA, 2011; pp. 1–49.
  40. Noble, R.A.A.; Cowx, I.G.; Goffaux, D.; Kestemont, P. Assessing the health of European rivers using functional ecological guilds of fish communities: Standardising species classification and approaches to metric selection. Fish. Manag. Ecol. 2007, 14, 381–392. [Google Scholar] [CrossRef]
  41. Eaton, A.D.; Franson, M.A.H. (Eds.) Standard Methods for the Examination of Water and Wastewater; American Public Health Association: Washington, DC, USA, 2005.
  42. Marker, A.F.H.; Crowther, C.A.; Gunn, R.J.M. Methanol and acetone as solvents for estimating chlorophyll a and phaeopigments by spectrophotometry. Arch. Hydrobiol. Beih. Ergebn. Limnol. 1980, 14, 52–69. [Google Scholar]
  43. The Ministry of Environment (MOE)/National Institute of Environmental Research (NIER). Researches for Integrative Assessment Methodology of Aquatic Environments (III): Development of Aquatic Ecosystem Health Assessment and Evaluation System, 1st ed.; MOE/NIER: Incheon, Korea, 2006. [Google Scholar]
  44. The Ministry of Environment (MOE)/National Institute of Environmental Research (NIER). The Survey and Evaluation of Aquatic Ecosystem Health in Korea, 1st ed.; MOE/NIER: Incheon, Korea, 2008. [Google Scholar]
  45. Lee, J.H.; Han, J.H.; Kumar, H.K.; Choi, J.K.; Byeon, H.K.; Choi, J.; Kim, J.K.; Jang, M.H.; Park, H.K.; An, K.-G. National-level integrative ecological health assessments based on the index of biological integrity, water quality, and qualitative habitat evaluation index, in Korea rivers. Ann. Limnol. Int. J. Lim. 2011, 47, S73–S89. [Google Scholar] [CrossRef]
  46. Plafkin, J.L.; Barbour, M.T.; Porter, K.D.; Gross, S.K.; Hughes, R.M. Rapid Bioassessment Protocols for Use in Streams and Rivers: Benthic Macroinvertebrate and Fish; EPA/444/4-89-001; Office of Water Regulations and Standards; US EPA: Washington, DC, USA, 1989; pp. 1–34.
  47. Barbour, M.T.; Gerritsen, J.; Snyder, B.D.; Stribling, J.B. Rapid Bioassessment Protocols for Use in Streams and Wadeable Rivers: Periphyton, Benthic Macroinvertebrates and Fish, 2nd ed.EPA 841-B-99-002; U.S. Environmental Protection Agency, Office of Water: Washington, DC, USA, 1999; pp. 1–35.
  48. An, K.-G.; Park, S.S.; Shin, J.-Y. An evaluation of a river health using the index of biological integrity along with relations to chemical and habitat conditions. Environ. Int. 2002, 28, 411–420. [Google Scholar] [CrossRef]
  49. Ohio, E.P.A. Biological Criteria for the Protection of Aquatic Life: Volume III. Standardized Biological Field Sampling and Laboratory Method for Assessing Fish and Macroinvertebrate Communities, 2nd ed.; Ohio, E.P.A., Ed.; Columbus, OH, USA, 2015; pp. 1–64. [Google Scholar]
  50. U.S. EPA. Fish Field and Laboratory Methods for Evaluating the Biological Integrity of Surface Waters; EPA 600-R-92-111; Environmental Monitoring Systems Laboratory-Cincinnati office of Modeling, Monitoring Systems, and Quality Assurance Office of Research Development, U.S. EPA: Cincinnati, OH, USA, 1993; pp. 1–348.
  51. Kim, I.S.; Choi, Y.; Lee, C.L.; Lee, Y.J.; Kim, B.J.; Kim, J.H. Illustrated Book of Korean Fishes, 1st ed.; Kyohak: Seoul, Korea, 2005. [Google Scholar]
  52. Han, J.-H.; Park, C.-S.; An, J.-W.; An, K.-G.; Baek, W.-K. A Guide Book of Freshwater Fishes, 1st ed.; National Science Museum: Daejeon, Korea, 2015. [Google Scholar]
  53. FishBase. World Wide Web Electronic Publication. Available online: http: //www.fishbase.org (accessed on 18 May 2015).
  54. Sanders, R.E.; Miltner, R.J.; Yoder, C.O.; Rankin, E.T. The use of external deformities, erosion, lesions, tumors (DELT anomalies) in fish assemblages for characterizing aquatic resources: A case study of seven Ohio streams. In Assessing the Sustainability and Biological Integrity of Water Resources Using Fish Communities, 1st ed.; Simon, T.P., Ed.; CRC: Boca Raton, FL, USA, 1999; pp. 225–245. [Google Scholar]
  55. Karr, J.R. Assessment of biotic integrity using fish communities. Fisheries 1981, 6, 21–27. [Google Scholar] [CrossRef]
  56. Karr, J.R.; Fausch, K.D.; Angermeier, P.L.; Yant, P.R.; Schlosser, I.J. Assessing Biological Integrity in Running Water: A Method and Its Rationale, 1st ed.; Illinois National History Survey Special Publication 5: Champaign, IL, USA, 1986; pp. 1–28. [Google Scholar]
  57. An, K.-G.; Park, S.S. Indirect influence of the summer monsoon on chlorophyll-total phosphorus models in reservoirs: A case study. Ecol. Models 2002, 152, 191–203. [Google Scholar] [CrossRef]
  58. An, K.-G. Long-term seasonal and interannual variability of epilimnetic nutrients (N, P), chlorophyll-a, and suspended solids at the Dam site of Yongdam Reservoir and empirical models. Korean J. Limnol. 2011, 44, 214–225. [Google Scholar]
  59. Van Nieuwenhuyse, E.E.; Jones, J.R. Phosphorus-chlorophyll relationship in temperate streams and its variation with stream catchment area. Can. J. Fish. Aquat. Sci. 1996, 53, 99–105. [Google Scholar] [CrossRef]
  60. Miltner, R.J.; Rankin, E.T. Primary nutrients and the biotic integrity of rivers and streams. Freshw. Biol. 1998, 40, 145–158. [Google Scholar] [CrossRef]
  61. Lee, J.H.; An, K.-G. Integrative restoration assessment of an urban stream using multiple modeling approaches with physical, chemical, and biological integrity indicators. Ecol. Eng. 2014, 62, 153–167. [Google Scholar] [CrossRef]
  62. Robertson, D.M.; Graczyk, D.J.; Garrison, P.J.; Wang, L.; LaLiberte, G.; Bannerman, R. Nutrient Concentrations and Their Relations to the Biotic Integrity of Wadeable Streams in Wisconsin, 1st ed.; Professional Paper 1722; U.S. Geological Survey: Reston, VA, USA, 2006; pp. 1–139. [Google Scholar]
  63. Yeom, D.-H.; Lee, S.-A.; Kang, G.S.; Seo, J.; Lee, S.-K. Stressor identification and health assessment of fish exposed to wastewater effluents in Miho Stream, South Korea. Chemosphere 2007, 67, 2282–2292. [Google Scholar] [CrossRef] [PubMed]
  64. Green, M.B.; Finlay, J.C. Patterns of hydrologic control over stream water total nitrogen to total phosphorus ratios. Biogeochemistry 2010, 99, 15–30. [Google Scholar] [CrossRef]
  65. Ellison, M.E.; Brett, M.T. Particulate phosphorus bioavailability as a function of stream flow and land cover. Water Res. 2006, 40, 1258–1268. [Google Scholar] [CrossRef] [PubMed]
  66. Higgins, K.A.; Vanni, M.J.; González, M. Detritivory and the stoichiometry of nutrient cycling by a dominant fish species in lakes of varying productivity. Oikos 2006, 114, 419–430. [Google Scholar] [CrossRef]

