Article

Analysis and GIS Mapping of Flooding Hazards on 10 May 2016, Guangzhou, China

1
State Key Laboratory of Ocean Engineering and Collaborative Innovation Center for Advanced Ship and Deep-Sea Exploration (CISSE), Department of Civil Engineering, Shanghai Jiao Tong University, Shanghai 200240, China
2
Jinan Rail Transit Group Co., Ltd., Jinan 250101, Shandong, China
3
College of Architecture and Civil Engineering, Shandong University of Science and Technology, Qingdao 266590, Shandong, China
4
Department of Earth and Atmospheric Science, The National Center for Airborne Laser Mapping (NCALM), University of Houston, Houston, TX 77204-5007, USA
*
Author to whom correspondence should be addressed.
Water 2016, 8(10), 447; https://doi.org/10.3390/w8100447
Submission received: 9 August 2016 / Revised: 6 September 2016 / Accepted: 8 October 2016 / Published: 12 October 2016

Abstract

:
On 10 May 2016, Guangdong Province, China, suffered a heavy rainstorm. This rainstorm flooded the whole city of Guangzhou. More than 100,000 people were affected by the flooding, in which eight people lost their lives. Subway stations, cars, and buses were submerged. In order to analyse the influential factors of this flooding, topographical characteristics were mapped using Digital Elevation Model (DEM) by the Geographical Information System (GIS) and meteorological conditions were statistically summarised at both the whole city level and the district level. To analyse the relationship between flood risk and urbanization, GIS was also adopted to map the effect of the subway system using the Multiple Buffer operator over the flooding distribution area. Based on the analyses, one of the significant influential factors of flooding was identified as the urbanization degree, e.g., construction of a subway system, which forms along flood-prone areas. The total economic loss due to flooding in city centers with high urbanization has become very serious. Based on the analyses, the traditional standard of severity of flooding hazards (rainfall intensity grade) was modified. Rainfall intensity for severity flooding was decreased from 50 mm to 30 mm in urbanized city centers. In order to protect cities from flooding, a “Sponge City” planning approach is recommended to increase the temporary water storage capacity during heavy rainstorms. In addition, for future city management, the combined use of GIS and Building Information Modelling (BIM) is recommended to evaluate flooding hazards.

1. Introduction

Global warming is a phenomenon that is generally accepted to be mainly due to anthropic activity or a combination of anthropic and natural factors. Global warming can result in extreme precipitation in some parts of the world. The impact of flooding is often considered a consequence of global warming [1,2,3]. The risk of flooding due to intensive precipitation events will increase as the earth’s temperature increases [4,5,6]. Flooding caused by heavy rainstorms is considered to be the most common natural disaster occurring worldwide during the last few decades. Flooding has led to serious disasters in recent years, with huge associated economic losses. Flooding will also induce other natural hazards (e.g., landslides, sink holes), which may pose further danger to people and the environment. Flooding is a globally occurring natural hazard that results in widespread damage to personal property and the environment, and flooding has caused many environmental and socioeconomic consequences within the flood-prone areas [7,8].
Guangzhou is located in the Pearl River Delta, on the northern boundary of the South China Sea. Guangzhou is a typical coastal city with frequent heavy rainstorms. The climate characteristics, weather systems, and geographical position are major factors in the formation of heavy rainstorms. Figure 1 shows the location of the study area in Guangdong Province. Climate change does affect the amount of rainfall in Guangzhou, and results in a higher level of precipitation [9]. Fluctuations in temperature and air pressure can result in heavy rainfall with flooding in the summer months [10,11]. The frequent flooding events in Guangzhou have caused huge economic losses and also endangered the lives of citizens. Therefore, analysis of the contributing factors and investigation of the spatial and temporal characteristics of heavy rainfall in Guangzhou are required.
Guangzhou is also characterised by its karst topography. Figure 1 shows the distribution of karst caves in Guangdong province. Guangzhou is located in the karst area of southern China. The karst or karst caverns, which are buried underground at depths of up to 50 m, form a complex network system. When there is high-intensity rainfall, karst cavern network may store large amounts of rainwater, which cause underground hazards such as sinkholes [12,13]. Therefore, the karst areas of South China face serious challenges with the increased risk of flooding caused by heavy rainfall.
With the rapid economic development of the coastal regions of China, a large population has migrated to coastal cities in the last 20 years. Statistical analysis showed that the coastal population in 1985 was 8.6%, and increased to 19.7% in 2010 [14]. The expansion of the population in coastal cities results in rapid urbanisation [15,16]. Increasing traffic congestion has led to a demand for the development of urban railway transportation systems in big cities such as Beijing, Shanghai, Guangzhou, and Chongqing, where there has been construction of underground tunnels, and deep excavation in urban areas [17,18,19]. Urbanisation also causes other environmental and geological problems, such as groundwater pollution, land subsidence, sink holes in urban areas, and an increased risk of flooding [20,21,22,23,24]. To solve these problems, ground improvement technology has been developed and new environment-friendly geomaterials have been invented [25,26,27]. In Guangzhou, a number of subway lines have been constructed recently. The presence of these underground subway lines leads to the surrounding environment becoming vulnerable to the consequences of heavy rainstorms and prone to flooding.
In recent years, Guangzhou City has suffered from frequent flooding. According to the statistics of historic rainfall characteristics, the rainfall and rainy days increased annually. Since the start of the flood season (May to July), Guangzhou City has experienced continuous heavy rain. On 10 May 2016, flooding caused by heavy rainfall hit Guangzhou City. The whole city was flooded within 16 h from 4:00 P.M. on 9 May to 8:30 A.M. on 10 May. This flooding strongly affected local people’s lives and killed eight people.
Topography has a significant role on the forming and distribution of flooding [28,29,30]. Elevation and slope are generally used to quantify topographic variation. Elevation is an important factor in flooding after rainstorms. A ground surface with a lower elevation has a high possibility of flooding. Surfaces with a steep slope have a low possibility of being inundated because floodwater can easily drain towards the downslope. Elevation and slope were generated from a digital elevation model (DEM) using GIS [31].
It is significant to analyse flood risk based on topography and historical rainfall record. GIS is a useful tool to assess flood-prone areas. Topography characteristics can be extracted using the DEM and the influence of the metro system can be analysed using the Multiple Buffer Operator in the ArcMap environment [31]. Linear regression is also an effective method to analyse historical rainfall. Based on statistical analysis, this paper analysed the historical rainfall record and the rainfall that occurred on 10 May 2016 in Guangzhou City.
The objectives of this paper are to (i) report on the flooding that happened on 10 May 2016; (ii) analyse the factors associated with flooding based on topography and historical rainfall data; (iii) plot the flood-prone areas by considering the spatial distribution of subway system using GIS mapping; and (iv) discuss future flooding prevention measures.

2. Methodology

2.1. GIS Mapping

This paper using three-dimensional Analyst Tools in ArcGIS version 10.2 analysed the topography characteristics of the spatial distribution of elevation and slope in Guanzhou. The characteristics of the river system were also depicted by GIS. These data were obtained from Geospacial Data Cloud. In order to analyse the relationship between flood risk and urbanization, GIS mapping has been used to consider the effect of the subway system on the flooding distribution areas and to delineate the influence areas of subway lines. In order to evaluate the effects of subway lines during rainfall conditions, the flood-prone areas have been analysed. The influence of subway system and the flood-prone areas were analysed using the Multiple Buffer Operator in ArcMap. The value of buffer distance was based on the scale of the tunnel model. The scale of the distance to stratum during construction of tunneling can be determined by the following equation (Peck 1969) [32]:
S x = S m a x e x 2 2 i 2 ,
where Sx is a settlement with a distance from tunnel axis x; Smax is the maximum settlement at the ground surface over the tunnel; and i is defined as i = 0.5 d, in which d is a distance from the surface of tunnel axis. The settlement induced by tunnel construction generally ranges from 40 m to 60 m. Shen et al.’s fieldwork results also showed that there exists a ground surface settlement trough similar to Equation (1) along subway lines, induced by long-term train running [33]. Therefore, the buffer distance was designated as 50 m when assessing the scale of flood-prone areas.

2.2. Statistical Analysis

In order to analyse the characteristics of the rainfall in Guangzhou City, this paper used the method of linear regression to analyse the rainfall characteristics both at the whole city level and the district level. Based on the precipitation and possibility of flooding, this paper analysed the heavy rainfall that occurred on 10 May 2016. The value of rainfall was obtained from the China Meteorological Data Network in seven hydrological station of Guangzhou. The Thiessen polygon method was used to assess the rainfall distribution via considering topography characteristics. The theory of the method is based on the following equation:
Q = 1 A i = 1 i = n Q i A i ,
where Q is the average rainfall in an area; A represents the scale of the area; Qi is the rainfall in the area of Tyson triangle; and Ai represents the scale of the Tyson triangle [31].
There are many classification systems for defining the hazard level of flooding disasters, taking into account the probability, duration, and area of flooding. In Guangdong Province, the rainfall intensity grade is determined by parameter “R”. R is defined by the amount of precipitation within 24 h. When “R” is more than 50 mm, this is defined as a “heavy rain day”, and when “R” is more than 100 mm, this is defined as a “torrential rain day” [1].
In order to evaluate the severity of flooding hazards, based on the historical records in Guangdong province, a value of Rs was used; Rs represents the precipitation within 24 h. The Rs value was used to determine whether the area will develop flooding or not and the flooding severity grade [7]. The severity of flooding hazards is classified into five levels according to the Bureau of Meteorology of Guangzhou, i.e., (1) catastrophic flooding (Rs is more than 250 mm/24-h); (2) severe flooding (Rs ranges from 250 mm to 100 mm/24-h); (3) common flooding (Rs ranges from 100 mm to 50 mm/24-h); (4) light flooding (Rs ranges from 50 mm to 25 mm/24-h); and (5) no flooding (Rs ranges from 25 mm to 0 mm/24-h). Based on the aforementioned classification, this paper identifies the level of flooding hazards on 10 May 2016 in Guangzhou.

3. Characteristics of Study Area
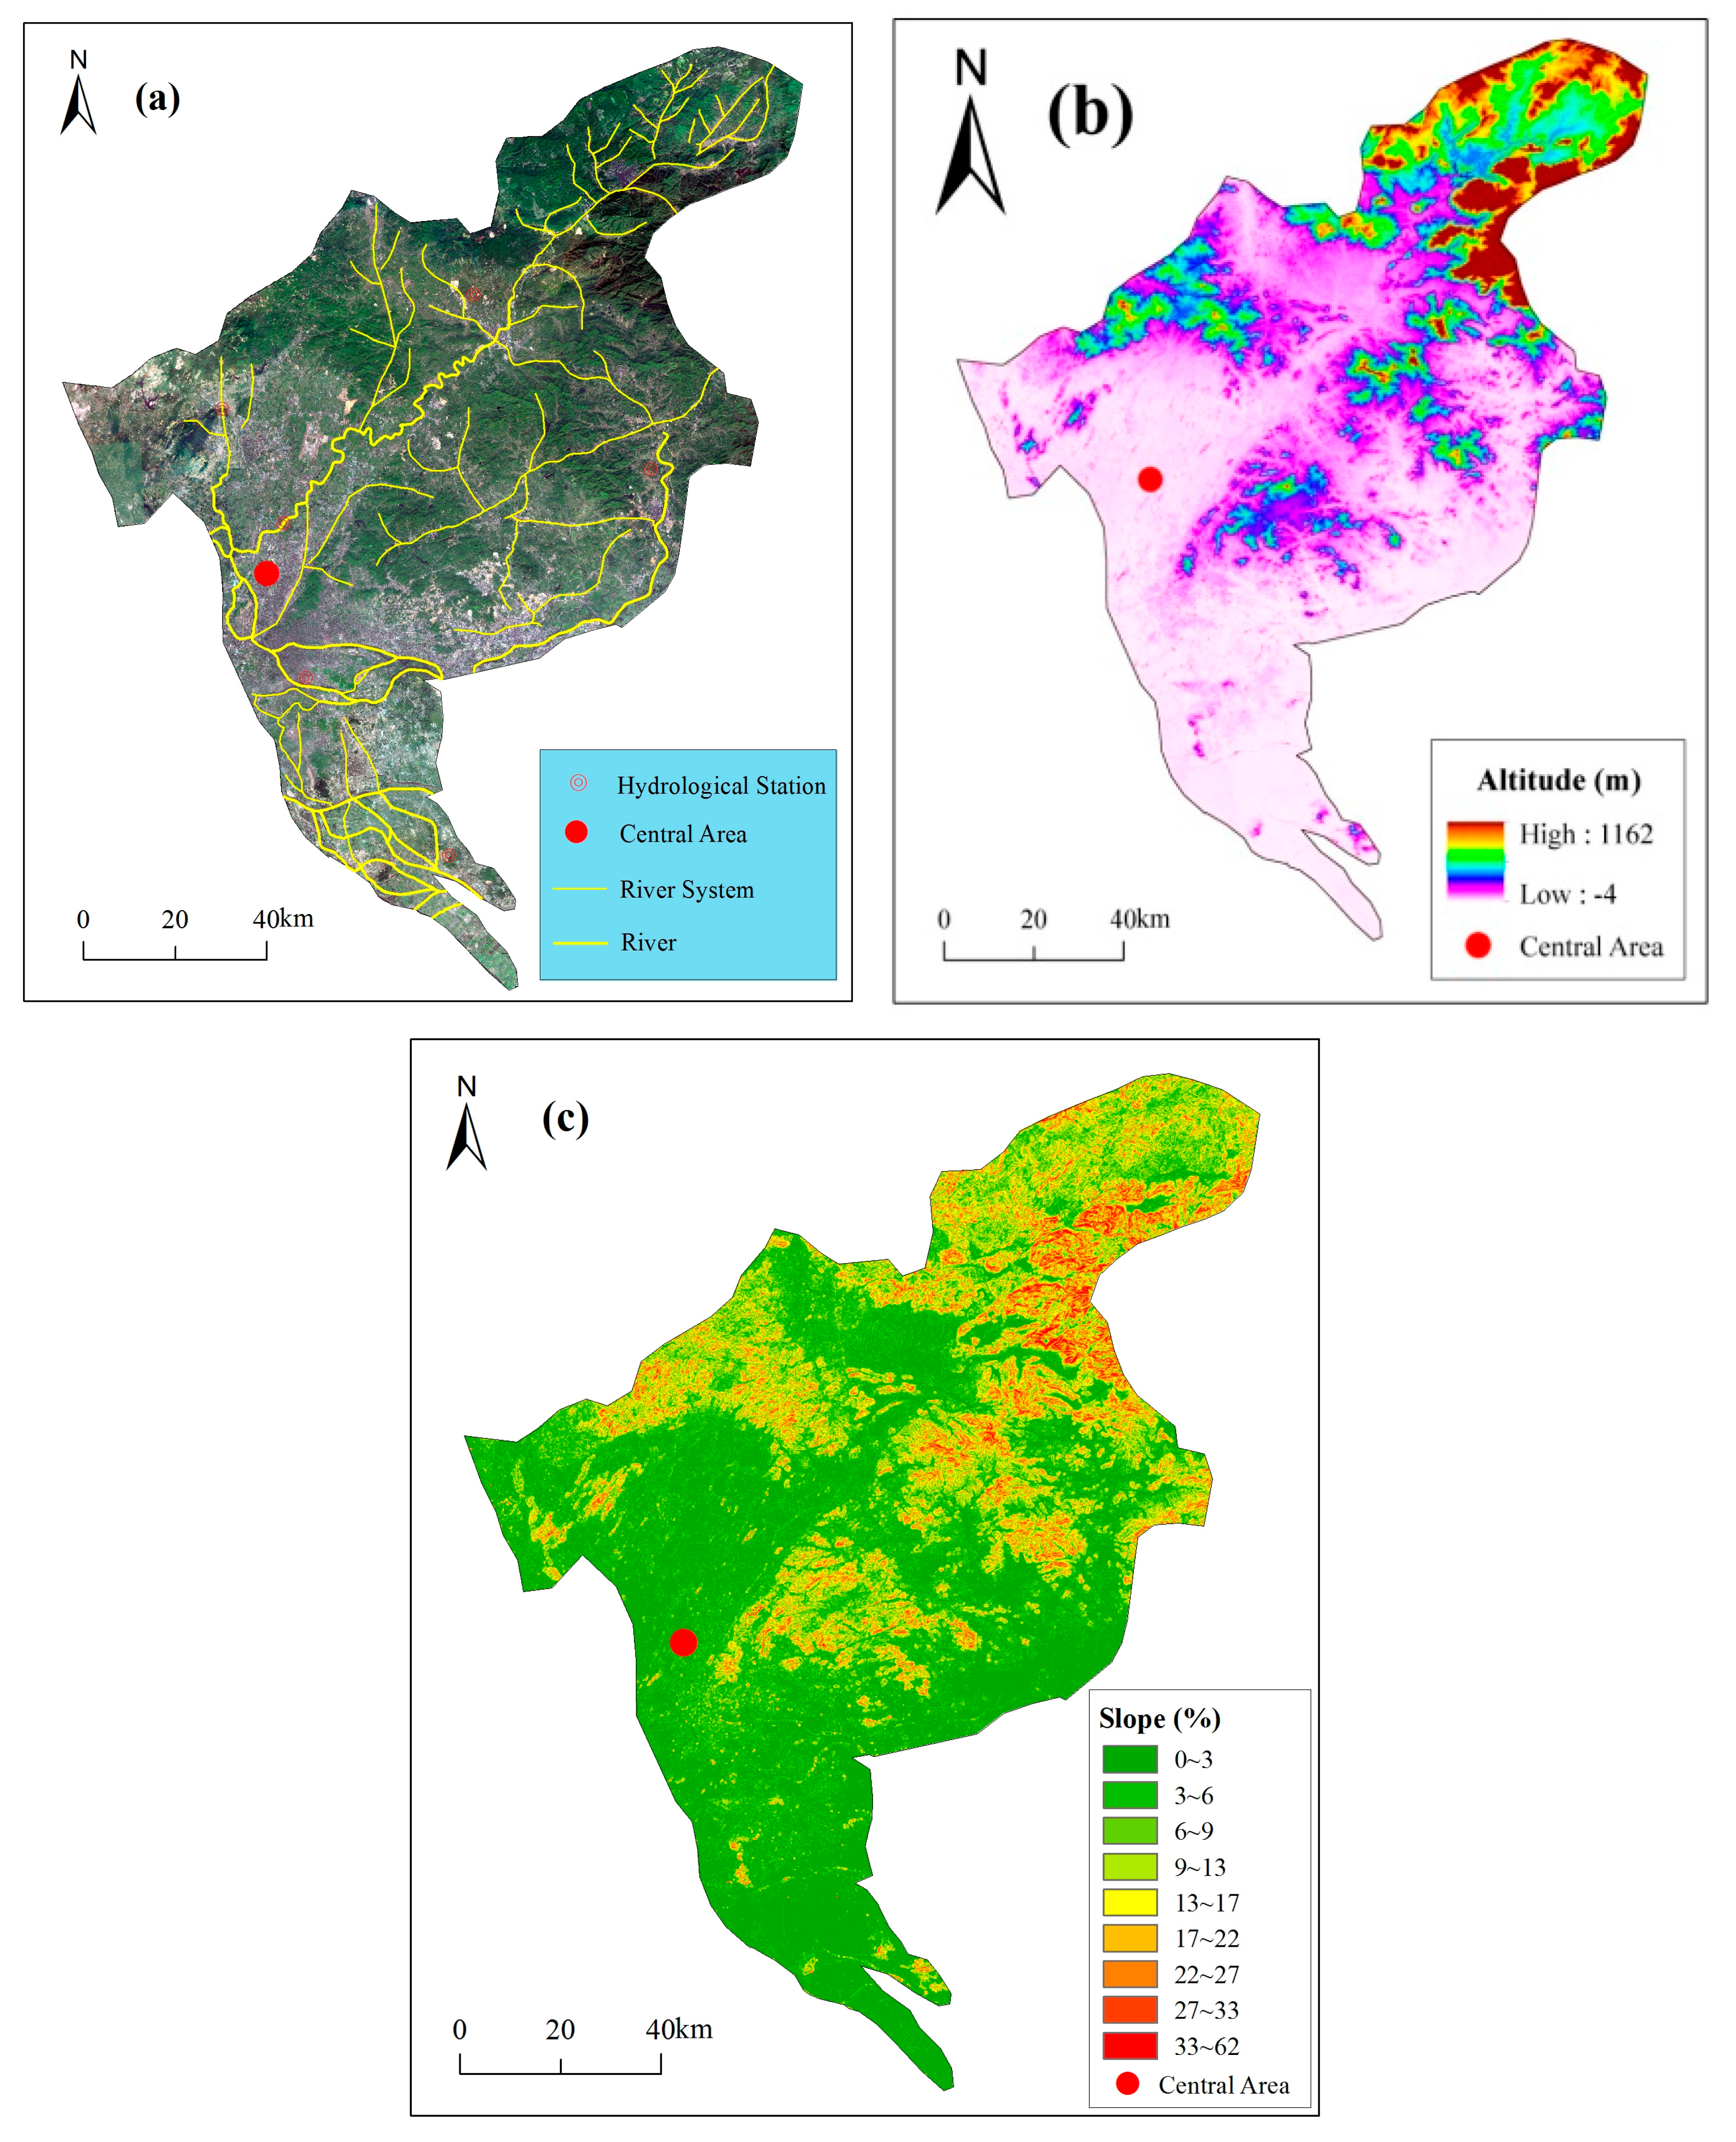
3.1. Topography

Figure 2 shows the topography of Guangzhou. The river network is densely distributed in Guangzhou. Pear River runs through the central area and ultimately flows into the South China Sea (Figure 2a). The average elevation of Guangzhou is 11 m, and the highest peak is 1100 m and is located at the boundary of Conghua district and Longmen county. The central area lies in the hilly basin region. As a part of the Pearl River Delta, the Fanyu and Conghua districts are on the coastal alluvial plain. The elevation of the central area is lower than that of the northeast area, and the slope in the northeast area is steeper than in the central area, which means that rainwater always flows from the northeast to the central area. This type of topography causes the central areas to be vulnerable to flooding. The special geographical position and topography determine the distribution of flooding caused by heavy rainstorms. The spatial distribution of elevation and slope of Guanzhou are depicted in Figure 2b,c.

3.2. Meteorology

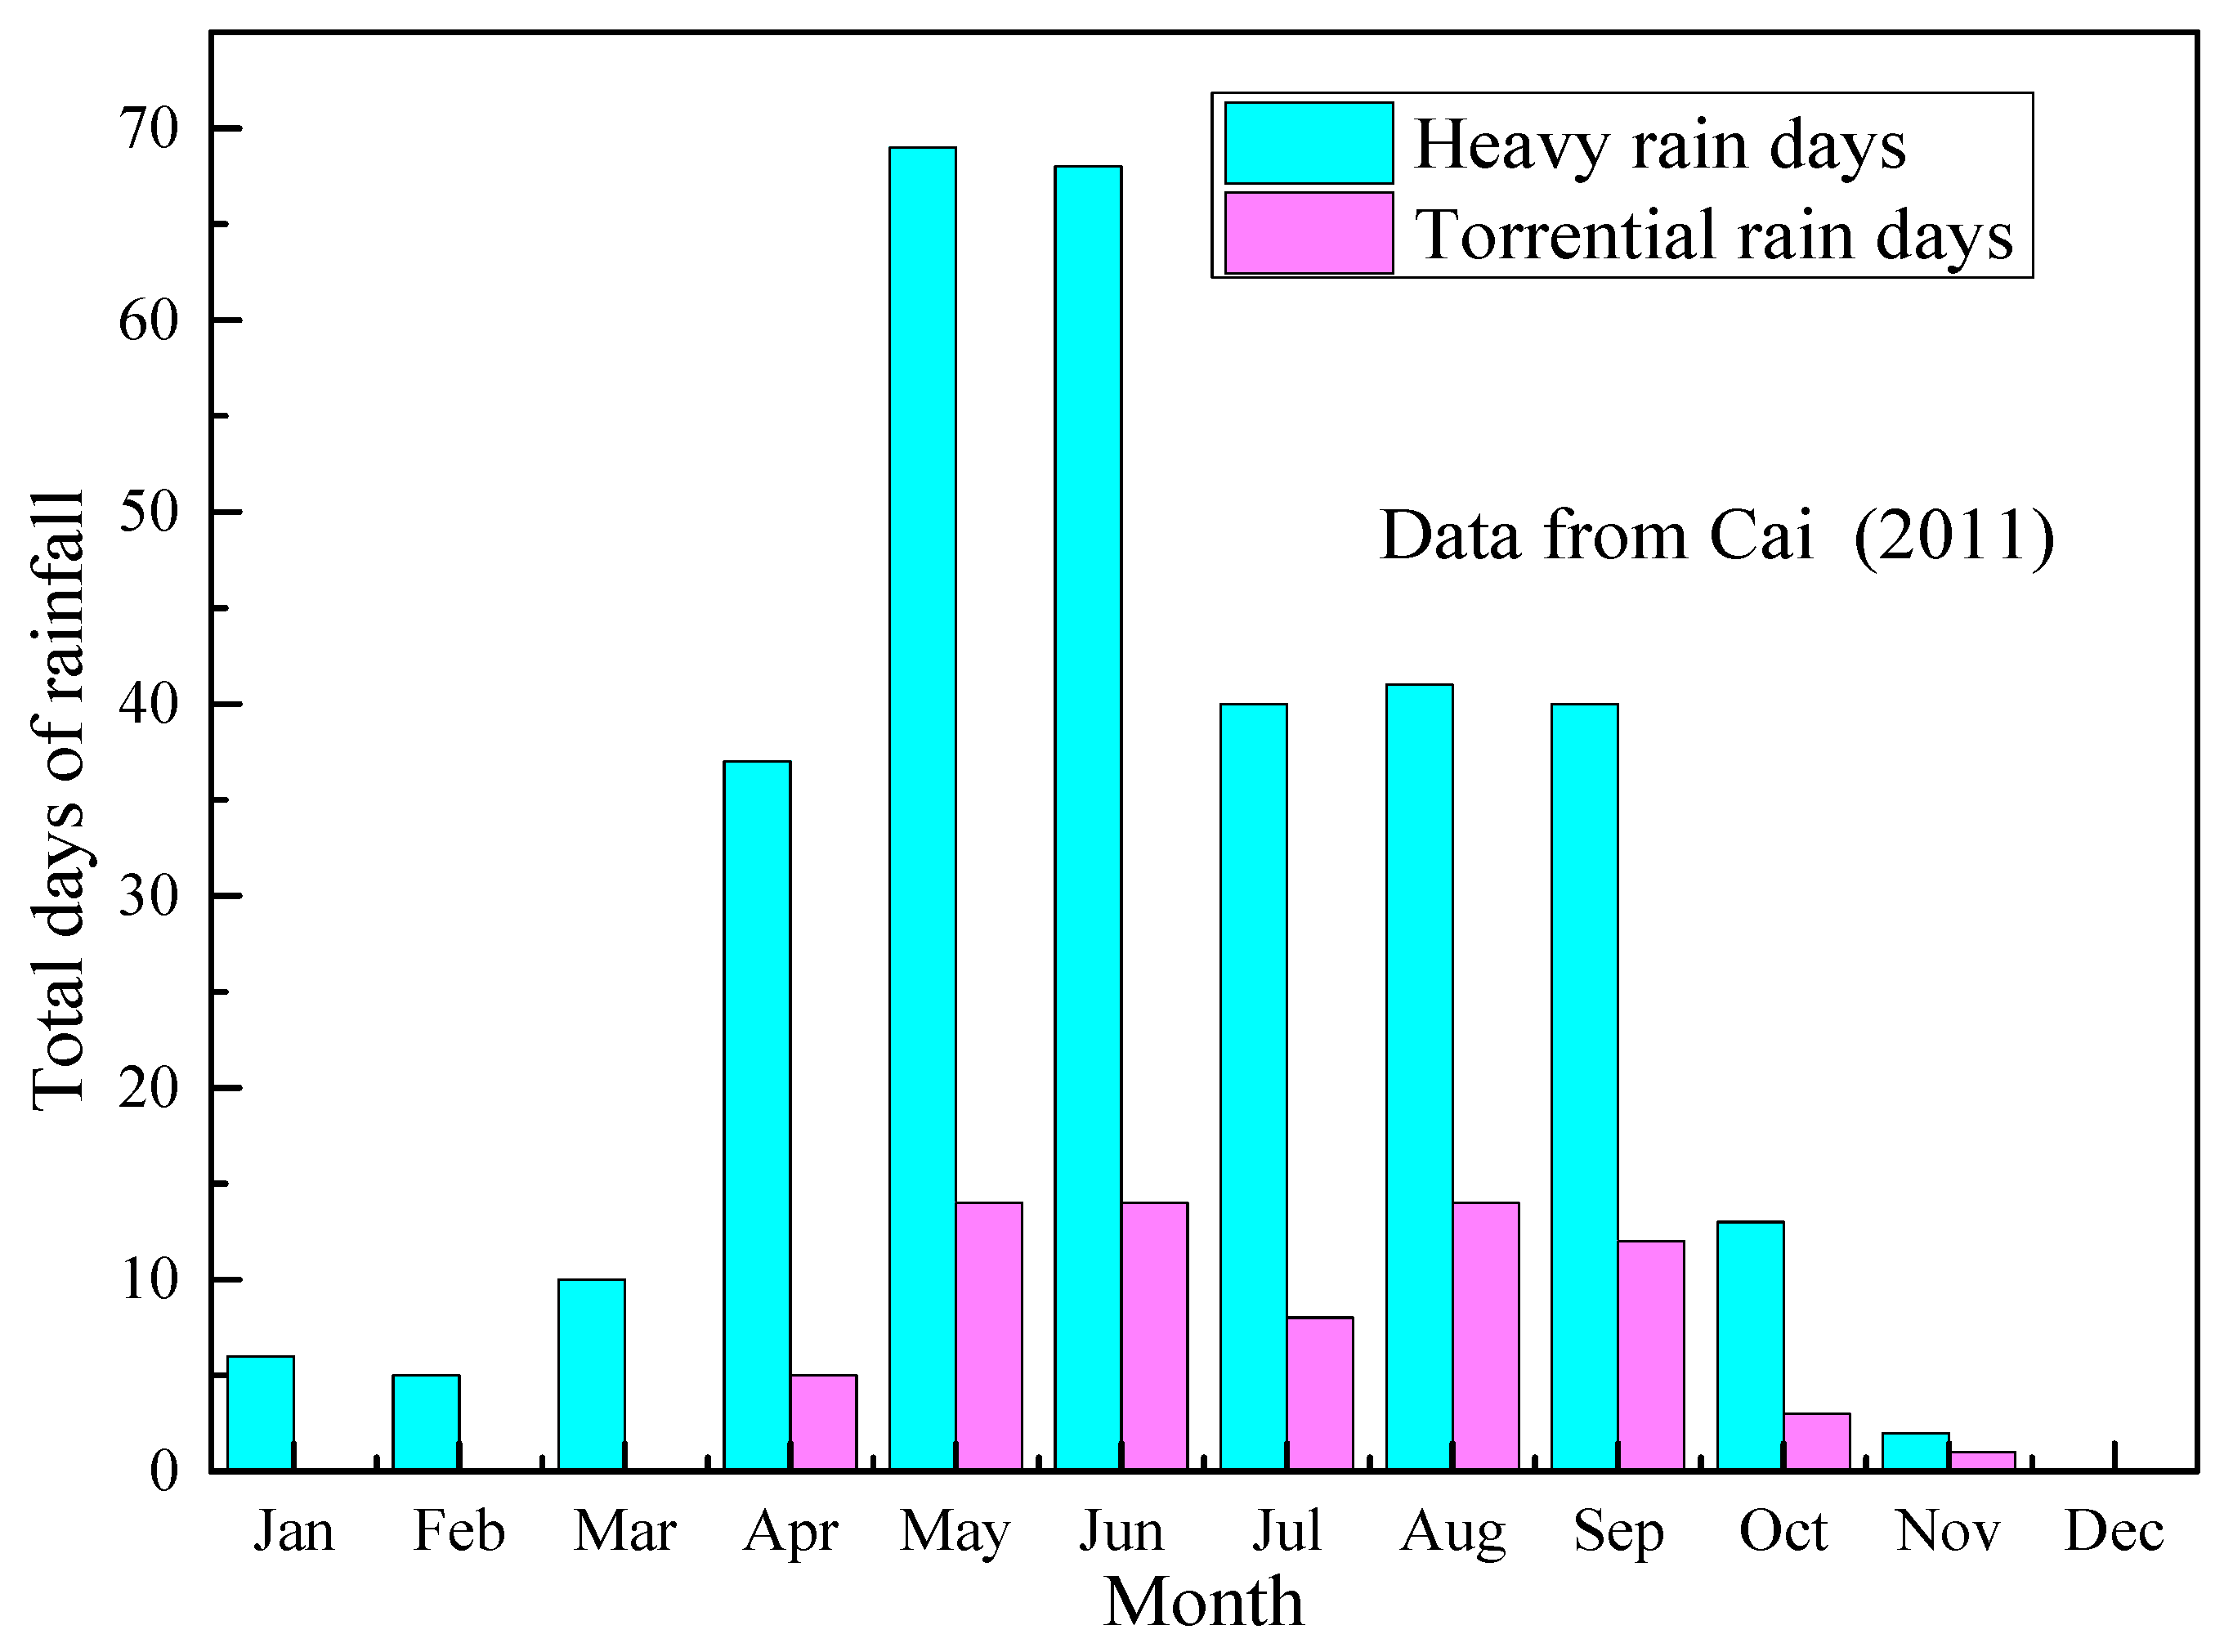
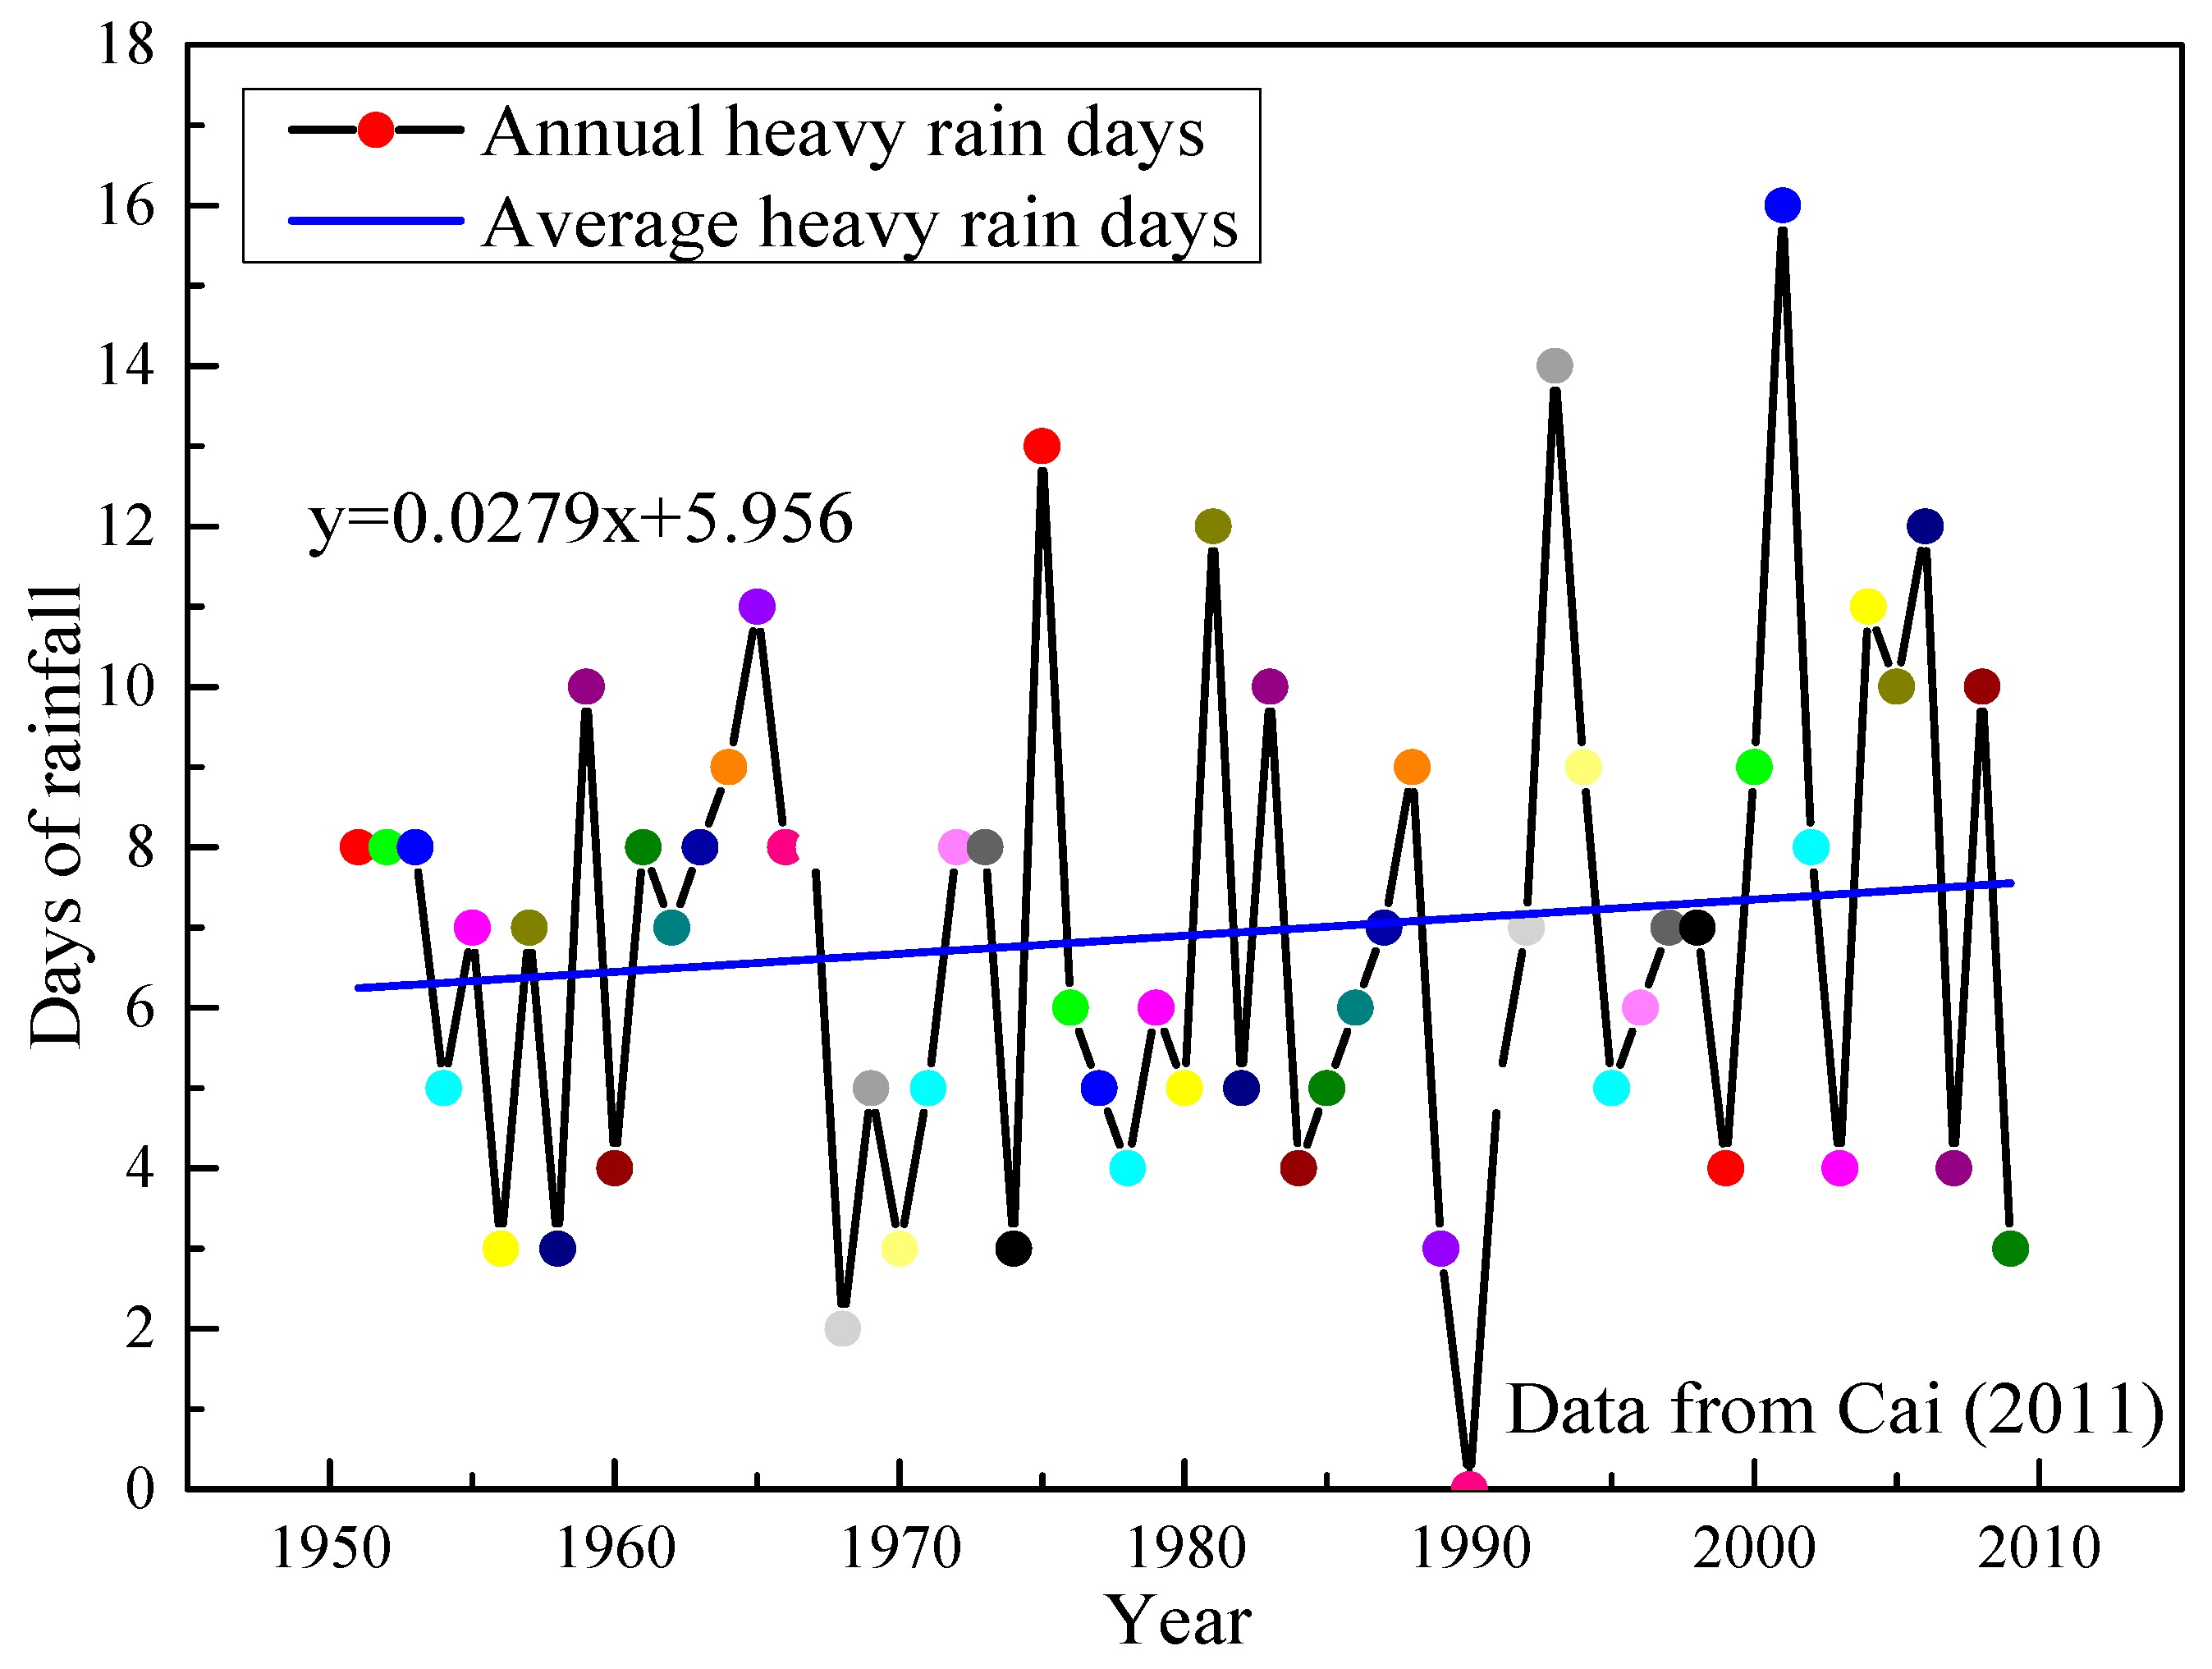
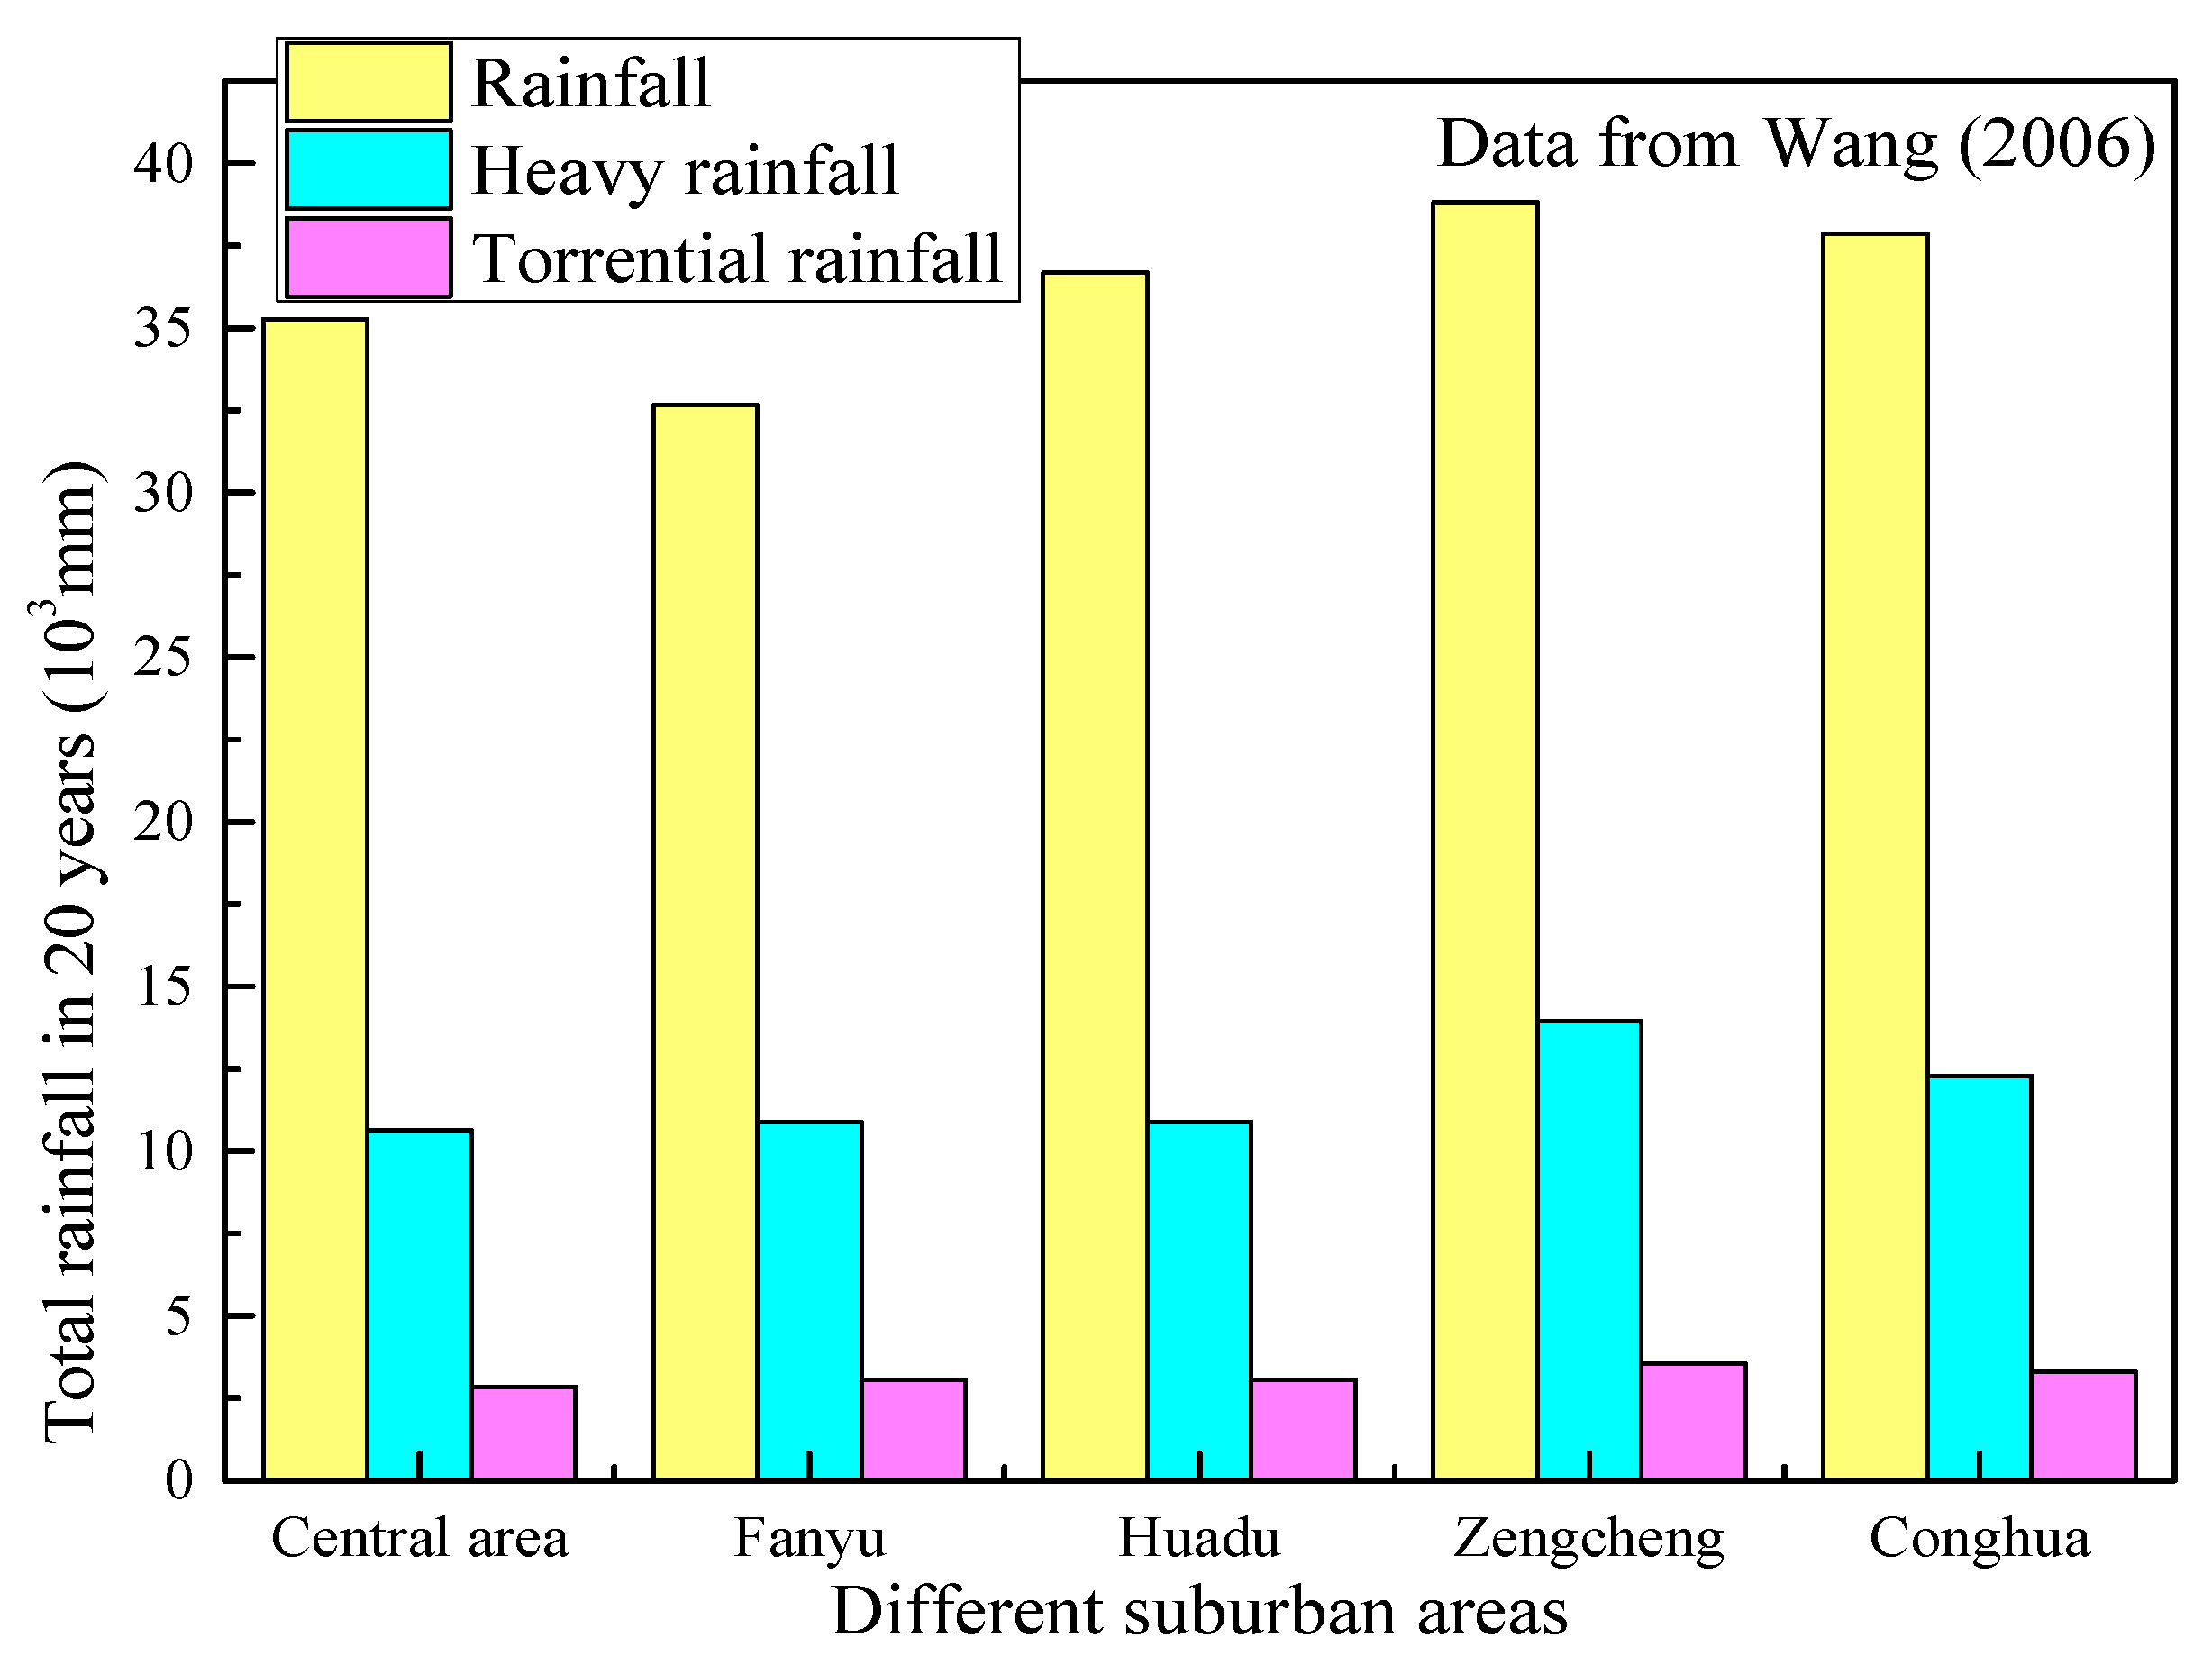
3.2.1. Rainfall Characteristics at City Level

Some researchers [34,35,36,37] believe that the increased number of heavy rainfall events is related to high global temperatures. Guangzhou has a southern subtropical monsoon climate. The monsoon climate can lead to both hot weather and typhoons, together with heavy rainfall in the summer. The annual rainfall ranges from 1600 to 1900 mm [1,7]. Rainfall is the main natural factor that can lead to flooding. Figure 3 shows the total number of heavy rain days in Guangzhou within the 59-year period from 1951 to 2009. Guangzhou has had heavy rainfall from January to November but there has not been any heavy rain in December within those 59 years. As shown in Figure 3, the number of heavy rain days shows two sharp increases; there is an increase from 10 days in March up to 37 days in April, and then another increase from 37 days in April up to 69 days in May (the peak value). The significant heavy rain days and torrential rain days are concentrated in May and June (Figure 3). Statistical results show that 90% of the annual heavy rain occurred from April to September, which is called the flooding season in Guangzhou. Fifty-one percent of the annual heavy rain happens during April to June, and 39% happens during July to September.
Figure 4 shows the annual number of heavy rain days, during which rainfall is more than 50 mm, in Guangzhou for each year from 1951 to 2009. A total of 403 heavy rain days during the 59 years period was observed, equivalent to an average of seven days per year. The maximum number of heavy rain days during the aforementioned 59-year period is 16, which occurred in 2001, and the minimum occurred in 1990. By conducting linear regression analysis on the annual number of heavy rain days, it can be found that the average number of heavy rain days presented a linear growth trend annually (Figure 4). Therefore, it is important to forecast heavy rainfall in order to take preventative measures to mitigate flooding hazards.

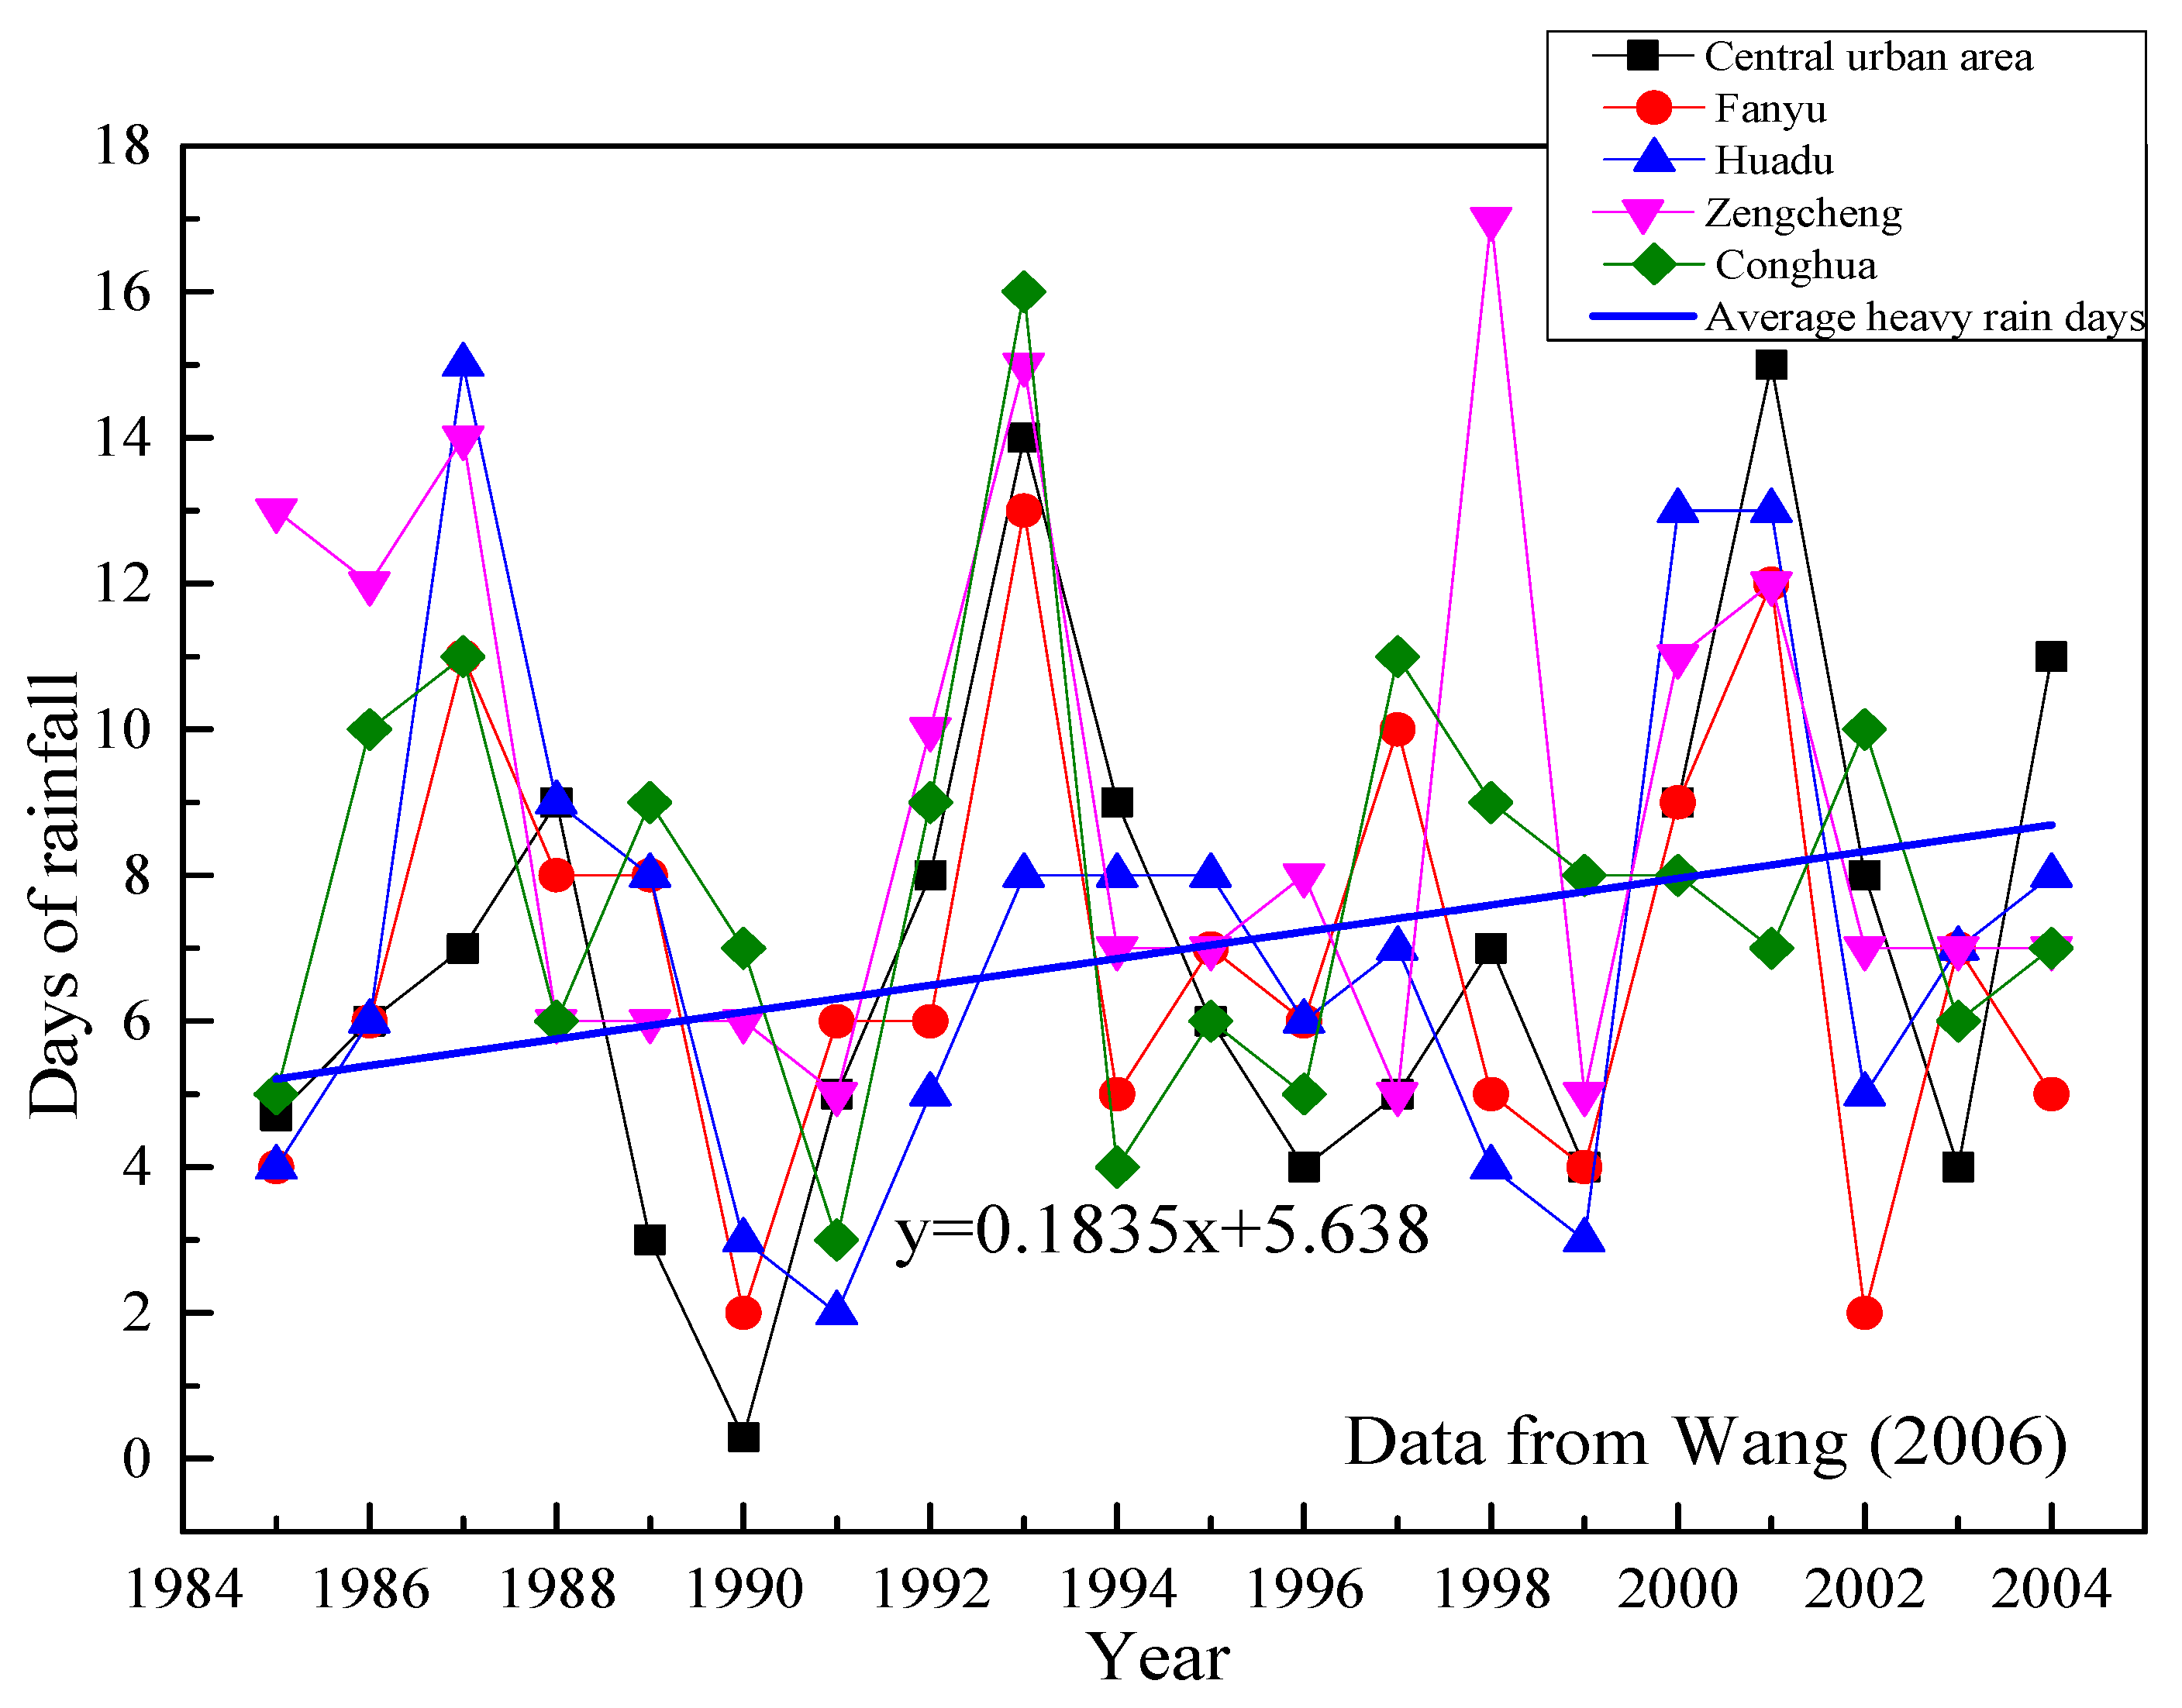
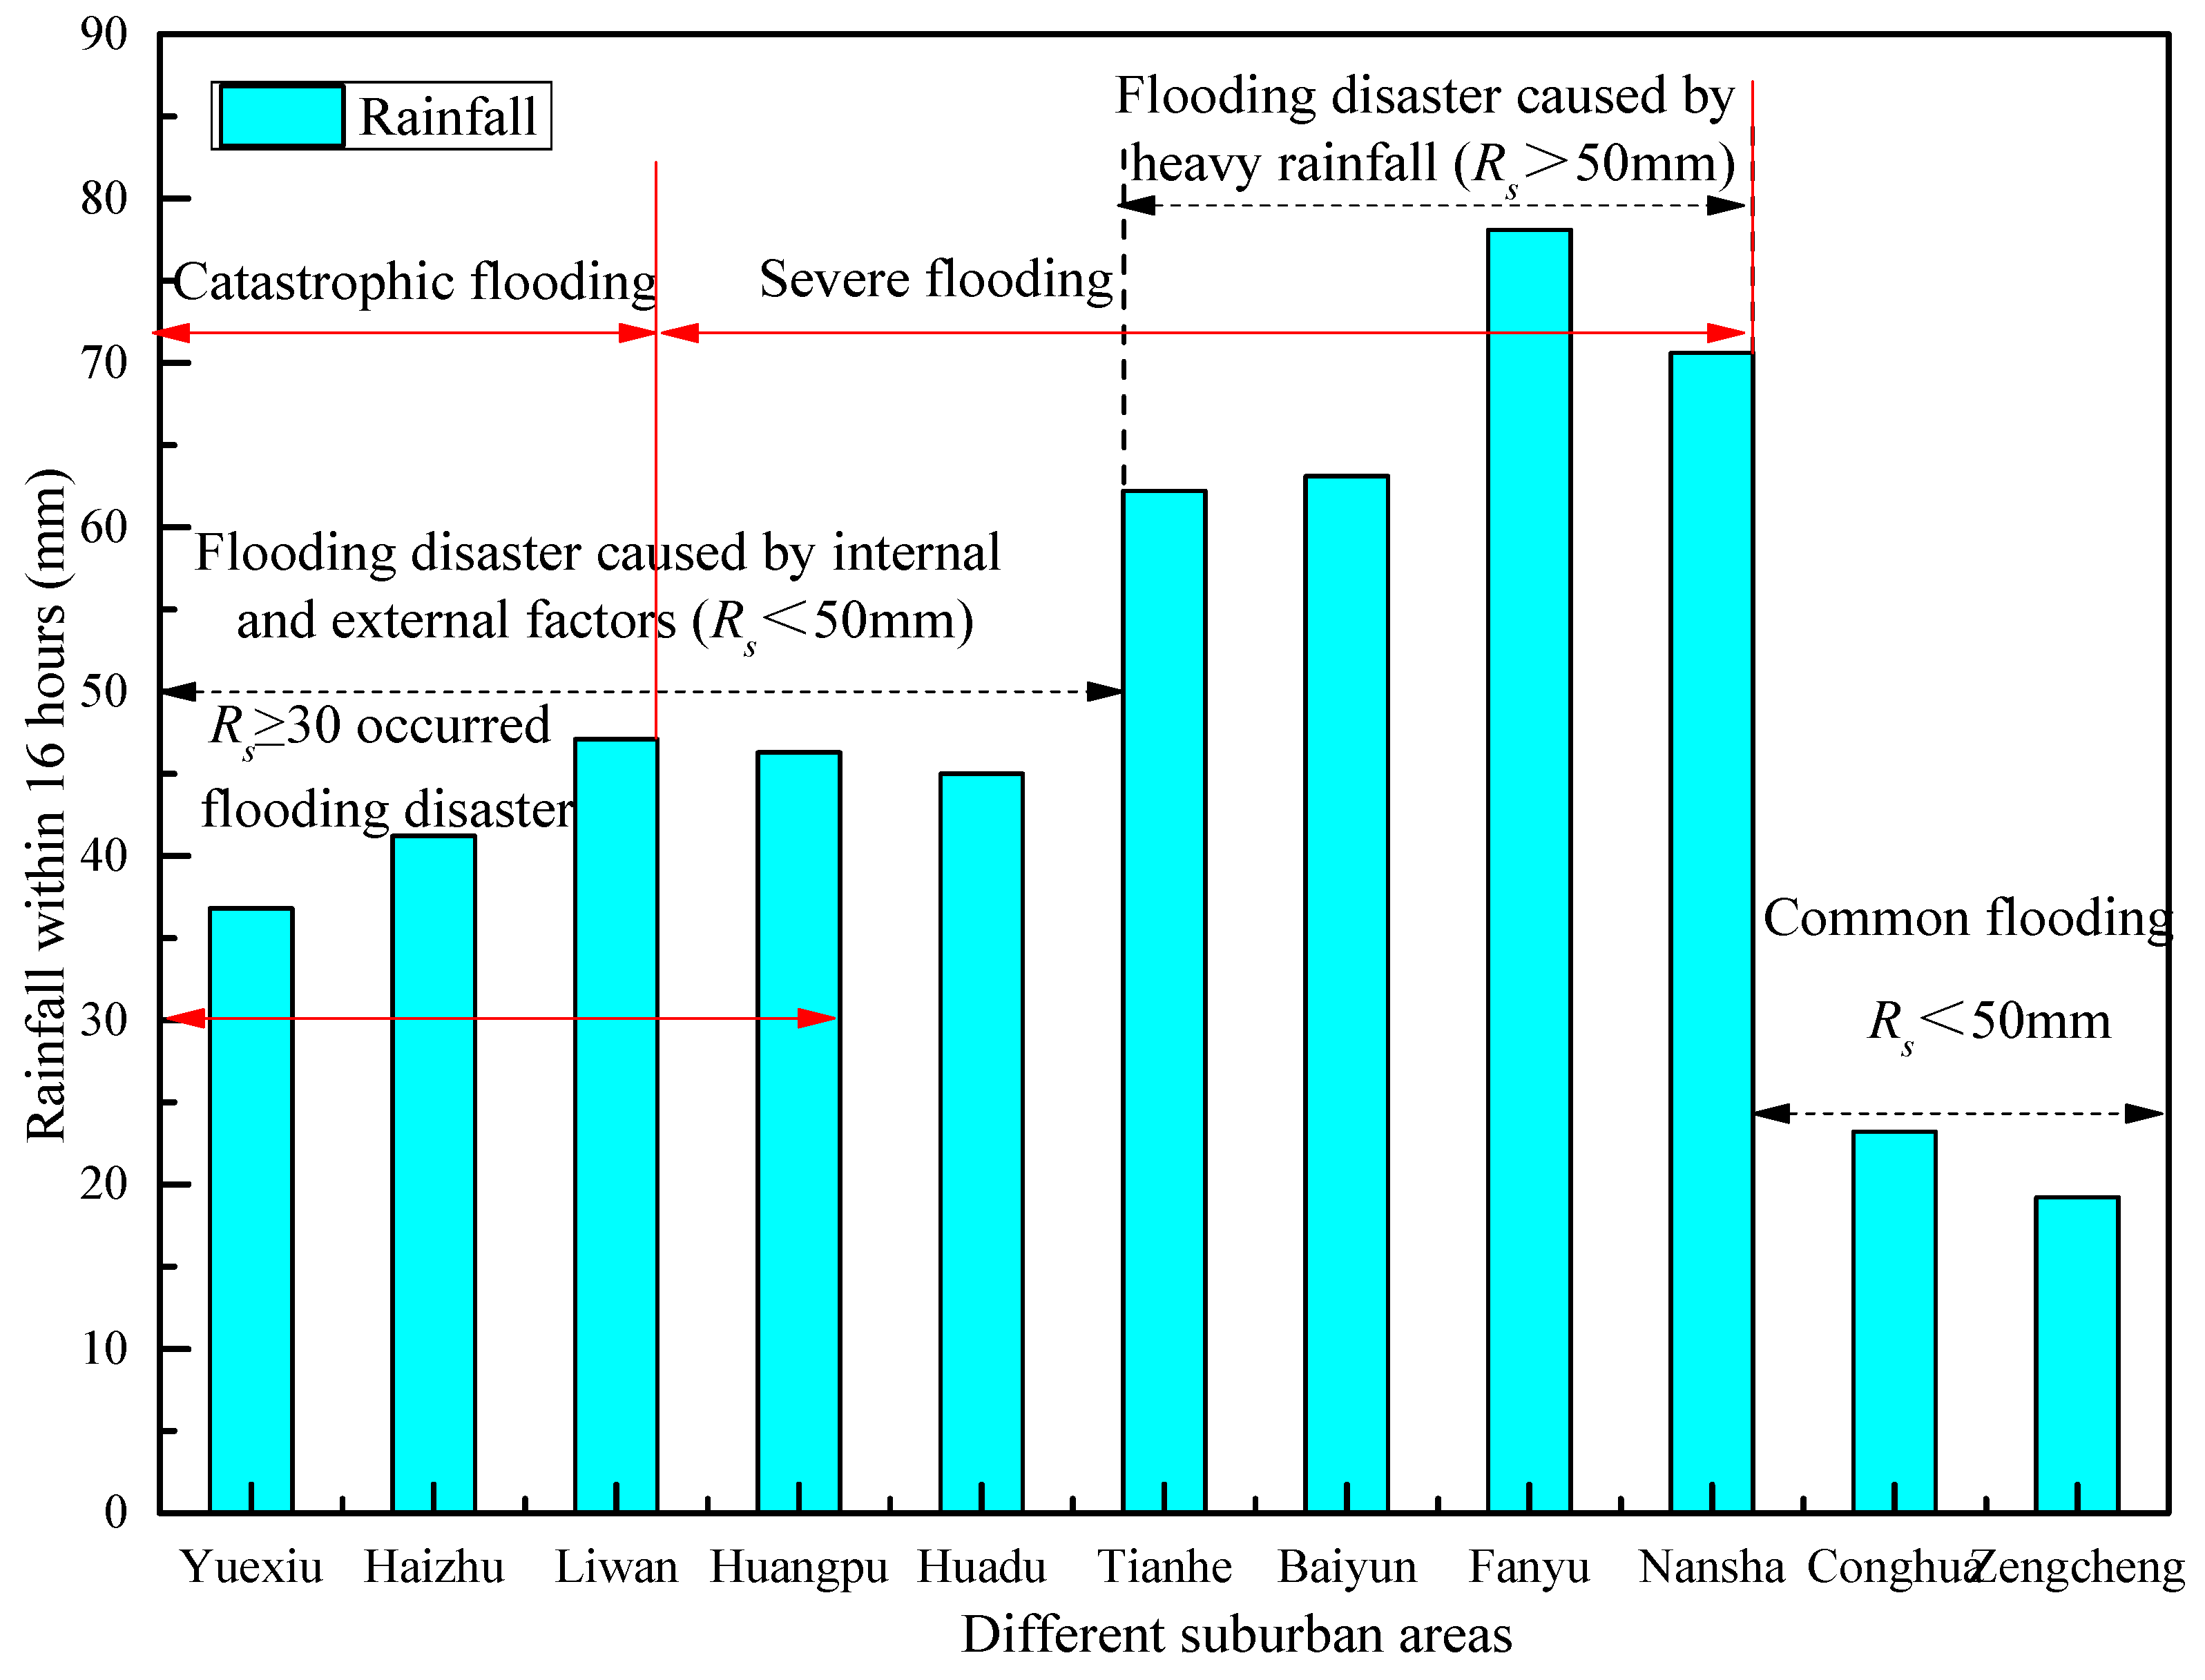
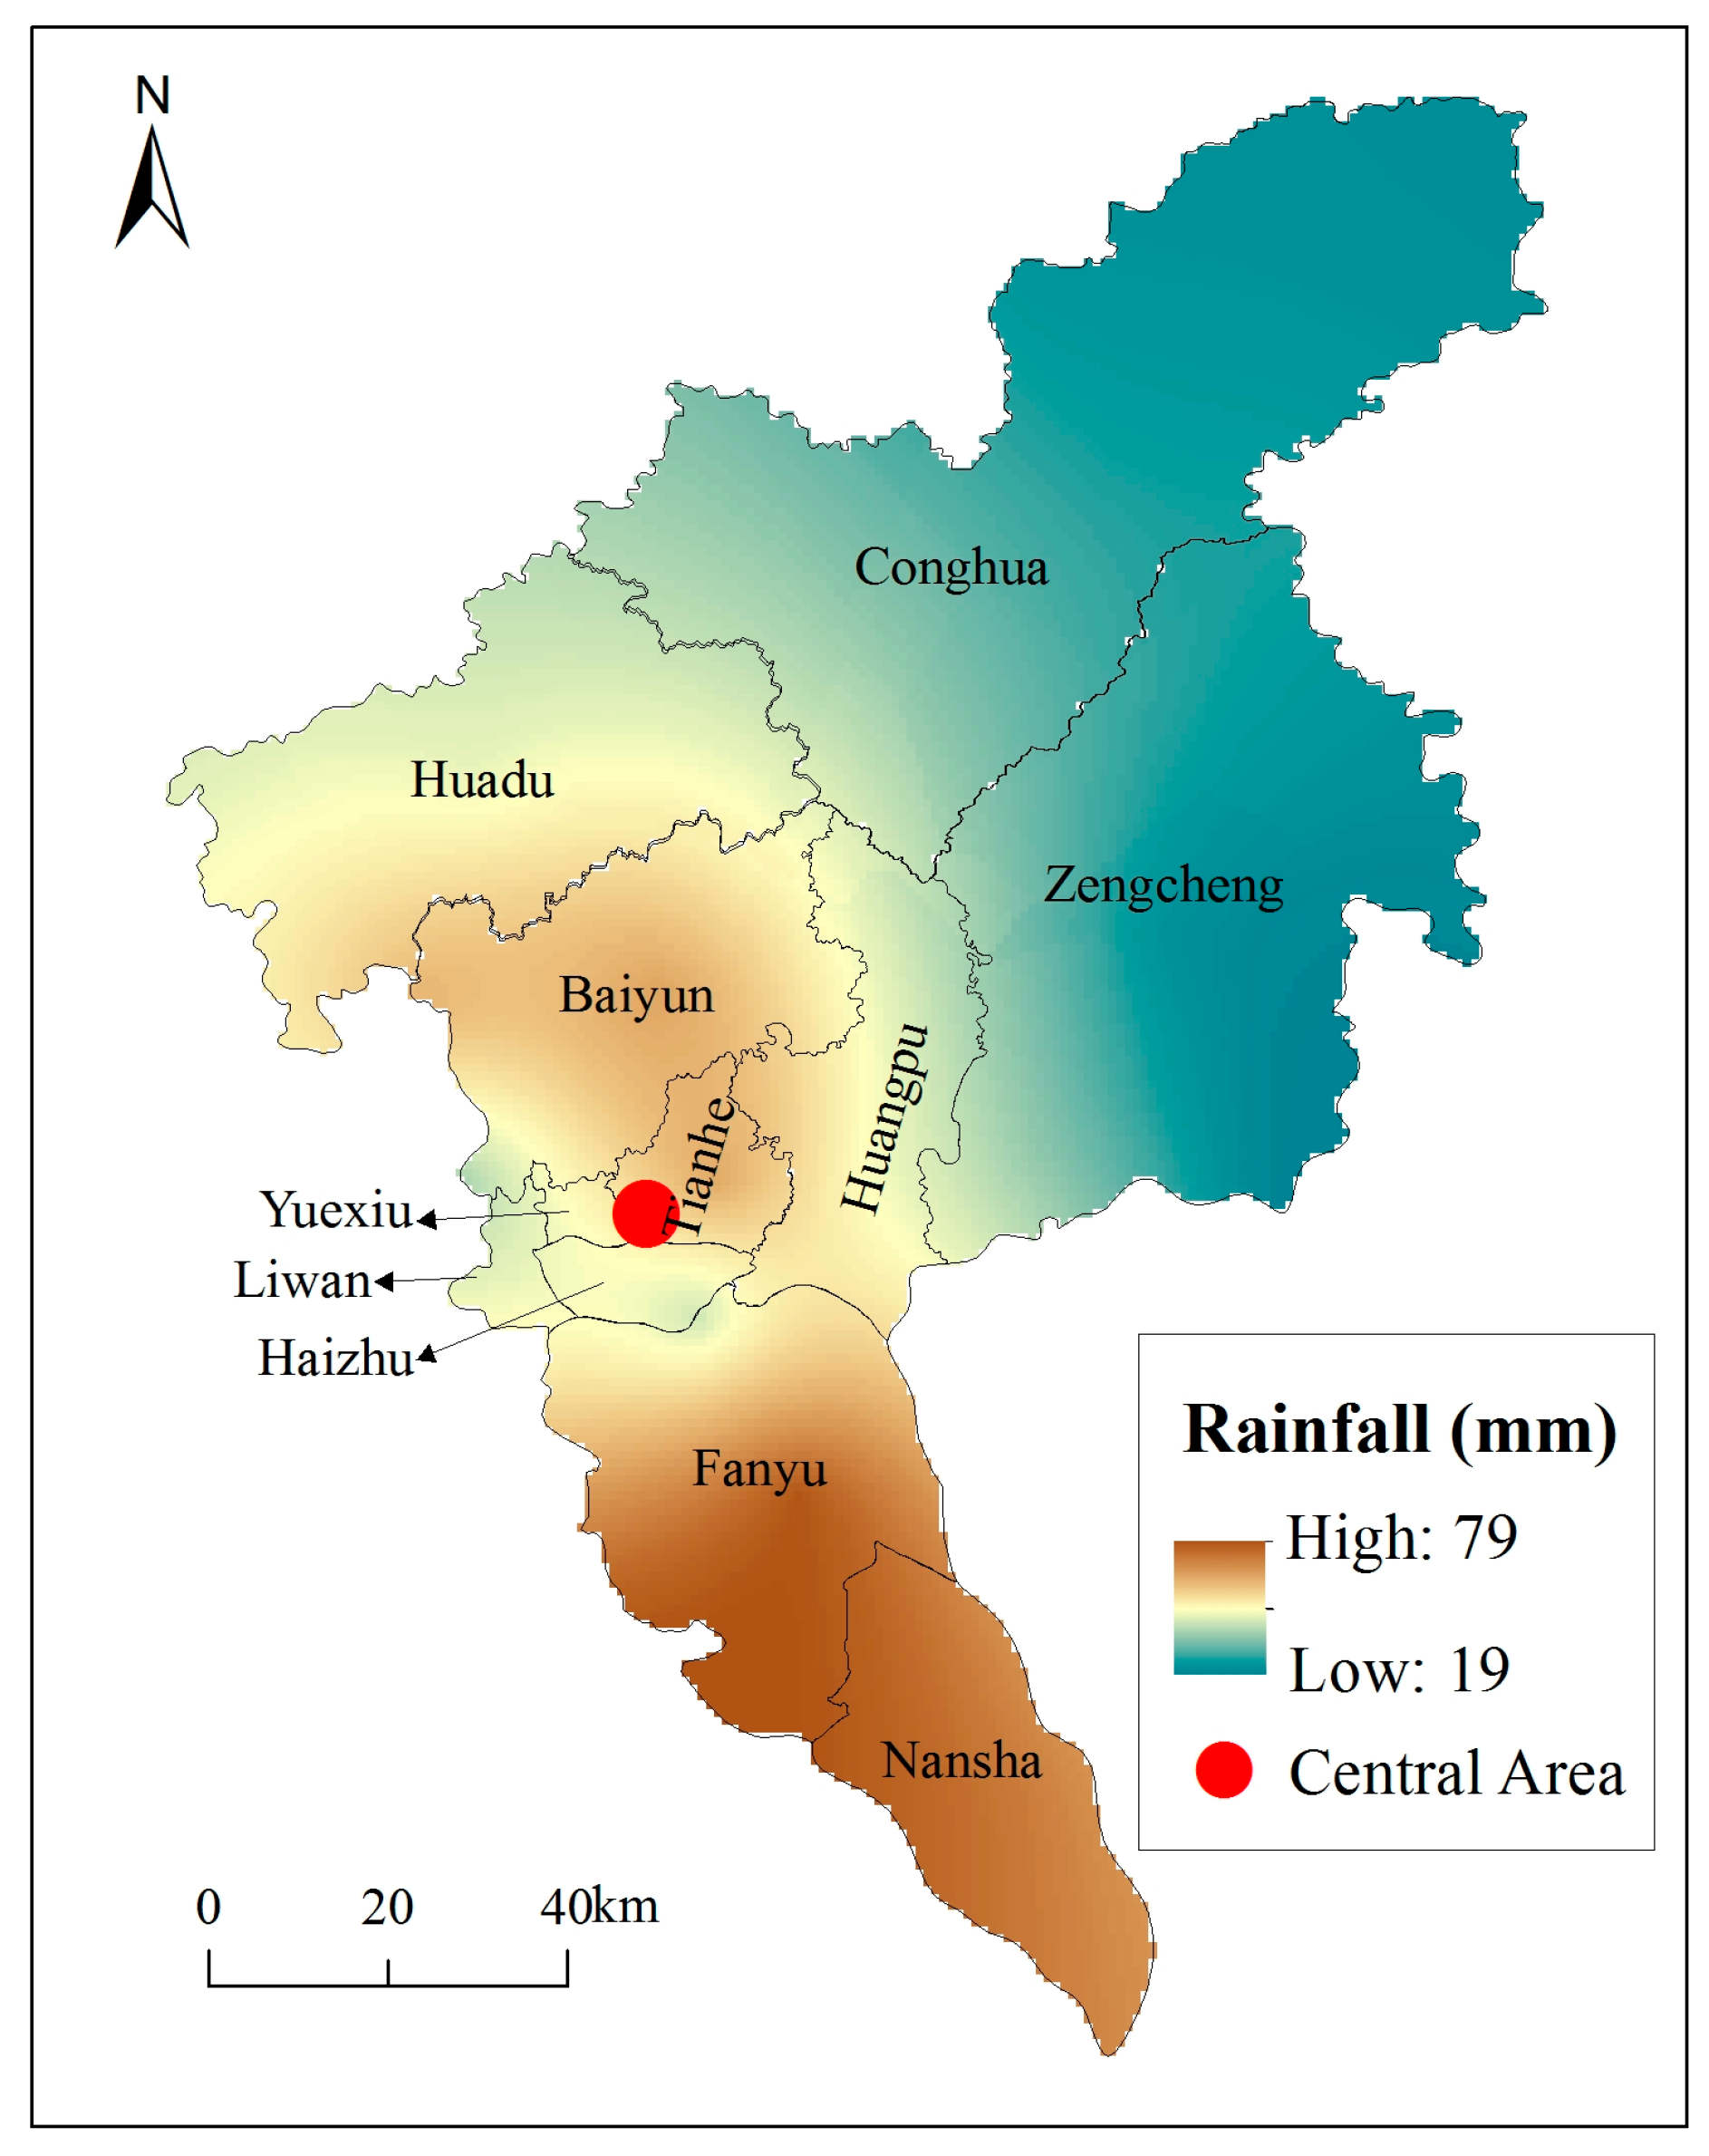
3.2.2. Rainfall Characteristics at District Level

In order to analyse the characteristics of rainfall at district level, more attention was paid to the attempts to evaluate the central urban area, which includes Fanyu, Huadu, Zengcheng, and Conghua Districts. Figure 5 shows the number of heavy rain days annually in Guangzhou at the district level. As shown in Figure 5, before 2001, except for 1993, there were fewer heavy rain days in the central urban area than in the suburban district of Conghua and Zengcheng (Figure 5). Moreover, Figure 5 also indicates that in the Conghua and Zengcheng districts heavier rainfall occurred than in other districts. Linear analysis also shows that the average number of heavy rain days in different districts has also increased annually.
In order to compare the precipitation among different districts in Guangzhou, this paper counted the total rainfall within 20 years in five suburban districts of Guangzhou. Figure 6 shows the annual rainfall in different suburban districts (central urban area, Fanyu, Huadu, Zengcheng, and Conghua). It can be seen that Zengcheng and Conghua have heavier rainfall and more torrential rainfall than the other districts (Figure 6). The results show that these two areas are more vulnerable to heavy rain and therefore a monitoring system should be developed to help protect these districts from flooding. Based on the analysis of the rainfall characteristics at the city level and district level, it can be seen that the rainfall increased annually.

3.3. Human Activities

As a result of rapid urbanization, large numbers of people have congregated in Guangzhou. A significant number of urban subways have been constructed in order to reduce traffic pressure. Figure 7 shows a plan view of the subway system of Guangzhou. It can be seen from this figure that the distribution of subway lines in the central area is very dense. This subway facility is the main man-made factor contributing to serious flooding hazards. Human activities have also made the surrounding environment vulnerable to the effects of heavy rainstorms and flooding hazards. Consequently, the central urban area always suffers more in severe conditions and experiences greater economic loss than the suburban areas, even though the rainfall levels are lower than in suburban areas.

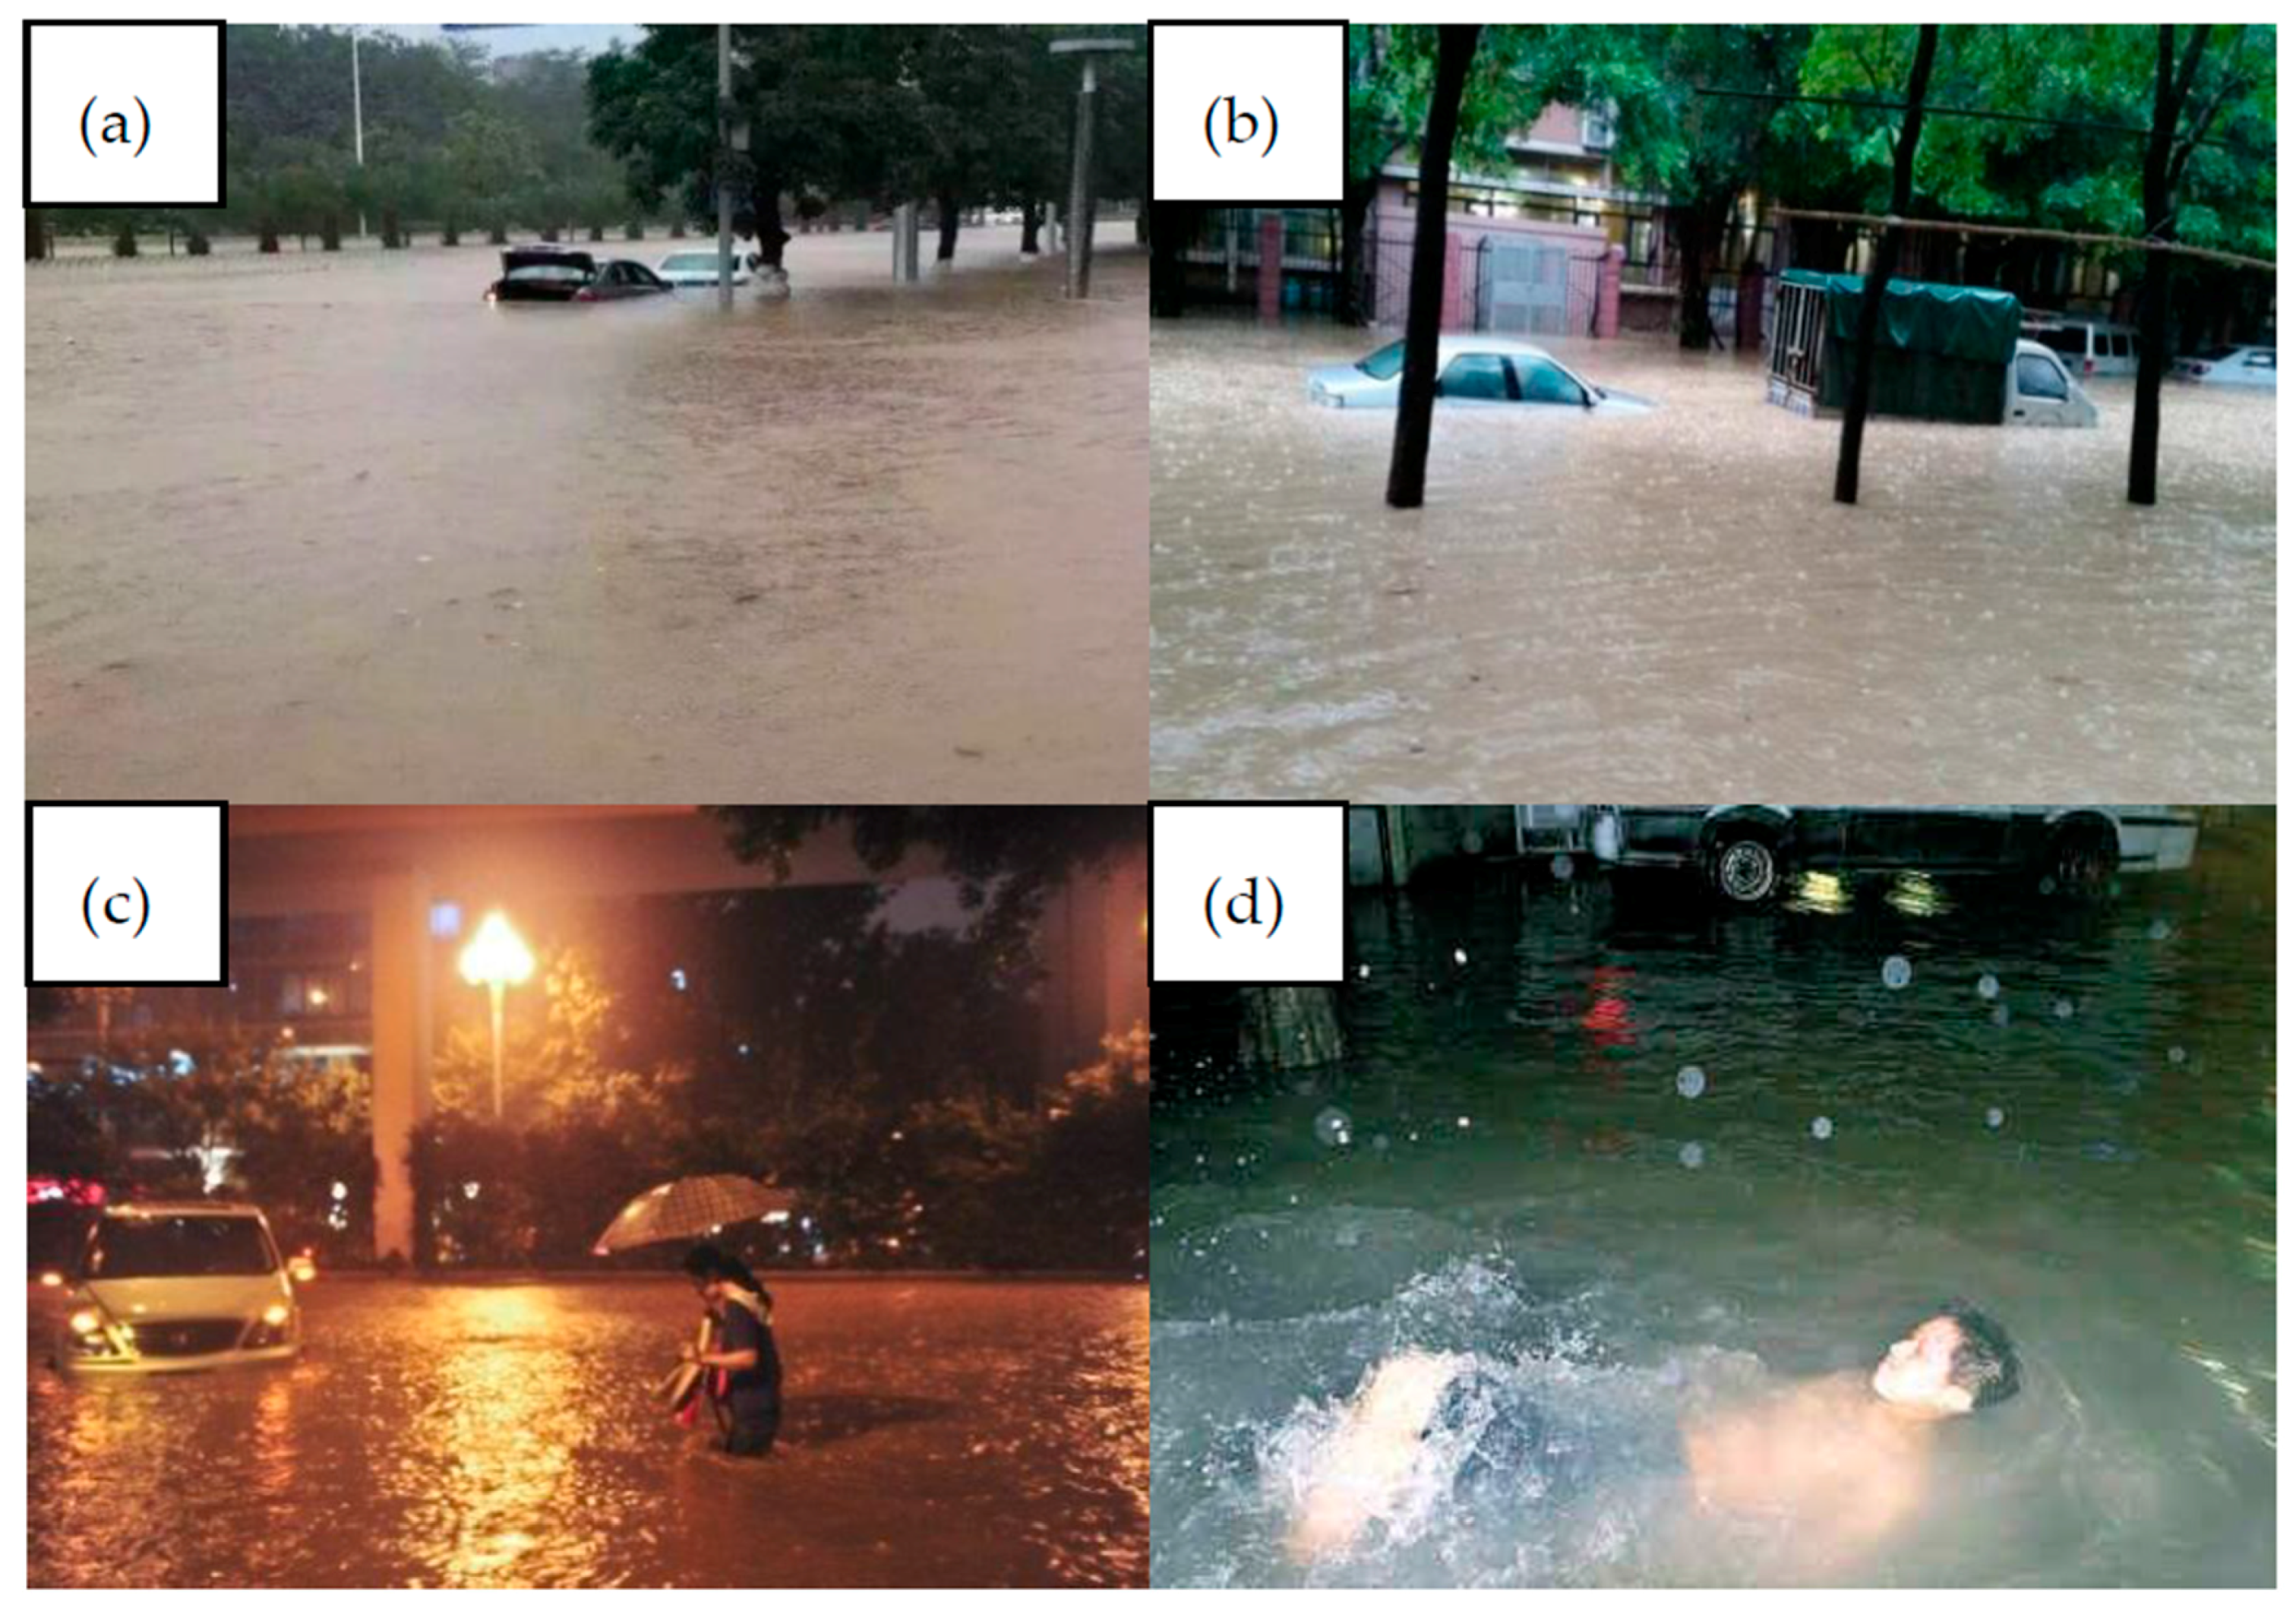
4. Flooding Hazards on 10 May 2016

On 10 May 2016, Guangzhou experienced a heavy rainstorm. The average rainfall was 67.6 mm over a period of 16 h and the heaviest rainfall was 186.6 mm in Fanyu district (suburban area). The total rainfall from 4:00 P.M. on 9 May to 08:30 A.M. on 10 May was 23.2 mm in Conghua, 19.2 mm in Zengcheng, 45.0 mm in Huadu, 63.1 mm in Baiyun, 62.2 mm in Tianhe, 36.8 mm in Yuexiu, 47.1 mm in Liwan, 41.2 mm in Haizhu, 78.1 mm in Fanyu, 70.6 mm in Nansha, and 46.3 mm in Huangpu. The rainfall data were collected on the Guangzhou Meteorological Data Sharing Network (GMDSN) [38]. This heavy rainstorm flooded the whole city and destroyed many flood walls from the land side. The depth of floodwater at some road section was over 500 mm. Some road sections were flooded, with partially submerged cars (Figure 8a–c), and in places the roads looks like pools (Figure 8d). The Changpan subway station on Metro Line 6 in Guangzhou was also flooded in the rainstorm (Figure 9). A large volume of rainwater flowed into Changpan station and inundated a part of the station, causing the subway to become an underground river.
According to records, flood walls failed in six places during the flooding disaster in Guangzhou, which caused a back flow of river water into the city. More than 100,000 people were affected by the floods, and eight people were killed. It is estimated that the direct economic loss caused by this incident was more than CNY ¥543.8 million. In order to mitigate risks in the future, it is essential to investigate the spatial and temporal characteristics of the risk factors. Therefore, factor analysis is conducted in the following paragraphs based on an analysis of the topographical features of Guangzhou City and the meteorological conditions, which are statistically summarised both at the whole city level and at the district level. More attention will be paid to the exacerbation of flooding hazards due to the existence of the subway system.

5. Results and Discussion

5.1. Hazard Analysis on 10 May 2016

Figure 10 plots the rainfall in different suburban areas during the flooding on 10 May 2016. The total rainfall in Conghua was 23.2 mm and that in Zengcheng was 19.2 mm in 16 h; Tianhe, Baiyu, Fanyu, Nansha all had more than 50 mm. This rainfall intensity can be defined as heavy rainfall and can quickly cause flooding. The rainfall in the central suburban areas of Yuxiu, Haizhu, Liwan, and Huangpu was less than 50 mm, which is not enough to reach the value of heavy rainfall, but due to the intensive distribution of subway lines and heavy rainfall in this district, these areas suffered serious flooding and large economic losses.
As shown in Figure 10, the 10 May flooding fell into three categories according to the total loss: common, severe, and catastrophic flooding. This classification of hazard severity is based on the aforementioned standard of severity of flooding hazards (Rs), but is slightly different from the traditional Rs, as will be explained in detail in Section 5.2.2. Although the rainfall levels in Yuexiu, Haizhu, and Liwan were less than 50 mm, the flooding that occurred was very serious, and can be defined as catastrophic flooding. The rainfall levels in Huangpu and Huadu were the same as those in Yuexiu, Haizhu, and Liwan, but the situation in Yuexiu, Haizhu, and Liwan was more serious than in Huangpu and Huadu. Therefore, the flooding of Huangpu and Huadu was classified as severe flooding. Flooding is defined as severe when the “Rs” value is more than 50 mm, so the flooding in the suburban areas of Tianhe, Baiyun, Fanyu, and Nansha was classified as severe in this flooding event. The rainfall levels in Conghua and Zengcheng were 23.2 mm and 19.2 mm, respectively, so that the flooding in these areas was classified as common flooding.

5.2. Factors Inducing Flooding

The main factors that led to the flooding on 10 May 2016 include natural conditions (subtropical climate, unique geographical position and topography, level of rainfall) and man-made conditions (especially the construction of subway lines). Based on the recorded rainfall data at both the whole city and district levels, the factors that were determined to contribute to the flood are as follows: (1) Guangzhou has a typical subtropical monsoon climate, which is the main factor leading to flooding. In this type of climate, during the summer months the wind direction is from the ocean to the land, bringing moisture-laden air. This leads to heavy rain and can result in flooding in the summer months; (2) Human activities, particularly the construction of subway lines, made the flooding hazards more serious, which resulted in severe economic losses; (3) Underground pipelines and road drainage capacities are also important factors that affected the flooding. Proposals for reducing the risk of flooding can be developed after analysing the contribution of each factor. A detailed analysis of those factors is discussed in the following paragraphs.

5.2.1. Rainfall

Rainfall is the natural factor that caused the flooding. As indicated in Figure 10, the rainfall levels in Tianhe, Baiyun, Fanyu, and Nansha all exceeded 50 mm within 16 h. This kind of heavy rainfall within a short duration can easily lead to flooding. In this rainstorm, the suburban areas of Fanyu and Nansha experienced severe flooding. The rainfall reached 78.1 mm in Fanyu and 70.6 mm in Nansha. This phenomenon highlights the need for an improved meteorological monitoring system for these areas, and the necessity for measures to mitigate flooding disasters.
Figure 2a depicts the distribution of hydrological stations in Guangzhou city. The hydrological stations can monitor and record precipitation. Considering rivers and characteristics of topography including the elevation and slope of the study area, the rainfall distribution of the 10 May rainstorm was plotted by GIS (Figure 11). The precipitation on 10 May 2016 was obtained from China Meteorological Data Network. As shown in Figure 11, rainfall in the southwest region was higher than in the northeast. Fanyu district had the highest rainfall and Zengcheng district had the lowest (Figure 11). The central area had the second highest rainfall. Therefore, the central area had the most serious flooding.

5.2.2. Subway System and Modification of Rs

The subway lines are intensively distributed underground, particularly in the central areas (Figure 7). Existing underground structures, as well as the ongoing construction of the subway lines, have affected the underground sewage pipe network, and consequently have an effect on the drainage capacity of the sewage system when there is heavy rainfall. It can be seen from Figure 10 that, although the rainfall was less than 50 mm in some areas, the flooding was still serious and caused a huge economic loss. It is recommended that the value of the “Rs” factor for rainfall in this area should be lowered from 50 mm to 30 mm for areas with frequent human activity. In other words, precautions should be taken to prevent flooding if “Rs” is more than 30 mm in 24 h in areas with subway lines.
Figure 12 indicates the influence areas and demonstrates their association with the position of underground subway lines. As shown in Figure 12, subway lines have a significant influence on the surrounding environment, which caused the areas with subway lines to become more vulnerable to flooding than areas far away from the subway lines. In order to evaluate the effects of subway lines during rainfall conditions, the flood-prone areas have been analysed. Figure 13 shows the flood-prone areas for Line 6 during the heavy rainstorm in Guangzhou on 10 May. It can be seen from the figure that the total flood-prone area under rainfall conditions is much larger than without rainfall (Figure 12). We also see from Figure 13 that the areas around subway lines become more vulnerable to flooding than areas further away from the subway lines. It can also be seen that Line 6 is entirely located within the flood-prone area (Figure 13).
In this flooding disaster, Changpan station of Line 6 was flooded in the rainstorm. Figure 14 shows the elevation of Line 6. As shown in Figure 14, Changpan is the final station of Line 6 and is located at a lower elevation. The area around the Changpan station is higher. This kind of topography makes the station prone to flooding because the Line 6 is located in a lower position and the prevention gate is insufficient to prevent excess rainwater. This phenomenon is a reminder that flood-prone areas suffer more serious consequences and cause greater economic losses in the event of flooding. Therefore, the strengthening of flooding protection measures in flood-prone areas is essential.

5.2.3. Underground Pipelines

Many infrastructure facilities, such as gas pipelines, cables, and water supply and sewerage pipelines, have been constructed in Guangzhou during the past few decades. Underground pipelines are the main component of the urban drainage system, which is very important for flooding protection. The existing underground pipelines have been disturbed and damaged during the construction of other underground infrastructure. It is a common measure to move existing underground pipelines when they are encountered during the construction of underground projects. As indicated in Figure 7, a large number of subway lines have been constructed or are under construction. These subway construction activities can have further influence on existing underground pipelines, which then reduce their drainage capacity. Therefore, underground pipelines do not have enough capacity to store the discharged rainwater, which contributes to an increased risk of flooding.

5.2.4. Road Drainage Capacity

The factors that affect road drainage capacity are the sewer network system and the materials used in the construction of the road. Road gullies have been widely used in the last few decades. The road gullies design code is based on previous standards, but in practice rainfall is increasing annually, as described previously. Road gullies can easily become blocked by leaves or debris, and some sewers have been severely damaged by the heavy rainstorms. In this flooding event, the depth of floodwater on some road surfaces reached 500 mm. This phenomenon was mainly due to damaged road gullies. Therefore, improvement of the current sewer network and gullies and construction of more sewers are essential. In addition, when a road is undergoing construction, choosing a road surface material with good performance is also important. For example, porous pavements could be adopted.

6. Recommendations

A “Sponge City” approach and the application of BIM technology are recommended in order to mitigate the damage caused by flooding due to heavy rainstorms in Guangzhou. To evaluate the flood-prone areas, GIS mapping, which can give a detailed analysis of flooding distribution, should be adopted.

6.1. “Sponge City” Planning

Guangzhou is a typical city that could be transformed into a “Sponge City” as it has large amount of rainfall each year. Statistical analysis shows that the rainfall has increased annually. A large volume of rainwater cannot discharge quickly during a heavy rainstorm. In the “Sponge City” planning approach, systems are installed to store the rainwater. This approach to urban planning incorporates improvements to the rainwater storage capacity and drainage systems [24,39,40]. The mechanism of this planning approach includes two phases. The first phase involves storing the run-off temporarily within a multi-functional pipeline system, sluice gates, and pumping stations to provide the storage capacity. The reuse of the rainwater is more environmentally friendly than simply discharging it. Green roofs and forest park areas can temporarily store the rainwater. The other phase of “Sponge City” planning is the drainage of the excess rainwater. This is achieved by draining the excess stored rainwater into rivers. Therefore, the efficient construction of a sewer network system is essential. The previous drainage system can deal with 30 mm rainfall. In the construction of a “Sponge City”, the standard of 50 mm rainfall is recommended. Restricting development in the most flood-prone areas is also required. Improving the efficiency of land use and maintaining a relative balance of land ecosystem and the sustainable use of resources are the basic principles.

6.2. BIM Technology

Building Information Modelling (BIM) is a tool for the design, construction, maintenance, and management of projects. It is an efficient model for the construction industry, has been applied to many projects, and is a useful tool for both new and existing construction system. GIS integrates spatial information and spatial analysis, whereas BIM can simulate a more realistic emergency situation by using a Virtual Reality technique [41]. A BIM model can monitor and observe the condition of an underground infrastructure system [42]. During the construction of a “Sponge City”, a large number of multi-functional pipelines will be constructed. The combined use of GIS and BIM can provide a visualisation, which provides information about the geology and the design of multi-functional pipelines. Therefore, the municipal authorities can obtain a level of control over the flooding on a local scale.
Recently, with the growth of urbanisation, underground engineering activities have gradually expanded. In order to avoid damaging underground pipelines during construction, an understanding of their distribution is essential. The application of BIM technology can provide useful information for this purpose. Once the layout of the underground pipelines is established, they can be safeguarded during underground engineering construction. Therefore, for future city management, the combined use of GIS and BIM is recommended to evaluate the risk of flooding.

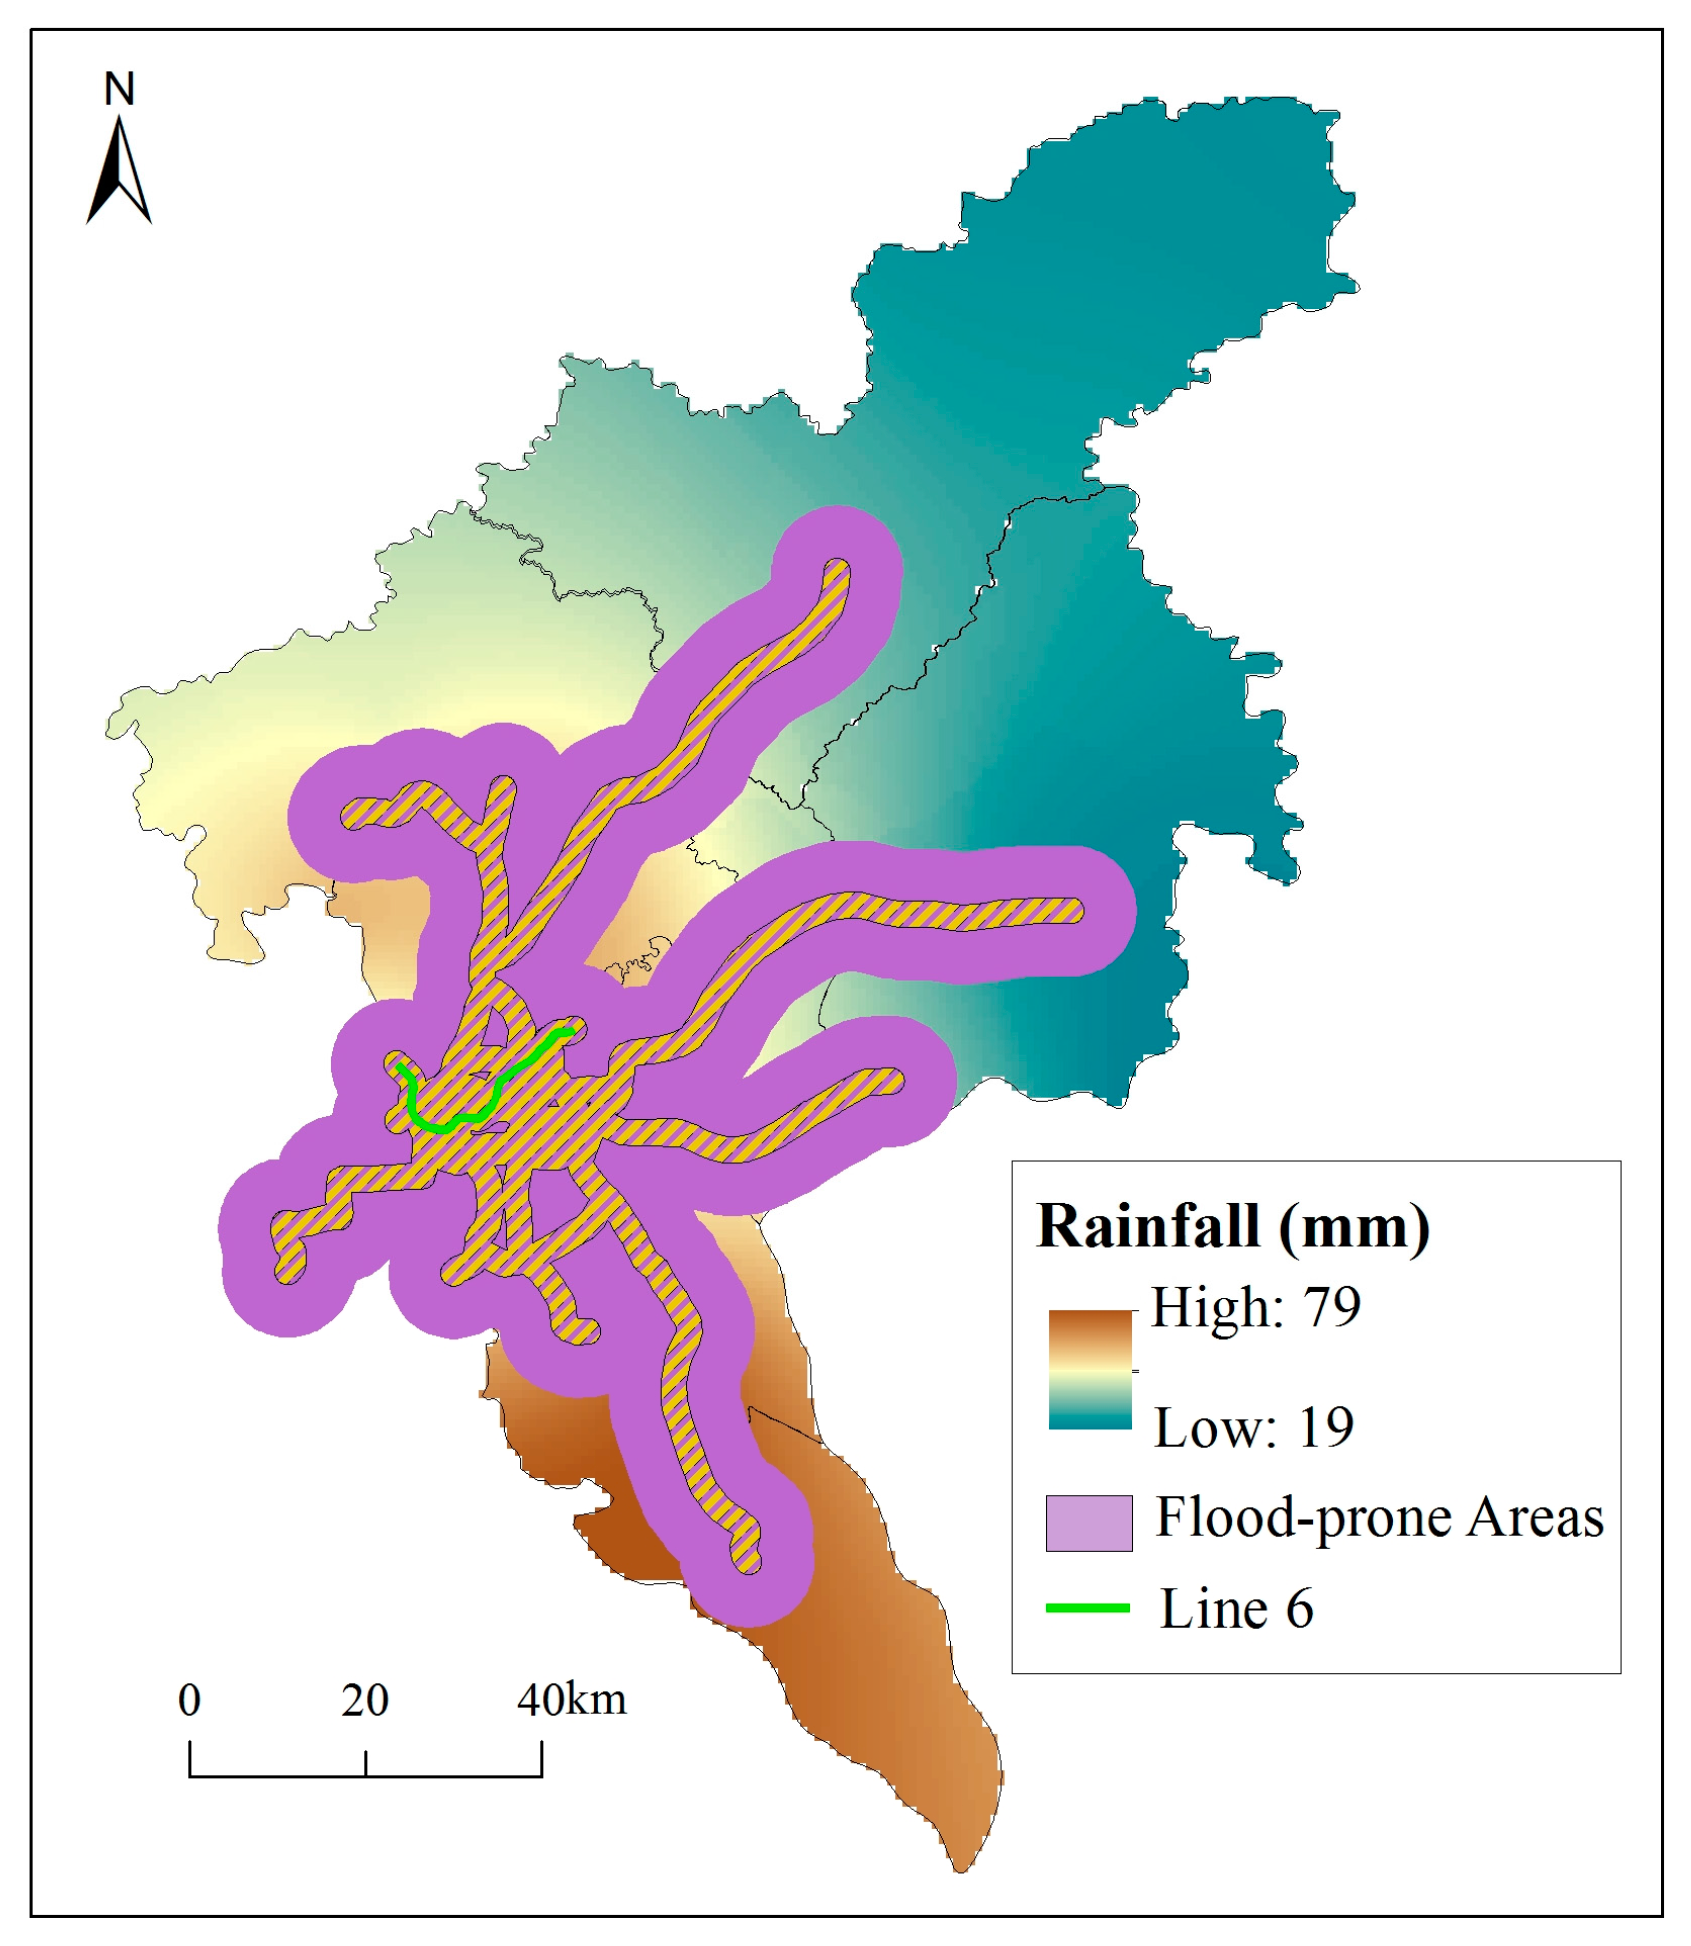
6.3. Evaluation of Flood-Prone Areas Using GIS

The occurrence of flooding is not only related to rainfall but also to human activity. Those areas with frequent engineering activities will experience more serious flooding events, which can cause huge economic losses compared to other areas with the same rainfall conditions. In this paper, the underground subway system is considered the main human activity and the analysis focuses on the effects of existing subway lines under heavy rainfall. By using GIS it is possible to identify two of the factors contributing to flooding: the subway line distribution and the rainfall conditions. As shown in Figure 12 and Figure 13, the flood-prone areas become larger during rainstorms. These areas are vulnerable during and after flooding events. In the flood-prone areas disaster situations become more serious. For example, the subway station of Line 6 was flooded because the Line 6 is located in a low position (Figure 14) and the prevention gate was insufficient to prevent excess rainwater during the heavy rainstorm that occurred on 10th May.
It is clear that the construction of a large number of urban subway lines has a significant effect on the severity of flooding. Therefore, using GIS to map the flood-prone areas to evaluate the severity of the flooding is effective. In addition, monitoring and protective measures for these flood-prone areas should be strengthened in order to reduce economic losses.

7. Conclusions

This paper presents an analysis of the flooding that took place in Guangzhou, China, due to a heavy rainstorm on 10 May 2016. The factors of topography have been analysed using DEM. The meteorology conditions were statistically analysed at the whole city level and the district level. GIS analysis was also performed to map the flood-prone areas. Based on the results of the analysis, the following conclusions can be made:
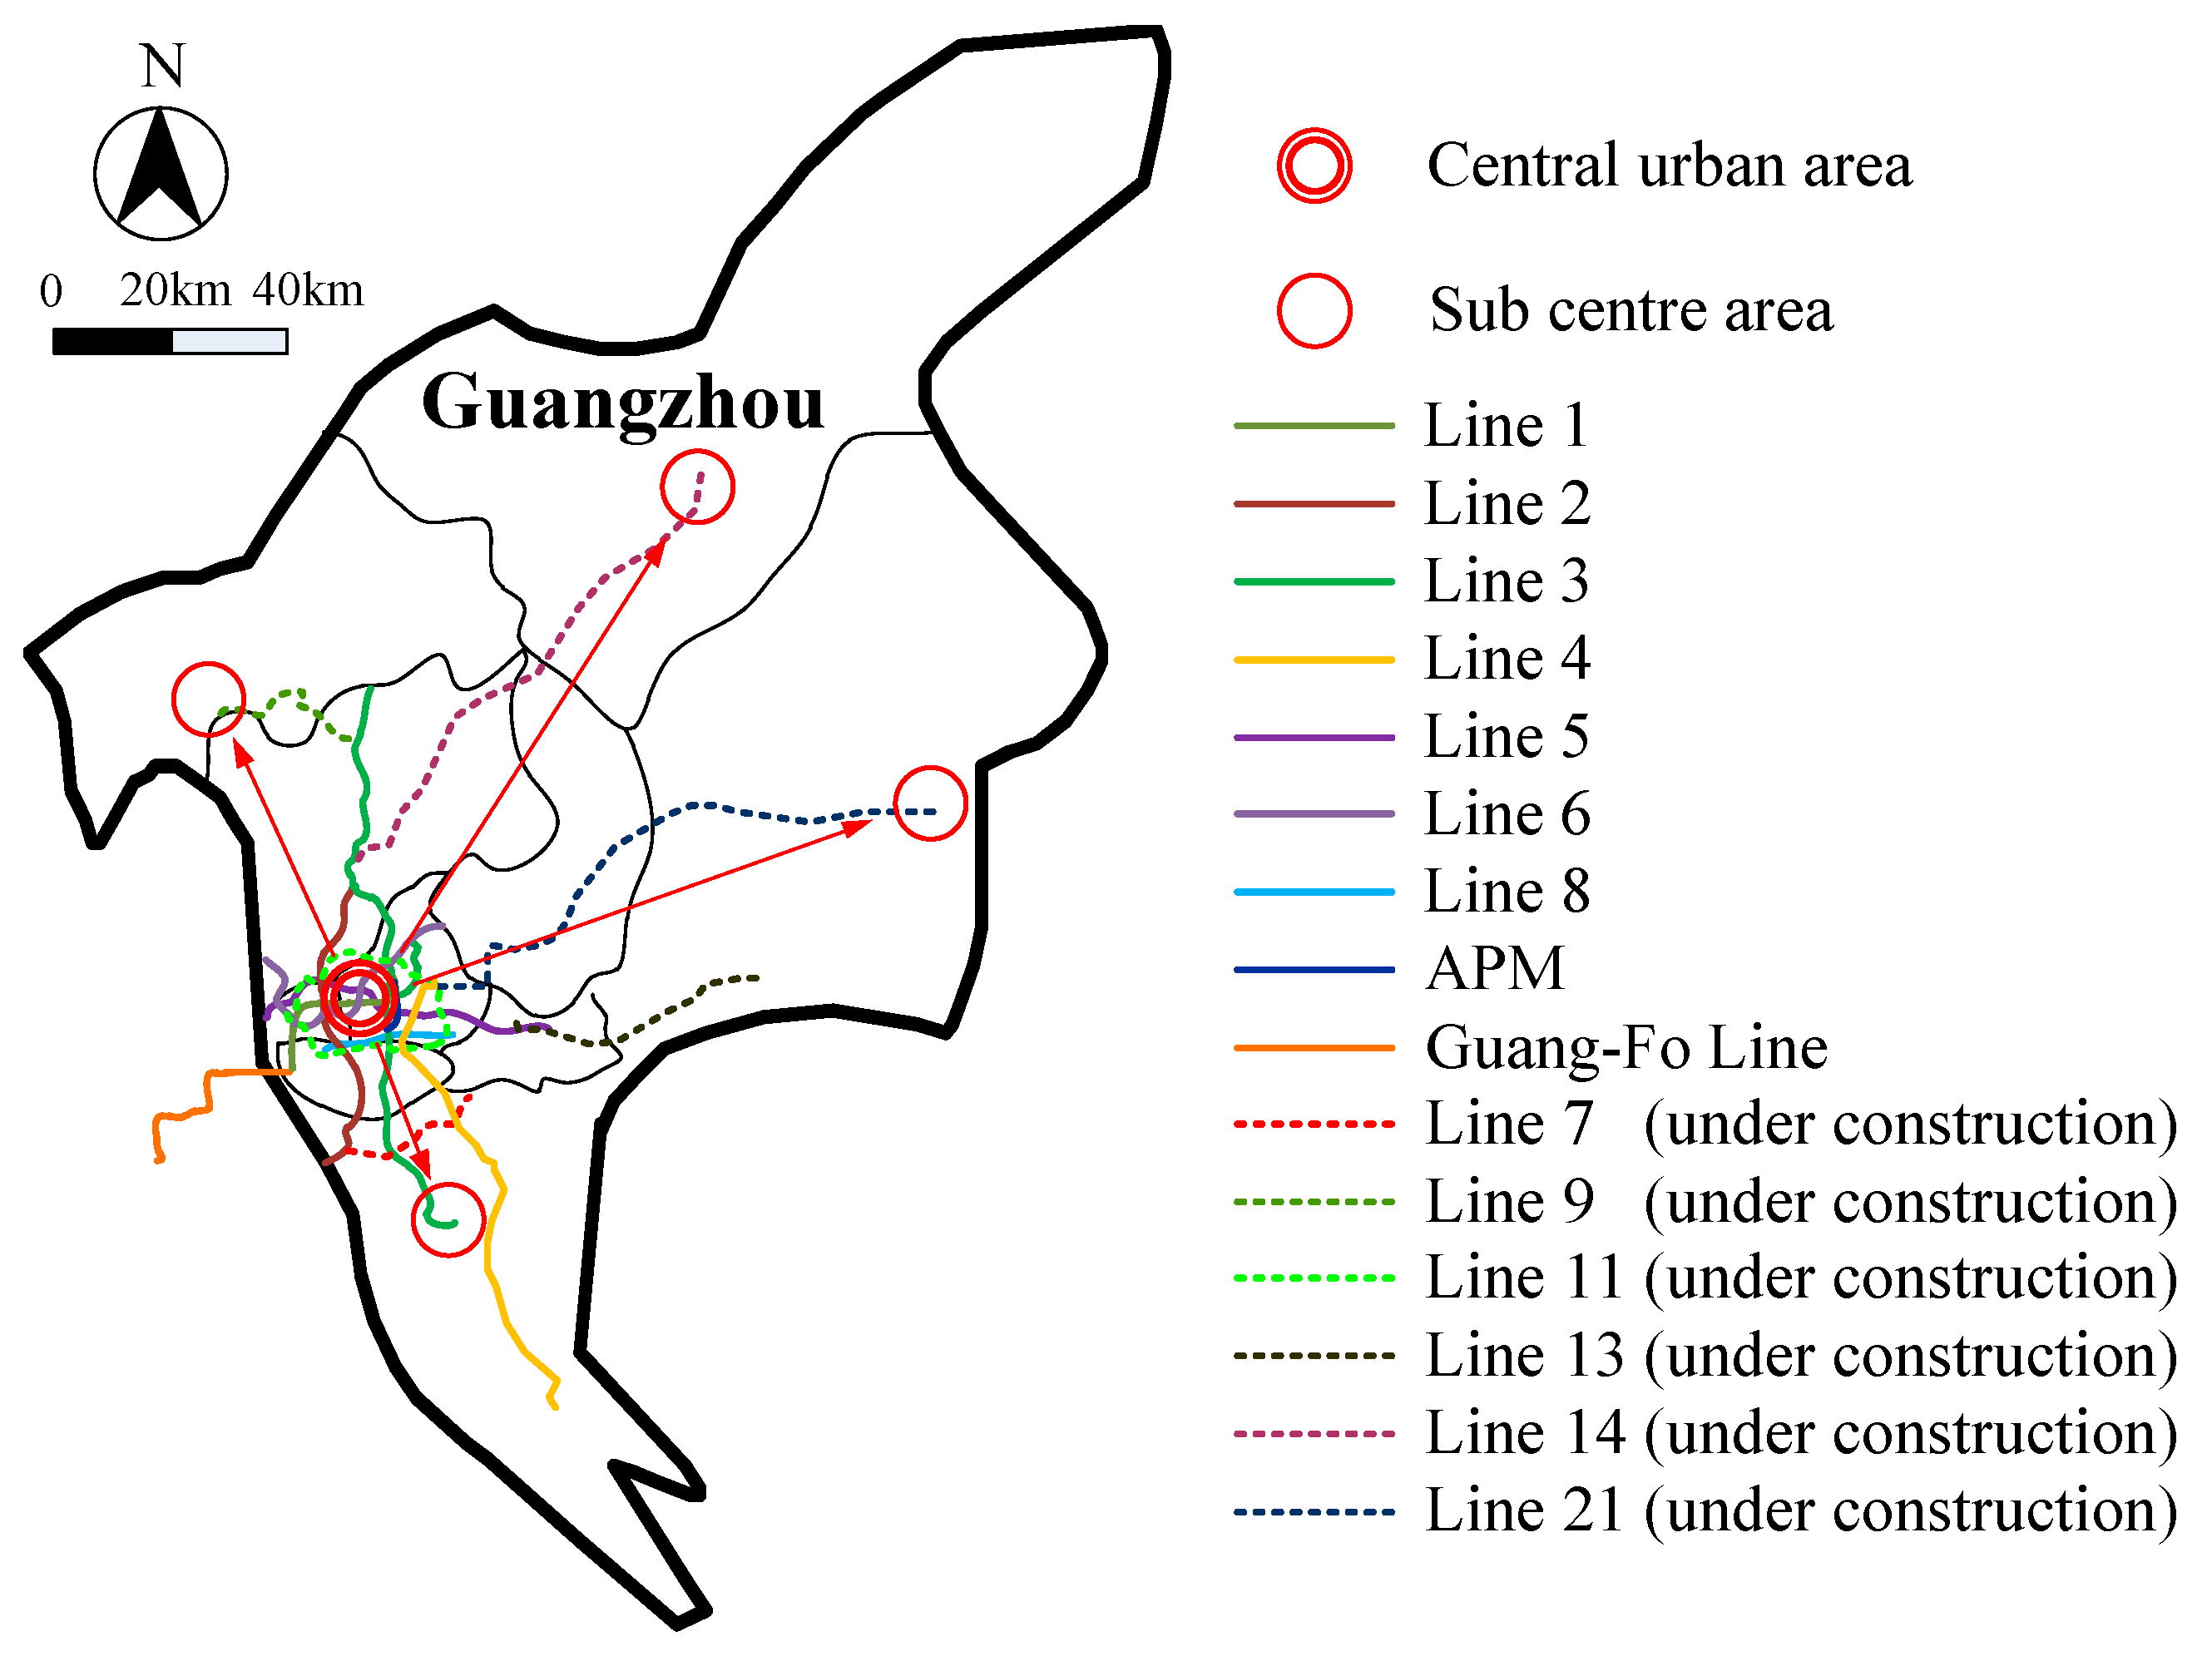
  • Characteristics of topography include elevation and slopes are critical to the flooding distribution. Metro Line 6 was flooded on 10 May 2016 due to its low elevation in the city center. The observed results show that areas with metro lines were more vulnerable to flooding. Considering the total economic losses in the city center due to flooding, a modification of the standard of severity of flooding hazards was proposed, i.e., lowering the value of the Rs range.
  • There is long-term settlement along metro tunnels due to train running loads, which causes surface subsidence along the subway line. By using multiple buffer analysis in GIS, flood-prone areas along subway lines under rainfall conditions were identified. It can be concluded that the disaster situation was serious and caused greater economic losses in subway areas than in other areas far from the subway lines. Therefore, strengthening of the monitoring and protection system for these flood-prone areas is required.
  • A “Sponge City” planning approach is recommended to improve the capacity of drainage and storage of rainwater temporary during heavy rainstorms. To incorporate the elements of a “Sponge City” requires the construction of a multi-functional pipeline system, sluice gates, and pumping stations in order to store the rainwater and subsequently reuse it. A drainage system should also be constructed to drain the excess rainwater. For the management of the city in the future, the combined use of GIS and BIM is also recommended to evaluate and monitor the risk of flooding.

Acknowledgments

The research work described herein was funded by the National Natural Science Foundation of China (NSFC) (Grant No. 41672259) and the National Basic Research Program of China (973 Program: 2015CB057802). Financial support was also received from the Shandong Nature Science Foundation (SNSF), Grant No. ZR2014EEM029 and No. ZR2014EEQ028.

Author Contributions

Hai-Min Lyu performed the data analysis and drafted the manuscript; Guo-Fu Wang collected the data; Jack Shuilong Shen revised the manuscript; Lin-Hai Lu drew the figures; and Guo-Quan Wang checked the content. All authors made contributions to the study and writing the manuscript.

Conflicts of Interest

The authors declare no conflict of interest.

References

  1. Wang, X.J.; Pang, A.D. The Cause and Characteristic from Rainstorm of the Past 20 years in Guangzhou. J. Guangzhou Univ. 2006, 5, 50–53. (In Chinese) [Google Scholar]
  2. Huang, Y.; Cheng, H.L. The impact of climate change on coastal geological disasters in south-eastern China. Nat. Hazards 2003, 65, 377–390. [Google Scholar] [CrossRef]
  3. Wu, Y.; Zhong, P.A.; Xu, B.; Zhu, F.; Ma, B. Changing of flood risk due to climate and development in Huaihe River basin, China. Stoch. Environ. Res. Risk Assess. 2016, 1–14. [Google Scholar] [CrossRef]
  4. Liu, Y.X.; Li, S.S.; Wang, Y.L.; Zhang, T.; Peng, J.; Li, T. Identification of multiple climatic extremes in metropolis: A comparison of Guangzhou and Shenzhen, China. Nat. Hazards 2015, 79, 939–953. [Google Scholar] [CrossRef]
  5. Cui, P.; Dang, C.; Zhuang, J.Q.; You, Y.; Chen, X.Q.; Scoot, K.M. Landslide-dammed lake at Tangjiashan, Sichuan province, China (triggered by the Wenchuan Earthquake, 12 May 2008): Risk assessment, mitigation strategy, and lessons learned. Environ. Earth Sci. 2015, 65, 1055–1065. [Google Scholar] [CrossRef]
  6. Almasi, P.; Soltani, S. Assessment of the climate change impacts on flood frequency (case study: Bazoft Basin, Iran). Stoch. Environ. Res. Risk Assess. 2016, 1–12. [Google Scholar] [CrossRef]
  7. Cai, J.Y.; Zhou, X.Y. Heavy rainfall change characteristics in recent 59 years of Guangzhou. Guangdong Meteorol. 2011, 33, 29–31. (In Chinese) [Google Scholar]
  8. Shen, S.L.; Wang, Z.F.; Sun, W.J.; Wang, L.B.; Horpibulsuk, S. A field trial of horizontal jet grouting using the composite-pipe method in the soft deposit of Shanghai. Tunn. Undergr. Space Technol. 2013, 35, 142–151. [Google Scholar] [CrossRef]
  9. Shen, S.L.; Wang, Z.F.; Horpibulsuk, S.; Kim, Y.H. Jet-Grouting with a newly developed technology: The Twin-Jet Method. Eng. Geol. 2013, 152, 87–95. [Google Scholar] [CrossRef]
  10. Jing, R.; Zorica, N.-B. Integrating spatial planning and flood risk management: A new conceptual framework for the spatially integrated policy infrastructure. Comput Environ. Urban Syst. 2016, 57, 68–79. [Google Scholar]
  11. Simões, N.E.; Ochoa-Rodríguez, S.; Wang, L.P.; Pina, R.D.; Marques, A.S.; Onof, C.; Leitão, J.P. Stochastic urban pluvial flood hazard maps based upon a spatial-temporal rainfall generator. Water 2015, 7, 3396–3406. [Google Scholar] [CrossRef]
  12. Wu, H.N.; Shen, S.L.; Liao, S.M.; Yin, Z.Y. Longitudinal structural modelling of shield tunnels considering shearing dislocation between segmental rings. Tunn. Undergr. Space Technol. 2015, 50, 317–323. [Google Scholar] [CrossRef]
  13. Wu, H.N.; Shen, S.L.; Ma, L.; Yin, Z.Y.; Horpibulsuk, S. Evaluation of the strength increase of marine clay under staged embankment loading: A case study. Mar. Georesour. Geotechnol. 2015, 33, 532–541. [Google Scholar] [CrossRef]
  14. Fu, Y.X.; Chen, Y.Y.; Zhang, Z.K. Temporal and spatial variation of population density of coastal cities during 1985–2010 in China. Trop. Geogr. 2014, 34, 635–642. (In Chinese) [Google Scholar]
  15. Yin, Z.Y.; Hicher, P.Y.; Dano, C.; Jin, Y.F. Modeling the mechanical behavior of very coarse granular materials. J. Eng. Mech. ASCE 2016. [Google Scholar] [CrossRef]
  16. Liu, G.Q.; Wang, X.Q.; Meng, Z.P.; Zhao, H.J. Seawater inrush assessment based on hydrochemical analysis enhanced by hierarchy clustering in an undersea goldmine pit, China. Environ. Earth Sci. 2014, 71, 4977–4987. [Google Scholar] [CrossRef]
  17. Huang, Y.; Yu, M.; Xu, Q.; Sawada, K.; Moriguchi, S.; Yashima, A.; Liu, C.W.; Xue, L. InSAR-derived digital elevation models for terrain change analysis of earthquake-triggered flow-like landslides based on ALOS/PALSAR imagery. Environ. Earth Sci. 2015, 73, 7661–7668. [Google Scholar] [CrossRef]
  18. Huang, Y.; Bao, Y.J.; Wang, Y.H. Analysis of geoenvironmental hazards in urban underground space development in Shanghai. Nat. Hazards 2015, 75, 2067–2079. [Google Scholar] [CrossRef]
  19. Tan, Y.; Wei, B.; Diao, Y.; Zhou, X. Spatial corner effects of long and narrow multipropped deep excavations in Shanghai soft clay. J. Perform. Constr. Facil. ASCE 2014, 28, 04014015. [Google Scholar] [CrossRef]
  20. Du, Y.J.; Fan, R.D.; Liu, S.Y.; Reddy, K.R.; Jin, F. Workability, compressibility and hydraulic conductivity of zeolite-amended clayey soil/calcium-bentonite backfills for slurry-trench cutoff walls. Eng. Geol. 2015, 195, 258–268. [Google Scholar] [CrossRef]
  21. Shen, S.L.; Xu, Y.S. Numerical evaluation of land subsidence induced by groundwater pumping in Shanghai. Can. Geotech. J. 2011, 48, 1378–1392. [Google Scholar] [CrossRef]
  22. Zhang, N.; Shen, S.L.; Wu, H.N.; Chai, J.C.; Yin, Z.Y. Evaluation of performance of embankments with reinforcement on PVD-improved marine clay. Geotext. Geomembr. 2015, 43, 506–514. [Google Scholar] [CrossRef]
  23. Xu, Y.S.; Shen, S.L.; Ma, L.; Sun, W.J.; Yin, Z.Y. Evaluation of the blocking effect of retaining walls on groundwater seepage in aquifers with different insertion depths. Eng. Geol. 2014, 183, 254–264. [Google Scholar] [CrossRef]
  24. Deng, J.L.; Shen, S.L.; Xu, Y.S. Investigation into pluvial flooding hazards caused by heavy rain and protection measures in Shanghai, China. Nat. Hazards 2016. [Google Scholar] [CrossRef]
  25. Shen, S.L.; Wang, J.P.; Wu, H.N.; Xu, Y.S.; Ye, G.L. Evaluation of hydraulic conductivity for both marine and deltaic deposits based on piezocone testing. Ocean Eng. 2015, 110, 174–182. [Google Scholar] [CrossRef]
  26. Shen, S.L.; Wu, Y.X.; Xu, Y.S.; Hino, T.; Wu, H.N. Evaluation of hydraulic parameter based on groundwater pumping test of multi-aquifer system of Tianjin. Comput. Geotech. 2015, 68, 196–207. [Google Scholar] [CrossRef]
  27. Nerimitknornburee, A.; Horpibulsuk, S.; Chinkulkijniwat, A.; Arulrajah, A.; Disfani, M.M. Durability against wetting-drying cycles of sustainable lightweight cellular cemented construction material comprising clay and fly ash waste. Constr. Build. Mater. 2015, 41–49. [Google Scholar] [CrossRef]
  28. Liu, K.L.; Yao, C.; Chen, J.; Li, Z.; Li, Q.; Sun, L. Comparison of three updating models for real time forecasting: A case study of flood forecasting at the middle reaches of the Huai River in East China. Stoch. Environ. Res. Risk Assess. 2016, 1–14. [Google Scholar] [CrossRef]
  29. Wang, Y. Advances in remote sensing of flooding. Water 2015, 7, 6404–6410. [Google Scholar] [CrossRef]
  30. Gao, T.; Shi, X. Spatio-temporal characteristics of extreme precipitation events during 1951–2011 in Shandong, China and possible connection to the large scale atmospheric circulation. Stoch. Environ. Res. Risk Assess. 2016, 30, 1421–1440. [Google Scholar] [CrossRef]
  31. Liu, R.; Chen, Y.; Wu, J.; Gao, L.; Barrett, D.; Xu, T.; Li, L.; Huang, C.; Yu, J. Assessing spatial likelihood of flooding hazard using naïve Bayes and GIS: A case study in Bowen Basin, Australia. Stoch. Environ. Res. Risk Assess. 2016, 30, 1575–1590. [Google Scholar] [CrossRef]
  32. Peck, R.B. Deep excavation and tunneling in soft ground. In Proceeding of the Seventh International Conference on Soil Mechanics and Foundation Engineering, Mexico City, Mexico, 28–29 August 1969.
  33. Shen, S.L.; Wu, H.N.; Cui, Y.J.; Yin, Z.Y. Long-term settlement behavior of the metro tunnel in Shanghai. Tunn. Undergr. Space Technol. 2014, 40, 309–323. [Google Scholar] [CrossRef]
  34. Zemtsov, S.P.; Goryachko, M.D.; Baburin, V.L.; Krylenko, I.N.; Yumina, N.M. Integrated assessment of socio-economic risks of hazardous hydrological phenomena in Slavyansk municipal district. Nat. Hazards 2016, 82, S43–S61. [Google Scholar] [CrossRef]
  35. Christakos, G.; Serre, M.L. Spatiotemporal analysis of environmental exposure–health effect associations. J. Expo. Anal. Environ. Epidemiol. 2000, 10, 168–187. [Google Scholar] [CrossRef] [PubMed]
  36. Shen, S.L.; Ma, L.; Xu, Y.S.; Yin, Z.Y. Interpretation of increased deformation rate in aquifer IV due to groundwater pumping in Shanghai. Can. Geotech. J. 2013, 50, 1129–1142. [Google Scholar] [CrossRef]
  37. Gong, Y.W.; Liang, X.Y.; Li, X.N.; Li, J.Q.; Fang, X.; Song, R.N. Influence of rainfall characteristics on Total suspended solids in urban runoff: A case study in Beijing, China. Water 2016, 8, 278. [Google Scholar] [CrossRef]
  38. Guangzhou Meteorological Data Sharing Network (GMDSN). Available online: http://data.gz121.gov.cn/weather/index.jsp (accessed on 11 May 2016).
  39. Qian, Q.H. Present state, problems and development trends of urban underground space in China. Tunn. Undergr. Space Technol. 2016, 55, 280–289. [Google Scholar]
  40. Li, X.; Li, J.; Fang, X.; Gong, Y.; Wang, W. Case studies of the sponge city program in China. World Environ. Water Resour. Congr. 2016. [Google Scholar] [CrossRef]
  41. Zhang, L.; Wu, X.; Ding, L.; Skibniewski, M.J.; Lu, Y. Bim-based risk identification system in tunnel construction. J. Civ. Eng. Manag. 2016, 22, 529–539. [Google Scholar] [CrossRef]
  42. Marzouk, M.; Abdelaty, A. Monitoring thermal comfort in subways using building information modeling. Energy Build. 2014, 84, 252–257. [Google Scholar] [CrossRef]
Figure 1. Location map of Guangzhou and distribution of karst caves in Guangdong Province (a) distribution of karst caves in Guangdong Province; (b) districts of Guangzhou City.
Water 08 00447 g001
Figure 2. Topography in Guangzhou: (a) River system; (b) elevation; (c) slope.
Water 08 00447 g002
Figure 3. Monthly distributed heavy rain days from 1951 to 2009.
Water 08 00447 g003
Figure 4. Annual heavy rain days from 1951 to 2009 in Guangzhou.
Water 08 00447 g004
Figure 5. Annual heavy rain days from 1985 to 2004 in five central districts of Guangzhou.
Water 08 00447 g005
Figure 6. Annual rainfall from 1985 to 2004 in five suburban areas of Guangzhou.
Water 08 00447 g006
Figure 7. Plan view of Guangzhou city and distribution of subways.
Water 08 00447 g007
Figure 8. Roads flooded during the heavy rainstorm in 10 May 2016: (a) flooded road; (b) submerged cars; (c) depth of floodwater over adult’s knee; (d) road like pool.
Water 08 00447 g008
Figure 9. Subway station flooded during the heavy rainfall on 10 May 2016.
Water 08 00447 g009
Figure 10. Rainfall in different suburban areas in flooding disaster on 10 May 2016.
Water 08 00447 g010
Figure 11. Rainfall distribution of the 10 May rainstorm, considering the local topography.
Water 08 00447 g011
Figure 12. Influence areas of subway lines without rainfall.
Water 08 00447 g012
Figure 13. Flood-prone areas and disaster situation of Line 6 during this rainstorm.
Water 08 00447 g013
Figure 14. Elevation of Line 6 location.
Water 08 00447 g014

