Article

Dynamics of Bacterial Community Abundance and Structure in Horizontal Subsurface Flow Wetland Mesocosms Treating Municipal Wastewater

Institute of Ecology and Earth Sciences, University of Tartu, 46 Vanemuise St., 51014 Tartu, Estonia
*
Author to whom correspondence should be addressed.
Water 2016, 8(10), 457; https://doi.org/10.3390/w8100457
Submission received: 27 June 2016 / Revised: 29 September 2016 / Accepted: 8 October 2016 / Published: 17 October 2016
(This article belongs to the Special Issue Constructed Wetlands for Water Treatment: New Developments)

Abstract

:
Dynamics of bacterial community abundance and structure of a newly established horizontal subsurface flow (HSSF) pilot-scale wetland were studied using high-throughput sequencing and quantitative polymerase chain reaction (PCR) methods. Bacterial community abundance increased rapidly within one month and stabilised thereafter in three replicate HSSF constructed wetland (CW) mesocosms. The most dominant phylum was Proteobacteria, followed by Bacteroidetes in wetland media biofilms and Firmicutes in influent wastewater. CW bacterial community diversity increased over time and was positively related to the wastewater treatment efficiency. Increase in the abundance of total bacteria in the community was accompanied with the abundance of denitrifying bacteria that promoted nitrate and nitrite removal from the wastewater. During the 150-day study period, similar patterns of bacterial community successions were observed in replicate HSSF CW mesocosms. The data indicate that successions in the bacterial community in HSSF CW are shaped by biotic interactions, with a significant contribution made by external abiotic factors such as influent chemical parameters. Network analysis of the bacterial community revealed that organic matter and nitrogen removal in HSSF CW could be, in large part, allocated to a small subset of tightly interconnected bacterial species. The diversity of bacterial community and abundance of denitrifiers were good predictors of the removal efficiency of ammonia, nitrate and total organic C in HSSF CW mesocosms, while the removal of the seven-day biochemical oxygen demand (BOD7) was best predicted by the abundance of a small set of bacterial phylotypes. The results suggest that nitrogen removal in HSSF CW consist of two main pathways. The first is heterotrophic nitrification, which is coupled with aerobic denitrification and mediated by mixotrophic nitrite-oxidizers. The second pathway is anaerobic denitrification, which leads to gaseous intermediates and loss of nitrogen as N2.

Graphical Abstract

1. Introduction

Constructed wetlands (CWs), also known as treatment wetlands, are engineered systems designed to utilise the natural processes of biological wetlands to remove pollutants from wastewater [1,2]. Over the last decade, CWs have become widely used for wastewater treatment as they represent a cost-effective, ecologically-friendly, and simple alternative to conventional technologies for wastewater purification [3,4,5]. Horizontal subsurface flow (HSSF) CWs have long been used for treatment of domestic and municipal wastewater. Nowadays however, there is the increasing trend of using HSSF CW for other types of wastewater including industrial, agricultural, and landfill leachates [6,7,8,9].
While the removal mechanisms of physical and chemical pollutants in CWs are well known [10], the understanding of microbial processes related to pollutant removal is still insufficient [11]. It is commonly accepted that the removal of organic matter and nutrients in CW is mostly driven by microorganisms [11,12]. Therefore, in-depth knowledge of the development of microbial communities in CWs and their relation to the working regime and purification efficiency of CWs could help to improve the design and performance of CWs.
The applications of conventional molecular techniques in the last two decades have greatly expanded our understanding of soil microbial communities [13]. However, these methods may overlook many of the low-abundance organisms in microbial communities, therefore providing incomplete information about the community structure and diversity within CWs [14]. Advances in qualitative and quantitative molecular techniques, such as high-throughput sequencing and quantitative PCR (qPCR), have made it possible to detect the structure and abundance of microbial communities more profoundly [15,16,17]. A number of studies have applied quantitative PCR [18,19,20,21] and high-throughput sequencing [22,23,24,25] to investigate microbial processes in various wastewater treatment systems.
Although a few studies have concentrated on microbial activity during the early stages of CW operation [26,27,28,29], the dynamics of microbial community in CWs during the start-up period is not clearly understood and molecular studies utilising high-throughput sequencing to provide thorough information about microbial community structure in this period are lacking.
The objectives of this study were: (1) to describe the dynamics of the abundance and structure of bacterial community in a newly established, experimental HSSF wetland media biofilm system (WMB) treating municipal wastewater; (2) to evaluate the denitrification potential of the HSSF WMB bacterial community; (3) to analyse the factors affecting HSSF WMB bacterial community structure and denitrification potential; and (4) to analyse the relationship between bacterial community structure and treatment efficiency of HSSF CW.

2. Materials and Methods

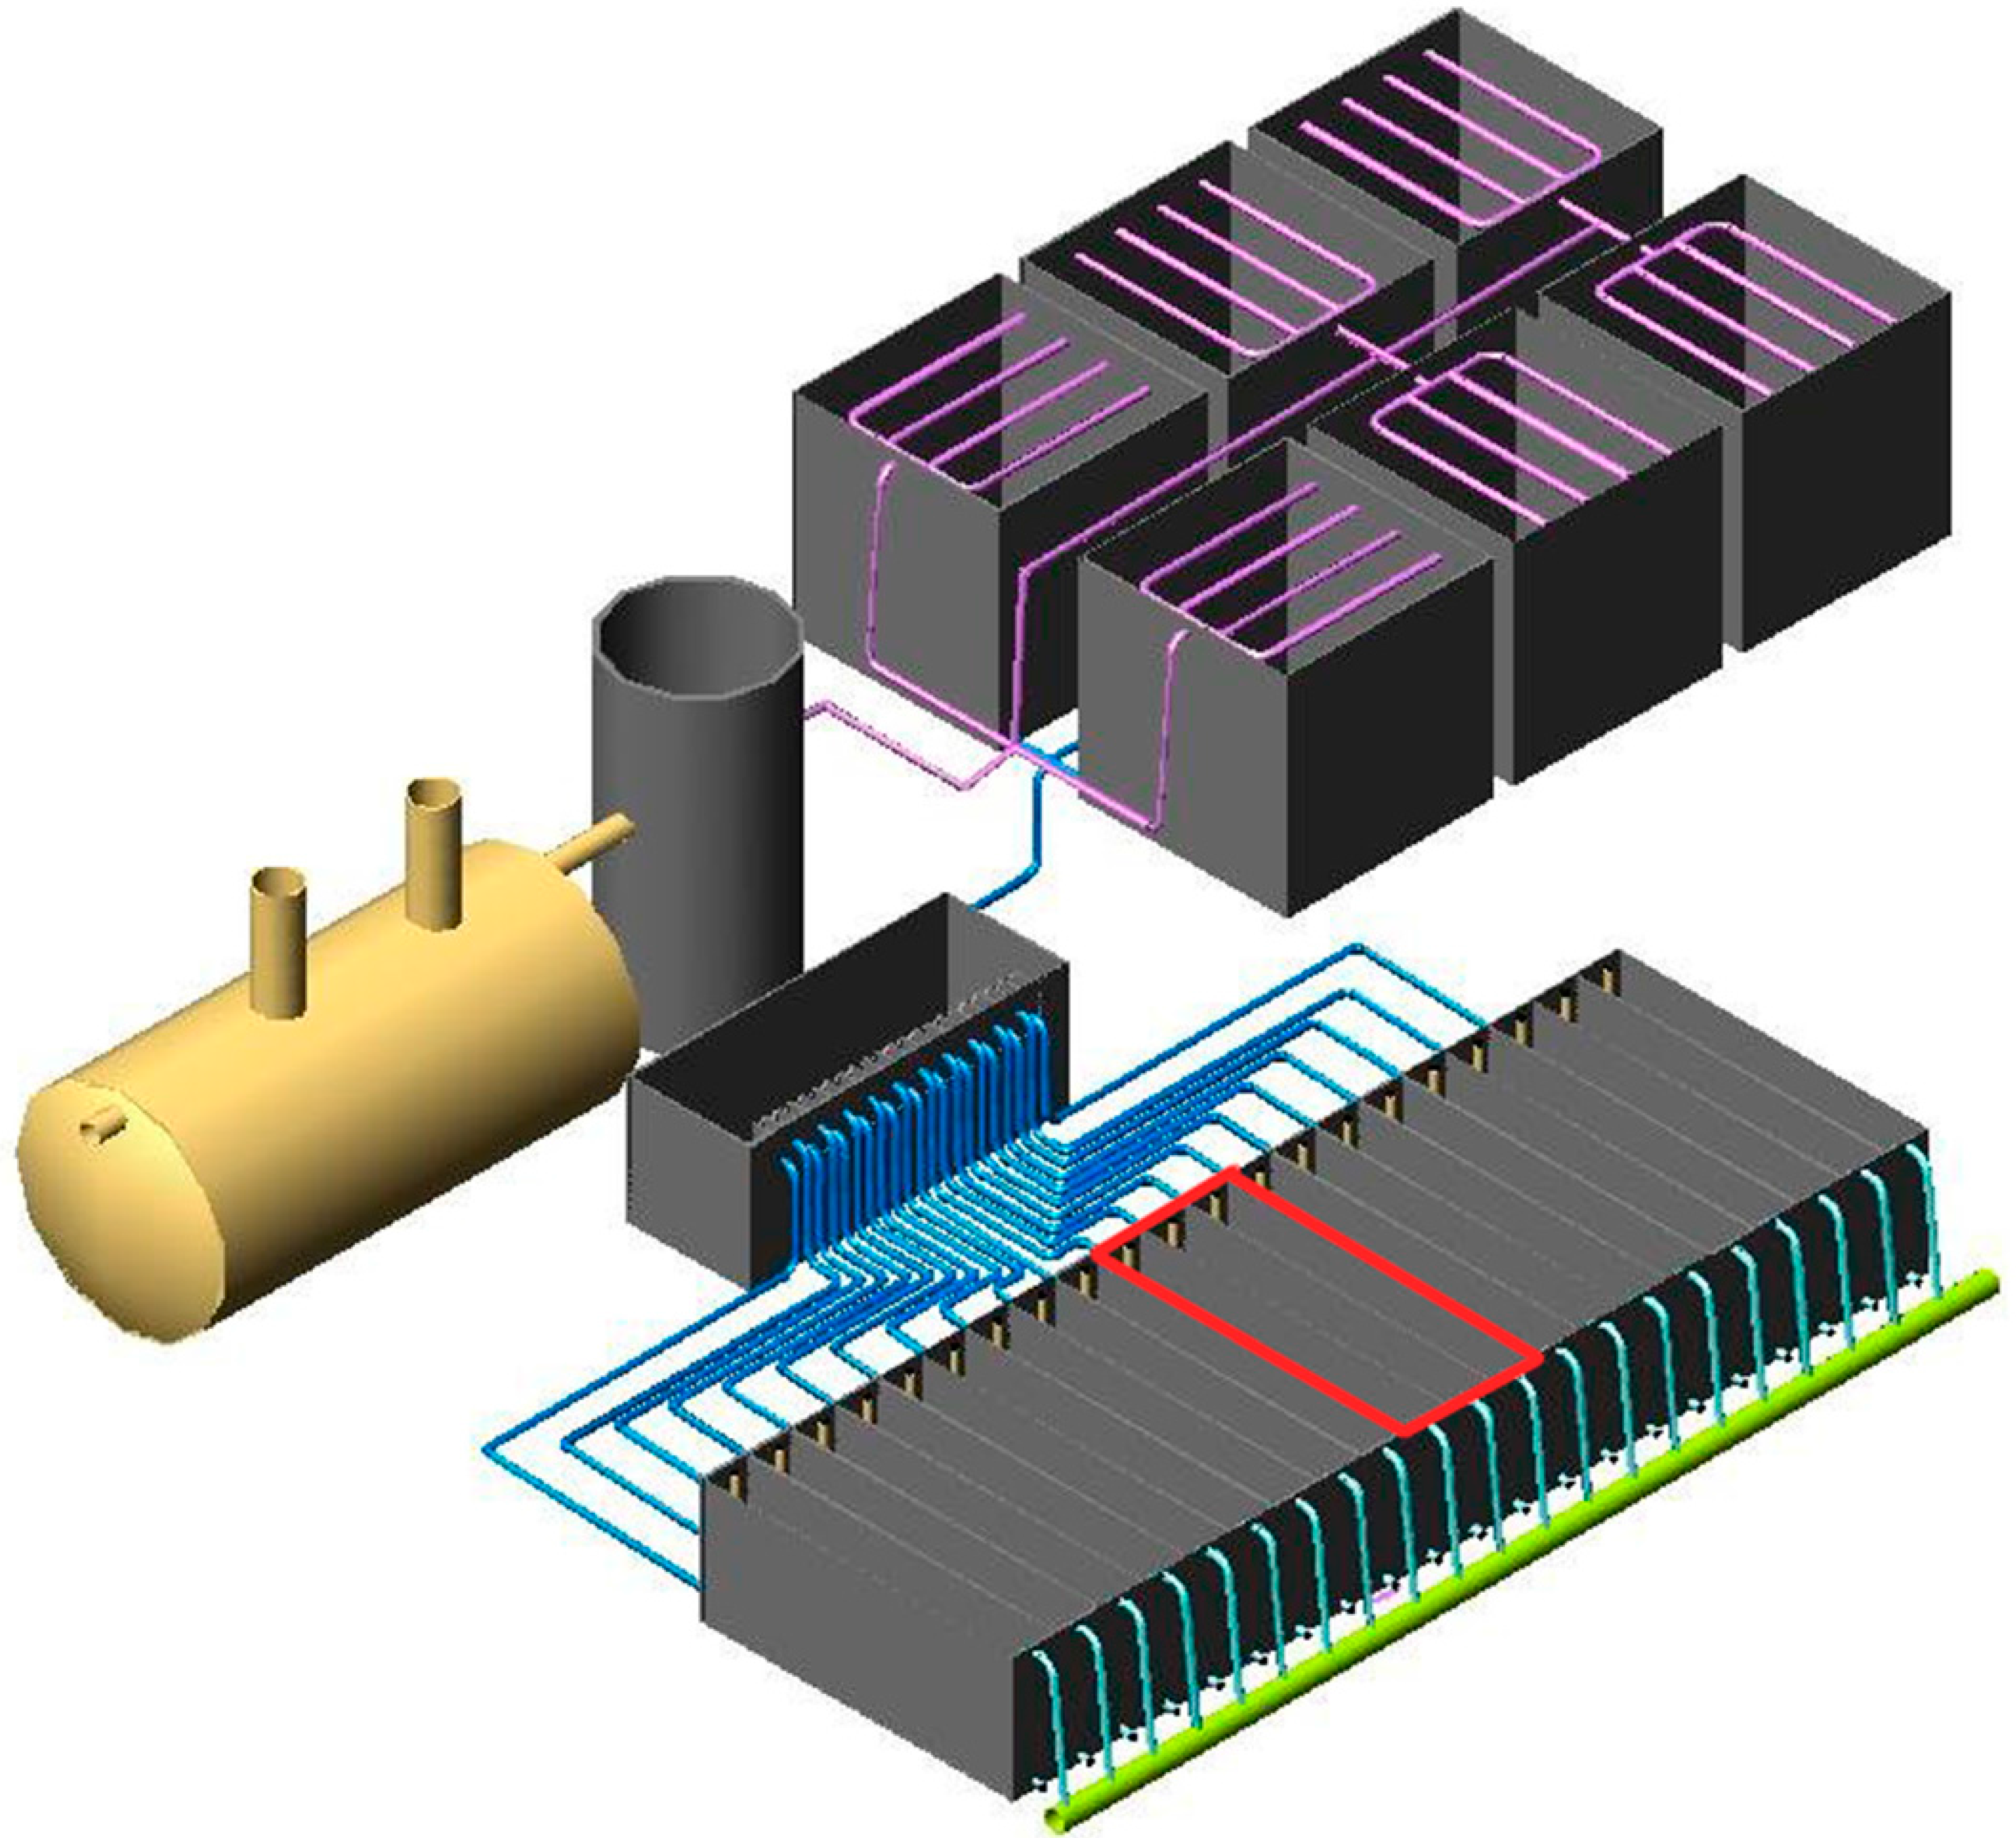
2.1. Study System Description

A 150-day municipal wastewater treatment study was conducted in an experimental unplanted hybrid constructed wetland system (located on the site of an activated sludge wastewater treatment plant) in Nõo Parish, Tartu County, Estonia. The system was established in June 2009; a detailed description and scheme are provided by Nurk et al. [30] and Zaytsev et al. [31]. Figure A1 shows a schematic representation of the mesocosms (MCs) used in this experiment. The MCs were fed with raw domestic wastewater combined with effluents from the dairy and meat industries, pumped from an inlet of the activated sludge treatment plant. Wastewater was pumped into a septic tank (2 m3), from which it flowed through the interim well to six parallel vertical subsurface flow MCs (total area 6 m2), and was subsequently collected into a distribution well. The pre-treated wastewater was divided equally between 21 parallel HSSF MC cells (length: 1.5 m, width: 0.2 m, depth: 0.6 m). The three HSSF MCs used in this study were filled with light expanded clay aggregates (LECA), with a particle size of 2–4 mm, forming the wetland media and providing a high surface area environment for microbial biofilm attachment. The retention time and hydraulic loading rate of the HSSF MCs were kept stable during the trial period at 1.2 day and ≤20 mm/day, respectively. The temperature in the studied MCs was between 17.2 °C and 18.6 °C for the first two months of system operation, but then started to drop and was 3.0 °C on day 150 of the experiment (in November). The HSSF MCs were covered with 5 cm thick insulation slabs in October 2009 to avoid freezing of the wastewater due to low air temperatures. The study was performed in HSSF CW units without vegetation in order to a better defined and less complex system.

2.2. Sampling

Sampling of the experimental system began after 26 days of the treatment. Samples were collected on days 26, 45, 64, 94, and 150 of the treatment during the five-month experiment. Between the second and third sampling events, partial clogging with biomass occurred in pipes connecting the distribution box and HSSF MCs, causing an uneven distribution of wastewater to the parallel MC cells. As soon as the clogging was detected, it was cleared by dismantling, wash-out and reattachment of the pipes. At each sampling event, five subsamples of wetland media were collected from a depth of 25–35 cm with a soil corer (diameter 5 cm) at even distances along the longitudinal transect of the MC and then mixed to form a composite sample for each MC. Influent wastewater sample was taken only on day 26. Grab samples of wastewater were taken from the distribution box before the HSSF MCs and from the outlets of each HSSF MC.
The wastewater and wetland media samples for molecular analyses were stored at −80 °C until DNA extraction; samples for chemical analyses were held at +4 °C. The following indicator parameter values were determined from wastewater samples: total nitrogen (Ntotal), NH4–N, NO2–N, NO3–N, and total organic carbon (TOC) contents using the portable spectrophotometric system DR 2800 (Hach-Lange, Düsseldorf, Germany). In addition, the seven-day biochemical oxygen demand (BOD7) was measured according to Standard Methods for the Examination of Water and Wastewater [32] from influent and effluent samples. Changes in the wastewater during the treatment process in HSSF MCs over the study period are summarised in Table 1. Measured dissolved oxygen values in the MCs effluent were constantly below 1 mg/L. The temporal dynamics of different nitrogen forms in the influent are shown in Figure A2.

2.3. DNA Extraction, PCR and Sequencing

A portion of each wetland media sample was crushed with a mortar and pestle and DNA was extracted from 10 g of the crushed material using a PowerMax Soil DNA Isolation Kit (Mo Bio Laboratories, Carlsbad, CA, USA) according to the manufacturer’s instructions. Bacterial community profiling in HSSF MC samples was performed with Illumina® HiSeq 2000 sequencing (Illumina, San Diego, CA, USA) using primers L-V6/R-V6 (Table A1) to amplify the bacteria-specific V6 hypervariable region of the 16S rRNA gene [33]. DNA extraction and PCR are described in detail in the Appendix A.

2.4. Sequence Data Preparation and Taxonomic Assessment

The paired-end reads were assembled into composite reads with SHERA [34]. Sequences with a SHERA quality score of less than 0.5 were discarded. This step removed about half of the sequences. After assembly and removal of low quality reads, custom Perl scripts were used for sorting reads to samples according to barcodes, while at the same time removing barcodes and primers. The initial number of sequences after assembling paired-end reads was 2,131,325 in total.
The assembled reads were processed using Mothur v 1.25.1 [35]. For data denoising, sequences for which the average sequencing quality score dropped below 35 over a 25-bp sliding window, were shorter than 70 bp, had any ambiguous bases, and were longer than 6 homopolymers were discarded. These steps removed 9% of the total sequences. The remaining sequences were aligned to the SILVA-compatible reference alignment [36] and only the sequences overlapping the same alignment space (in total 1,123,176 effective reads; range in individual samples from 24,932 to 168,511 effective reads) were further analysed. Werner et al. [37] have shown that the trimming of classification reference sequences represents a more stringent discarding of non-16S reads and improves taxonomic classification. Therefore, the Greengenes reference database [38] was previously trimmed to the 16S rRNA V6 region using V-Xtractor v 2.0 [39] and used with the 6-nearest neighbour algorithm for taxonomic assignment. Denoised sequences were clustered into operational taxonomic units (OTUs) at 95% similarity level using CROP v 1.33 [40]. Using the MultiCoLA v 1.4 programme, 70% of all obtained OTUs were interpreted as rare (sequencing error) and removed so that a consistent ecological pattern was retained [41]. Finally, the number of sequences in each sample was standardised to the lowest sequence number across the samples. All assembled reads were deposited in the European Nucleotide Archive under the accession number PRJEB8946.
In order to more precisely detect sequences belonging to the order Brocadiales in the phylum Planctomycetes, that are all known to include anaerobic ammonia oxidizing (ANAMMOX) bacteria (genera Candidatus Brocadia, Kuenenia, Scalindua, Anammoxoglobus, and Jettenia), USEARCH v 7.0 [42] with local alignment and identity over 90% was used to search for Planctomycetes sequences against Brocadiales extracted from the Greengenes database.

2.5. Quantitative PCR

Quantitative PCR (qPCR) was applied to evaluate changes in bacterial community size by the 16S rRNA gene abundance. Denitrification potential was also examined in each mesocosm using qPCR targeting nirS and nirK genes that encode nitrite reductase. For standard curves, a eubacterial 16S rRNA gene fragment from Pseudomonas mendocina PC1, a nirS gene fragment from Pseudomonas aeruginosa PAO1, and a nirK gene fragment from an environmental sample were amplified using specific primer pairs and PCR programmes (Table A1). The standard plasmid construction was performed as described by Nõlvak et al. [43]. Serial dilutions of standard plasmids (Table A1) were used for creating the standard curves. When quantifying 16S rRNA gene copy numbers, the same V6 hypervariable region as in sequencing was targeted. The qPCR amplification data were analysed with LinRegPCR programme version 2016.0 [44]. The qPCR parameters and the normalisation formula are described in Appendix A.

2.6. Statistical Analyses

Mothur v 1.25.1 [35] was used to calculate the α-diversity indices (Inverse Simpson’s diversity index and Evenness index) and to construct the similarity matrix using Bray-Curtis dissimilarity. Distance-based regression analysis was applied using the DISTLM programme with forward selection procedure and 999 permutations [45] to identify influent water variables that explain significant amounts of variation in bacterial community structure and to subtract the influence of time. The Molecular Ecological Network Analyses Pipeline (MENAP) was used to create a molecular ecological network based on the relative abundance data of the OTUs [46]. The result of the molecular ecological network approach was applied in order to assess the relationship between bacterial community structure and treatment efficiency of HSSF MCs. The relationship between module-based eigengenes and treatment efficiency of CWs was assessed with Module-EigenGene analysis within MENAP. Spearman rank correlations between system operational and indicator parameters and gene parameter values were calculated using Statistica v 7.1 (StatSoft, Tulsa, OK, USA). The R package “akima” version 0.5–12 (https://cran.r-project.org/web/packages/akima/index.html) was used to create interpolated contour plots of pairs of the microbiological parameters as x and y with treatment efficiency as the z variable. Multiple linear regression was applied to estimate relationship of treatment efficiency with microbiological parameters. Relative abundance and phylogenetic distance matrices of OTUs were used to calculate the Net Relatedness Index (NRI) and Nearest Taxon Index (NTI) standardised effect sizes with R software using the picante software package and default null model [47]. The NRI is based on the mean pairwise distances among taxa and is a measure of the overall tree-wide structure, while the NTI is based on the mean distance to the nearest neighbour and is a measure of local clustering.

3. Results

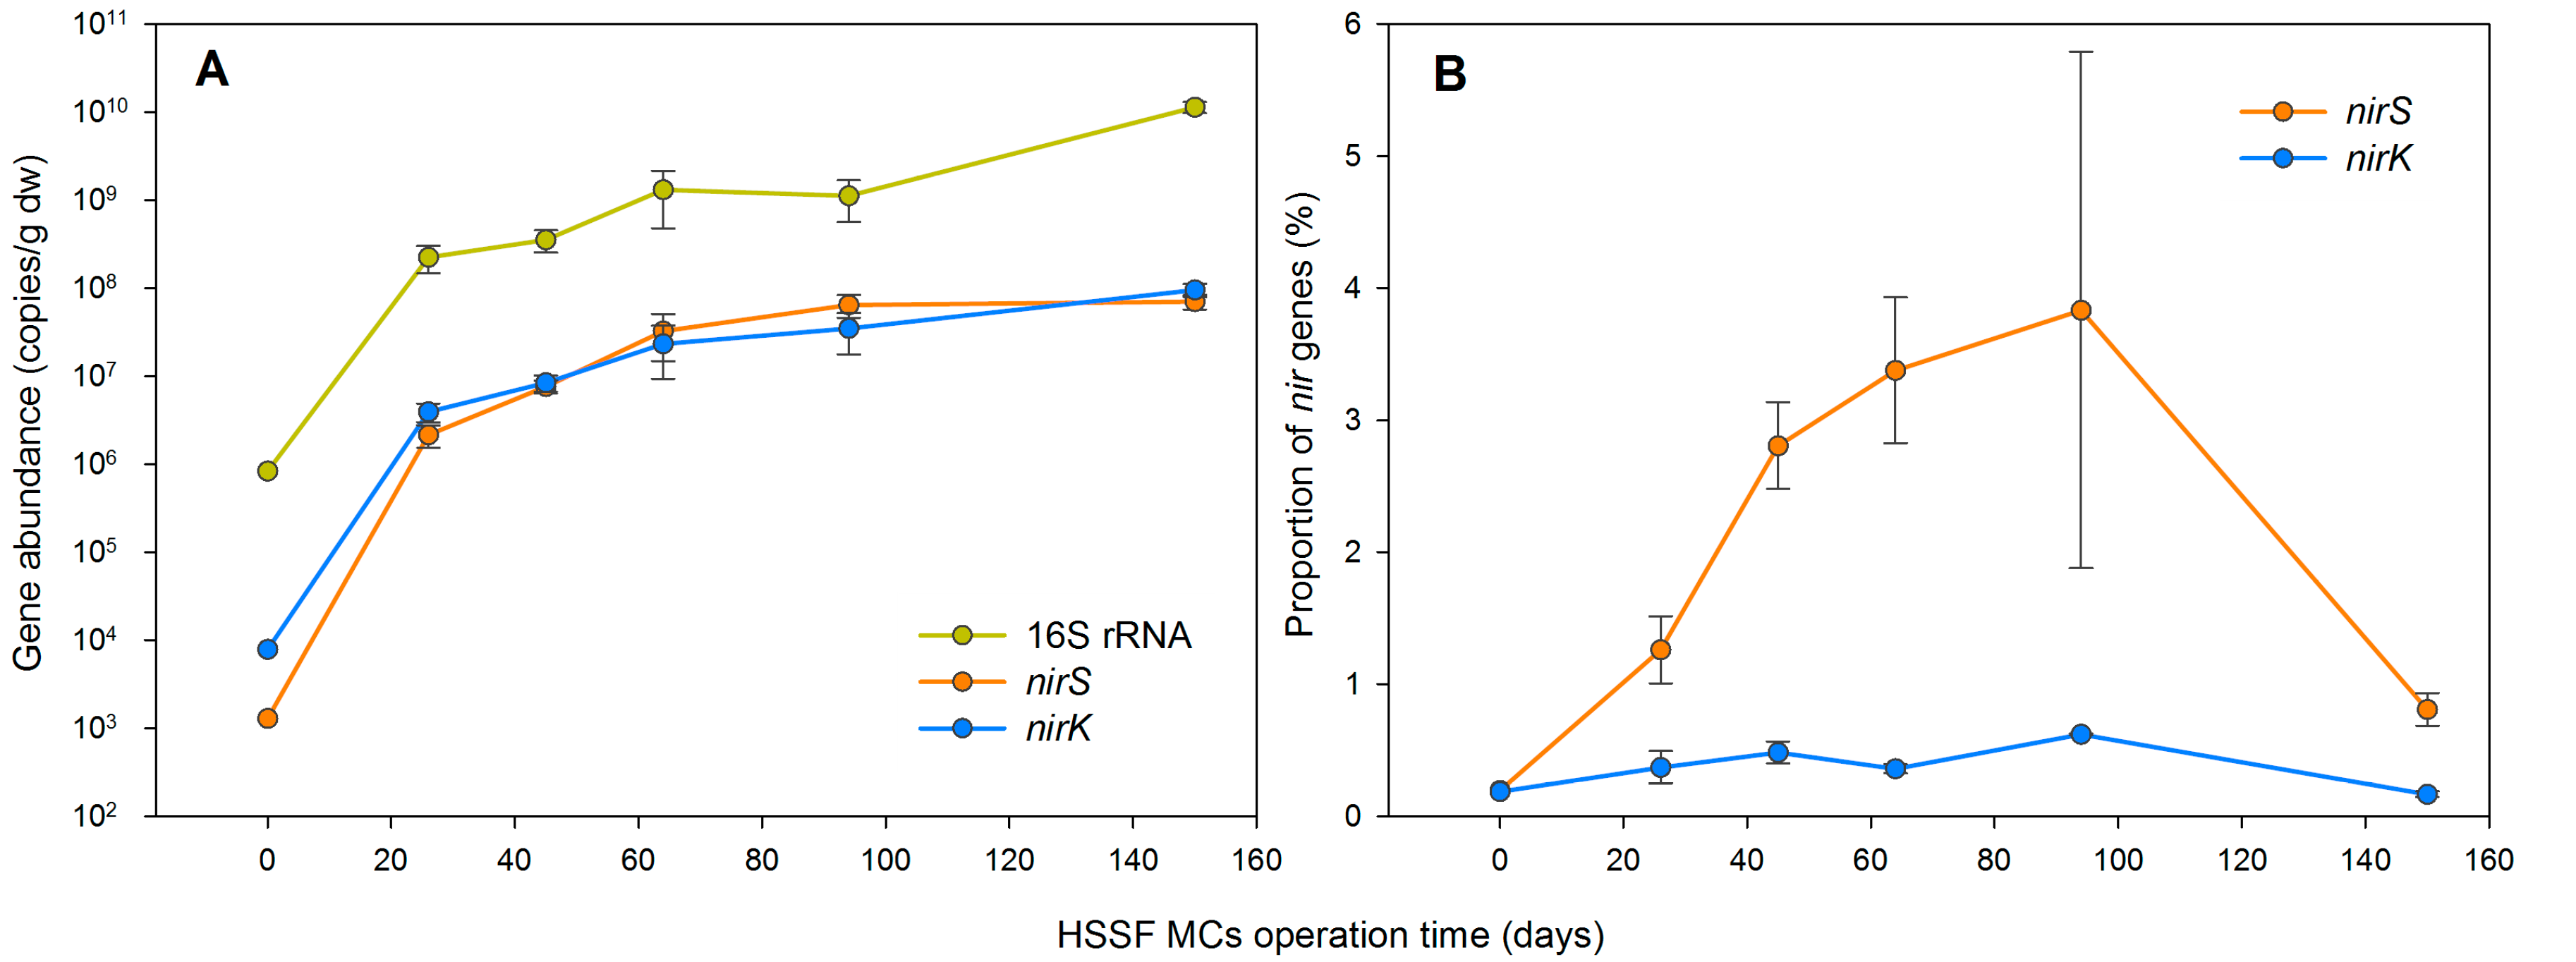
3.1. The Dynamics of Bacterial 16S rRNA Gene Abundance in HSSF MCs during the Study Period

Bacterial 16S rRNA gene abundance ranged between 5.6 × 10⁵ and 8.1 × 10⁷ copies/mL in influent HSSF MCs during the first 94 days of system operation, while a decrease in this gene abundance to 1.0 × 10⁵ copies/mL was recorded on day 150.
Initially, the number of bacterial 16S rRNA genes on LECA was in the range of 106 copies/gdw. In contrast, the developing WMB showed a steady increase in the 16S rRNA gene abundance during the first 94 days of the system operation before the 16S rRNA gene concentration stabilised (Figure 1A). The replicates of MCs differed only slightly by their bacterial 16S rRNA gene abundances during the study period. This difference only increased on the third sampling occasion (coefficient of variation—CV 64%), but was finally reduced to 15% at the last sampling occasion (day 150). Statistical analyses revealed that the bacterial community abundance in WMB was affected by temperature in MCs as well as by influent nitrate concentration (Table A2). The pH value in the MC effluent was correlated negatively to 16S rRNA copy numbers and this relationship is more likely the outcome of the increase of bacterial abundance in the WMB.

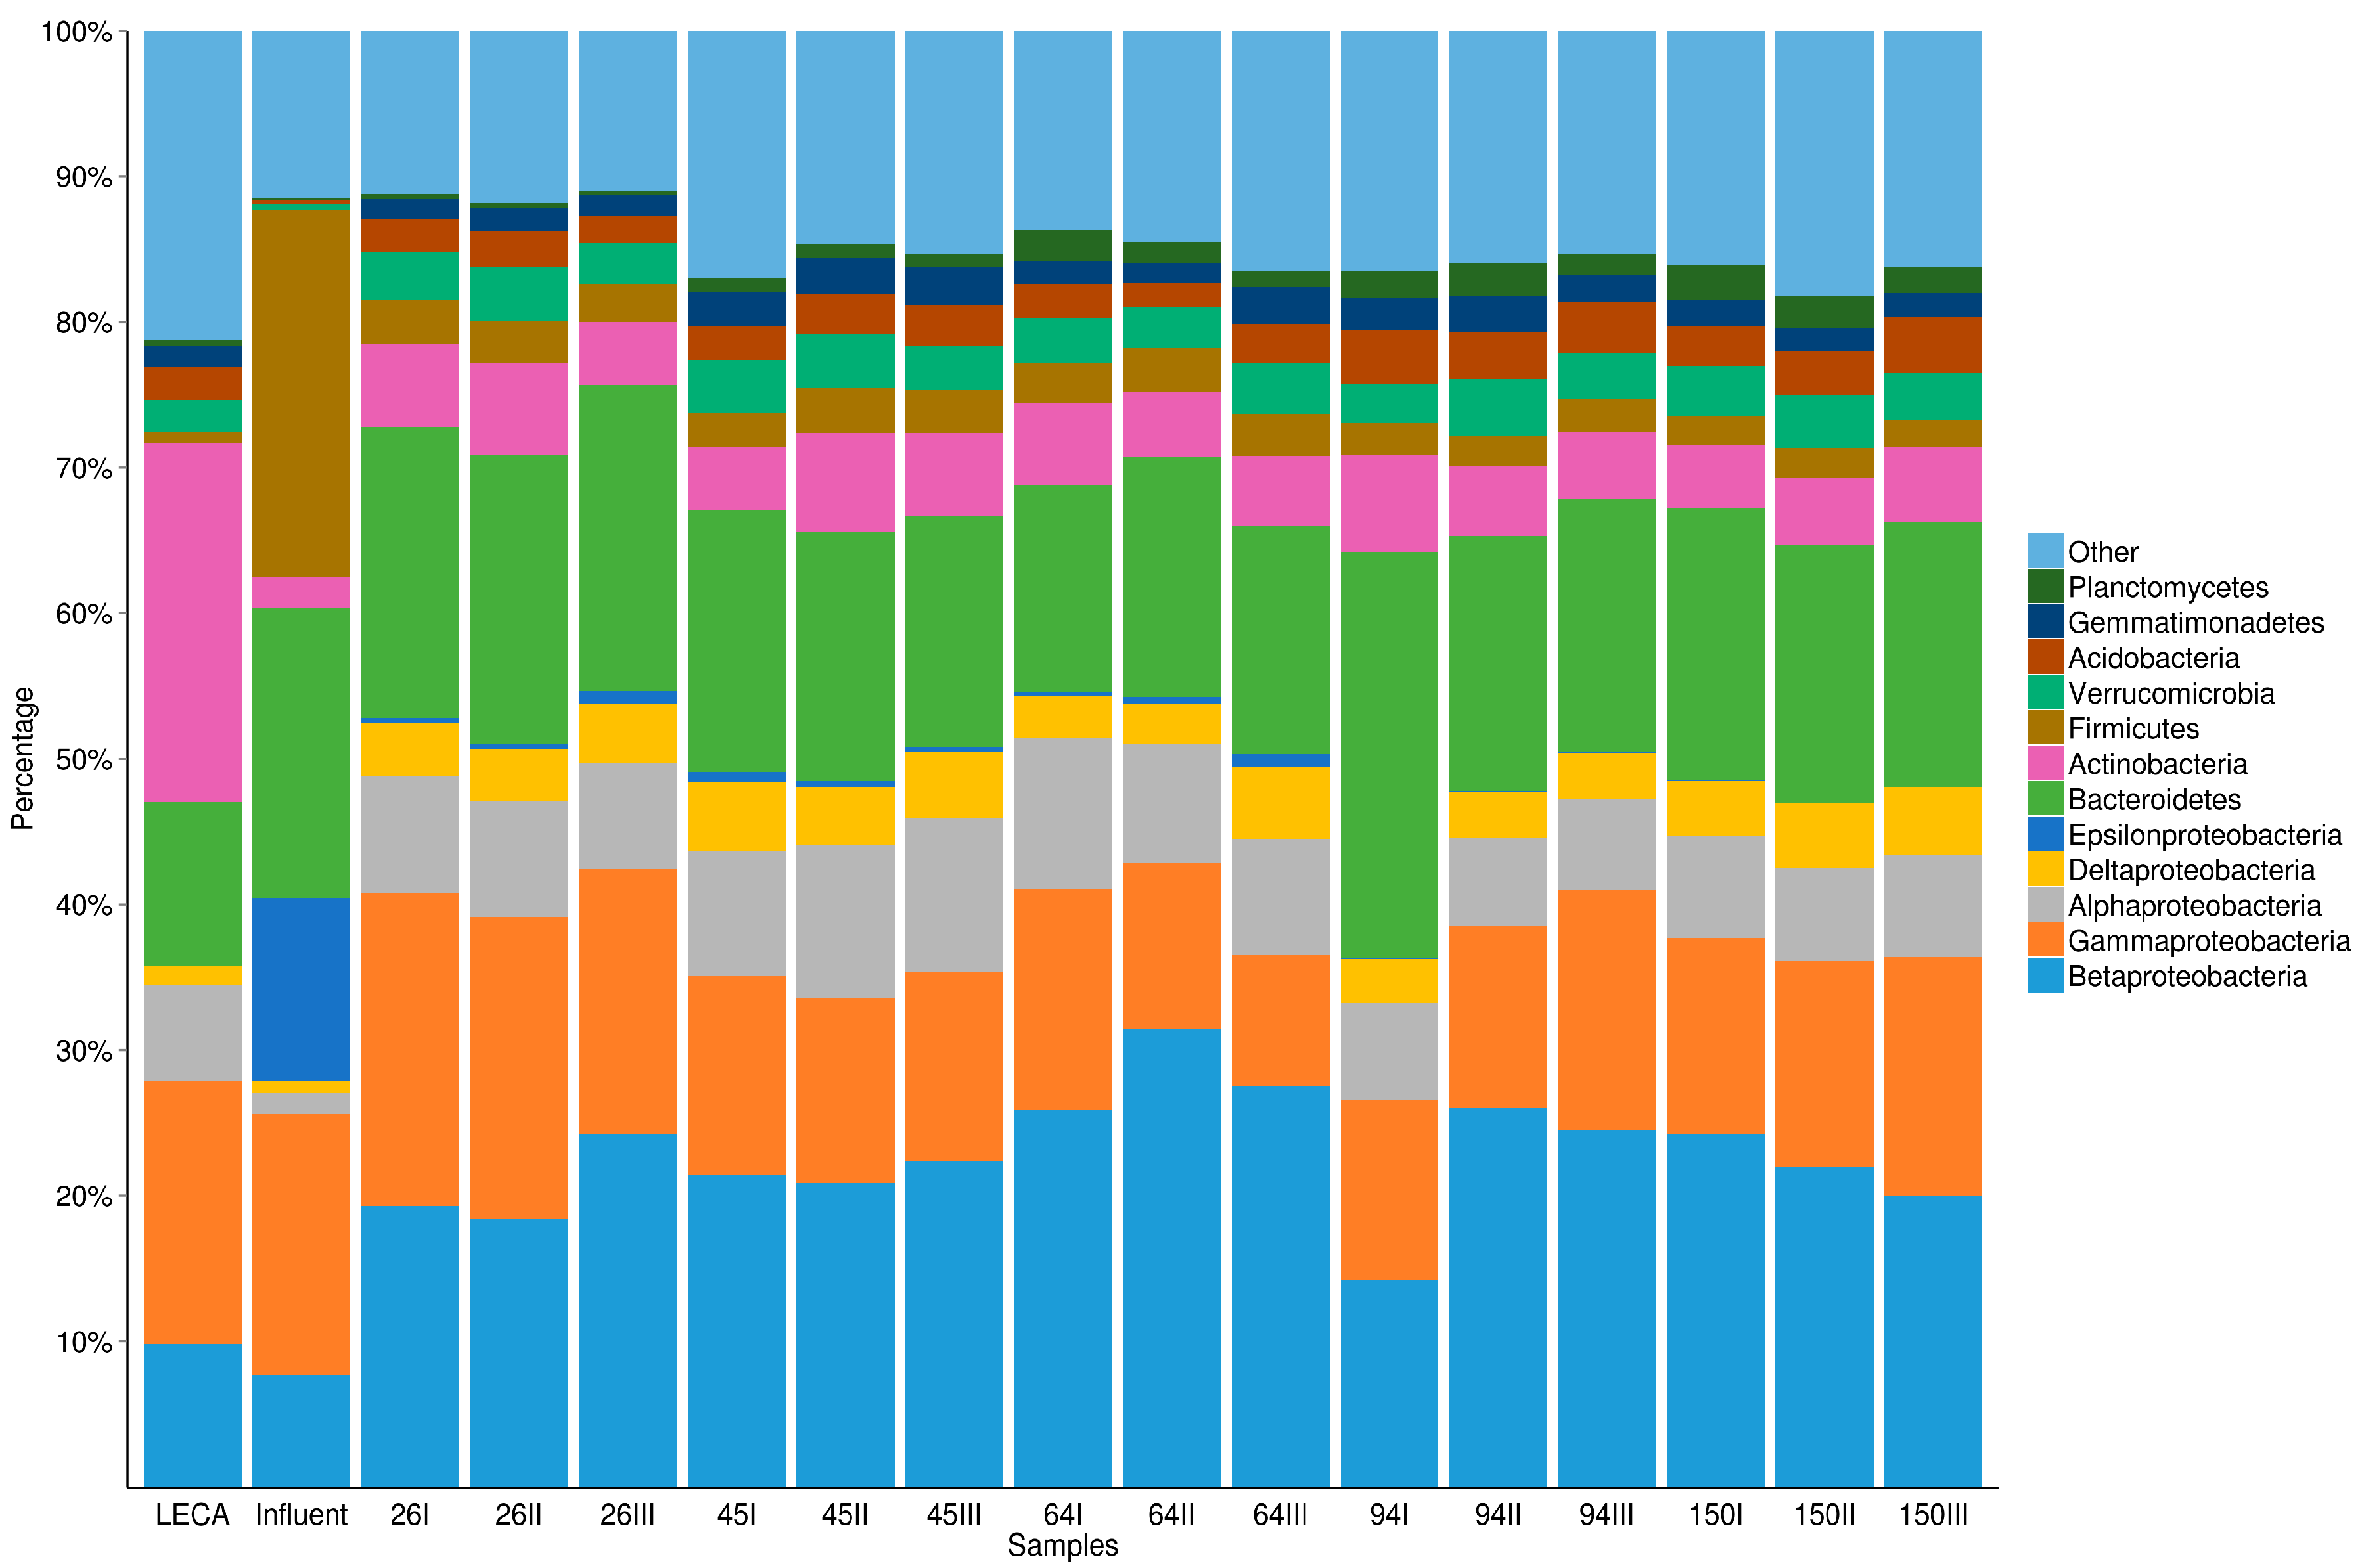
3.2. The Dynamics of Bacterial Community Structure in WMB during the Study Period

After the denoising, normalisation and clustering of sequences at the 95% similarity level, a total of 1032 OTUs were obtained, comprising all samples (986 OTUs when only WMB samples were taken into account). Among the samples, the number of OTUs varied from 630 to 831. The dominant OTUs (containing over 1% of all WMB sample reads) according to the representative sequence taxonomy at phylum and family levels are presented in Table A3.
The structure of the bacterial community of developing WMB during the treatment process differed from the initial community of LECA and from the community entering into the MCs with wastewater (Figure A3, Table A4). Proteobacteria was the most abundant phylum in all samples, accounting for 37%–57% of the total effective sequences, followed by Actinobacteria on LECA (18%), Firmicutes in the influent (25%) and Bacteroidetes in WMB (25%). The dominant phyla differed also by their class proportions and composition in these three system components (Table A4), Betaproteobacteria being the most abundant in WMB and Gammaproteobacteria being the most abundant on LECA and in the influent.
The inverse Simpson’s diversity and evenness indices (Table 2) were based on relative abundance of OTUs to demonstrate the complexity of the bacterial communities in individual samples. The diversity, richness and evenness of LECA and the influent bacterial community were lower when compared to the respective WMB indices. The WMB bacterial community diversity increased up to day 94. The evenness index showed a little variation among MCs replicates and sampling events.
All NRI and NTI indices had statistically significant (p < 0.05) negative values, indicating high overdispersion in communities (Table 2). The NRI values were about 3–4 times lower than values of NTI.
The principal coordinate analysis plot, based on the Bray–Curtis distance matrix, shows that the bacterial community differences between the sampling events were substantially greater than community differences among the MC replicates (Figure 2A). Only the third MC bacterial community structure deviated from the other parallels on day 64, but this difference had decreased by day 94 and was not detectable on day 150. The results of the principal coordinate analysis show a similar bacterial community successional pattern in the MCs with larger changes in community structure until day 94.
After threshold scanning via a random matrix theory-based approach, the phylogenetic molecular ecological network (pMEN) was constructed with a similarity threshold of 0.73 (p = 0.032) including 41 nodes and 113 edges. A simulated annealing approach was applied in order to define submodules within the obtained complex pMEN (modularity 0.352). Five modules consisting of 18, 12, 4, 4, and 3 related members (OTUs) with an average clustering coefficient of 0.230 (±0.029) were revealed by this method (Figure 3). To correlate each submodule to measured environmental parameters, a singular representative abundance profile value, referred to as the module eigengene, was used. The module eigengenes explained 39%–86% of the variations in relative abundances of module member OTUs, indicating that these eigengenes represent the module profiles relatively well. The data analyses showed that the proportion of OTUs belonging to A and D modules increased with the time of system operation, while OTUs from modules B and E had the opposite tendency (Figure A4). Statistical analyses revealed that four of the five obtained modules were significantly related (B and E negatively, A and D positively) to 16S rRNA gene abundance in WMB (Table A5).

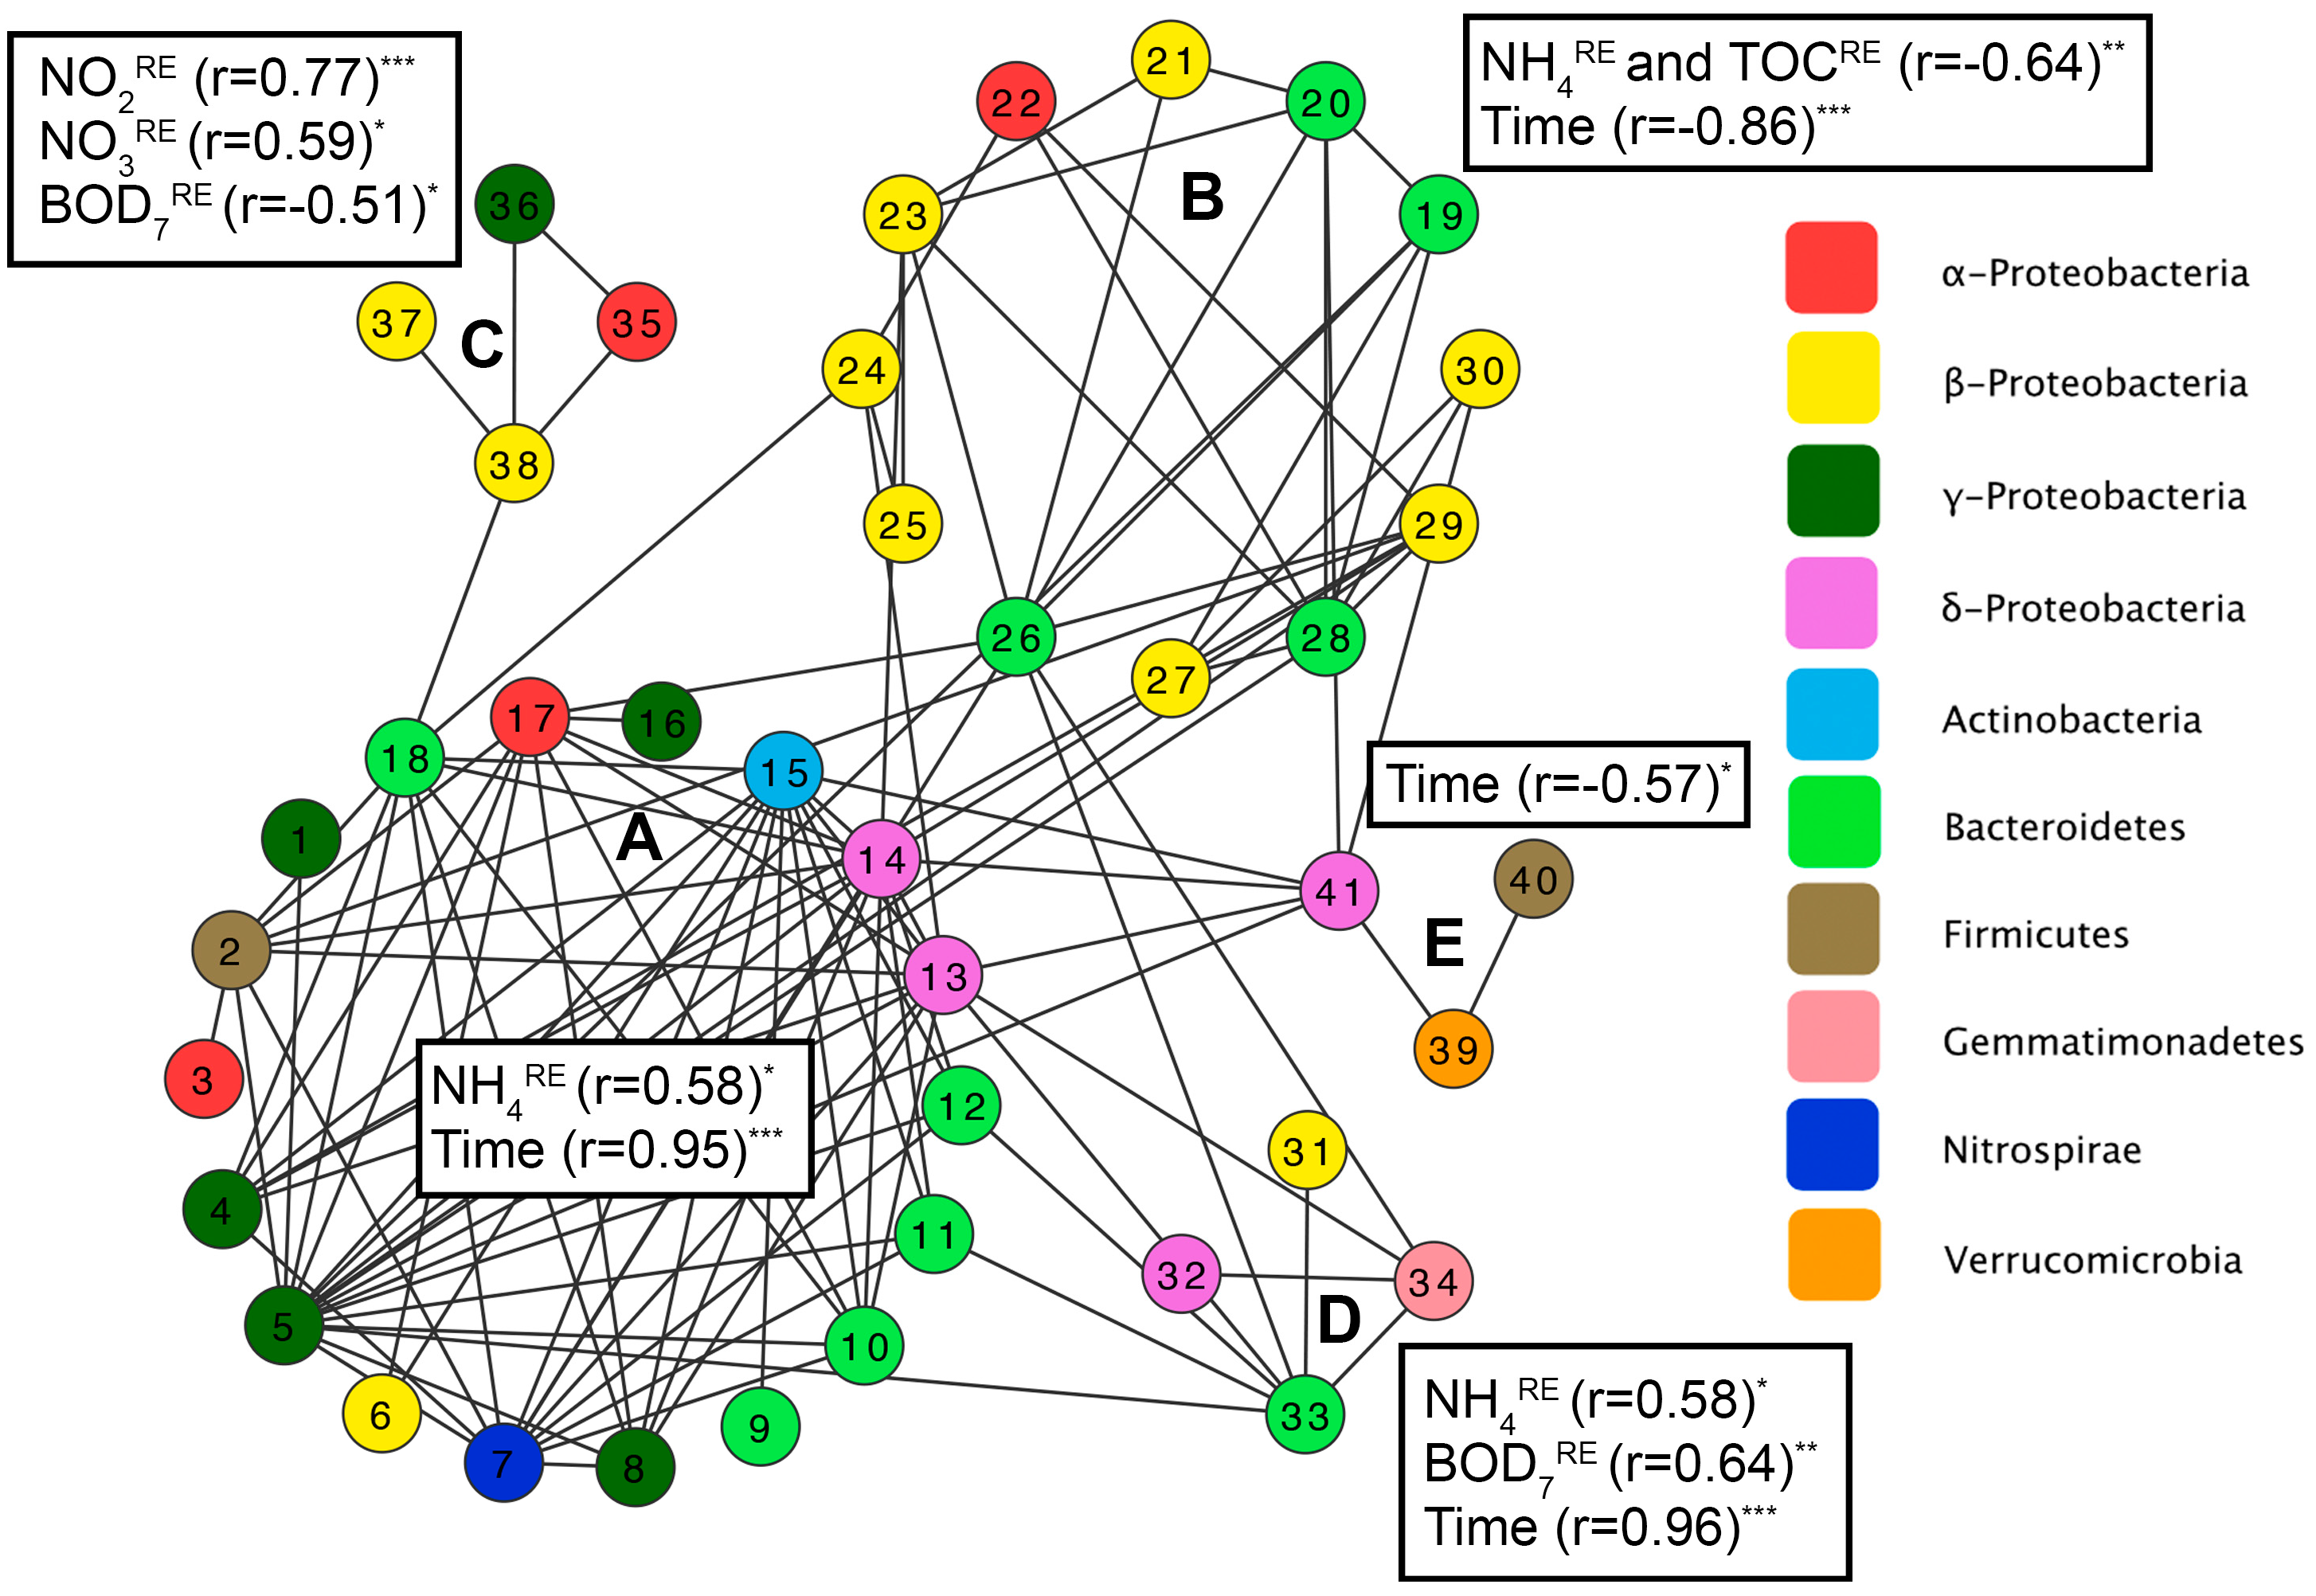
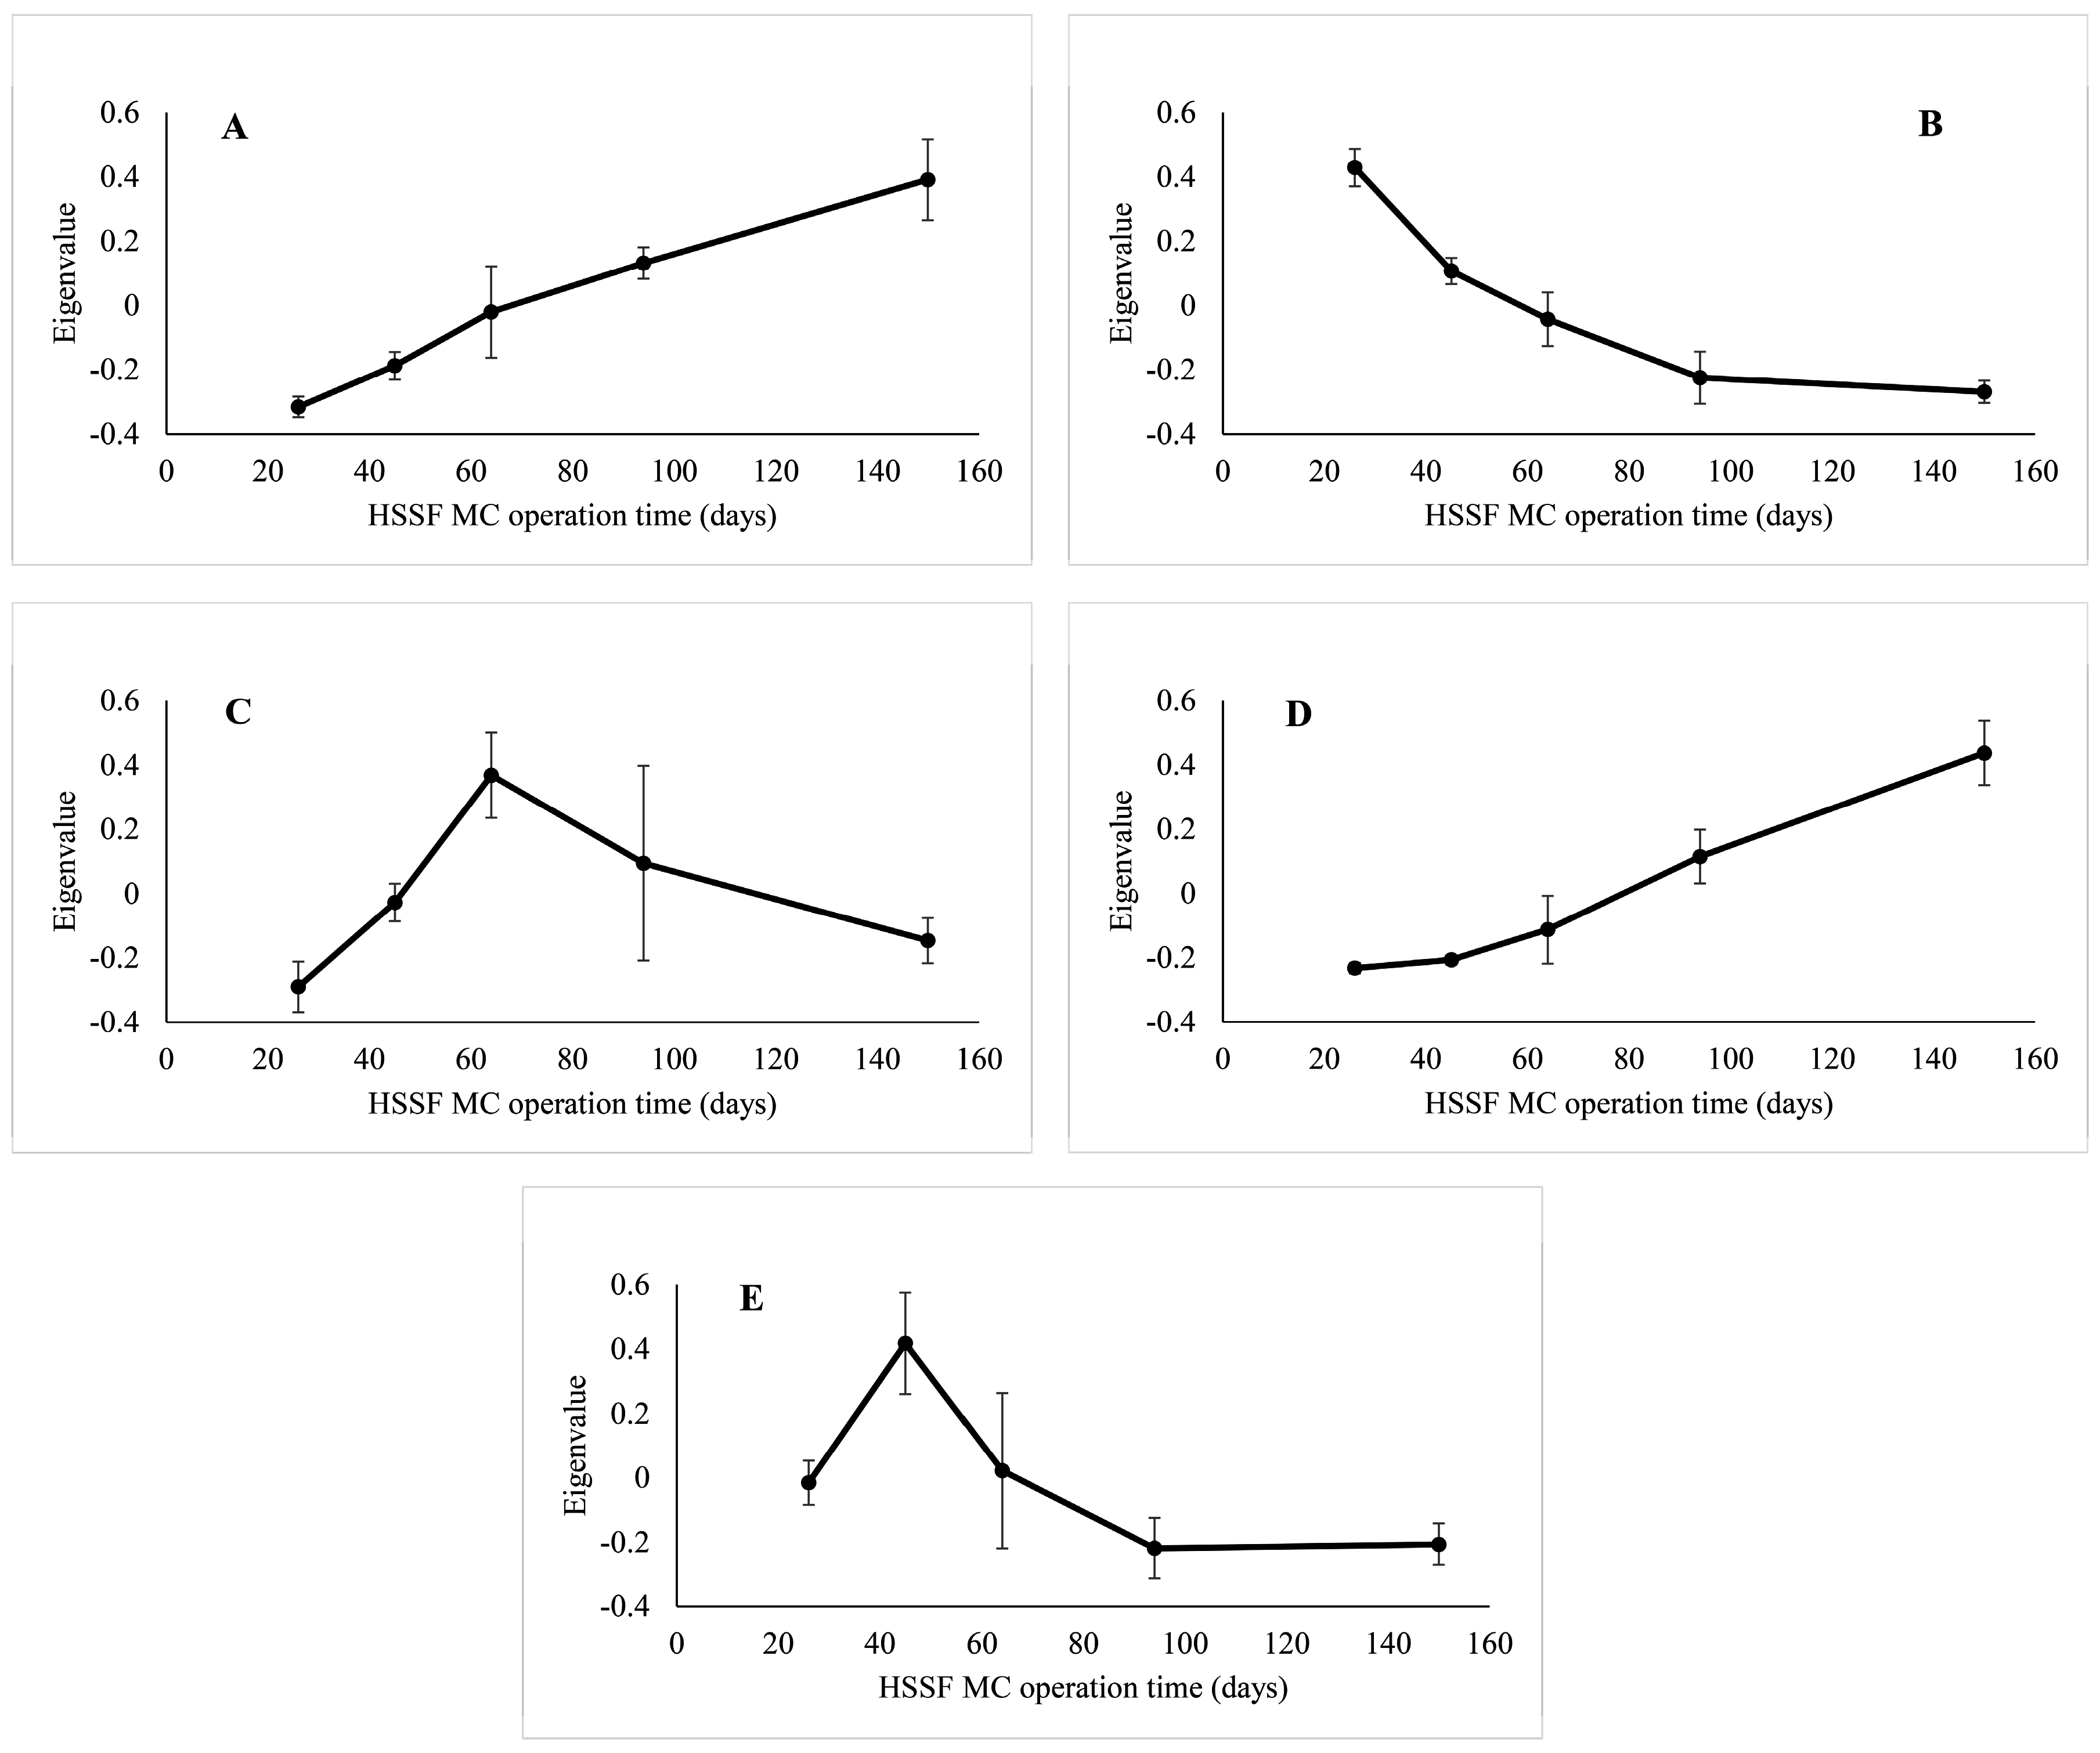
3.3. Factors Affecting Bacterial Community Composition in HSSF MCs

According to the distance-based regression analysis, the system operation time had a statistically significant relationship (R2 = 0.47, p < 0.001) with bacterial community structure in the WMB of HSSF MCs. Influent chemical characteristics such as nitrate (48% variation explained), total nitrogen (14% variation explained) and TOC (9% variation explained) content, and pH (6% variation explained) had a cumulative effect that explained 77% of the variation in temporal dynamics of bacterial community structure. When the system operation time was included in regression analysis as a covariable, the statistically significant relationship of chemical parameters with WMB bacterial composition dynamics remained, but the level of the overall variation explained by those parameters decreased to 30%. The system operation time was positively related to community complexity characteristics: inverse Simpson’s diversity and evenness indices (in both cases r = 0.60, p < 0.05). In addition, the influent nitrate concentration was positively related to these two abovementioned indices (r = 0.68, p > 0.01 and r = 0.67, p < 0.01, respectively) and evenness was related to the total N content in the influent (r = 0.52, p < 0.05).
NTI had no relationship with water chemical parameters or system treatment efficiency. However, NRI was negatively correlated with NH4 and BOD7 removal efficiency (r = −0.55 and r = −0.63, p < 0.05, respectively, Table A2).
In addition, pMEN module eigenvalues were significantly related to all influent nitrogen characteristics values, but the relationships varied in the cases of different modules (Figure 3, Table A5). Module C was related to the highest number of influent quality characteristics including pH and TOC content.

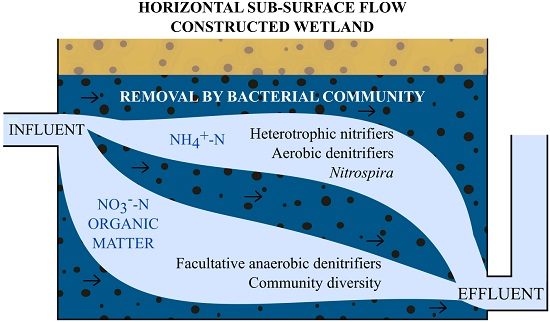
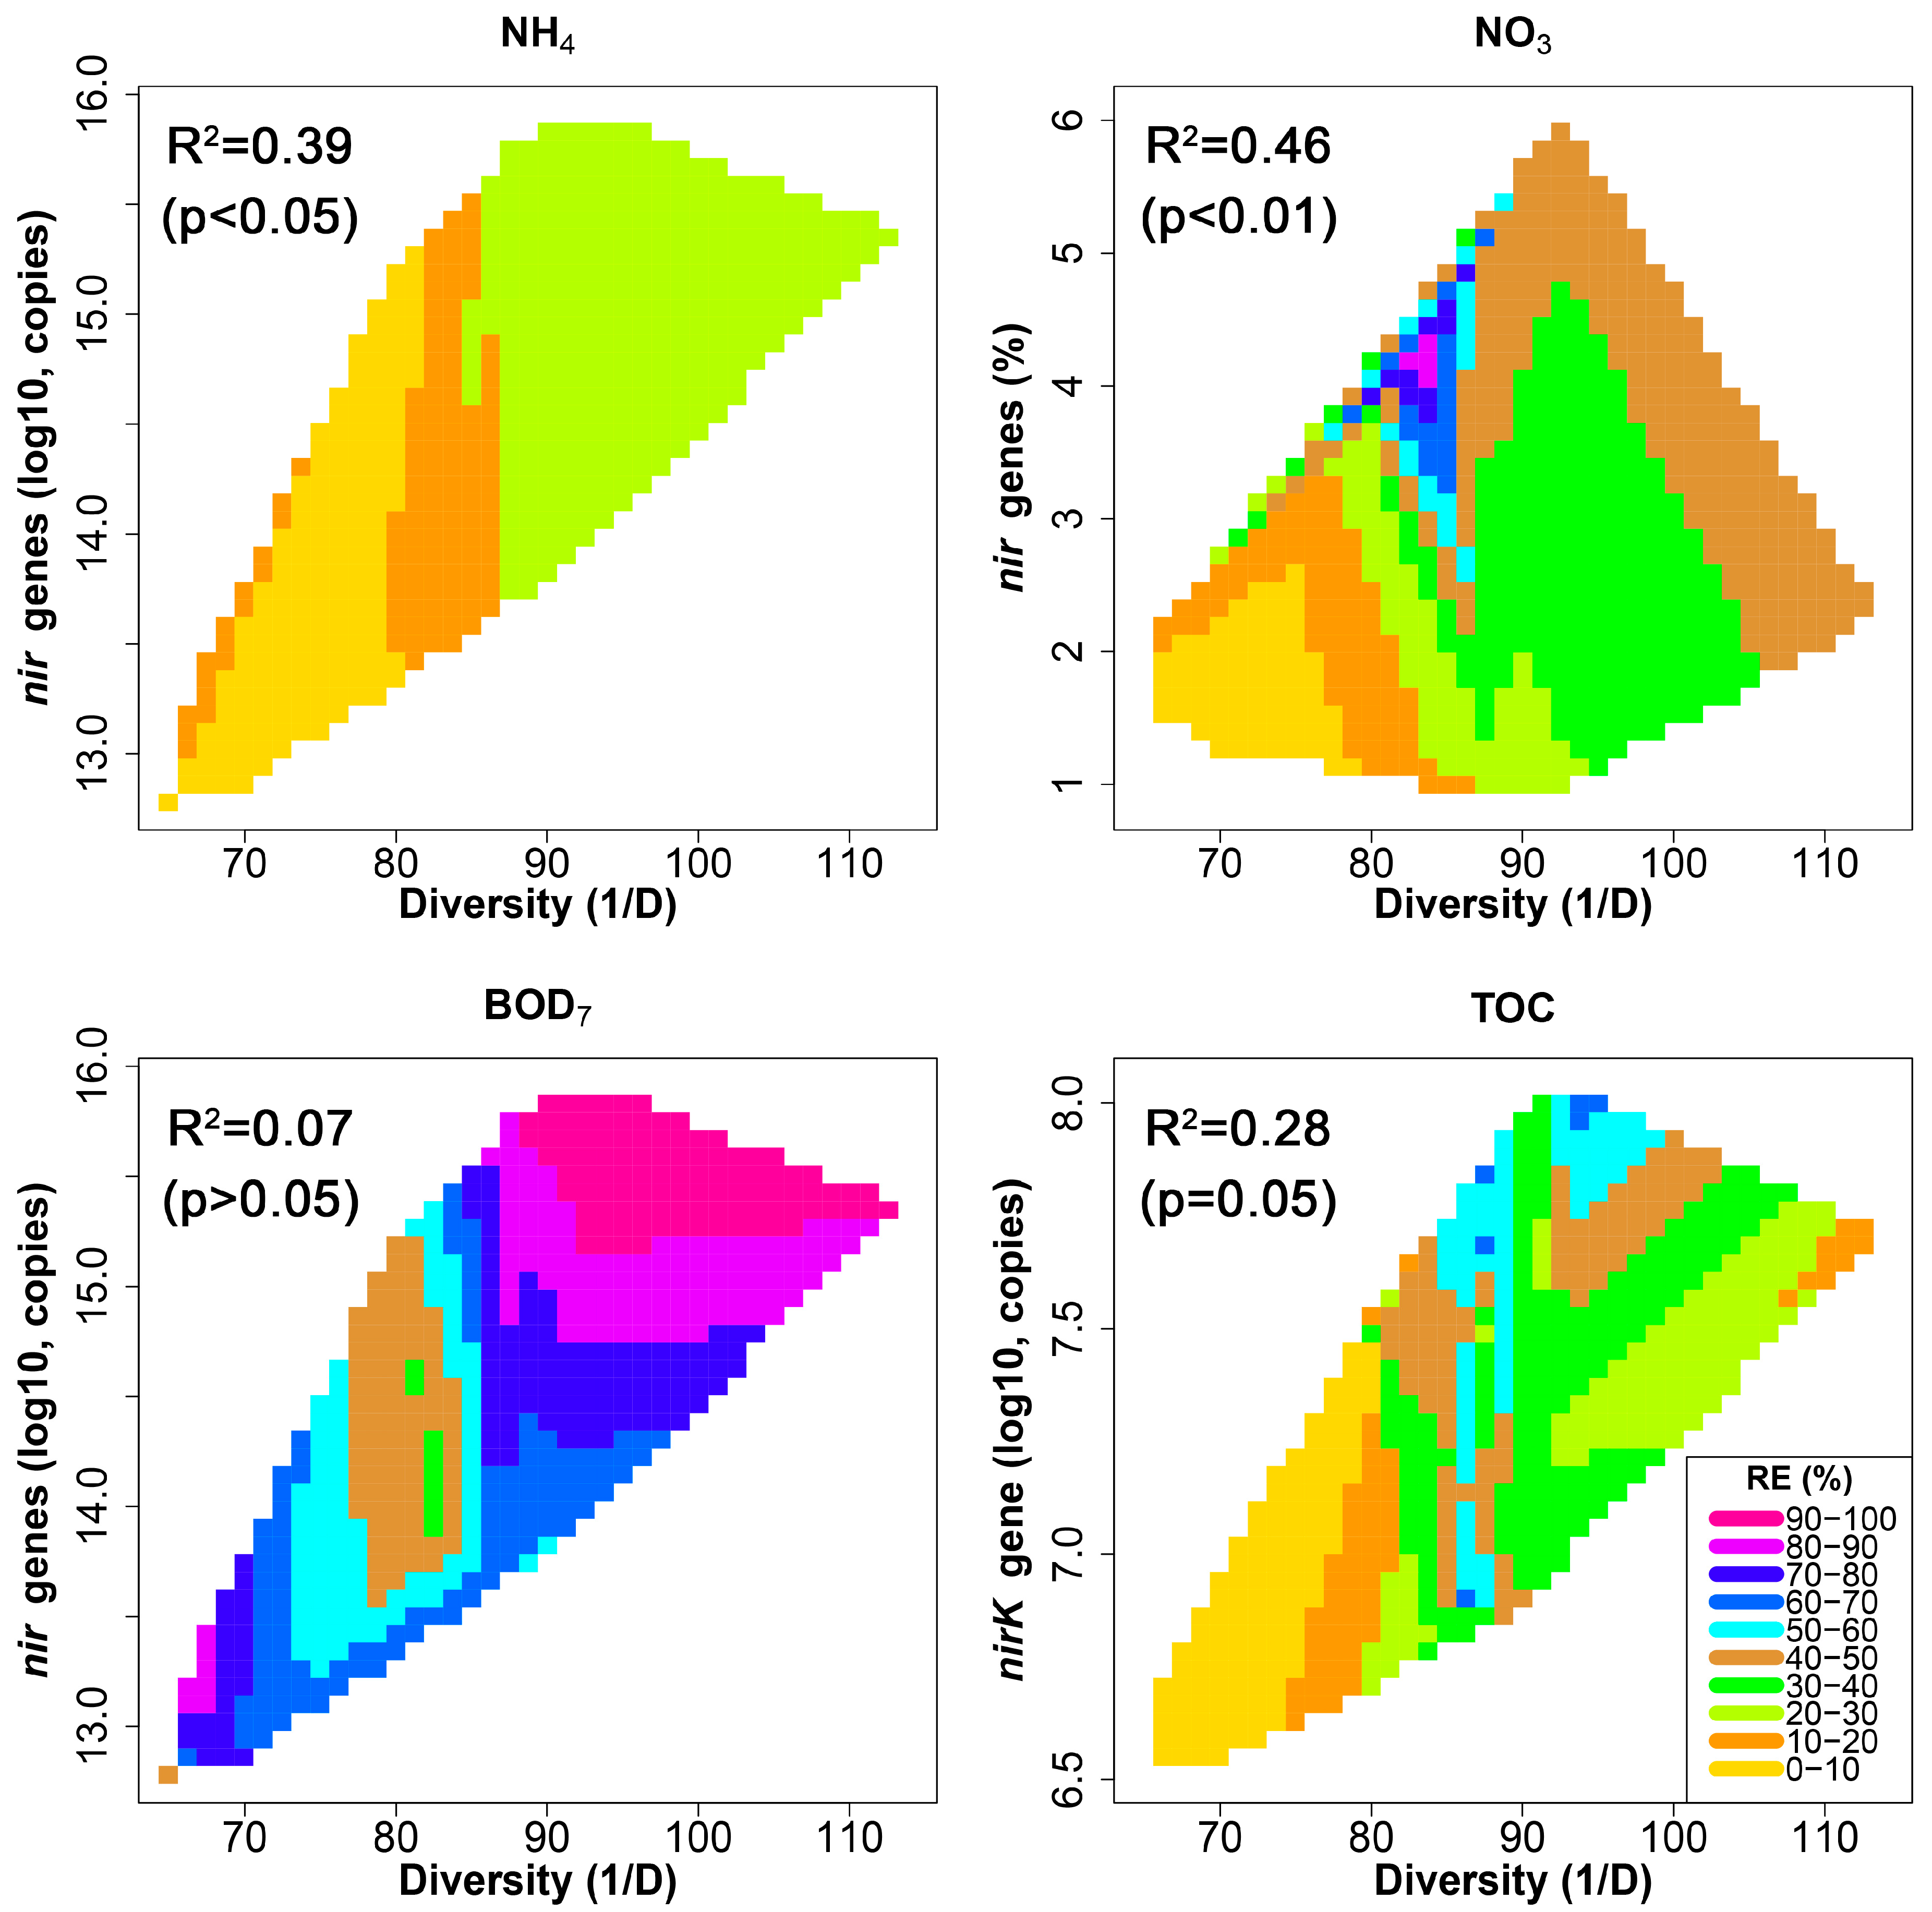
3.4. Denitrification Potential of the HSSF MCs WMB Bacterial Community

The abundance of the nirK and nirS genes in the HSSF MCs influent varied (CV 101% and 99%, respectively). The average abundances of nirK and nirS were 1.0 × 10⁵ and 1.7 × 10⁵ copies/mL, respectively. By day 150, these abundances decreased to 4.0 × 10² copies/mL for nirK while nirS was below the detection limit (<5 × 10² copies/mL). The proportions of nirK and nirS genes in the influent bacterial community were on average 0.24% (CV 177%) and 0.45% (CV 47%), respectively. The ratio nirK/nirS was 0.44 (CV 148%) and the proportion of total nir genes was 0.74% (CV 92%) in the influent bacterial community during the experiment.
In the initial LECA bacterial community, 0.39% of the bacteria contained nir genes (0.19% for nirK and 0.20% for nirS). The dynamics of the abundances of both nir genes in WMB followed the same pattern as the 16S rRNA gene abundance during the experimental period. A remarkable increase in both gene abundances was recorded within the first 26 days of the system operation, followed by a slight increase of nirK gene up to day 150 and a stabilisation of nirS gene after day 94 (Figure 1A). The proportions of the nir genes were calculated according to the formula in Appendix A which takes their different amplification efficiencies into account. Consequently, Figure 1B is a more accurate presentation of the relative abundance of these nir genes. The proportions of the total nir genes increased from 1.63% (CV 23%) in samples from day 26 to 3.74% (CV 15%) during the first 64 days of the system performance, followed by a decrease to 0.98% (CV 10%) in WMB samples at the end of the experiment. On average, the proportion of nirS genes exceeded nirK genes by 6 times (Figure 1B). However, the amplification efficiencies for nirS genes remained quite low despite all optimisation efforts, which may result in somewhat larger variance in calculated gene copy numbers compared to other target genes.
Statistical analyses revealed significant correlations between the abundance of denitrification genes in WMB with system operation parameters and water chemical characteristics (Table A2). The temperature of MCs was related to the abundance of nir genes in a negative way. The abundances of both nir genes had negative relationships with the effluent pH and BOD7, and positive relationships with the influent nitrate concentration and removal efficiencies of ammonia and BOD7. Significant relationships between the nir gene parameters and the bacterial community structure were also found. As shown in the PCoA plot (Figure 2B), the 16S and nir gene abundances were related to axis 1, and the relative abundance of the nirS gene and total denitrifier (nir) proportion in the bacterial community were related to axis 2. Table A5 shows that some of the obtained network modules (A and D) were positively correlated with nirK and nirS abundance and proportion in bacterial community, whereas in the cases of modules B and E the relationships were negative.
The 16S rRNA gene sequence data were screened for the possible presence of ANAMMOX bacteria. Of all the obtained sequences across the samples (in total 12,815 sequences, 63–2515 sequences per sample), 1.14% were identified as representatives of the phylum Planctomycetes and 0.34% of these sequences belonged to the order Brocadiales.

3.5. Relationship between HSSF MC Treatment Efficiency and Bacterial Community Structure

The effluent pH was higher when compared to the influent at the beginning of the experiment, but this difference (ΔpH) decreased with time. Statistically significant Spearman correlations were found between the system operation time and the removal efficiencies of NH4 (r = 0.73, p < 0.01) and organic matter (BOD7RE r = 0.65, p < 0.05 and TOCRE r = 0.52, p < 0.05).
Statistical analyses indicated several significant relationships between the bacterial community and the treatment efficiency of MCs. A positive relationship was found between the 16S rRNA gene abundance and the NH4 removal efficiency (Table A2). Statistically significant strong positive correlations were found between the bacterial community diversity and the efficiencies of ammonia (r = 0.82), BOD7 (r = 0.65), TOC (r = 0.58) and nitrate (r = 0.52) removal.
Bacterial consortia, as identified by the molecular ecological network approach, also had relationships with the treatment efficiency of HSSF MCs. Modules A, B and D were related to NH4 (A and D positively, and B negatively) and module D was related to nitrite and nitrate removal efficiencies from wastewater (Figure 3). Both positive and negative correlations were found between the pMEN modules and the efficiency of organic matter removal. Module B was negatively correlated with TOCRE, module C had a negative relationship and module D a positive relationship with BOD7RE.
Figure 4 demonstrates how the abundance of nir genes and the diversity of bacterial community are related to the removal efficiency of ammonia, nitrate, BOD7, and TOC in the MCs. These two microbial parameters describe well the removal efficiency of the nitrate, ammonia and TOC while removal efficiency of BOD7 is poorly predicted. However, if the module D eigengene values are included in the linear multiple regression model, the variation predicted for BOD7 removal efficiency increases from 6.8% to 41.3%.

4. Discussion

High-throughput sequencing and qPCR were used to characterise bacterial community dynamics in newly established pilot scale hybrid constructed wetland HSSF MCs. In the case of bacterial community studies, 16S rDNA amplicon sequencing can be used only for qualitative purposes. Therefore, in order to reveal bacterial community abundance and its temporal dynamics, estimation of 16S rRNA gene copy numbers using qPCR was applied in this study. The bacterial abundance reached a plateau in a two-month stabilisation period after the treatment system commenced operation. After two months, the observed higher variation of bacterial abundance between the parallel CW units may be explained by occasional clogging of inflow pipes (removed shortly after detection), which caused uneven wastewater distribution between the parallel units. Although the temperature was low in the final sampling event and 16S rRNA gene abundance was drastically decreased in the influent, the total bacterial abundance remained stable in WMB of MCs.
With regard to sequence data set analyses, denoising removed 47% of initial sequences, which is in agreement with other studies applying Illumina sequencing [48,49]. Although short sequence reads, even those as short as 90 bp, have been shown to be long enough to accurately characterise taxa [50,51], a considerable number of reads (28%) remained unclassified in this study. The influent bacterial community had a different taxonomic composition compared to WMB of MCs, containing a large proportion of phylum Firmicutes. This was also found by McLellan et al. [52] in sewage. The taxonomic composition of the bacterial community in WMB was similar to those found in the hybrid system of CWs treating municipal wastewater. The similarity is based on 16S rDNA clone sequencing [53] and phylogenetic analyses of sequenced bands obtained in denaturing gradient gel electrophoresis (DGGE) [54]. In addition, pyrosequence data of activated sludge samples from wastewater treatment plants [24] and sequences from the PhyloChips approach from bioreactors [55] have provided compatible conclusions. The diversity of bacterial community in HSSF WMB was lower than in natural wetlands [56] and activated sludge wastewater treatment plants [23,24]. A higher diversity of the bacterial community in the constructed wetlands systems may have an beneficial influence on the final effluent quality and the treatment system should, therefore, be engineered to contribute heterogeneous environmental conditions in filter media [7,57,58]. Our results also indicate that the diversity of the bacterial community is positively linked to the treatment efficiency of the constructed wetland system.
The results show that the bacterial community in HSSF CW can be described as a complex adaptive system, in which exogenous factors (influent parameters) impact the endogenous dynamics of the community. Negative NRI and NTI values point to an overdispersed phylogeny in WMB, where coexisting bacterial taxa are less related to each other than would be expected by chance. These phylogenetic diversity indices were statistically significant. Thus the assembly of the bacterial community through environmental filtering takes place in a constructed wetland.
Using network analysis, five consortia with various numbers of representatives from different bacterial phyla were revealed in the WMB bacterial community. It is possible that similar temporal patterns of OTUs belonging to bacterial consortia are driven by the same environmental parameters or the members of these consortia perform the same function (i.e., removal of ammonium or organic matter from water). Two of these consortia (modules B and E) were more abundant in the early stages of the system operation, where the bacterial community abundance in WMB was low and nitrate concentration in the inflow was also low. Two other bacterial consortia (modules A and D) became more abundant during the WMB succession with time. In module C, the abundance initially increased, but then continuously decreased. The temporal dynamics of some revealed bacterial consortia were related to water treatment efficiency, indicating that the removal of organic matter and nitrogen in HSSF CW was performed mainly by a small subset of tightly interconnected bacterial species in WMB. For example, in module A, which was positively related to the removal of ammonia, one of the consortium members belonged to the genus Nitrospira, the main nitrite-oxidizer in wastewater treatment plants. Nitrospira species are able to cleave urea to ammonia and CO2 and couple formate oxidation with nitrate reduction to remain active in anoxia [59]. In addition, this module harbours phylotypes from the genera Pseudomonas and Rhodococcus and the order Sphingobacteriales that are known for their ability to perform heterotrophic nitrification under low oxygen concentrations (<0.3 mg O2/L) [60,61]. Many heterotrophic nitrifiers can also perform aerobic denitrification, and the accumulation of nitrite in environment during aerobic denitrification process has been observed [62]. This nitrite may serve as a substrate to Nitrospira species and that may be the reason why this bacterial group is tightly related to heterotrophic nitrifiers in module A.
Data comparison with other studies assessing the microbial community dynamics in HSSF CWs is difficult because there are only few published studies applying high-throughput sequencing for characterisation of temporal dynamics of microbial community in CWs. Ibekwe and co-workers [63] assessed the bacterial community dynamics using pyrosequencing in surface flow CWs but only with three sampling events over time. The other studies on temporal dynamics of microbial communities in HSSF CWs are mostly based on PCR-DGGE ([64], few sampling events over time) and 16S rDNA cloning approach ([65], three sampling events). The temporal aspect has not been taken into account in the data analysis in previous studies.
The denitrification potential of the HSSF WMB was evaluated by the abundance of two types of nir genes: nirK for the Cu-containing nitrite reductase and nirS for the cytochrome cd1 containing nitrite reductase. Although genetically heterogeneous, nirK and nirS are functionally equivalent enzymes as they carry out one of the key steps in denitrification [66]. There is no direct evidence that nirS and nirK can co-occur in the same bacterial cell [67]. The proportion of nir genes in the HSSF WMB bacterial community obtained in this study are in agreement with previous studies that evaluated the proportion of denitrifiers in CWs [20]. The length of time of system operation, influent quality parameters and temperature in MCs influenced the abundance of nirK and nirS genes differently, indicating that the bacterial cells carrying these genes do not depend on the same factors in similar ways. Comparable results have also been reported in other studies [68,69]. The increase of the influent nitrate concentration had a positive effect on the abundance of nir genes. This finding is consistent with that of García-Lledó et al. [70], who found similar results in free water surface CW. Total abundance of nir genes was strongly correlated with nitrite removal efficiency as anticipated, because nitrite is the electron acceptor for nitrite reductase. Less than 1% of the sequences were identified as Brocadiales, which is the only bacterial order currently known to perform the ANAMMOX process. The very low abundance of ANAMMOX bacteria in the WMB indicates that the anaerobic ammonium oxidation process does not contribute to the removal of nitrogen in the system in the present study. The result is in concordance with study by Coban et al. [71], who also found low numbers of ANAMMOX bacteria and no anammox activity in an HSSF CW.
The aim of the application of molecular microbiological methods is firstly to understand how the community structure is related to treatment system properties such as CW media type, inflow properties, and operation conditions. Secondly, the knowledge of the abundance and structure of bacterial community can be used to generate a database that helps predictive analyses to estimate and improve the treatment performance of the CW. The diversity of bacterial community and abundance of denitrifiers well predicted the removal efficiency of ammonia, nitrate and TOC. However, the removal efficiencies of these compounds were dependent on different properties of the denitrifying community. Figure 4 and multiple regression analysis results together exemplify that that we have to use different microbial community parameters in order to predict system treatment efficiency. Ammonia removal was positively related to the total abundance of denitrifiers, whereas nitrate removal was dependent on relative abundance of denitrifying microbes in the community (Figure 4). The greatest nitrate removal occurred when the abundance of the nir genes was in the range 3%–5% and inverted Simpson index values were below 90. TOC removal was tightly linked to abundance of denitrifiers possessing the nirK gene. These results are in concordance with the study by Seshan and co-workers [72] who successfully applied bacterial community diversity indices to predict the removal of COD, ammonia, and nitrate in membrane-operated sequencing batch reactors. The data are consistent with the sequence of nitrification-denitrification as the principal route of nitrogen removal in HSSF CWs [73]. Our results suggest that the dominant nitrogen removal pathway in HSSF CW is via coupled heterotrophic nitrification and denitrification involving mixotrophic nitrite-oxidizers. In addition to their nitrifying capability, heterotrophic nitrifying bacteria can denitrify nitrite or nitrate to molecular nitrogen. As conversion rates of ammonia by heterotrophic nitrifiers are smaller than those of autotrophic nitrifiers, this process is dependent on abundance of heterotrophic nitrifiers. Heterotrophic nitrifiers-denitrifiers possess nir gene-like conventional denitrifiers. Under dynamic or oxygen limiting conditions aerobic denitrification is favored from a bioenergetic perspective [74]. In the studied CW system the nitrogen removal efficiency was lower due to low influent C/N ratio (TOC/TN < 1). High nitrogen removal rate assumes higher TOC/TN ratios (2–4) as shown with the integrated vertical-flow constructed wetland [75]. It is possible that due to low C/N ratio a significant amount of nir genes were not expressed. Denitrifiying bacteria are facultative anaerobic microorganisms which means that depending on the concentration of oxygen they use nitrate as electron acceptor or not but nir genes are anyway present in community.
In the case of BOD7, the highest removal efficiency values occurred when the bacterial community diversity and the abundance of denitrifiers were high (Figure 4). The removal efficiency of BOD7 was best predicted by the abundance of a small set of phylotypes belonging to the network module D (Figure 3). These bacterial phylotypes belonged to genus Gemmatimonas (polyphosphate accumulating microaerophilic species) and to order Burkholderiales and the family Flavobacteriaceae. These results indicate that treatment processes in HSSF CWs are not only dependent on the overall microbial properties such as the community diversity and the abundance of denitrifying microbes but also on specific phylogenetic composition of the bacterial community. Although the diversity of the bacterial community was related to the CW treatment efficiency in the current study, the use of this parameter as a proxy to estimate CW performance between different studies and different types of wetlands should be considered with caution. Bacterial community diversity estimates are relative and always constrained by method of measurement [76]. In the study by Zhang and co-workers [77] the bacterial community diversity in planted HSSF CW correlated strongly with removal of ammonia and nitrate but, in contrary to the current study, this also occurred with the removal efficiency of BOD5. It is clear that more data are needed to understand what mechanisms contribute to microbial community diversity and how this diversity translates into CW operational parameters.
This study was performed in HSSF CW units without vegetation. Plant roots modify their surrounding environment by providing additional organic carbon sources as root exudates and dead fine roots, lowering pH value due to the release of organic acids as well as aerating the wetland media [78]. Vegetation is an important external factor in addition to influent parameters that shape the temporal and spatial patterns of microbial community structures in CW media.
Additional studies are also needed to determine how other factors such as wastewater and substrate types and operational parameters affect dynamics of microbial communities in constructed wetlands. Defining the appropriate time frame for examining microbial succession in CW can be difficult given that changes in community composition may occur over a wide range of time scales. In published CW studies, time course samples have rarely been taken for microbial analyses with monthly or even longer intervals. Spatial variability of microbial community in CWs that may increase with the size and capacity of the treatment system should also be examined in further studies.
The key to achieving high removal efficiency of pollutants in CWs lies in a thorough understanding of the microbial communities that are responsible for aerobic and anaerobic biotransformation, biodegradation, and assimilation activities in wastewater treatment systems. Techniques such as metagenomics (the study of all genes in a microbial community), and metaproteomics (the study of proteins from a microbial community) enable cultivation-independent analyses of whole microbial communities in CW. Integrating metagenomic data of microorganisms with metaproteomic (and if possible also with metatranscriptomic and metabolomic) information will provide an in-depth understanding of microbial processes. Data integration of different omic technologies allows the creation of predictive models, which could help in an improved design and operation of CWs.

5. Conclusions

The results of this study show that the abundance of HSSF WMB bacterial community reached a maximum after two months of system operation and remained stable despite the drop in temperature of the system. A unique bacterial community structure, different from the influent and initial LECA communities, developed in HSSF WMB. In addition to endogenous factors, the bacterial community in wetland biofilms was shaped by influent chemical parameters and was characterised by overdispersed phylogeny. The diversity of the HSSF wetland bacterial community was positively linked to system treatment efficiency. The abundance of denitrifying bacteria in the community promoted nitrate and nitrite removal from water. Network analysis revealed that organic matter and nitrogen removal in HSSF CW was performed by a small subset of tightly interconnected bacterial species. The main nitrogen pathways in HSSF CW are (i) heterotrophic nitrification coupled with aerobic denitrification involving nitrite-oxidizing bacteria in the Nitrospira group that are closely related to heterotrophic nitrifiers, and (ii) anaerobic denitrification leading to gaseous losses of nitrogen by diverse facultative heterotrophs. Anaerobic oxidation of ammonium (ANAMMOX) did not contribute to the nitrogen cycle in this system. The results of this study suggest that HSSF CW should be designed and operated in a way that supports the development of diverse microbial communities with a high abundance of denitrifying microbes.

Acknowledgments

This study was supported by the Estonian Ministry of Education and Research (grant No. IUT2-16) and by the European Regional Development Fund through Centre of Excellence EcolChange. We thank Saale Truu for assistance with computer graphics.

Author Contributions

Marika Truu, Jaak Truu and Ülo Mander conceived and designed the experiments; Kristjan Oopkaup and Hiie Nõlvak performed the experiments; Kristjan Oopkaup, Hiie Nõlvak, Teele Ligi, Marika Truu and Jens-Konrad Preem analysed the data; Ülo Mander contributed reagents/materials/analysis tools; Kristjan Oopkaup, Marika Truu, Jaak Truu and Hiie Nõlvak wrote the paper.

Conflicts of Interest

The authors declare no conflict of interest.

Appendix A. Bacterial Community Structure and Dynamics in Horizontal Subsurface Flow Constructed Wetland Units Treating Municipal Wastewater

Appendix A.1. DNA Extraction, PCR and Sequencing

As recommended by the manufacturer, the extracted DNA was purified with 5 M NaCl and 100% ethanol, and resuspended in 80 μL of 10 mM Tris buffer. Wastewater influent samples were centrifuged for 15 min at 4000 rpm and DNA from the cell pellet was extracted using a PowerSoil DNA Isolation Kit (Mo Bio Laboratories, Carlsbad, CA, USA). The manufacturer’s protocol was modified by replacing 10 min of vortex treatment with homogenisation of the samples using Precellys® 24 (Bertin Instruments, Montigny-le-Bretonneux, France) at 5000 rpm for 20 s.
Horizontal subsurface flow mesocosm (HSSF MC) microbial community profiling was performed using Illumina® HiSeq 2000 sequencing combinatorial sequence-tagged PCR products. Primers L-V6/R-V6 (Table A1) were used to amplify the bacterial specific V6 hypervariable region of the 16S rRNA gene [33]. The PCR reaction mixture for each sample contained unique primer pair combinations differing from each other by 6 bp long barcode sequences at their 5′ end [79]. Barcodes for primers were created with the Barcrawl programme [80] and met the following requirements: (1) they were as short as possible; (2) the possibility of primer-primer annealing and the formation of “hairpin” structures inside the primers was minimized; (3) in order to facilitate the identification process barcodes differed at least by 3 base pairs. Phusion Hot Start High Fidelity Polymerase (Thermo Fisher Scientific, Waltham, MA, USA) reaction mixture was used to carry out PCR reactions according to the manufacturer’s guidelines. The template concentration in reaction mixture was 0.25–2 ng/μL. The following touchdown PCR programme was used: 3 min of denaturation at 98 °C, 6 thermal cycles of denaturation at 98 °C for 5 s, annealing at 62 °C for 30 s with a reduction of 1 °C every cycle, and extension at 72 °C for 10 s followed by 19 cycles of denaturation at 98 °C for 5 s, annealing at 57 °C, and extension at 72 °C for 10 s. The final extension step was performed at 72 °C for 5 min. For each sample three replicates (20 μL of each) were prepared and pooled. The PCR product concentration for each sample was measured in a 2% agarose gel using a MassRulerTM Express DNA Ladder (Thermo Fisher Scientific) and Quantity One software (Bio-Rad Laboratories, Hercules, CA, USA). PCR products of all samples were pooled in equal proportions and the mixture was cleaned and concentrated (4.5 times) with the NucleoSpin® Extract II kit (MACHEREY-NAGEL GmbH & Co. KG, Düren, Germany), and the final concentration of composite PCR product was measured with Bioanalyzer 2100 (Agilent Technologies, Santa Clara, CA, USA). Preparation of the paired-end DNA library was performed using NEXTflexTM PCR-Free DNA Sequencing Kit (BIOO Scientific Corp., Austin, TX, USA).

Appendix A.2. Quantitative PCR

All qPCR amplifications were performed with a RotorGene® Q (QIAGEN, Valencia, CA, USA) in 10 μL of the reaction mixture containing 5 μL of Maxima SYBR Green Master Mix (Thermo Fisher Scientific), 0.4 μM of forward and reverse primer, 1 μL template DNA, and 3.6 μL sterile distilled water. Target genes were quantified using primer pairs and qPCR programmes described in Table 2. All the sample measurements were performed in three and standard curve measurements in four replicates. Three negative controls containing all reaction components, except for template DNA, were run for each qPCR assay. The generated amplicons were controlled by visualization on gel electrophoresis to ensure that the primers did not generate non-specific (not nir genes related) sequences.
The qPCR amplification data were analysed with LinRegPCR programme version 2016.0 [44]. The programme gives amplification efficiency output in the range of 1–2 where 1 corresponds to 0% amplification efficiency and 2 corresponds to 100% amplification efficiency. The recorded amplification efficiencies for 16S rRNA, nirK and nirS in wetland media samples were the following: 1.894 ± 0.034, 1.85 ± 0.043 and 1.476 ± 0.027, respectively, on day 26; 1.811 ± 0.028, 1.814 ± 0.041 and 1.428 ± 0.021 on day 45; 1.733 ± 0.058, 1.814 ± 0.055 and 1.382 ± 0.015 on day 64; 1.816 ± 0.034, 1.764 ± 0.054 and 1.357 ± 0.025 on day 94; and 1.587 ± 0.041, 1.754 ± 0.038 and 1.358 ± 0.016, respectively, on day 150 of the treatment system operation. The 16S rRNA, nirK and nirS amplification efficiencies in influent samples were 1.995 ± 0.032, 1.763 ± 0.049 and 1.341 ± 0.023, respectively. The amplification efficiencies for nirS genes remained quite low despite all optimisation efforts which might result in somewhat larger variance in calculated gene copy numbers compared to other target genes. As systematic differences in amplification efficiencies corresponding to the HSSF MC microbial community successional stages were noted throughout the study, the wetland media samples of each sampling occasion were analysed as separate sample groups. Due to the similarity in amplification efficiencies, the initial wetland media sample was analysed within the day 26 sample group. Since the influent samples did not show such disparity, they were analysed as one sample group.
Functional genes were normalised against bacterial 16S rRNA gene, representing the proportion of nitrite reductases in bacterial communities, by estimation of fold difference (FD) using a formula proposed by Ruijter et al. [44]:
FD = N 0 , A / N 0 , B = ( N t , A / E A C t , A ) / ( N t , B / E B C t , B ) ,
where N0 marks the starting concentration of the amplicons (A and B) in an individual sample in arbitrary fluorescence units, E stands for amplification efficiencies, Nt stands for fluorescence threshold values, and Ct marks the fractional number of cycles needed to reach the fluorescence threshold. The individual nir gene proportions (nirK % and nirS %) were further used to calculate the total proportion of nir genes (nirK % + nirS %) and the ratios of nirK and nirS genes (nirK/nirS) in the bacterial communities of studied influents and HSSF MCs.
In order to negate bias in determined target gene copy numbers deriving from differing amplification efficiencies between standard dilutions (1.873 ± 0.038, 1.734 ± 0.051, and 1.407 ± 0.034 for 16S rRNA, nirK and nirS, respectively) and analysed samples, the following target gene concentration calculation scheme was applied. At first, the target genes were normalised against each 10-fold standard curve dilution in the range of 108–103 copies of target template using the corresponding LinRegPCR N0 values according to the Formula (A1). The obtained ratios (one for each standard dilution) were used to calculate six individual target gene abundances per sample. Finally, the target gene concentration denominator for a sample was calculated as a mean of the obtained six abundance estimates. The target gene copy numbers are presented per gram of dry weight (copies/gdw) of wetland media or per ml of wastewater (copies/mL) for the influent.
Figure A1. System scheme modified from Nurk et al. [30]. Horizontal subsurface flow constructed wetland (HSSF CW) mesocosms used in this study are marked with red colour.
Water 08 00457 g005
Figure A2. Temperature and temporal dynamics of different nitrogen forms in influent.
Water 08 00457 g006
Figure A3. The bacterial community taxonomy of initial light expanded clay aggregates (LECA), influent of HSSF mesocosms (MCs) on day 26 of the experiment, and wetland media biofilm (days 26–150) at phylum level. Proteobacteria is presented at class level. Arabic numerals in symbols indicate days of system operation and Roman numerals indicate parallel mesocosms.
Water 08 00457 g007
Figure A4. The temporal dynamics of eigenvalues for molecular ecological network modules, marked as (A)–(E). Shown are average values of replicate units and standard deviations (n = 3).
Water 08 00457 g008
Table A1. Characteristics of primer sets and amplification programmes used. Standard curve marks the range of standard dilutions (gene copies in 10 μL of reaction mixture) used for creating standard curves.
PrimersTarget GeneAmplicon Size (bp)Primer ReferencePCR Programme for StandardsqPCR ProgrammeStandard Curve
L-V616S rRNA111[33]1 cycle: 95 °C 5 min;
30 cycles: 94 °C 30 s, 54 °C 30 s, 72 °C 45 s
1 cycle: 95 °C 10 min;
40 cycles: 95 °C 15 s; 54 °C 30 s; 72 °C 30 s
Melting curve: 65–90 °C
108–102, 50, 25
R-V6
FlaCunirK473[81]1 cycle: 95 °C 5 min;
10 cycles: 95 °C 30 s, 60 °C 1 min a, 72 °C 1 min;
25 cycles: 95 °C 30 s, 58 °C 1 min, 72 °C 1 min;
1 cycle: 72 °C 5 min
1 cycle: 95 °C 10 min;
6 cycles: 95 °C 15 s, 63 °C 30 s b, 72 °C 30 s, 80 °C 30 sc;
40 cycles: 95 °C 15 s, 61 °C 30 s, 72 °C 30 s, 80 °C 30 s c;
1 cycle: 95 °C 15 s, 60 °C 30 s, 72 °C 10 min
Melting curve: 60–95 °C
108–103
R3Cu
nirSCd3aFnirS425[82]1 cycle: 94 °C 2 min;
7 cycles: 94 °C 30 s, 63 °C 1 min a, 72 °C 1 min;
28 cycles: 94 °C 30 s, 57 °C 1 min, 72 °C 1 min;
1 cycle: 72 °C 10 min
1 cycle: 95 °C 10 min;
6 cycles: 95 °C 15 s, 63 °C 30 s b, 72 °C 30 s, 80 °C 30 s c;
40 cycles: 95 °C 15 s, 58 °C 30 s, 72 °C 30 s, 80 °C 30 s c;
1 cycle: 95 °C 15 s, 60 °C 30 s, 72 °C 10 min
Melting curve: 60–95 °C
108–103
nirSR3cd
Notes: a The annealing temperature drops 0.5 °C after every cycle; b The annealing temperature drops 1 °C after every cycle; c The fluorescence signal was read after the second extension step (30 s of 80 °C).
Table A2. Correlation of target gene abundances and characteristics of HSSF MCs. Statistically significant Spearman’s rank correlation coefficient values between target gene characteristics—concentrations: 16S rRNA, nirK, nirS, nir, and proportions: nirK (%), nirS (%), nir (%) and nirK/nirS, values of the Inverse Simpson’s diversity (1/D), richness (refers to the number of operational taxonomic units or OTUs at the 95% similarity level), evenness, Net Relatedness Index (NRI), and indicator parameter values in influent (in) and effluent (eff), and removal efficiencies (RE) of respective compounds during the treatment process in HSSF MCs, as well as system operation time and temperature (Temp) in MCs. ΔpH indicates pH difference between influent and effluent.
Parameter16S rRNAnirKnirSnirnirK (%)nirS (%)nir (%)nirK/nirS1/DRichnessEvennessNRI
Time0.91 ***0.93 ***0.93 ***0.96 ***----0.77 ***-0.70 **-
Temp−0.76 ***−0.87 ***−0.82 ***−0.87 ***----−0.89 ***-−0.84 ***-
pH in--−0.55 *---------
pH eff−0.77 ***−0.73 **−0.85 ***−0.79 ***----−0.61 *-−0.59 *-
ΔpH−0.68 **−0.67 **−0.63 *−0.68 **----−0.70 **-−0.66 **-
N in----0.61 *0.77 ***0.76 ***−0.56 *-0.61 *--
N RE---------0.86 ***0.54 *-
NO3 in0.91 ***0.93 ***0.93 ***0.96 ***----0.77 ***-0.70 **-
NO3 eff----−0.62 *−0.72 **−0.74 **--−0.81 ***--
NO3 RE-----0.55 *0.57 *-0.52 *0.83 ***0.58 *-
NO2 in-----0.72 **0.69 **-----
NO2 eff-------------
NO2 RE-----0.71 **0.69 **−0.62 * 0.61 *--
NH4 in----0.53 *0.86 ***0.84 ***−0.65 ** ---
NH4 eff-----0.78 ***0.75 **−0.57 * ---
NH4 RE0.63 *0.70 **0.64 *0.72 **----0.82 ***-0.73 **−0.55 *
BOD7 in----0.74 **--- ---
BOD7 eff−0.59 *−0.65 **−0.59 *−0.67 **-0.51 *--−0.67 **-−0.60 *0.63 *
BOD7 RE-0.61 *0.53 *0.61 *-−0.53 *−0.52 *-0.65 **-0.58 *−0.63 *
TOC in----0.77 ***0.87 ***0.86 ***- ---
TOC RE-0.57 *-0.53 *----0.58 *-0.54 *-
Notes: * p < 0.05, ** p < 0.01, *** p < 0.001.
Table A3. The taxonomy of dominant OTUs (>1% of all 368,775 sequences after subsampling) at phylum and family level.
No. of SequencesPhylumFamily
16,642BacteroidetesChitinophagaceae
14,569ProteobacteriaComamonadaceae
8619ProteobacteriaPseudomonadaceae
7851ProteobacteriaRhodocyclaceae
7800ProteobacteriaEnterobacteriaceae
7763ProteobacteriaUnclassified
7000BacteroidetesChitinophagaceae
6751ProteobacteriaBurkholderiaceae
6240ProteobacteriaUnclassified
5846ProteobacteriaXanthomonadaceae
5836ProteobacteriaRhodocyclaceae
5399ProteobacteriaBurkholderiaceae
5373ProteobacteriaComamonadaceae
5321BacteroidetesFlavobacteriaceae
4911ProteobacteriaPseudomonadaceae
4731ProteobacteriaComamonadaceae
4663BacteroidetesFlavobacteriaceae
4371GemmatimonadetesGemmatimonadaceae
4365ProteobacteriaComamonadaceae
3703BacteroidetesChitinophagaceae
Table A4. Proportions of classes of two dominant phyla, Proteobacteria and Bacteroidetes, in wetland media biofilm (WMB), influent and LECA. Standard deviations are given in parenthesis.
TaxonLECAInfluentWMB (n = 15)
Proteobacteria:
Alphaproteobacteria18%4%15% (±3%)
Betaproteobacteria27%19%44% (±7%)
Gammaproteobacteria49%43%29% (±6%)
Deltaproteobacteria4%2%8% (±2%)
Epsilonproteobacteria<1%30%1% (±1%)
unclassified2%3%3% (±1%)
Bacteroidetes:
Sphingobacteria66%5%48% (±4%)
Flavobacteria23%20%31% (±4%)
Bacteroidia4%74%10% (±2%)
unclassified8%1%11% (±4%)
Table A5. Statistically significant (p < 0.05) correlations between pMEN modules (M), evaluated gene characteristics (16S rRNA and nirK gene copy numbers, nirS, nirK, and total nir gene proportions—nirS (%), nirK (%) and nir (%), respectively—and ratio of nirK and nirS genes (nirK/nirS) in filter material microbial community), and influent quality parameters.
M16S rRNAnirKnirSnirS (%)nir (%)nirK/nirSNO2NO3NtotNH4TOCpH
A0.93 ***0.94 ***0.90 ***----0.92 ***----
B−0.79 ***−0.89 ***−0.98 ***----−0.87 ***−0.54 *---
C---0.82 ***0.79 ***−0.8 ***0.77 *** 0.73 ***0.68 ***0.64 **−0.55 *
D0.93 ***0.91 ***0.79 ***----0.95 *** ---
E−0.59 *−0.63 **−0.55 *----−0.61 * --0.63 **
Notes: * p < 0.05, ** p < 0.01, *** p < 0.001.

References

  1. Vymazal, J. Horizontal sub-surface flow and hybrid constructed wetlands systems for wastewater treatment. Ecol. Eng. 2005, 25, 478–490. [Google Scholar] [CrossRef]
  2. Vymazal, J. Constructed Wetlands for Wastewater Treatment. Water 2010, 2, 530–549. [Google Scholar] [CrossRef]
  3. Mantovi, P.; Marmiroli, M.; Maestri, E.; Tagliavini, S.; Piccinini, S.; Marmiroli, N. Application of a horizontal subsurface flow constructed wetland on treatment of dairy parlor wastewater. Bioresour. Technol. 2003, 88, 85–94. [Google Scholar] [CrossRef]
  4. Matamoros, V.; Puigagut, J.; García, J.; Bayona, J.M. Behavior of selected priority organic pollutants in horizontal subsurface flow constructed wetlands: A preliminary screening. Chemosphere 2007, 69, 1374–1380. [Google Scholar] [CrossRef] [PubMed]
  5. Vymazal, J. Long-term performance of constructed wetlands with horizontal sub-surface flow: Ten case studies from the Czech Republic. Ecol. Eng. 2011, 37, 54–63. [Google Scholar] [CrossRef]
  6. Calheiros, C.S.C.; Rangel, A.O.S.S.; Castro, P.M.L. Treatment of industrial wastewater with two-stage constructed wetlands planted with Typha latifolia and Phragmites australis. Bioresour. Technol. 2009, 100, 3205–3213. [Google Scholar] [CrossRef] [PubMed]
  7. Ibekwe, A.M.; Grieve, C.M.; Lyon, S.R. Characterization of microbial communities and composition in constructed dairy wetland wastewater effluent. Appl. Environ. Microbiol. 2003, 69, 5060–5069. [Google Scholar] [CrossRef] [PubMed]
  8. Vymazal, J.; Kröpfelová, L. Removal of nitrogen in constructed wetlands with horizontal sub-surface flow: A review. Wetlands 2009, 29, 1114–1124. [Google Scholar] [CrossRef]
  9. Yalcuk, A.; Ugurlu, A. Comparison of horizontal and vertical constructed wetland systems for landfill leachate treatment. Bioresour. Technol. 2009, 100, 2521–2526. [Google Scholar] [CrossRef] [PubMed]
  10. Kadlec, R.H.; Wallace, S. Treatment Wetlands, 2nd ed.; CRC Press: Boca Raton, FL, USA, 2009. [Google Scholar]
  11. Truu, M.; Juhanson, J.; Truu, J. Microbial biomass, activity and community composition in constructed wetlands. Sci. Total Environ. 2009, 407, 3958–3971. [Google Scholar] [CrossRef] [PubMed]
  12. Faulwetter, J.L.; Gagnon, V.; Sundberg, C.; Chazarenc, F.; Burr, M.D.; Brisson, J.; Camper, A.K.; Stein, O.R. Microbial processes influencing performance of treatment wetlands: A review. Ecol. Eng. 2009, 35, 987–1004. [Google Scholar] [CrossRef]
  13. Van Elsas, J.D.; Boersma, F.G.H. A review of molecular methods to study the microbiota of soil and the mycosphere. Eur. J. Soil Biol. 2011, 47, 77–87. [Google Scholar] [CrossRef]
  14. Rastogi, G.; Sani, R.K. Molecular techniques to assess microbial community structure, function, and dynamics in the environment. In Microbes and Microbial Technology; Ahmad, I., Ahmad, F., Pichtel, J., Eds.; Springer: New York, NY, USA, 2011; pp. 29–57. [Google Scholar]
  15. Mackay, I.M. Real-time PCR in the microbiology laboratory. Clin. Microbiol. Infect. 2004, 10, 190–212. [Google Scholar] [CrossRef] [PubMed]
  16. Peralta, R.M.; Ahn, C.; Gillevet, P.M. Characterization of soil bacterial community structure and physicochemical properties in created and natural wetlands. Sci. Total Environ. 2013, 443, 725–732. [Google Scholar] [CrossRef] [PubMed]
  17. Ansola, G.; Arroyo, P.; Sáenz de Miera, L.E. Characterisation of the soil bacterial community structure and composition of natural and constructed wetlands. Sci. Total Environ. 2014, 473–474, 63–71. [Google Scholar] [CrossRef] [PubMed]
  18. DeJournett, T.D.; Arnold, W.A.; LaPara, T.M. The characterization and quantification of methanotrophic bacterial populations in constructed wetland sediments using PCR targeting 16S rRNA gene fragments. Appl. Soil Ecol. 2007, 35, 648–659. [Google Scholar] [CrossRef]
  19. Song, M.; Shin, S.G.; Hwang, S. Methanogenic population dynamics assessed by real-time quantitative PCR in sludge granule in upflow anaerobic sludge blanket treating swine wastewater. Bioresour. Technol. 2010, 101, S23–S28. [Google Scholar] [CrossRef] [PubMed]
  20. Chon, K.; Chang, J.-S.; Lee, E.; Lee, J.; Ryu, J.; Cho, J. Abundance of denitrifying genes coding for nitrate (narG), nitrite (nirS), and nitrous oxide (nosZ) reductases in estuarine versus wastewater effluent-fed constructed wetlands. Ecol. Eng. 2011, 37, 64–69. [Google Scholar] [CrossRef]
  21. Wang, Q.; Xie, H.; Ngo, H.H.; Guo, W.; Zhang, J.; Liu, C.; Liang, S.; Hu, Z.; Yang, Z.; Zhao, C. Microbial abundance and community in subsurface flow constructed wetland microcosms: Role of plant presence. Environ. Sci. Pollut. Res. 2016, 23, 4036–4045. [Google Scholar] [CrossRef] [PubMed]
  22. Saunders, A.M.; Albertsen, M.; Vollertsen, J.; Nielsen, P.H. The activated sludge ecosystem contains a core community of abundant organisms. ISME J. 2016, 10, 11–20. [Google Scholar] [CrossRef] [PubMed]
  23. Hu, M.; Wang, X.; Wen, X.; Xia, Y. Microbial community structures in different wastewater treatment plants as revealed by 454-pyrosequencing analysis. Bioresour. Technol. 2012, 117, 72–79. [Google Scholar] [CrossRef] [PubMed]
  24. Wang, X.; Hu, M.; Xia, Y.; Wen, X.; Ding, K. Pyrosequencing analysis of bacterial diversity in 14 wastewater treatment systems in china. Appl. Environ. Microbiol. 2012, 78, 7042–7047. [Google Scholar] [CrossRef] [PubMed]
  25. Zhang, T.; Shao, M.-F.; Ye, L. 454 Pyrosequencing reveals bacterial diversity of activated sludge from 14 sewage treatment plants. ISME J. 2012, 6, 1137–1147. [Google Scholar] [CrossRef] [PubMed]
  26. Vanier, S.; Dahab, M. Start-up performance of a subsurface-flow constructed wetland for domestic wastewater treatment. Environ. Technol. 2001, 22, 587–596. [Google Scholar] [CrossRef] [PubMed]
  27. Song, K.; Lee, S.-H.; Kang, H. Denitrification rates and community structure of denitrifying bacteria in newly constructed wetland. Eur. J. Soil Biol. 2011, 47, 24–29. [Google Scholar] [CrossRef]
  28. Ramond, J.-B.; Welz, P.J.; Cowan, D.A.; Burton, S.G. Microbial community structure stability, a key parameter in monitoring the development of constructed wetland mesocosms during start-up. Res. Microbiol. 2012, 163, 28–35. [Google Scholar] [CrossRef] [PubMed]
  29. Weber, K.P.; Legge, R.L. Dynamics in the bacterial community-level physiological profiles and hydrological characteristics of constructed wetland mesocosms during start-up. Ecol. Eng. 2011, 37, 666–677. [Google Scholar] [CrossRef]
  30. Nurk, K.; Zaytsev, I.; Talpsep, I.; Truu, J.; Mander, Ü. Bioaugmentation in a newly established LECA-based horizontal flow soil filter reduces the adaptation period and enhances denitrification. Bioresour. Technol. 2009, 100, 6284–6289. [Google Scholar] [CrossRef] [PubMed]
  31. Zaytsev, I.; Mander, Ü.; Lõhmus, K.; Nurk, K. Enhanced denitrification in a bioaugmented horizontal subsurface flow filter. Ecol. Eng. 2011, 37, 1050–1057. [Google Scholar] [CrossRef]
  32. American Public Health Organisation (APHA). Standard Methods for the Examination of Water and Wastewater, 17th ed.; American Public Health Organisation: Washington, DC, USA, 1998. [Google Scholar]
  33. Hummelen, R.; Fernandes, A.D.; Macklaim, J.M.; Dickson, R.J.; Changalucha, J.; Gloor, G.B.; Reid, G. Deep sequencing of the vaginal microbiota of women with HIV. PLoS ONE 2010, 5, e12078. [Google Scholar] [CrossRef] [PubMed] [Green Version]
  34. Rodrigue, S.; Materna, A.C.; Timberlake, S.C.; Blackburn, M.C.; Malmstrom, R.R.; Alm, E.J.; Chisholm, S.W. Unlocking short read sequencing for metagenomics. PLoS ONE 2010, 5, e11840. [Google Scholar] [CrossRef] [PubMed]
  35. Schloss, P.D.; Westcott, S.L.; Ryabin, T.; Hall, J.R.; Hartmann, M.; Hollister, E.B.; Lesniewski, R.A.; Oakley, B.B.; Parks, D.H.; Robinson, C.J.; et al. Introducing mothur: Open-source, platform-independent, community-supported software for describing and comparing microbial communities. Appl. Environ. Microbiol. 2009, 75, 7537–7541. [Google Scholar] [CrossRef] [PubMed]
  36. Pruesse, E.; Quast, C.; Knittel, K.; Fuchs, B.M.; Ludwig, W.; Peplies, J.; Glöckner, F.O. SILVA: A comprehensive online resource for quality checked and aligned ribosomal RNA sequence data compatible with ARB. Nucleic Acids Res. 2007, 35, 7188–7196. [Google Scholar] [CrossRef] [PubMed]
  37. Werner, J.J.; Koren, O.; Hugenholtz, P.; DeSantis, T.Z.; Walters, W.A.; Caporaso, J.G.; Angenent, L.T.; Knight, R.; Ley, R.E. Impact of training sets on classification of high-throughput bacterial 16s rRNA gene surveys. ISME J. 2012, 6, 94–103. [Google Scholar] [CrossRef] [PubMed]
  38. McDonald, D.; Price, M.N.; Goodrich, J.; Nawrocki, E.P.; DeSantis, T.Z.; Probst, A.; Andersen, G.L.; Knight, R.; Hugenholtz, P. An improved Greengenes taxonomy with explicit ranks for ecological and evolutionary analyses of bacteria and archaea. ISME J. 2012, 6, 610–618. [Google Scholar] [CrossRef] [PubMed]
  39. Hartmann, M.; Howes, C.G.; Abarenkov, K.; Mohn, W.W.; Nilsson, R.H. V-Xtractor: An open-source, high-throughput software tool to identify and extract hypervariable regions of small subunit (16S/18S) ribosomal RNA gene sequences. J. Microbiol. Methods 2010, 83, 250–253. [Google Scholar] [CrossRef] [PubMed]
  40. Hao, X.; Jiang, R.; Chen, T. Clustering 16S rRNA for OTU prediction: A method of unsupervised Bayesian clustering. Bioinformatics 2011, 27, 611–618. [Google Scholar] [CrossRef] [PubMed]
  41. Gobet, A.; Quince, C.; Ramette, A. Multivariate Cutoff Level Analysis (MultiCoLA) of large community data sets. Nucleic Acids Res. 2010, 38, e155. [Google Scholar] [CrossRef] [PubMed]
  42. Edgar, R.C. Search and clustering orders of magnitude faster than BLAST. Bioinformatics 2010, 26, 2460–2461. [Google Scholar] [CrossRef] [PubMed]
  43. Nõlvak, H.; Truu, M.; Truu, J. Evaluation of quantitative real-time PCR workflow modifications on 16S rRNA and tetA gene quantification in environmental samples. Sci. Total Environ. 2012, 426, 351–358. [Google Scholar] [CrossRef] [PubMed]
  44. Ruijter, J.M.; Ramakers, C.; Hoogaars, W.M.H.; Karlen, Y.; Bakker, O.; van den Hoff, M.J.B.; Moorman, A.F.M. Amplification efficiency: linking baseline and bias in the analysis of quantitative PCR data. Nucleic Acids Res. 2009, 37, e45. [Google Scholar] [CrossRef] [PubMed]
  45. McArdle, B.H.; Anderson, M.J. Fitting multivariate models to community data: A comment on distance-based redundancy analysis. Ecology 2001, 82, 290–297. [Google Scholar] [CrossRef]
  46. Deng, Y.; Jiang, Y.; Yang, Y.; He, Z.; Luo, F.; Zhou, J. Molecular ecological network analyses. BMC Bioinform. 2012, 13, 113. [Google Scholar] [CrossRef] [PubMed]
  47. Kembel, S.W.; Cowan, P.D.; Helmus, M.R.; Cornwell, W.K.; Morlon, H.; Ackerly, D.D.; Blomberg, S.P.; Webb, C.O. Picante: R tools for integrating phylogenies and ecology. Bioinformatics 2010, 26, 1463–1464. [Google Scholar] [CrossRef] [PubMed]
  48. Gloor, G.B.; Hummelen, R.; Macklaim, J.M.; Dickson, R.J.; Fernandes, A.D.; MacPhee, R.; Reid, G. Microbiome profiling by Illumina sequencing of combinatorial sequence-tagged PCR products. PLoS ONE 2010, 5, e15406. [Google Scholar] [CrossRef] [PubMed]
  49. Caporaso, J.G.; Lauber, C.L.; Walters, W.A.; Berg-Lyons, D.; Lozupone, C.A.; Turnbaugh, P.J.; Fierer, N.; Knight, R. Global patterns of 16S rRNA diversity at a depth of millions of sequences per sample. Proc. Natl. Acad. Sci. USA 2011, 108, 4516–4522. [Google Scholar] [CrossRef] [PubMed]
  50. Huse, S.M.; Dethlefsen, L.; Huber, J.A.; Mark Welch, D.; Welch, D.M.; Relman, D.A.; Sogin, M.L. Exploring microbial diversity and taxonomy using SSU rRNA hypervariable tag sequencing. PLoS Genet. 2008, 4, e1000255. [Google Scholar] [CrossRef]
  51. Liu, Z.; Lozupone, C.; Hamady, M.; Bushman, F.D.; Knight, R. Short pyrosequencing reads suffice for accurate microbial community analysis. Nucleic Acids Res. 2007, 35, e120. [Google Scholar] [CrossRef] [PubMed]
  52. McLellan, S.L.; Huse, S.M.; Mueller-Spitz, S.R.; Andreishcheva, E.N.; Sogin, M.L. Diversity and population structure of sewage-derived microorganisms in wastewater treatment plant influent. Environ. Microbiol. 2010, 12, 378–392. [Google Scholar] [CrossRef] [PubMed] [Green Version]
  53. Arroyo, P.; Ansola, G.; Blanco, I.; Molleda, P.; de Luis Calabuig, E.; Sáenz de Miera, L.E. Comparative analysis of the composition of bacterial communities from two constructed wetlands for municipal and swine wastewater treatment. J. Water Health 2010, 8, 147–157. [Google Scholar] [CrossRef] [PubMed]
  54. Iasur-Kruh, L.; Hadar, Y.; Milstein, D.; Gasith, A.; Minz, D. Microbial population and activity in wetland microcosms constructed for improving treated municipal wastewater. Microb. Ecol. 2010, 59, 700–709. [Google Scholar] [CrossRef] [PubMed]
  55. Xia, S.; Duan, L.; Song, Y.; Li, J.; Piceno, Y.M.; Andersen, G.L.; Alvarez-Cohen, L.; Moreno-Andrade, I.; Huang, C.-L.; Hermanowicz, S.W. Bacterial community structure in geographically distributed biological wastewater treatment reactors. Environ. Sci. Technol. 2010, 44, 7391–7396. [Google Scholar] [CrossRef] [PubMed]
  56. Wang, Y.; Sheng, H.-F.; He, Y.; Wu, J.-Y.; Jiang, Y.-X.; Tam, N.F.-Y.; Zhou, H.-W. Comparison of the levels of bacterial diversity in freshwater, intertidal wetland, and marine sediments by using millions of Illumina tags. Appl. Environ. Microbiol. 2012, 78, 8264–8271. [Google Scholar] [CrossRef] [PubMed]
  57. Adrados, B.; Sánchez, O.; Arias, C.A.; Becares, E.; Garrido, L.; Mas, J.; Brix, H.; Morató, J. Microbial communities from different types of natural wastewater treatment systems: Vertical and horizontal flow constructed wetlands and biofilters. Water Res. 2014, 55, 304–312. [Google Scholar] [CrossRef] [PubMed] [Green Version]
  58. Calheiros, C.S.C.; Duque, A.F.; Moura, A.; Henriques, I.S.; Correia, A.; Rangel, A.O.S.S.; Castro, P.M.L. Substrate effect on bacterial communities from constructed wetlands planted with Typha latifolia treating industrial wastewater. Ecol. Eng. 2009, 35, 744–753. [Google Scholar] [CrossRef]
  59. Koch, H.; Lücker, S.; Albertsen, M.; Kitzinger, K.; Herbold, C.; Spieck, E.; Nielsen, P.H.; Wagner, M.; Daims, H. Expanded metabolic versatility of ubiquitous nitrite-oxidizing bacteria from the genus Nitrospira. Proc. Natl. Acad. Sci. USA 2015, 112, 11371–11376. [Google Scholar] [CrossRef] [PubMed]
  60. Fitzgerald, C.M.; Camejo, P.; Oshlag, J.Z.; Noguera, D.R. Ammonia-oxidizing microbial communities in reactors with efficient nitrification at low-dissolved oxygen. Water Res. 2015, 70, 38–51. [Google Scholar] [CrossRef] [PubMed]
  61. Li, W. Study on characteristics in the removal process of ammonia nitrogen and nitrate nitrogen by an isolated heterotrophic nitrification-aerobic denitrification strain Rhodococcus sp. J. Environ. Prot. 2013, 4, 74–79. [Google Scholar] [CrossRef]
  62. Sun, Y.; Li, A.; Zhang, X.; Ma, F. Regulation of dissolved oxygen from accumulated nitrite during the heterotrophic nitrification and aerobic denitrification of Pseudomonas stutzeri T13. Appl. Microbiol. Biotechnol. 2015, 99, 3243–3248. [Google Scholar] [CrossRef] [PubMed]
  63. Ibekwe, A.M.; Ma, J.; Murinda, S.; Reddy, G.B. Bacterial community dynamics in surface flow constructed wetlands for the treatment of swine waste. Sci. Total Environ. 2016, 544, 68–76. [Google Scholar] [CrossRef] [PubMed]
  64. Despland, L.M.; Clark, M.W.; Vancov, T.; Aragno, M. Nutrient removal and microbial communities’ development in a young unplanted constructed wetland using BauxsolTM pellets to treat wastewater. Sci. Total Environ. 2014, 484, 167–175. [Google Scholar] [CrossRef] [PubMed]
  65. Bouali, M.; Zrafi, I.; Bakhrouf, A.; Chaussonnerie, S.; Sghir, A. Bacterial structure and spatiotemporal distribution in a horizontal subsurface flow constructed wetland. Appl. Microbiol. Biotechnol. 2014, 98, 3191–3203. [Google Scholar] [CrossRef] [PubMed]
  66. Zumft, W.G. Cell biology and molecular basis of denitrification. Microbiol. Mol. Biol. Rev. 1997, 61, 533–616. [Google Scholar] [PubMed]
  67. Jones, C.M.; Stres, B.; Rosenquist, M.; Hallin, S. Phylogenetic analysis of nitrite, nitric oxide, and nitrous oxide respiratory enzymes reveal a complex evolutionary history for denitrification. Mol. Biol. Evol. 2008, 25, 1955–1966. [Google Scholar] [CrossRef] [PubMed]
  68. Correa-Galeote, D.; Marco, D.E.; Tortosa, G.; Bru, D.; Philippot, L.; Bedmar, E.J. Spatial distribution of N-cycling microbial communities showed complex patterns in constructed wetland sediments. FEMS Microbiol. Ecol. 2013, 83, 340–351. [Google Scholar] [CrossRef] [PubMed]
  69. Jones, C.M.; Hallin, S. Ecological and evolutionary factors underlying global and local assembly of denitrifier communities. ISME J. 2010, 4, 633–641. [Google Scholar] [CrossRef] [PubMed]
  70. García-Lledó, A.; Vilar-Sanz, A.; Trias, R.; Hallin, S.; Bañeras, L. Genetic potential for N2O emissions from the sediment of a free water surface constructed wetland. Water Res. 2011, 45, 5621–5632. [Google Scholar] [CrossRef] [PubMed]
  71. Coban, O.; Kuschk, P.; Kappelmeyer, U.; Spott, O.; Martienssen, M.; Jetten, M.S.M.; Knoeller, K. Nitrogen transforming community in a horizontal subsurface-flow constructed wetland. Water Res. 2015, 74, 203–212. [Google Scholar] [CrossRef] [PubMed]
  72. Seshan, H.; Goyal, M.K.; Falk, M.W.; Wuertz, S. Support vector regression model of wastewater bioreactor performance using microbial community diversity indices: Effect of stress and bioaugmentation. Water Res. 2014, 53, 282–296. [Google Scholar] [PubMed]
  73. Paranychianakis, N.V.; Tsiknia, M.; Kalogerakis, N. Pathways regulating the removal of nitrogen in planted and unplanted subsurface flow constructed wetlands. Water Res. 2016, 102, 321–329. [Google Scholar] [PubMed]
  74. Chen, J.; Strous, M. Denitrification and aerobic respiration, hybrid electron transport chains and co-evolution. Biochim. Biophys. Acta 2013, 1827, 136–144. [Google Scholar] [CrossRef] [PubMed]
  75. Fu, G.; Yu, T.; Ning, K.; Guo, Z.; Wong, M.H. Effects of nitrogen removal microbes and partial nitrification-denitrification in the integrated vertical-flow constructed wetland. Ecol. Eng. 2016, 95, 83–89. [Google Scholar] [CrossRef]
  76. Shade, A. Diversity is the question, not the answer. ISME J. 2016, 4, e2287v1. [Google Scholar] [CrossRef] [PubMed]
  77. Zhang, Y.; Carvalho, P.N.; Lv, T.; Arias, C.; Brix, H.; Chen, Z. Microbial density and diversity in constructed wetland systems and the relation to pollutant removal efficiency. Water Sci. Technol. 2016, 73, 679–686. [Google Scholar] [CrossRef] [PubMed]
  78. Truu, J.; Truu, M.; Espenberg, M.; Nõlvak, H.; Juhanson, J. Phytoremediation and plant-assisted bioremediation in soil and treatment wetlands: A review. Open Biotechnol. J. 2015, 9, 85–92. [Google Scholar] [CrossRef]
  79. Parameswaran, P.; Jalili, R.; Tao, L.; Shokralla, S.; Gharizadeh, B.; Ronaghi, M.; Fire, A.Z. A pyrosequencing-tailored nucleotide barcode design unveils opportunities for large-scale sample multiplexing. Nucleic Acids Res. 2007, 35, e130. [Google Scholar] [CrossRef] [PubMed]
  80. Frank, D.N. BARCRAWL and BARTAB: Software tools for the design and implementation of barcoded primers for highly multiplexed DNA sequencing. BMC Bioinform. 2009, 10, 362. [Google Scholar] [CrossRef] [PubMed]
  81. Hallin, S.; Lindgren, P.-E. PCR detection of genes encoding nitrite reductase in denitrifying bacteria. Appl. Environ. Microbiol. 1999, 65, 1652–1657. [Google Scholar] [PubMed]
  82. Kandeler, E.; Deiglmayr, K.; Tscherko, D.; Bru, D.; Philippot, L. Abundance of narG, nirS, nirK, and nosZ genes of denitrifying bacteria during primary successions of a glacier foreland. Appl. Environ. Microbiol. 2006, 72, 5957–5962. [Google Scholar] [CrossRef] [PubMed]
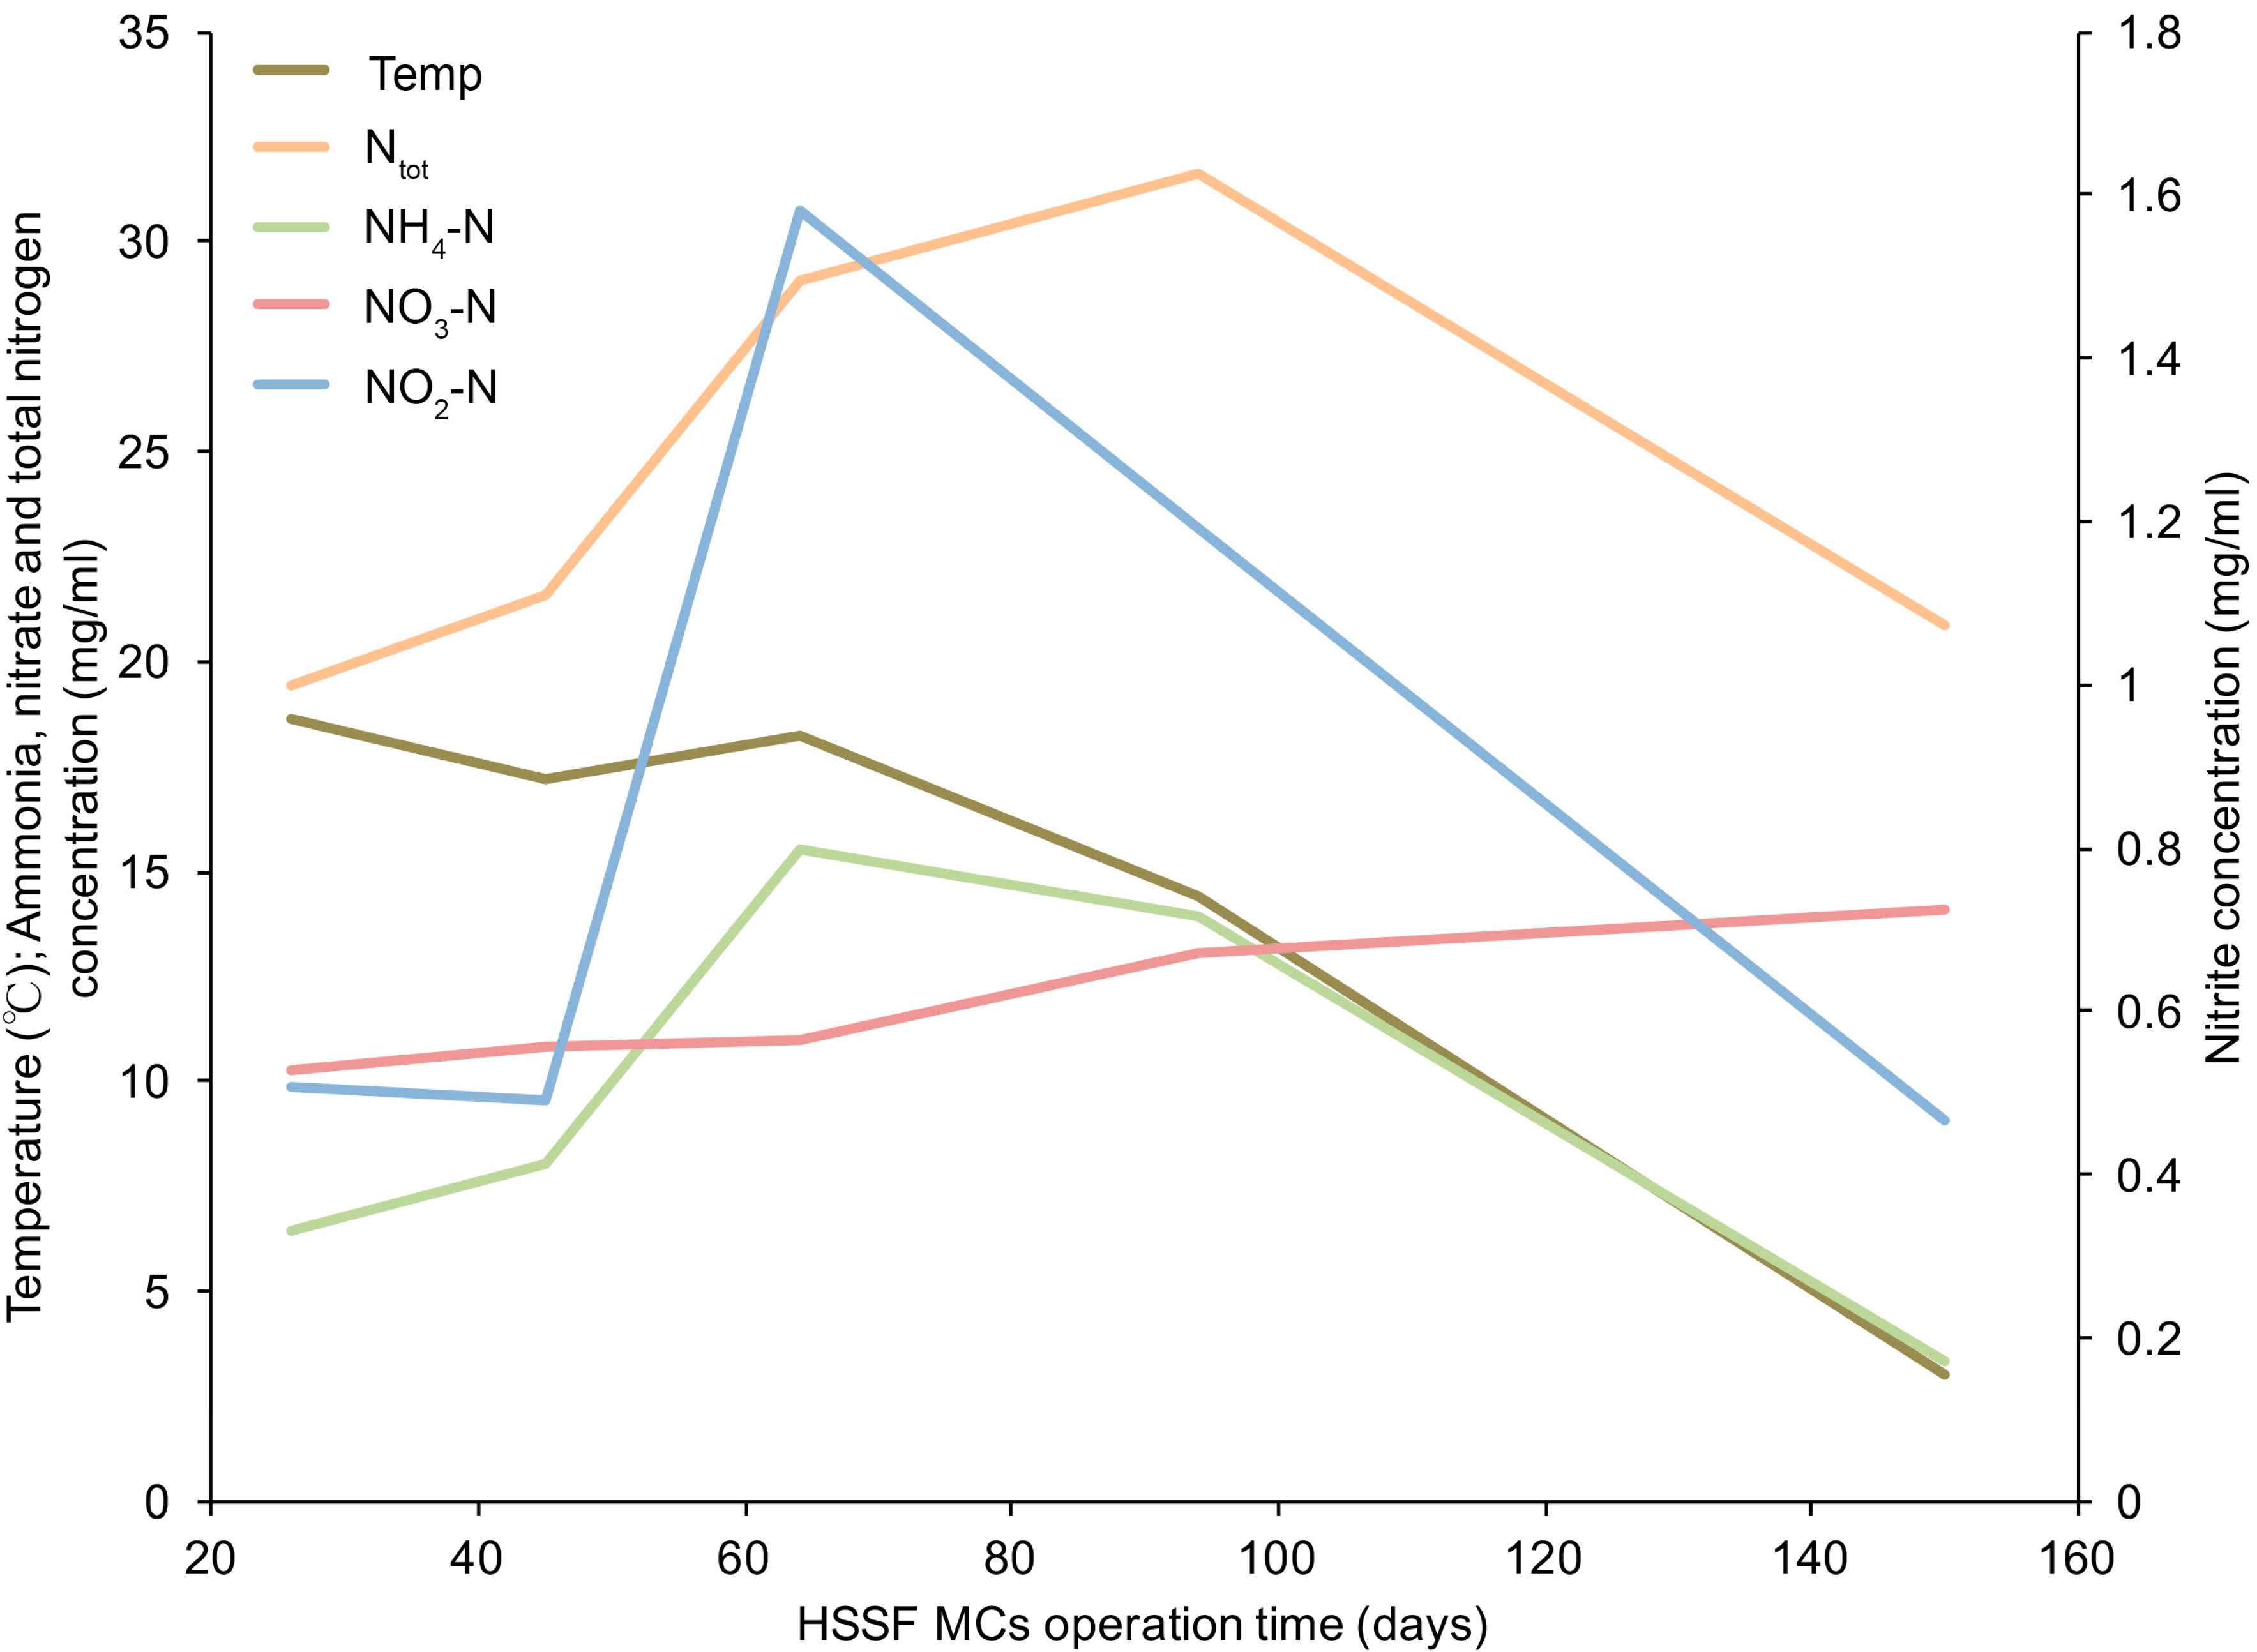
Figure 1. Dynamics of (A) bacterial 16S rRNA, nirK and nirS gene abundances; and (B) proportions of nirS and nirK genes in the HSSF wetland media biofilm (WMB) bacterial community. Shown are average values and standard deviation (n = 3).
Water 08 00457 g001
Figure 2. Principal coordinate analysis (A) based on Bray-Curtis distance matrix of 15 WMB samples, where lines connect samples from the same mesocosms, Arabic numerals in symbols indicate days of system operation and Roman numerals indicate parallel mesocosms; and (B) correlation of principal coordinates axes with 16S rRNA, nirK and nirS gene abundance and proportion values.
Water 08 00457 g002
Figure 3. Molecular ecological network with module structure obtained by the simulated annealing approach. The phylogenetic affiliation of each node (OTU) is given on the level that was above the threshold (0.6) value. Phylogenetic affiliation of nodes: 1,8—Pseudomonas; 2—Planococaceae; 3—Brevundimonas; 4,5,16,36—Gammaproteobacteria; 6,30,37,38—Betaproteobacteria; 7—Nitrospira; 9,33—Flavobacteriaceae; 10—Bacteroides; 11,12,18,19,20,28—Sphingobacteriales; 13,32—Deltaproteobacteria; 14—Bacteriovoracaceae; 15—Acidimicrobiales; 17—Rhodobacteraceae; 21,29—Rhodocyclaceae; 22,35—Alphaproteobacteria; 23,24,25—Comamonadaceae; 26—Flavobacterium; 27,31—Burkholderiales; 34—Gemmatimonas; 39—Opitutaceae; 40—Firmicutes; 41—Myxococcales. Boxes next to each module present statistically significant Spearman correlation coefficients between the module eigengene value, the treatment efficiency and time (* p < 0.05, ** p < 0.01, *** p < 0.001).
Water 08 00457 g003
Figure 4. Contour plots showing relationships between the removal efficiency of ammonia, nitrate, BOD7, TOC and the diversity of bacterial community and the abundance of nir genes. Adjusted values of variation described (R2) for the removal efficiency by bacterial community diversity and abundance of nir genes are shown on each plot.
Water 08 00457 g004
Table 1. The means and standard deviations (in parentheses) of wastewater parameters (mg/L, except for RE and pH) of horizontal subsurface flow mesocosms (HSSF MCs), removal efficiencies (RE), and pH differences (a) between influent and effluent of HSSF MCs during the 150-day study period. TOC, total organic carbon; BOD7, seven-day biochemical oxygen demand.
ParameterNtotalNO3–NNO2–NNH4–NBOD7TOCpH
Influent25120.859.424197.6
n = 5(±5)(±1.6)(±0.51)(±5.1)(±4.9)(±6.1)(±0.3)
Effluent1880.398.06.5148.3
n = 5(±4)(±3)(±0.16)(±4.2)(±4.4)(±7.0)(±0.3)
RE (%)2433411671260.7 a
n = 15(±17)(±24)(±34)(±12)(±21)(±32)(±0.2)
Table 2. Diversity indices of bacterial communities. The values are given for the Inverse Simpson’s diversity (1/D), richness (refers to the number of OTUs at the 95% similarity level), evenness, Net Relatedness Index (NRI), and Nearest Taxon Index (NTI) for initial LECA, influent of HSSF MCs (on day 26 of the experiment), and wetland media biofilm (WMB; n = 3; standard deviations are given in parentheses) of bacterial communities. OTU, operational taxonomic units; LECA, light expanded clay aggregates.
Samples (Days)1/DRichnessEvennessNRINTI
LECA38.16620.72−2.84−10.37
Influent 29.46300.69−0.96−10.07
WMB (26)66.4 (±2.1)751 (±9)0.76 (±0.01)−3.64 (±0.32)−9.69 (±0.68)
WMB (45)87.1 (±1.9)808 (±12)0.79 (±0.00)−2.67 (±0.72)−8.98 (±0.36)
WMB (64)81.0 (±2.0)795 (±18)0.78 (±0.00)−2.71 (±0.95)−8.68 (±1.02)
WMB (94)98.0 (±13.9)803 (±28)0.80 (±0.01)−3.92 (±0.77)−9.52 (±0.91)
WMB (150)90.6 (±2.6)783 (±6)0.79 (±0.01)−3.97 (±0.37)−8.38 (±1.02)

