Article

Potential of Constructed Wetlands for Removal of Antibiotics from Saline Aquaculture Effluents

1
Centro Interdisciplinar de Investigação Marinha e Ambiental, CIIMAR/CIMAR, Universidade do Porto, Terminal de Cruzeiros do Porto de Leixões, Avenida General Norton de Matos s/n, 4450-208 Matosinhos, Portugal
2
Departamento de Biologia, Universidade de Aveiro, Campus Universitário de Santiago, 3810-193 Aveiro, Portugal
*
Author to whom correspondence should be addressed.
Water 2016, 8(10), 465; https://doi.org/10.3390/w8100465
Submission received: 16 August 2016 / Revised: 6 October 2016 / Accepted: 11 October 2016 / Published: 18 October 2016
(This article belongs to the Special Issue Constructed Wetlands for Water Treatment: New Developments)

Abstract

:
This work aimed to evaluate the potential of constructed wetlands (CWs) for removal of antibiotics (enrofloxacin and oxytetracycline) and antibiotic resistant bacteria from saline aquaculture wastewaters. Removal of other contaminants (nutrients, organic matter and metals) and toxicity reduction and the influence of antibiotics with these processes were evaluated. Thus, nine CWs microcosms, divided into three treatments, were assembled and used to treat wastewater (doped or not with the selected antibiotics) between October and December of 2015. Each week treated wastewater was removed and new wastewater (doped or not) was introduced in CWs. Results showed >99% of each antibiotic was removed in CWs. After three weeks of adaptation, removal percentages >95% were also obtained for total bacteria and for antibiotic resistant bacteria. Nutrients, organic matter and metal removal percentages in CWs treated wastewater were identical in the absence and in the presence of each antibiotic. Toxicity in treated wastewaters was significantly lower than in initial wastewaters, independently of antibiotics presence. Results showed CWs have a high efficiency for removing enrofloxacin or oxytetracycline as well as antibiotic resistant bacteria from saline aquaculture wastewaters. CWs can also remove other contaminants independently of drug presence, making the aquaculture wastewater possible to be reutilized and/or recirculated.

1. Introduction

Aquaculture represents almost 50% of world fish production [1], being a growing industry due to its socio-economic advantages, sustainable character and the potentiality to end world hunger [1]. However, numerous bacterial diseases can spread and infect all the animals’ production, making it non-viable for market. To make aquaculture more profitable, the use of antibiotics, such as ampicillin, chloramphenicol, florfenicol, oxytetracycline, sulfonamides and tetracyclines, is becoming more frequent to fight animals diseases or to prevent them [2,3,4]. Nevertheless, 75% of the antibiotics given to fish will appear unused in the environment, through feces, because fish do not metabolize them effectively [4,5].
Pharmaceuticals are designed to have low biodegradability and to be water-soluble so, without proper removal, they end up in natural waters [6]. Although found at low concentrations, antibiotics remain in the aquatic environment for years causing serious toxic effects [7] and promoting the development of antibiotic resistant bacteria and genes due to selective pressure [2,8]. This can reduce the therapeutic potential against human [9] and animal pathogens [8] and can change the bacterial flora in both sediments and water column [2].
There is a strict policy for aquaculture wastewaters imposing a financial fine for each amount of pollutant released into the environment, including in Portugal legislation (e.g., [10,11]). In response, conventional wastewater treatment plants (WWTP) were developed to remove organic matter, inorganic nutrients and suspended solids from aquaculture effluents. However, WWTP are not efficient in removing pharmaceutical compounds such as antimicrobial agents from wastewater effluents [8]. When in high concentrations, antibiotics can even change the microbial community of the WWTP and therefore disturb the biological wastewater treatment systems [12].
Constructed Wetlands (CWs) are seen as a potential sustainable solution for antibiotic removal from different types of effluents. These green systems are based on the interactions among soil/sediment, plants and microorganisms [13], with several physical, chemical and biological processes occurring simultaneously, such as adsorption, photolysis, volatilization, plant uptake and accumulation, plant exudation and microbial degradation [7,14,15]. The use of higher plants in CWs is essential because plants assure the substrate’s hydraulic conductivity, contribute to the uptake of nutrients and promote microbial assemblages within their roots [16]. Although CWs are easy to maintain and operate, have low cost and produce high quality effluent with less energy dissipation [13,14], there is still lack of understanding regarding removal mechanisms, toxicity risks, design impacts, and influence of environmental factors on CWs efficiency [17].
Regarding CWs removal efficiency, several parameters were already studied, such as removal of nutrients (nitrites, nitrates, ammonia and phosphorous), heterotrophic, enterococci and coliforms bacteria and organic matter (assessed through chemical oxygen demand (COD) and biochemical oxygen demand (BOD)) from urban wastewaters [15,18,19] and also from marine aquaculture wastewaters [16,20,21,22,23]. Besides these parameters, the removal efficiency of pharmaceuticals by CWs from municipal wastewaters (e.g., [14,17,24,25]), livestock wastewaters [7,26] and also very recently from aquaculture farms wastewaters [27] was already reported. Still, to our knowledge, there are no studies regarding CWs’ efficiency for the simultaneous removal of antibiotics and antibiotic resistant bacteria from aquaculture wastewaters.
Major processes mediated through different types of bacteria occur in CWs, including denitrification, nitrogen fixation and ammonia oxidation [7]. Consequently, microbial communities have an important role in water quality improvement. However, in the presence of antibiotics, their role on depuration and purification as well as their functions can be disturbed [28]. Therefore, to also understand if the use of antibiotics in aquaculture can change the efficiency of CWs is of utmost importance.
The present study aimed to evaluate the potential of CWs to remove antibiotics and antibiotic resistant bacteria from aquaculture effluents. In addition, the efficiency of these systems to remove other contaminants (organic matter, nutrients and metals), as well as the possible interference of antibiotics with these removal processes, were also evaluated.
For that, CWs microcosms were assembled and used to treat a saline aquaculture effluent not doped or doped with enrofloxacin (ENR) or oxytetracycline (OXY). The antibiotics tested belong to two different families, fluoroquinolones (ENR) and tetracyclines (OXY), and are two of the pharmaceuticals more commonly used in aquaculture [29]. CWs systems were planted with Phragmites australis, a plant already known to contribute to CWs efficiency in the treatment of different wastewaters effluents [14,30], including for the removal of pharmaceuticals [25,31].

2. Materials and Methods

2.1. Sampling

In October 2015, P. australis was collected in the banks of the Lima River (NW Portugal), with no apparent senescence. Plants were removed with sediment attached to their roots, sediment cubes of ca. 20 × 20 × 20 cm3. The sediment was separated in situ and brought to the laboratory. Sand from the river basin was also collected. Posteriorly, sand and sediment were mixed in a proportion of 2:1 and homogenized to prepare the roots bed substrate for the CWs microcosms.

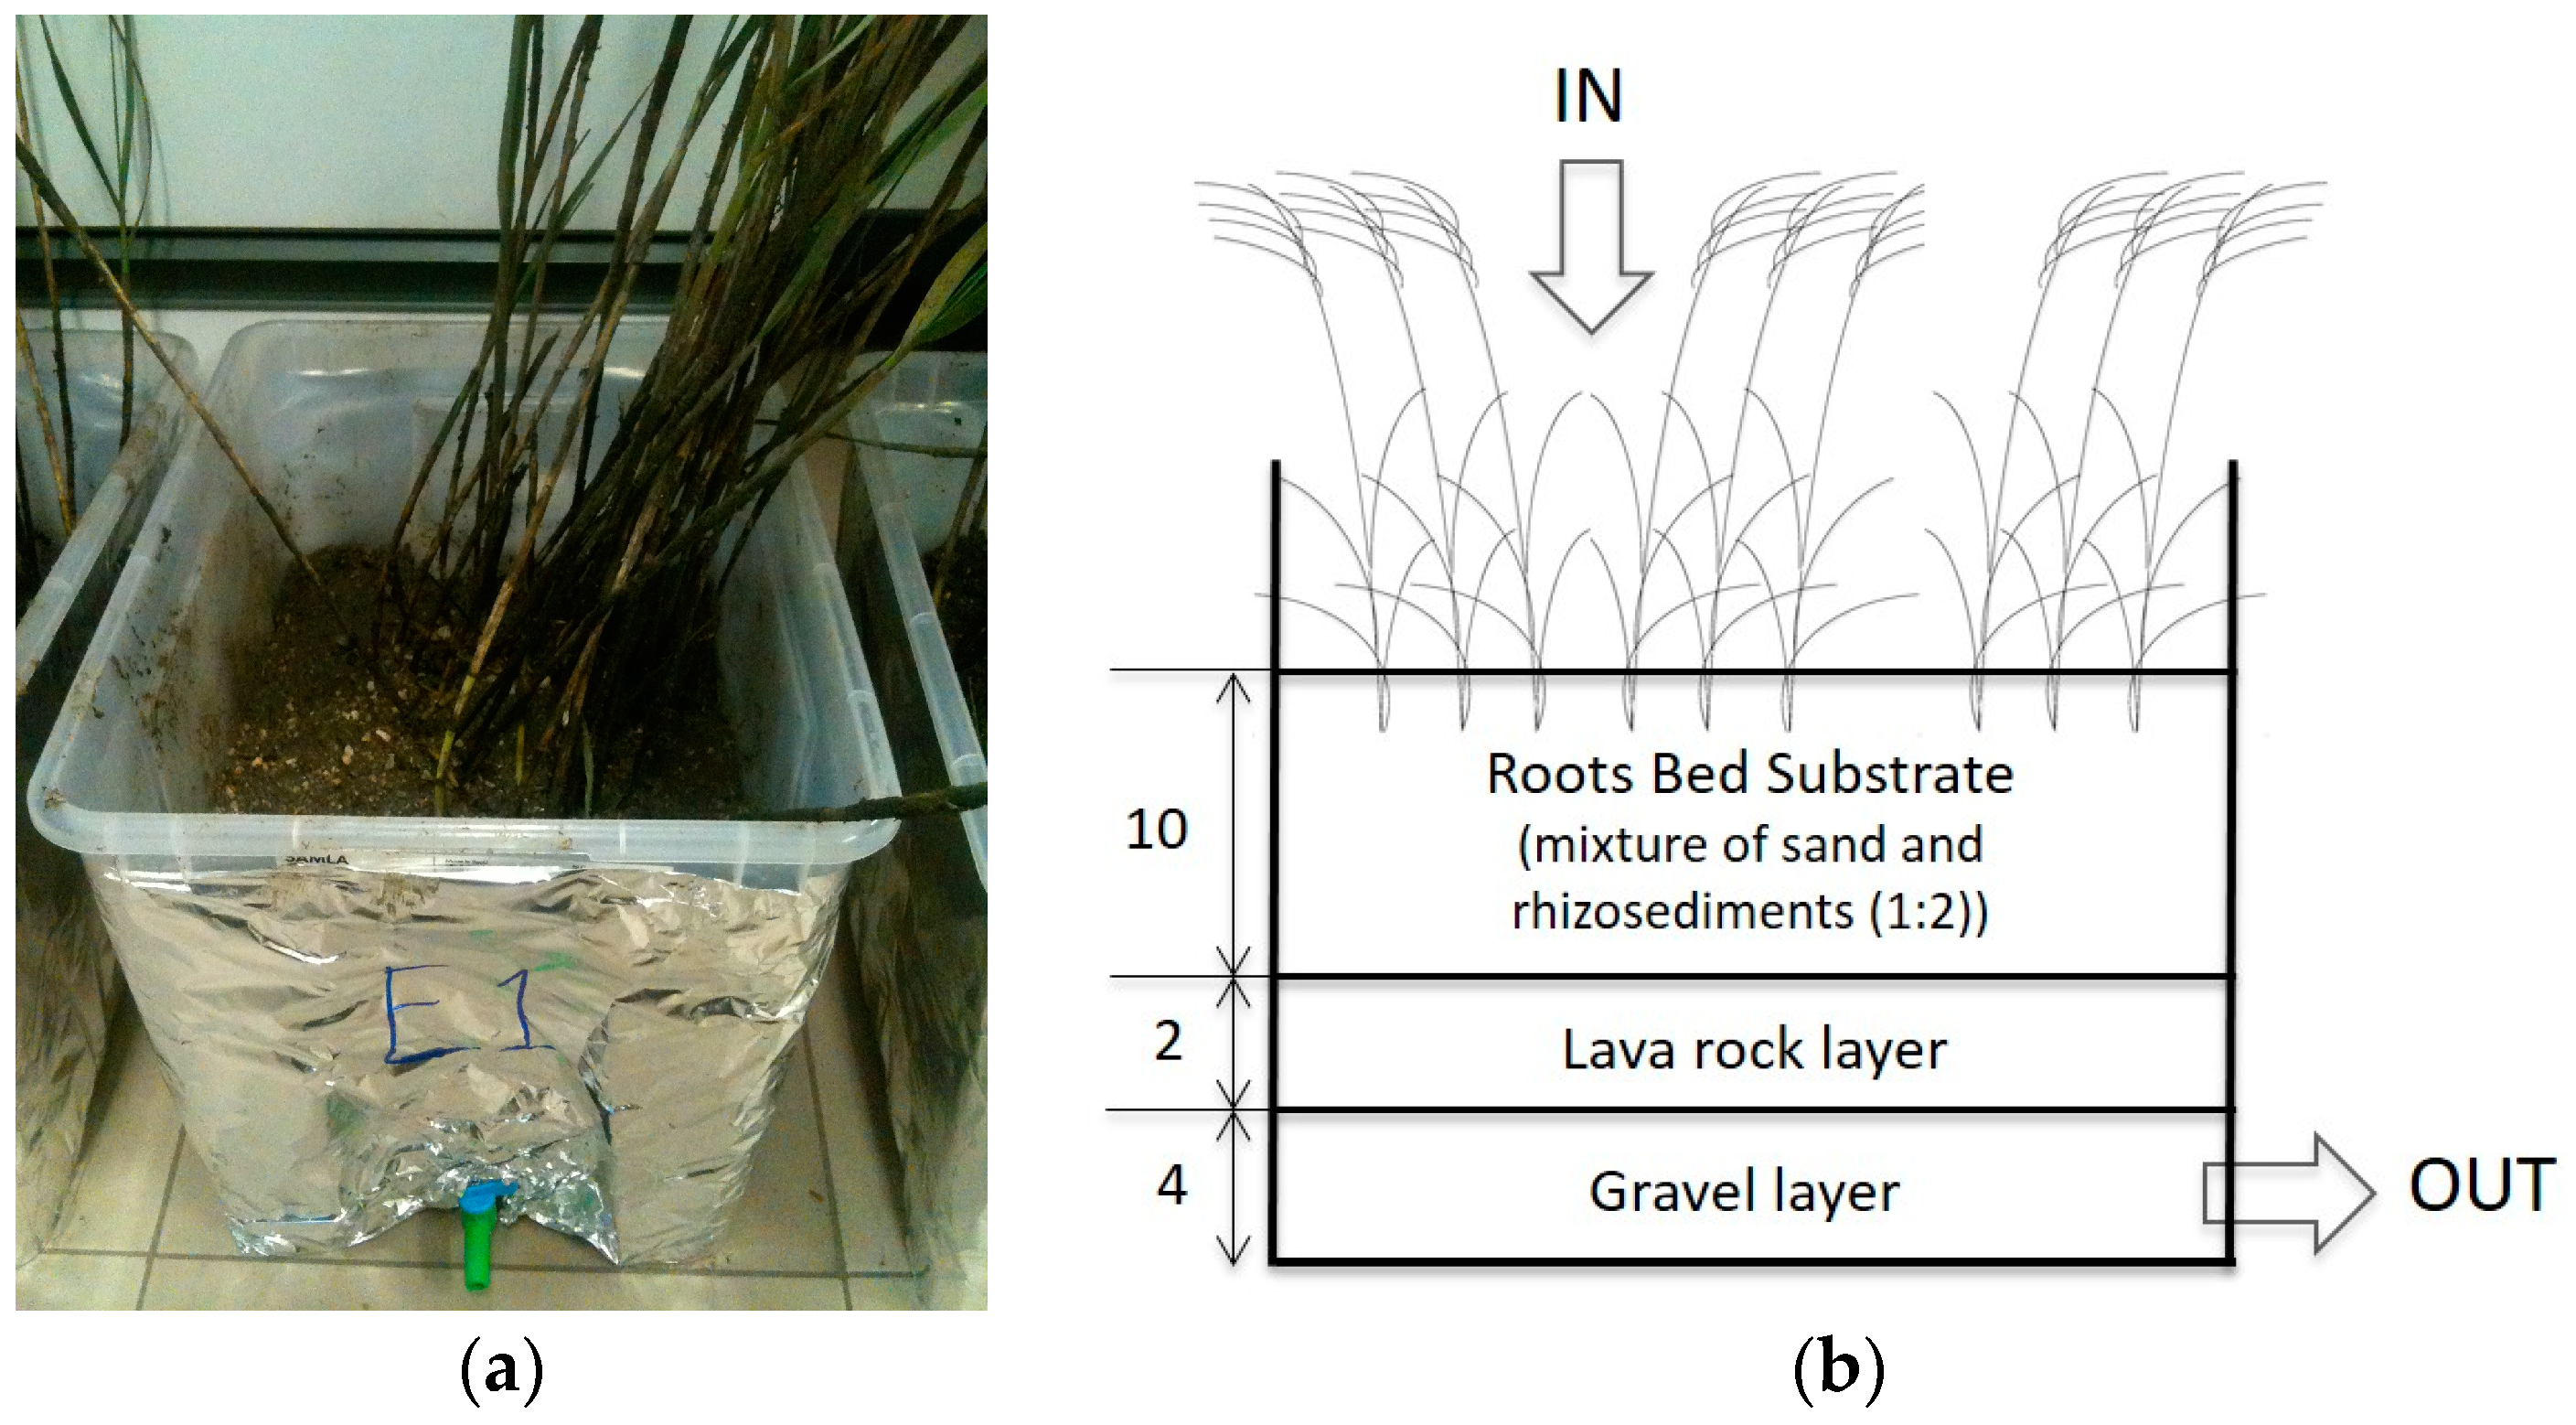
2.2. Microcosms Assembly and CWs Experiment

Nine CWs microcosms were assembled in plastic containers (0.4 × 0.3 × 0.3 m3) each composed by three layers: 4 cm of gravel, 2 cm of lava rock and 10 cm of roots bed substrate (Figure 1) into which plants were transplanted (each microcosms had ca. 40 individual plants, to have a significant plant root effect on the wastewater treatment). All microcosms were wrapped with aluminum foil to prevent penetration of sunlight and avoid photodegradation of the compounds. The microcosms were subject to one week of acclimatization with 1 L of nutrient solution, before the beginning of the experiment. With this solution water level was maintained just above the substrate surface, corresponding to a flooding rate of approximately 100%.
Three treatments were tested: one with aquaculture wastewater (Control), one with aquaculture wastewater doped with 100 μ g/L of ENR and another with aquaculture wastewater doped with 100 μ g/L of OXY. Although high, these concentrations were used because they were already found in wastewaters effluents [32], and shown not to be toxic for P. australis [13].
Every week, aquaculture wastewater was collected from a saline aquaculture facility, (which produces turbot fish in an intensive regime) and 1 L was added to each CWs microcosms (doped or not with one of the selected antibiotics). This volume was put manually on top of the substrate at once and let to percolate the system. The systems were designed to operate in a batch mode, i.e., with the initial load of water and without any running flow during the assays, having only a tap at the base for sample collection. During the week, the wastewater was daily recirculated (manually) in the microcosms to avoid anoxic conditions and deionized water added whenever necessary to compensate water losses by evaporation.
At the end of each week, all the treated wastewater was removed from the CWs systems and replaced by new wastewater (doped or not), to simulate a 7 days hydraulic retention time and a continuous input of pollutants in the CWs.
CWs microcosms were kept in greenhouse conditions, to perform the experiment under controlled conditions, being only exposed to the natural variation of sunlight (natural night:day regime) and environmental temperature. The experiment was carried out between October and December 2015.

2.3. Sample Collection

Between October and December 2015, despite the fact that every week new wastewater was added to the CWs microcosm systems, sampling of treated wastewater only occur at 4 selected weeks. Therefore, 4 samplings were carried out by collecting 1 L of one-week treated wastewater from each CWs microcosm at Week 1 (W1), Week 3 (W3), Week 6 (W6) and Week 9 (W9).
Antibiotics, bacteria (Heterothrophic, Enterobacteria and Enterococci), antibiotic resistant bacteria, toxicity, pH, salinity, COD (Chemical Oxygen Demand), BOD (Biochemical Oxygen Demand), nutrients (nitrites, nitrates, ammonium and phosphates) and metals (Cd, Cu, Fe, Mn, Ni, Pb and Zn) were quantified in the collected CWs treated wastewaters, as well as in respective non-treated wastewater.

2.4. Antibiotics Analysis

ENR and OXY were quantified using a High Performance Liquid Chromatographer (HPLC) Beckman Coulter, equipped with a diode array detector (module 128). Before analysis wastewaters were precleaned/concentrated by Solid-Phase Extraction (SPE) (with Oasis HLB cartridges (60 mg, 3 mL)) using previously optimized methodologies [33]. More details can be found in Carvalho et al. [26].

2.5. Enumeration of Cultivable Bacteria

The enumeration of total and antibiotic resistant bacteria was performed by the membrane filtration method, as described by Novo and Manaia [34]. The culture media used for enumeration of heterotrophic bacteria, enterobacteria and enterococci were, respectively, plate count agar (PCA), m-faecal coliforms (m-FC Agar Base) and m-enterococcus (Slanetz Bartley Agar + TTC). To enumerate the respective antibiotic-resistant subpopulations, the same three culture media were used supplemented with 4 mg/L of ENR or 16 mg/L of OXY. Although not using the same antibiotics, Watkinson et al. [35] used these concentrations, respectively, with ciprofloxacin (that belongs to the same antibiotic family of ENR) and tetracycline (which belongs to the same antibiotic family as OXY) and showed it was able to recover antibiotic-resistant bacteria.
Volumes of 10–100 mL of the adequate serial dilution of initial or treated wastewater were filtered through membranes that were placed onto the culture media and incubated for 24 h at 30 °C (heterotrophs) or at 37 °C (enterobacteria) and for 48 h at 37 °C (enterococci). Posteriorly, the number of colonies forming units (CFUs) was estimated from filtering membranes containing 10–80 colonies.
For each of the 9 culture media (3 without antibiotics, 3 with ENR and 3 with OXY), the percentage removal percentage was calculated by the ratio between CFU/mL in treated and in initial wastewater:
%   R e m o v a l = ( 1 ( C F U / m L ) i n   t r e a t e d   w a s t e w a t e r ( C F U / m L ) i n   i n i t i a l   w a s t e w a t e r ) × 100
For each antibiotic, the percentage of antibiotic resistance was calculated for each sample:
%   R e s i s t a n c e = ( C F U / m L ) m e d i u m   w i t h   a n t i b i o t i c ( C F U / m L ) m e d i u m   w i t h o u t   a n t i b i o t i c × 100

2.6. Wastewater Characterization

To quantify the toxicity of the initial and CWs’ treated wastewaters, the Biomonitech’s Water Toxicity Test Kit (BMT100) was used. This kit is an adaptation of ToxScreen, an assay that measures the inhibitory effect of toxic compounds through the bacteria Photobacterium leiognathi luminescence [36].The toxicity of initial and treated wastewaters was determined through bacterial luminescence of samples comparing them to the test control. This test was performed to check for toxicity related with the presence of cationic metals and metalloids and with the presence of toxic organic compounds.
To evaluate the pH and salinity, of both initial and treated wastewaters, measurements were made, respectively, through potentiometry using a combined glass electrode and with a multiparametric probe.
The organic matter content was estimated through COD and BOD measurements. COD was measured using the Kits HI93754A-25 and HI93754B-25 (Hanna Instruments, Padua, Italy), LR from 0 to 150 mg/L and MR from 0 to 1500 mg/L, respectively, from Hanna Instruments Portugal. BOD was measured in a system CBO AL606, through pressure difference.
Metals (Cd, Cu, Fe, Mn, Ni, Pb and Zn) were measured as described in previous studies [37]. Samples of initial and treated wastewater were acidified before direct analysis. Metals were measured through atomic absorption spectrophotometry with flame atomization (AAS-F-PU 9200X, Philips, Eindhoven, The Netherlands), using a calibration curve obtained with aqueous standard solutions of different metal concentrations (0–3 mg/L) prepared from 1000 mg/L stock standard solutions of each metal.
Dissolved ammonium, nitrite and phosphate were analyzed following the methods described in Grasshoff et al. [38]. Nitrate was quantified by an adaptation of the spongy cadmium reduction technique [39], subtracting nitrite value from the total. All the analyses were performed in triplicate.
In addition, a comparison was made between the values of pH, COD, BOD, Fe, Mn, nitrates and ammonium analyzed in treated wastewaters with the legislated emission limit values for wastewater discharge established by the Portuguese legislation [10].

2.7. Statistical Analysis

The results were statistically tested using the commercial software STATISTICA, version 13, StatSoft, Inc. (Tulsa, OK, USA, 2015). pH, salinity and COD measurements were evaluated through ANOVA tests, a parametric one-way analysis of variance. The detection of significant differences with a 5% confidence interval was made with a multiple Tukey comparison test. For all nutrients, metals, bacteria and toxicity removals a non-parametric test comparing multiple independent samples was performed.

3. Results

3.1. Antibiotics Concentrations

Both ENR and OXY were significantly (p < 0.05) removed from the wastewater, not being detected in the CWs treated wastewaters (limits of detection of 0.5 μg/L for each antibiotic). Therefore, after the initial doping (100 μg/L) of the wastewater, the removal percentages in the CWs microcosms were higher than 99% (considering the soluble phase).

3.2. Enumeration of Cultivable Bacteria

In the initial wastewaters, the number of CFUs/mL in all culture media was highly variable along the sampling weeks (Table 1). As for the percentage of antibiotic resistant bacteria, in the initial wastewaters, considering all type of culture media, it varied between 0% and 11% for ENR and 1 and 89% for OXY, thus being the late the group with the higher resistance observed.
For treated wastewaters, percentage of resistance was not calculated because the number of CFUs/mL was <10, preventing precise calculations.
In general, the removal percentages of total and antibiotic resistant bacteria were lower and unstable during the first week of treatment in the CWs microcosms, stabilizing after the third week of the experiment to removal values above 96%, with only one exception (a removal of 88% in W3, in CNT for total heterotrophic bacteria (HT)).

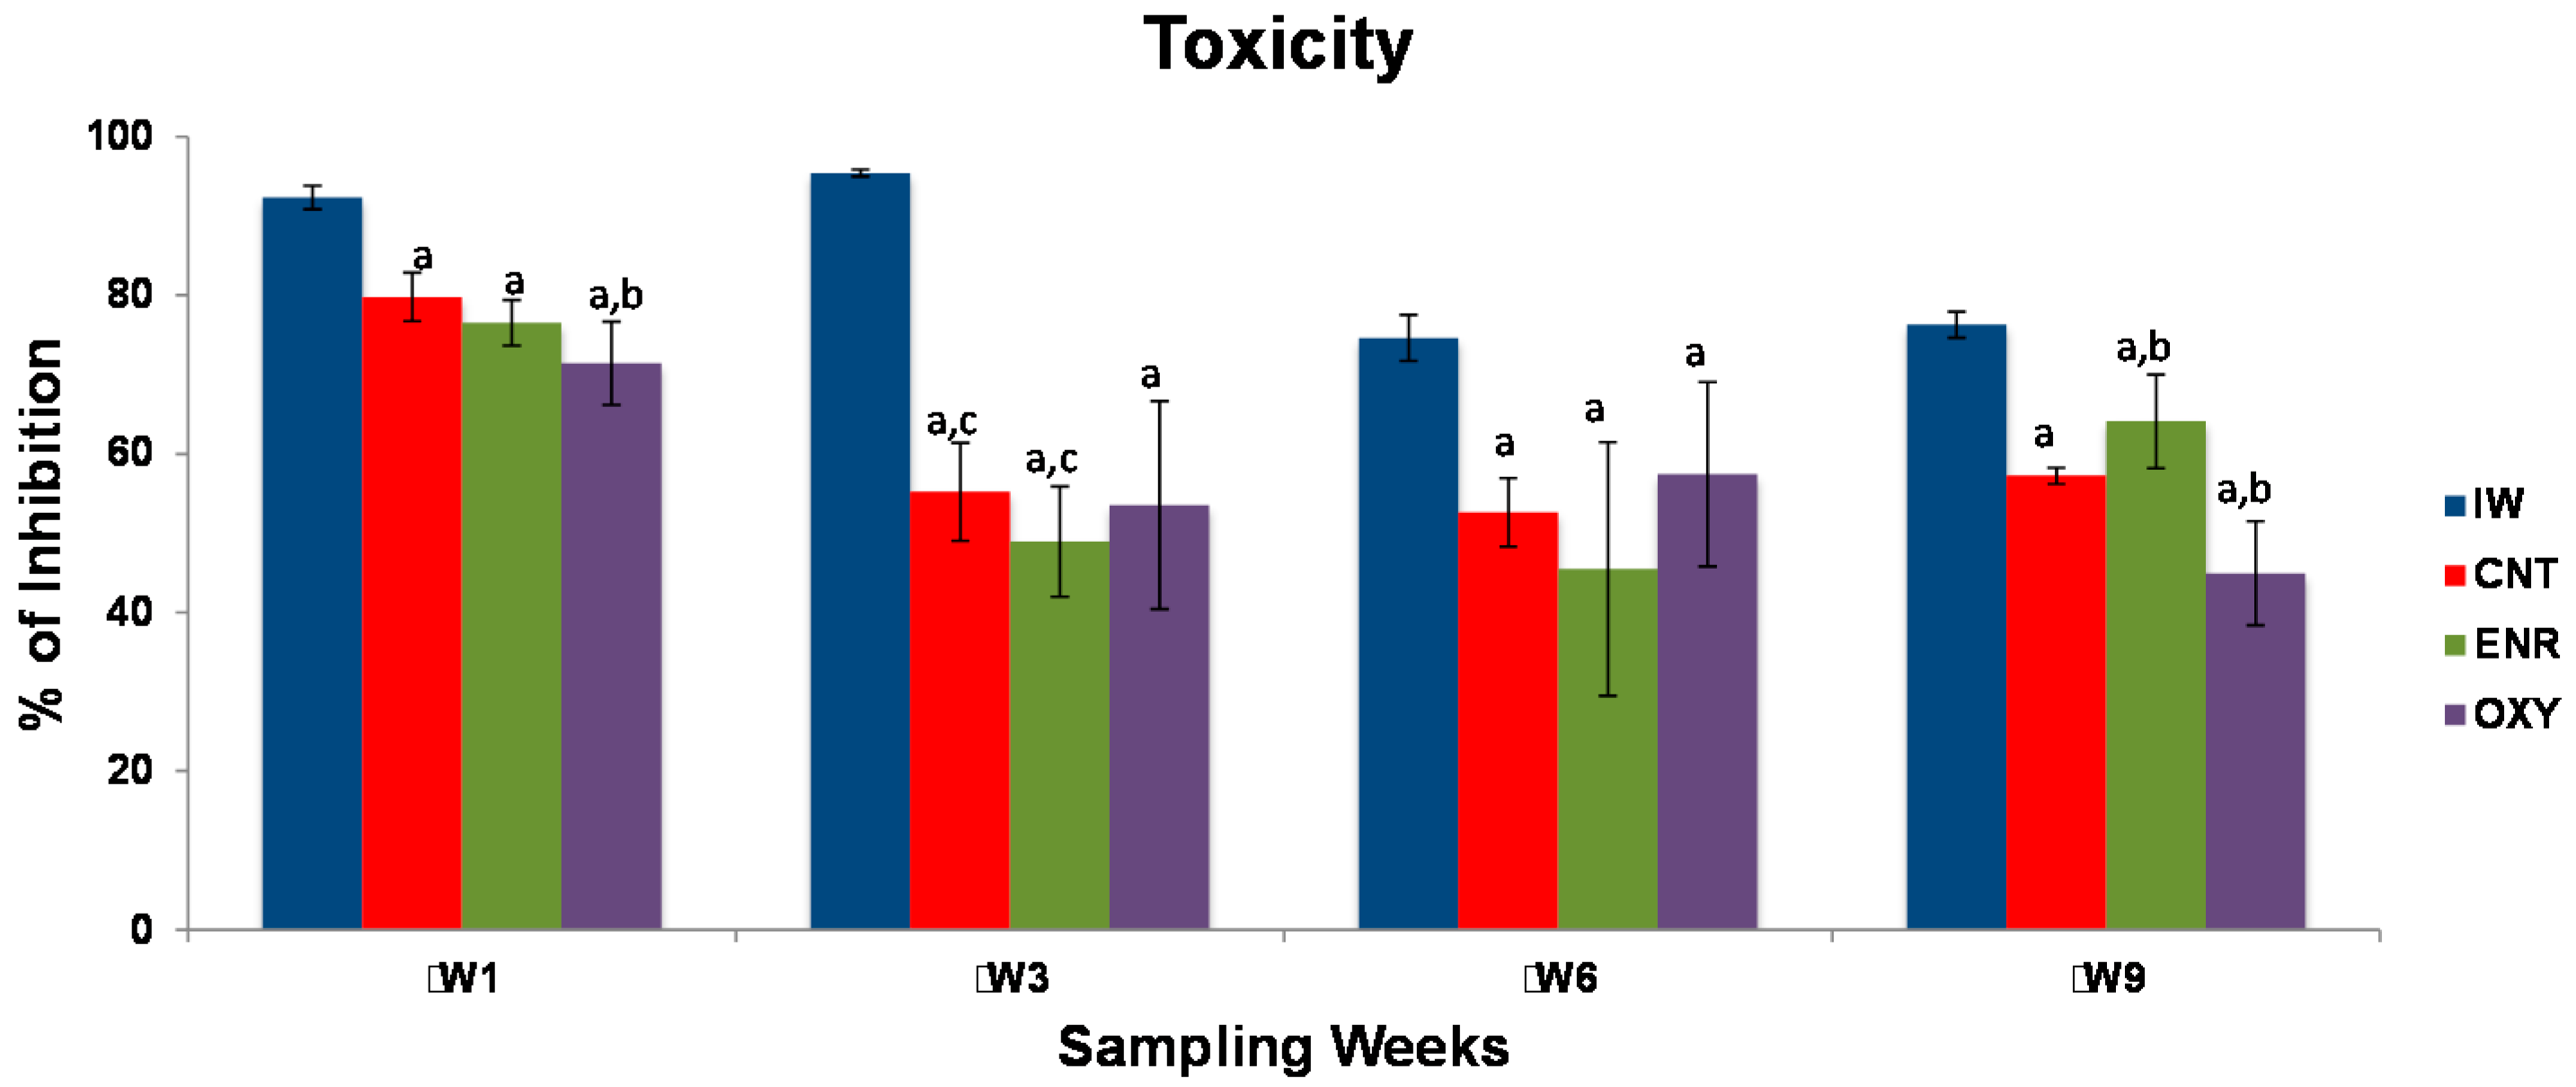
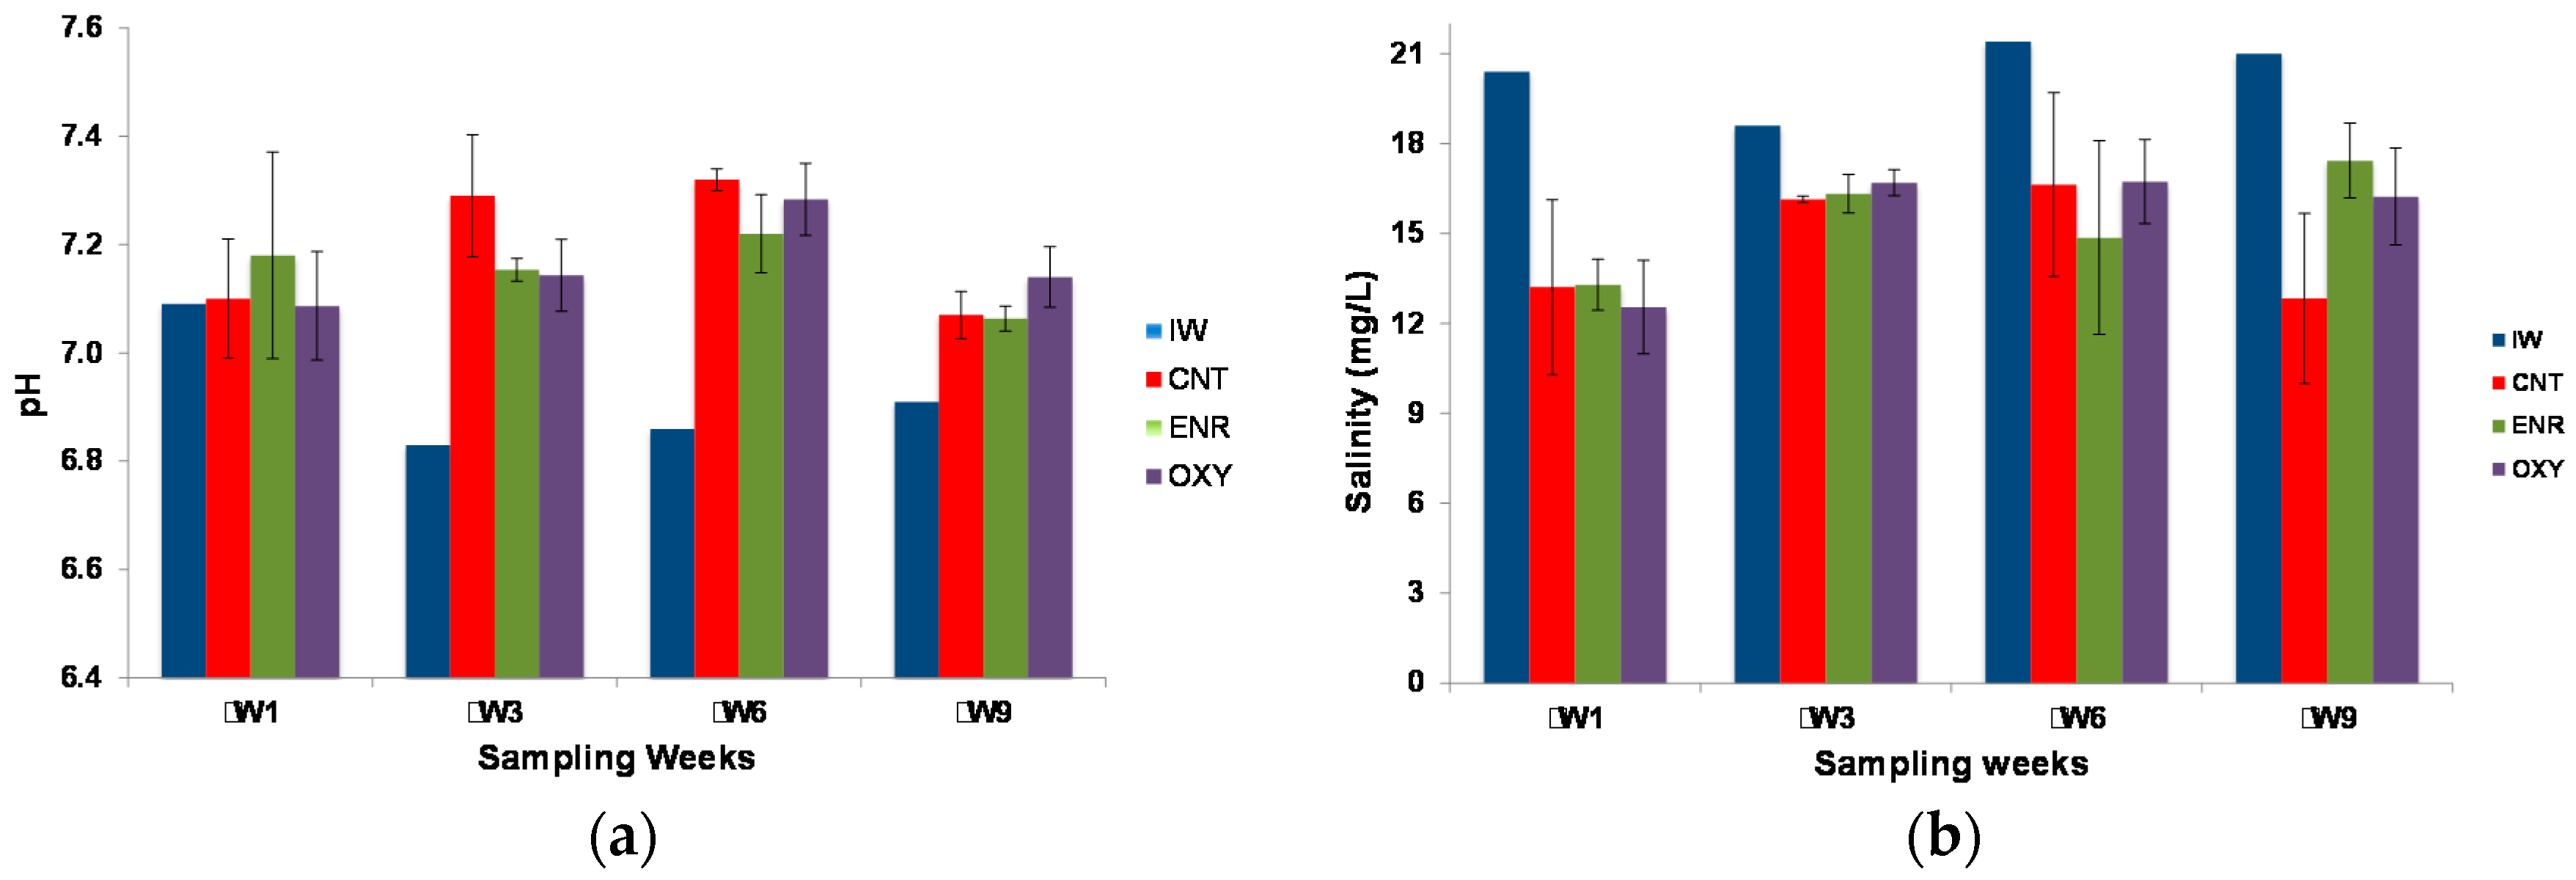
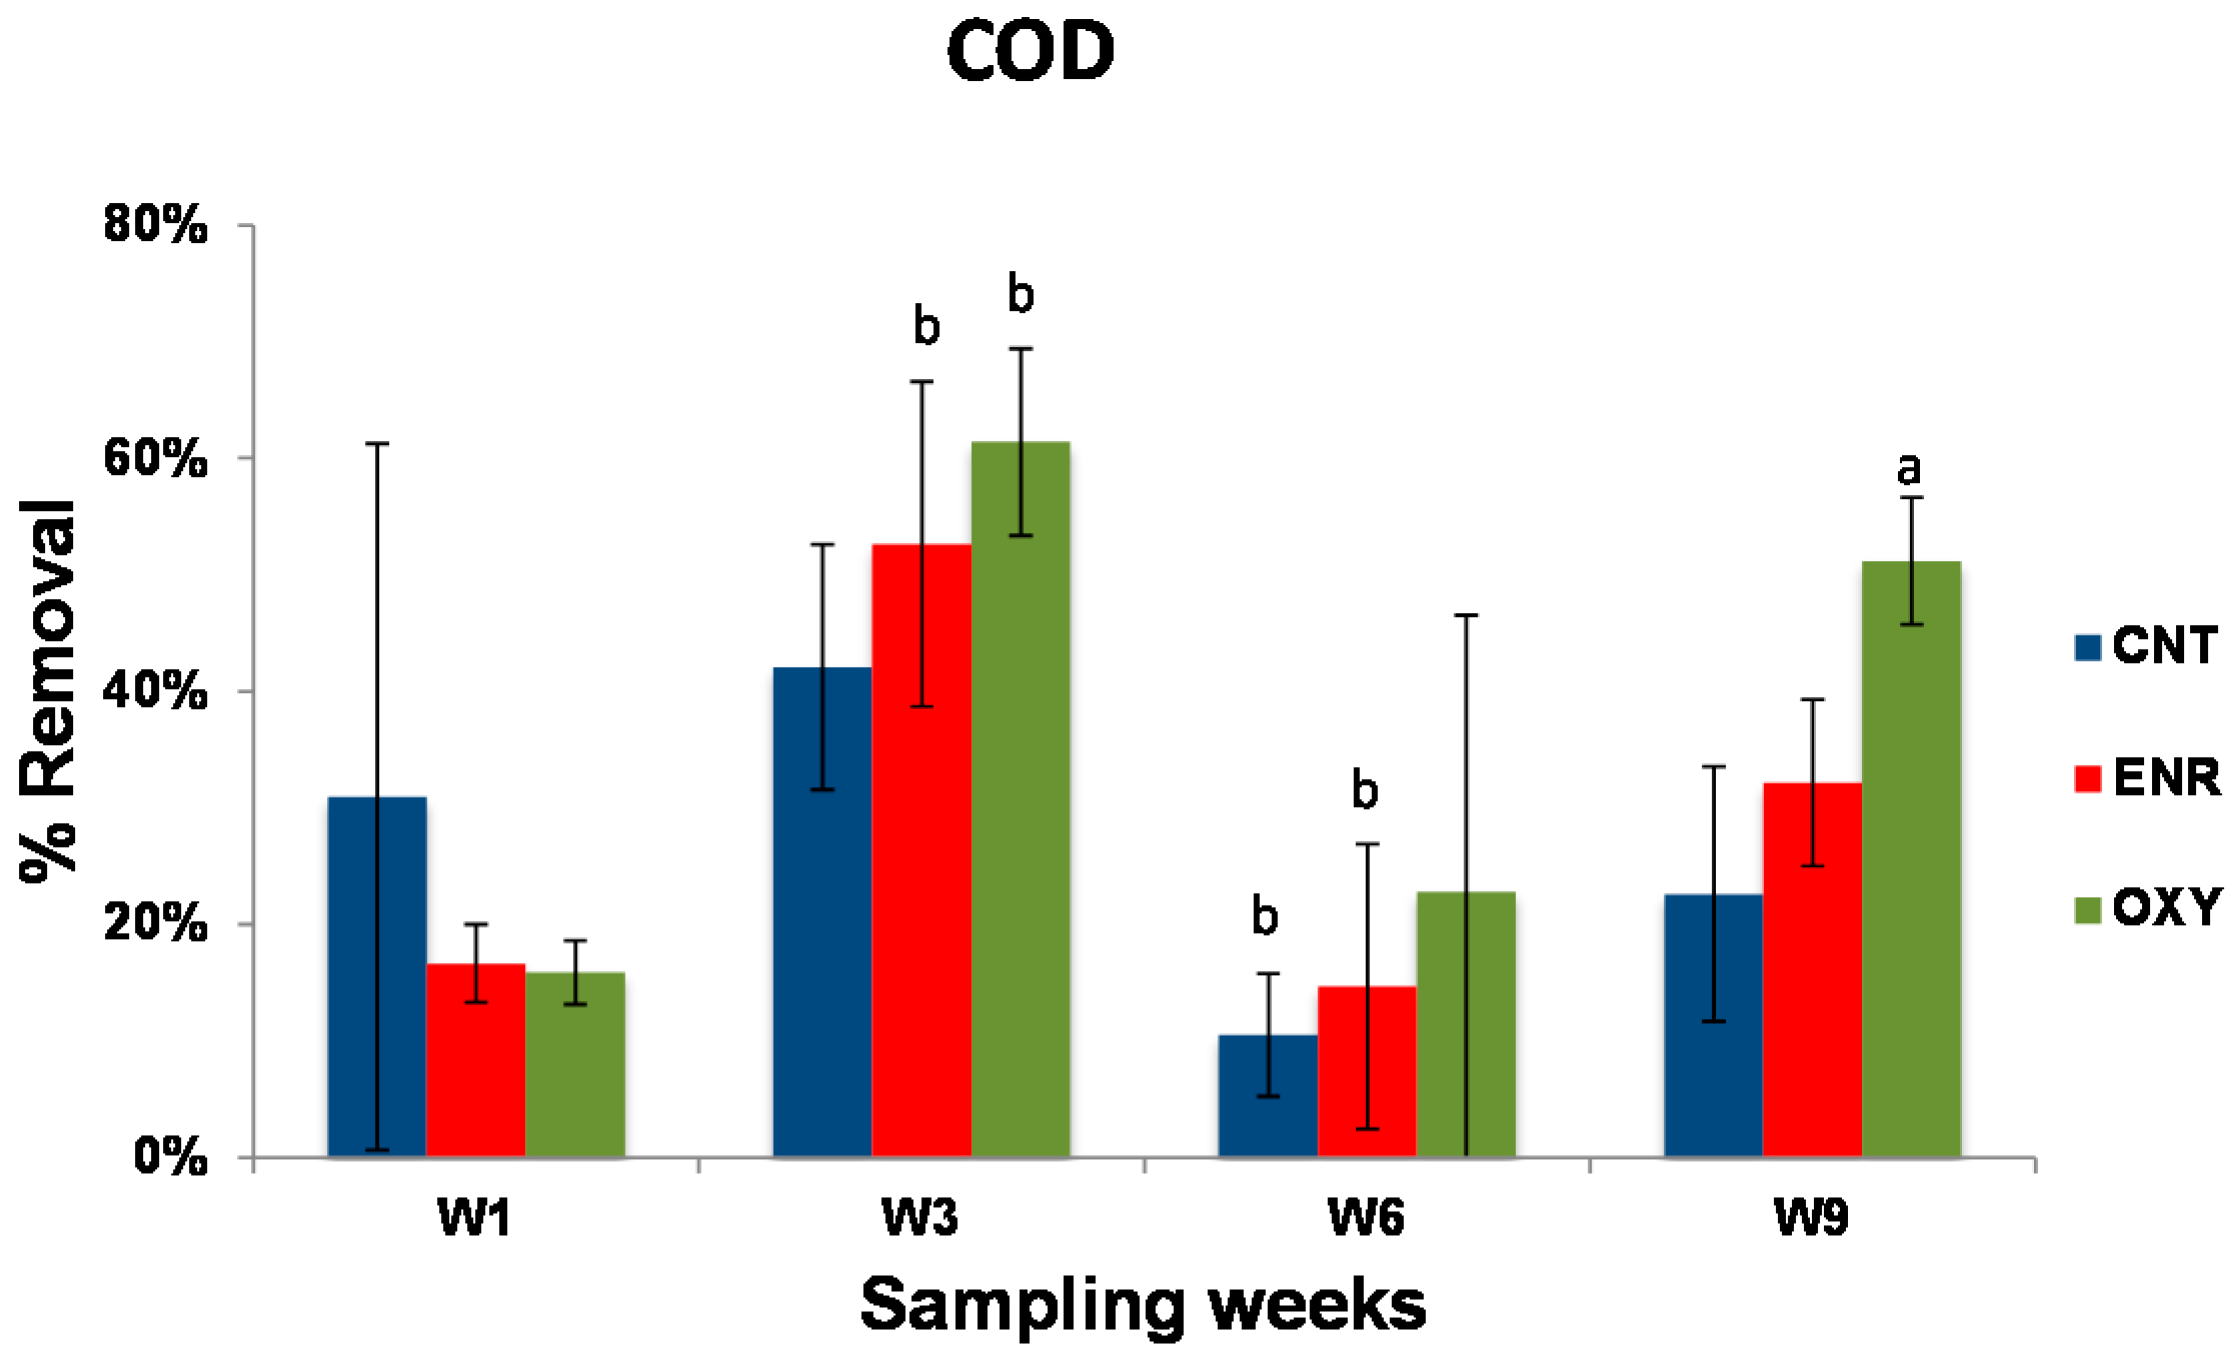
3.3. Wastewater Characterization

Values of pH in the initial wastewater varied between 6.8 and 7.1 (Figure 2a). In general, an increase in pH (up to 7.3) after each week of treatment was observed, except for the first week. All measured values comply with those expressed in the Portuguese legislation for wastewater discharge (6.0–9.0) and no significant (p > 0.05) differences were observed with or without antibiotics presence.
Values of salinity in the initial wastewaters varied between 18 and 22 g/L (Figure 2a). After each week of treatment a tendency for a decrease in the salinity was observed (values between 13 and 17 g/L), being similar with or without antibiotics.
Values of COD varied between 190 and 280 mg/L in the initial wastewater. After each week of treatment, removal percentages varied between 11% and 61% (Figure 3), with no significant (p > 0.05) differences between treatments, with one only exception (for W9, OXY vs. CNT). Removal values were highly variable along time, increasing from W1 to W3, decreasing in W6 and, increasing again in W9. Most values comply with the Portuguese legislation for wastewater discharge (150 mg/L), except in W1, for ENR (175 ± 7 mg/L) and OXY (177 ± 6 mg/L), in W6 for CNT (170 ± 10 mg/L) and ENR (183 ± 59 mg/L) and in W9 for CNT (217 ± 31 mg/L) and ENR (190 ± 20 mg/L). With the exception of W9, the presence of antibiotics in the wastewater had no influence on organic matter removal.
Regarding BOD analysis, the initial wastewaters values varied between 7 mg/L and 43 mg/L. In every week, all treated wastewaters presented values below 5 mg/L, which is the detection limit of the method used. Therefore, the values of BOD in the treated wastewaters comply with the Portuguese legislation for wastewater discharge (40 mg/L).
Values of nitrite varied between 86 and 415 mg/L in initial wastewaters. Removal percentages for the first week were above 98% whereas for the remaining weeks the removal percentages were above 99% (Figure 4a). In fact, significant (p < 0.05) differences were registered between W1 and W3 at least for CNT and ENR treatments. Significant (p < 0.05) differences were observed in general among treatments, being removals slightly lower in the presence of the antibiotics, particularly OXY. There are no Portuguese legislated values for wastewater discharge for this parameter.
Nitrate values in initial wastewaters varied between 453 and 801 mg/L. Overall, the removal percentages were above 86%, throughout the different weeks, occurring slight but significant (p < 0.05) differences along time (Figure 4b). Between treatments, only in W6 a significantly (p < 0.05) higher removal for ENR and OXY treatments when comparing to CNT was observed. All values comply with the Portuguese legislation for wastewater discharge (50 mg/L), except for CNT in W6 (80 ± 2 mg/L).
Values of ammonium varied between 166 and 252 mg/L in initial wastewaters. Removal percentages for the first week were above 61%, whereas for the remaining weeks removal percentages were above 94% (Figure 4c). Significant (p < 0.05) differences were registered between W1 and W3 for CNT, ENR and OXY treatments and between W6 and W9 for the CNT treatments. Slight but significant (p < 0.05) differences were observed between treatments within each week, along time (lower removals in the presence of antibiotics). In general, values comply with the Portuguese legislation for wastewater discharge (10 mg/L), except in W1 for all treatments (CNT = 97 ± 9 mg/L; ENR = 67 ± 16 mg/L and OXY = 93 ± 47 mg/L) and in W3 for OXY treatment (12 ± 3 mg/L).
Phosphate values varied between 11 and 26 mg/L in initial wastewaters. Removal percentages were above 85% along all weeks (Figure 4d). A significant (p < 0.05) removal increase between W1 and W3 for CNT treatment was observed. For all treatments there was also a significant (p < 0.05) decrease in removal percentage between W3 and W6 followed by a significant (p < 0.05) increase in removal percentage between W6 and W9. However, there were no significant differences (p > 0.05) between treatments with only one exception (in W9, ENR vs. CNT). There are no Portuguese legislated values for wastewater discharge for phosphate only for total phosphorous (10 mg/L).
Metals (Cd, Cu, Fe, Mn, Ni, Pb and Zn) were measured in the initial wastewaters, being the values of Cd, Cu, Ni and Pb below the detection limits (0.10 mg/L for Cd, Ni, and Pb and 0.050 mg/L for Cu). Therefore, only Fe, Mn and Zn were measured in CWs treated wastewaters. For these three metals, there was great variability in removal percentage along the weeks and between the three treatments (Table 2).
Values of Fe varied between 0.318 and 0.549 mg/L in initial wastewaters. Removal percentages varied between −120% and 70%, indicating both exportation and removal of Fe occurred within the CWs systems, along time. Significant (p < 0.05) differences were registered between W1 and W3 for CNT treatments and between W6 and W9 for ENR and OXY treatments. Significant (p < 0.05) differences were observed between treatments in W9. All values complied with the Portuguese legislation for wastewater discharge (2.0 mg/L).
Mn values in initial wastewaters varied between 0.098 and 0.123 mg/L. Removal percentages for the first three sampling weeks (W1, W3 and W6) varied between −105% and 36%, also indicating that within the systems there was both exportation and removal of this metal. In W9 the values, of both initial and treated wastewaters, were below the detection limit (<0.050 mg/L) so Mn removal percentages were not estimated. There were no significant differences (p > 0.05) among treatments along time. Significant (p < 0.05) differences between treatments were only observed in W1, in ENR vs. CNT. All values complied with the Portuguese legislation for wastewater discharge (2.0 mg/L).
Values of Zn in initial wastewaters varied between 0.029 and 0.074 mg/L. In W1 Zn presence was detected in the initial wastewater ( 0.029 mg/L) but in all treated wastewaters the concentration was below the detection limit (<0.025 mg/L), which indicates the systems did remove some of this metal, but the removal percentages for the first week were not possible to estimate. For the rest of the sampled weeks, the removal percentages varied between −41% and 66%. There were some significant (p < 0.05) differences among treatments along time. However, there were no significant differences (p > 0.05) among treatments within the same week, with only two exceptions (in W9, for ENR and OXY treatments when compared to the CNT).
Toxicity was evaluated in terms of percentage of inhibition of bacterial luminescence. The toxicity related with the existence of cationic metals and metalloids was determined absent in all initial wastewaters. However, toxicity related to the presence of toxic organic compounds was found and quantified throughout the weeks. All treated wastewaters presented significant lower (p < 0.05) toxicity when compared to the respective initial wastewater, throughout the sampled weeks (Figure 5). Overall, there were no significant differences (p > 0.05) between doped and non-doped wastewater in terms of toxicity, with a few exceptions, within each week. Throughout the different weeks, the CWs systems became more efficient after W1, as the percentage of inhibition of bacterial luminescence decreased to values between 44% and 64%.

4. Discussion

Constructed wetlands are an economical and well-established method to treat wastewater effluents [13]. These systems use plants and microorganisms as a biological approach for degradation and removal of contaminants [7]. In this study the capability of CWs, with P. australis, to treat saline aquaculture effluents and to remove two antibiotics (ENR and OXY) widely used in aquaculture as well as antibiotic resistance bacteria was investigated.
In the initial wastewaters, pH values varied between 6.83 and 7.09 and salinity values ranged between 18.6 and 21.4. Both parameters fit through the values measured by Webb et al. [16] for initial aquaculture effluents where the pH varied between 6.8 and 8.8 and salinity varied between 10 and 29. The biodegradable organic matter present in the effluent was very low, with BOD values below the detection limit. Along the sampling weeks, the initial wastewaters presented COD values of 190–280 mg/L, which are very low in comparison with other type of effluents usually treated in CWs such as urban wastewaters (524 mg/L) [18] or livestock wastewaters (1042 mg/L) [26]. Nitrites, nitrates, ammonium and phosphates values present in initial wastewaters varied, respectively, between 86 and 415 mg/L, 453 and 801 mg/L, 166 and 252 mg/L and 11 and 26 mg/L. These values are higher than the ones observed by Lin et al. [20] for aquaculture effluents where nitrites, nitrates, ammonium and phosphates varied, respectively, between 0.26 and 2.66 mg/L, 0.030 and 0.647 mg/L, 0.16 and 3.31 mg/L, and 2.39 and 10.45 mg/L, but lower than values observed in other type of wastewater, for instance, livestock wastewater (unpublished results). Regarding toxicity evaluation, the initial wastewaters presented percentages of inhibition of bacterial activity between 75% and 95%. Carvalho et al. [26] and Fernandes et al. [7] observed higher values for toxicity present in livestock effluents (>99%).
The pH values increased to neutral values, in the wastewater treated in the different CWs microcosm, in comparison with the initial wastewaters, along the weeks. The same was observed by Carvalho et al. [26] in CWs planted systems used to treat pig farms effluents (pH of initial wastewaters was 8.05 ± 0.05 and pH of treated wastewaters ranged between 7.3 and 7.7). On the other hand, salinity decreased in the CWs treated wastewater in comparison with initial wastewaters, during the sampled weeks. This indicates salt retention by the system, including by plants. Both phenomena may be due to a system’s adjustment in order to attain a proper equilibrium in the microcosms’ functioning, between what is degraded by the microorganisms and what is removed/exported by the plants, an adjustment in the present study, independent of the presence of antibiotics in the wastewater.
After determining the removal percentages of nutrients (nitrites, nitrates, ammonium), total of heterotrophic bacteria, enterobacteria: total, with ENR and OXY; enterococci: total and with OXY, and levels of toxicity, a substantial difference when comparing W1 with the remaining weeks was noticed. Even though the systems had a week of adaptation with a nutrient solution, previous to the beginning of the experiment, the systems probably needed between a week and two to adapt to the aquaculture effluent. Lin et al. [20] observed for a pilot-scale of CWs for nutrient removal from aquaculture wastewater, with Iponea aquatic and Paspalum vaginatum, that the systems needed a 3 months period start-up to achieve a stable performance. However, this adaptation time might depend on the system dimension and also on the plants present.
Nevertheless, despite the slightly lower removal in the first week, overall there was a high removal of ammonium, nitrate and nitrite, in general, higher than 90%. Lin et al. [20] observed that in nutrient removal from aquaculture effluents using CWs with I. aquatic and P. vaginatum the removal percentages for nitrites, nitrates and ammonium were, respectively, >99%, 82%–99% and 86%–98% and Webb et al. [16] using Salicornia europaea beds to treat saline aquaculture effluents, obtained removal percentages of 90%–100%, 91%–100% and 91%–100%, respectively, for nitrites, nitrates and ammonium. These results are in agreement with the ones observed in the present study, which proves the efficacy of CWs in nitrogen removal. The role-key processes responsible for these removals occur on a microbiologic level through mechanisms of nitrification and denitrification and on a small scale through sedimentation, filtration volatilization and plant uptake [16,40]. Moreover, macrophytes can release oxygen into the rhizosphere from their root systems, maintaining the hydraulic conductivity of the substrate [41] and thus playing an important role in maintaining the microbial communities accountable for the removal of nitrogen [42].
As for phosphates, the removal percentages were, overall, higher than 85%. These removal percentages were higher and more stable than those described by other authors working with aquaculture effluent, as Lin et al. [20] obtained removal percentages ranging between 31% and 71% and Webb et al. [16] observed phosphate removal percentages between 36 and 89%. The process of phosphate removal is normally due to soil adsorption and accretion [43] and to physicochemical mechanisms such as phosphate precipitation by the reaction of phosphate ions with metallic cations (Al, Ca, Fe and Mg) in soil filters [30,43] and, therefore, no system adaption is normally needed.
In general, antibiotic presence did not influence nutrients removal rates, indicating CWs systems were efficient even when the antibiotics were added to the saline aquaculture wastewater.
Regarding Fe, Mn and Zn there was a great variability of the estimated removal rates in wastewater doped or not with the antibiotics, along the weeks. In some cases negative percentages were observed, indicating exportation instead of removal occurred. This variability might be due to the different metal concentrations present in wastewater, plants and roots bed substrates. Exportation may be due to metal being dragged as the water is poured in the systems, occurring leaching, and to plants excreting it to the medium. However, the mechanisms responsible to remove the metals can be plant uptake, filtration, sedimentation of suspended particles, adsorption and microbial biogeochemical processes [30]. However, once again CWs system performance was independent of the presence of the antibiotics.
In the present study, there were significant antibiotics removals, higher than 99% in all cases, throughout the different weeks. The direct influence of the plants and soil adsorption was not studied, although Carvalho et al. [26] and Fernandes et al. [7] have shown that there can be removals of 94% for tetracycline and 98% for ENR from pig farm effluents followed by soil removal. Carvalho et al. [13] has shown P. australis can uptake ENR. Thus, in the present study, degradation or accumulation in plant tissues or adsorption and/or degradation in roots bed substrate may have occurred [26]. At the moment, to our knowledge, there are no studies regarding antibiotic removal mechanisms in CWs from aquaculture effluents alone.
As for bacterial removal, aside from W1, the removal percentages for all three types of bacteria (heterotrophic, coliforms and enterococci) in wastewater doped or not with the selected antibiotics was, in general, higher than 96%. Therefore, a high removal of bacteria was observed, including for antibiotic resistant bacteria. Although no previous data exists for aquaculture effluents, in experiments using CWs for treating domestic wastewaters, Kadlec and Knight [40] observed streptococcus removals of 80% and coliforms removals of 90%. Thus, CWs can be effective in disinfecting wastewater. This bactericidal effect was once concluded to be actively mediated by the direct presence of plants [18]. Removal mechanisms may be physical (filtration, adsorption and aggregation), biological (natural death, bacteriophages or consumed by protozoa) and chemical (influence of toxins from plants and other microorganisms and oxidative damage) [44].
Despite antibiotic presence, all CWs systems had significant toxicity decreases when comparing to the respective initial wastewaters. However, the percentage of inhibition in treated wastewaters, except in W1, ranged between 45% and 64%. This indicates the initial wastewaters may have had other non-identified toxic compound that the systems were not able to remove. These results are in agreement with the ones observed in Fernandes et al. [7].
Overall, the treatment of wastewaters is achieved by the cooperation between plants, root bed substrate and microorganisms. Plants help stabilize the substrate bed by maintaining its hydraulic conductivity, provide surface area and oxygenation for microbial communities’ growth and also allows physical filtration to occur [41]. The aim of these systems is to recreate different microenvironments that allow the occurrence of several removal mechanisms, including biological (microbial metabolization and plant uptake), physical (adsorption by the substrate or plants, filtration and retention) and chemical (degradation, nitrification, denitrification and oxidative damage) processes. Although plants have the ability to degrade organic chemicals in wastewater effluents, the microorganisms are the ones primarily responsible for this process [30].
This work demonstrates the efficiency of experimental CWs colonized by P. australis on the recovery of saline aquaculture effluents, in the presence of antibiotics. P. australis is an easy growing plant and since it is found in estuaries, it is accustomed to extreme conditions and hence it is widely used in CWs. This makes these systems an advantageous addition to wastewater treatment plants for aquaculture, pig farms and urban effluents, as they are economic, profitable, and efficient and can even eliminate veterinary antibiotics. However, one should consider the type of CW used because each design can have different efficiencies. In the present study a vertical subsurface flow system was simulated. Nevertheless, results from other studies using other types of systems are in accordance to the results presented here. Further studies should be developed for an extended period of time to test CWs behavior throughout a year long, on a pilot scale, as the biological processes involved in the pharmaceutical removal can be influenced by temperature and seasonality [45]. Substrate samples should also be collected to assess possible antibiotics adsorption to substrate, as well as to study the associated microbiological communities to better understand their removal mechanisms function. When talking about antibiotics degradation, one must note that their intermediate metabolites can be equally or even more toxic than the original molecule, so studies on this subject should also be developed to test CWs efficiency during the whole removal/degradation processes.

5. Conclusions

The present study demonstrates the potential of CWs, colonized by P. australis, to remove the veterinary antibiotics ENR and OXY from saline aquaculture effluents, attenuating the impact of these effluents into the aquatic environment. Significant removal percentages for both antibiotics were observed (>99%), along the nine weeks of CWs treatment of aquaculture wastewater doped with 100 μg/L of each selected antibiotic. After three weeks of adaptation, CWs removal percentages above 95% were obtained for total bacteria and for antibiotic resistant bacteria.
The efficiency of CWs for removing other contaminants from aquaculture effluents independently of antibiotics presence was also shown. Overall, all values in all treated wastewaters complied with the Portuguese legislated values for residual wastewater discharges.
Present work demonstrated CWs can contribute for the sustainability of aquaculture, allowing the recirculation and reutilization of aquaculture wastewater.

Acknowledgments

This research was partially supported by the Strategic Funding UID/Multi/04423/2013 through national funds provided by FCT—Foundation for Science and Technology and European Regional Development Fund (ERDF), in the framework of the program PT2020 and by the structured Program of R&D&I INNOVMAR—Innovation and Sustainability in the Management and Exploitation of Marine Resources, reference NORTE-01-0145-FEDER-000035, namely within the Research Lines ECOSERVICES (Assessing the environmental quality, vulnerability and risks for the sustainable management of the NW coast natural resources and ecosystem services in a changing world) and INSEAFOOD (Innovation and Valorisation of Seafood Products: Meeting Local Challenges and Opportunities) within the R&D Institution CIIMAR (Interdisciplinary Centre of Marine and Environmental Research), supported by the Northern Regional Operational Program (NORTE2020), through the European Regional Development Fund (ERDF).

Author Contributions

All authors conceived and designed the experiments; Maria Bôto performed the experiments with C. Marisa R. Almeida and Ana P. Mucha supervision; all authors analyzed the data; C. Marisa R. Almeida and Ana P. Mucha contributed with reagents/materials/analysis tools; and Maria Bôto wrote the paper with C. Marisa R. Almeida and Ana P. Mucha supervision/correction.

Conflicts of Interest

The authors declare no conflict of interest. The founding sponsors had no role in the design of the study; in the collection, analyses, or interpretation of data; in the writing of the manuscript, and in the decision to publish the results.

References

  1. Food and Agriculture Organization of the United Nations. The State of World Fisheries and Aquaculture; FAO: Rome, Italy, 2014; ISBN 978-92-5-108275-1 (print). E-ISBN 978-92-5-108276-8 (PDF). [Google Scholar]
  2. Cabello, F.C. Heavy use of prophylactic antibiotics in aquaculture: A growing problem for human and animal health and for the environment. Environ. Microbiol. 2006, 8, 1137–1144. [Google Scholar] [CrossRef] [PubMed]
  3. Costello, M.J.; Grant, A.; Davies, I.M.; Cecchini, S.; Papoutsoglou, S.; Quigley, D.; Saroglia, M. The control of chemicals used in aquaculture in Europe. J. Appl. Ichthyol. 2001, 17, 173–180. [Google Scholar] [CrossRef]
  4. Romero, J.; Feijoó, C.G.; Navarrete, P. Antibiotics in Aquaculture–Use, Abuse and Alternatives. In Health and Environment in Aquaculture; Carvalho, E.D., David, G.S., Silva, R.J., Eds.; InTech: Rijeka, Croatia, 2012; pp. 160–198. [Google Scholar]
  5. Burridge, L.; Weis, J.S.; Cabello, F.; Pizarro, J.; Bostick, K. Chemical use in salmon aquaculture: A review of current practices and possible environmental effects. Aquaculture 2010, 306, 7–23. [Google Scholar] [CrossRef]
  6. Zhou, J.L.; Zhang, Z.L.; Banks, E.; Grover, D.; Jiang, J.Q. Pharmaceutical residues in wastewater treatment works effluents and their impact on receiving river water. J. Hazard. Mater. 2009, 166, 655–661. [Google Scholar] [CrossRef] [PubMed]
  7. Fernandes, J.P.; Almeida, C.M.R.; Pereira, A.C.; Ribeiro, I.L.; Reis, I.; Carvalho, P.; Basto, M.C.P.; Mucha, A.P. Microbial community dynamics associated with veterinary antibiotics removal in constructed wetlands microcosms. Bioresour. Technol. 2015, 182, 26–33. [Google Scholar] [CrossRef] [PubMed]
  8. Michael, I.; Rizzo, L.; McArdell, C.S.; Manaia, C.M.; Merlin, C.; Schwartz, T.; Dagot, C.; Fatta-Kassinos, D. Urban wastewater treatment plants as hotspots for the release of antibiotics in the environment: A review. Water Res. 2013, 47, 957–995. [Google Scholar] [CrossRef] [PubMed]
  9. Heuer, O.E.; Kruse, H.; Grave, K.; Collignon, P.; Karunasagar, I.; Angulo, F.J. Human health consequences of use of antimicrobial agents in aquaculture. Clin. Infect. Dis. 2009, 49, 1248–1253. [Google Scholar] [CrossRef] [PubMed]
  10. Ministério do Ambiente. Decreto-Lei n° 236/98 de 1 Agosto. Diário da República—I Série-A (Annex XVIII); 1998. [Google Scholar]
  11. European Commission. Directive 2000/60/EC of the European Parliament and of the Council of 23 October 2000 establishing a framework for Community action in the field of water policy. Off. J. Eur. Communities 2000, 327, 1–72. [Google Scholar]
  12. Deng, Y.; Zhang, Y.; Gao, Y.; Li, D.; Liu, R.; Liu, M.; Zhang, H.; Hu, B.; Yu, T.; Yang, M. Microbial community compositional analysis for series reactors treating high level antibiotic wastewater. Environ. Sci. Technol. 2012, 46, 795–801. [Google Scholar] [CrossRef] [PubMed]
  13. Carvalho, P.N.; Basto, M.C.P.; Almeida, C.M.R. Potential of Phragmites australis for the removal of veterinary pharmaceuticals from aquatic media. Bioresour. Technol. 2012, 116, 497–501. [Google Scholar] [CrossRef] [PubMed]
  14. Garcia-Rodríguez, A.; Matamoros, V.; Fontés, C.; Salvad, V. The ability of biologically based wastewater treatment systems to remove emerging organic contaminants—A review. Environ. Sci. Pollut. Res. 2014, 21, 11708–11728. [Google Scholar] [CrossRef] [PubMed]
  15. Vymazal, J. Constructed wetlands for wastewater treatment. Water 2010, 2, 530–549. [Google Scholar] [CrossRef]
  16. Webb, J.M.; Quintã, R.; Papadimitriou, S.; Norman, L.; Rigby, M.; Thomas, D.N.; Le Vay, L. Halophyte filter beds for treatment of saline wastewater from aquaculture. Water Res. 2012, 46, 5102–5114. [Google Scholar] [CrossRef] [PubMed]
  17. Li, Y.; Zhu, G.; Ng, W.J.; Tan, S.K. A review on removing pharmaceutical contaminants from wastewater by constructed wetlands: Design, performance and mechanism. Sci. Total Environ. 2014, 468, 908–932. [Google Scholar] [CrossRef] [PubMed]
  18. Keffala, C.; Ghrabi, A. Nitrogen and bacterial removal in constructed wetlands treating domestic waste water. Desalination 2005, 185, 383–389. [Google Scholar] [CrossRef]
  19. Sleytr, K.; Tietz, A.; Langergraber, G.; Haberl, R. Investigation of bacterial removal during the filtration process in constructed wetlands. Sci. Total Environ. 2007, 380, 173–180. [Google Scholar] [CrossRef] [PubMed]
  20. Lin, Y.F.; Jing, S.R.; Lee, D.Y.; Wang, T.W. Nutrient removal from aquaculture wastewater using a constructed wetlands system. Aquaculture 2002, 209, 169–184. [Google Scholar] [CrossRef]
  21. Quintã, R.; Hill, P.W.; Jones, D.L.; Santos, R.; Thomas, D.N.; LeVay, L. Uptake of an amino acid (alanine) and its peptide (trialanine) by the saltmarsh halophytes Salicornia europaea and Aster tripolium and its potential role in ecosystem N cycling and marine aquaculture wastewater treatment. Ecol. Eng. 2015, 75, 145–154. [Google Scholar] [CrossRef]
  22. Quintã, R.; Santos, R.; Thomas, D.; Vay, L.L. Growth and nitrogen uptake by Salicornia europaea and Aster tripolium in nutrient conditions typical of aquaculture wastewater. Chemosphere 2015, 120, 414–421. [Google Scholar] [CrossRef] [PubMed]
  23. Webb, J.M.; Quintã, R.; Papadimitriou, S.; Norman, L.; Rigby, M.; Thomas, D.N.; Le Vay, L. The effect of halophyte planting density on the efficiency of constructed wetlands for the treatment of wastewater from marine aquaculture. Ecol. Eng. 2013, 61, 145–153. [Google Scholar] [CrossRef]
  24. Anderson, J.C.; Carlson, J.C.; Low, J.E.; Challis, J.K.; Wong, C.S.; Knapp, C.W.; Hanson, M.L. Performance of a constructed wetland in Grand Marais, Manitoba, Canada: Removal of nutrients, pharmaceuticals, and antibiotic resistance genes from municipal wastewater. Chem. Cent. J. 2013, 7, 54. [Google Scholar] [CrossRef] [PubMed] [Green Version]
  25. Zhang, D.; Gersberg, R.M.; Ng, W.J.; Tan, S.K. Removal of pharmaceuticals and personal care products in aquatic plant-based systems: A review. Environ. Pollut. 2014, 184, 620–639. [Google Scholar] [CrossRef] [PubMed]
  26. Carvalho, P.N.; Araújo, J.L.; Mucha, A.P.; Basto, M.C.P.; Almeida, C.M.R. Potential of constructed wetlands microcosms for the removal of veterinary pharmaceuticals from livestock wastewater. Bioresour. Technol. 2013, 134, 412–416. [Google Scholar] [CrossRef] [PubMed]
  27. Hsieh, C.Y.; Liaw, E.T.; Fan, K.M. Removal of veterinary antibiotics, alkylphenolic compounds, and estrogens from the Wuluo constructed wetland in southern Taiwan. J. Environ. Sci. Health A Toxic/Hazard. Subst. Environ. Eng. 2015, 50, 151–160. [Google Scholar] [CrossRef] [PubMed]
  28. Berglund, B.; Khan, G.A.; Weisner, S.E.B.; Ehde, P.M.; Fick, J.; Lindgren, P.E. Efficient removal of antibiotics in surface-flow constructed wetlands, with no observed impact on antibiotic resistance genes. Sci. Total Environ. 2014, 476–477, 29–37. [Google Scholar] [CrossRef] [PubMed]
  29. Gastalho, S.; Silva, G.J.; Ramos, F. Uso de antibióticos em aquacultura e resistência bacteriana: Impacto em saúde pública Antibiotics in aquaculture and bacterial resistance: Health care impact. Acta Farmacêutica Portuguesa 2014, 3, 29–45. [Google Scholar]
  30. Stottmeister, U.; Wießner, A.; Kuschk, P.; Kappelmeyer, U.; Kästner, M.; Bederski, O.; Müller, R.A.; Moormann, H. Effects of plants and microorganisms in constructed wetlands for wastewater treatment. Biotechnol. Adv. 2003, 22, 93–117. [Google Scholar] [CrossRef] [PubMed]
  31. Carvalho, P.N.; Basto, M.C.P.; Almeida, C.M.R.; Brix, H. A review of plant-pharmaceutical interactions: From uptake and effects in crop plants to phytoremediation in constructed wetlands. Environ. Sci. Pollut. Res. 2014, 21, 11729–11763. [Google Scholar] [CrossRef] [PubMed]
  32. Babić, S.; Pavlović, D.M.; Ašperger, D.; Periša, M.; Zrnčić, M.; Horvat, A.J.M.; Kaštelan-Macan, M. Determination of multi-class pharmaceuticals in wastewater by liquid chromatography-tandem mass spectrometry (LC–MS–MS). Anal. Bioanal. Chem. 2010, 398, 1185–1194. [Google Scholar] [CrossRef] [PubMed]
  33. Cavenati, S.; Carvalho, P.N.; Almeida, C.M.R.; Basto, M.C.P.; Vasconcelos, M.T.S.D. Simultaneous determination of several veterinary pharmaceuticals in effluents from urban, livestock and slaughterhouse wastewater treatment plants using a simple chromatographic method. Water Sci. Technol. 2012, 66, 603–611. [Google Scholar] [CrossRef] [PubMed]
  34. Novo, A.; Manaia, C.M. Factors influencing antibiotic resistance burden in municipal wastewater treatment plants. Appl. Microbiol. Biotechnol. 2010, 87, 1157–1166. [Google Scholar] [CrossRef] [PubMed]
  35. Watkinson, A.J.; Micalizzi, G.R.; Bates, J.R.; Costanzo, S.D. Novel method for rapid assessment of antibiotic resistance in Escherichia coli isolates from environmental waters by use of a modified chromogenic agar. Appl. Environ. Microbiol. 2007, 73, 2224–2229. [Google Scholar] [CrossRef] [PubMed]
  36. Ulitzur, S.; Lahav, T.; Ulitzur, N. A novel and sensitive test for rapid determination of water toxicity. Environ. Toxicol. 2002, 17, 291–296. [Google Scholar] [CrossRef] [PubMed]
  37. Almeida, C.M.R.; Mucha, A.P.; Vasconcelos, M.T.S.D. Influence of the sea rush Juncus maritimus on metal concentration and speciation in estuarine sediment colonized by the plant. Environ. Sci. Technol. 2004, 38, 3112–3118. [Google Scholar] [CrossRef] [PubMed]
  38. Grasshoff, K.; Ehrhardt, M.; Kremling, K. Methods of Seawater Analysis, 2nd ed.; Verlag Chemie: Weinheim, Germany, 1983. [Google Scholar]
  39. Jones, M.N. Nitrate reduction by shaking with cadmium: Alternative to cadmium columns. Water Res. 1984, 18, 643–646. [Google Scholar] [CrossRef]
  40. Kadlec, R.H.; Knight, R.L. Treatment Wetlands; Lewis Publishers: Boca Raton, FL, USA, 1996; p. 348. [Google Scholar]
  41. Brix, H. Functions of macrophytes in constructed wetlands. Water Sci. Technol. 1994, 29, 71–78. [Google Scholar]
  42. Faulwetter, J.L.; Gagnon, V.; Sundberg, C.; Chazarenc, F.; Burr, M.D.; Brisson, J.; Camper, A.K.; Stein, O.R. Microbial processes influencing performance of treatment wetlands: A review. Ecol. Eng. 2009, 35, 987–1004. [Google Scholar] [CrossRef]
  43. Vymazal, J. Removal of nutrients in various types of constructed wetlands. Sci. Total Environ. 2007, 380, 48–65. [Google Scholar] [CrossRef] [PubMed]
  44. Ottová, V.; Balcarová, J.; Vymazal, J. Microbial characteristics of constructed wetlands. Water Sci. Technol. 1997, 35, 117–123. [Google Scholar] [CrossRef]
  45. Dordio, A.V.; Duarte, C.; Barreiros, M.; Carvalho, A.P.; Pinto, A.; Costa, C.T. Toxicity and removal efficiency of pharmaceutical metabolite clofibric acid by Typha spp.–Potential use for phytoremediation? Bioresour. Technol. 2009, 100, 1156–1161. [Google Scholar] [CrossRef] [PubMed]
Figure 1. (a) Picture of one of the assembled CW microcosms; (b) Vertical cross-section of an experimental constructed wetland planted with P. australis showing height (in cm) and composition of the three layers.
Water 08 00465 g001
Figure 2. Values of (a) pH and (b) salinity measured in the initial (IW) and treated wastewaters along the sampled weeks. Wastewater not doped (CNT) or doped with the antibiotic enrofloxacin (ENR) or oxytetracycline (OXY).
Water 08 00465 g002
Figure 3. Chemical Oxygen Demand (COD) values in initial and CWs treated wastewaters along the sampled weeks. Wastewater not doped (CNT) or doped with the antibiotic enrofloxacin (ENR) or oxytetracycline (OXY). a: Significant differences (p < 0.05) compared to CNT; b: Significant differences (p ≤ 0.05) compared to the same treatment the week before.
Water 08 00465 g003
Figure 4. Inorganic nutrient removal percentages, in percentage, along the sampled weeks: (a) Nitrites; (b) Nitrates; (c) Ammonium; and (d) Phosphates. Wastewater not doped (CNT) or doped with the antibiotic enrofloxacin (ENR) or oxytetracycline (OXY). a: Significant (p < 0.05) differences compared to CNT; b: Significant (p < 0.05) differences compared to the same treatment the week before.
Water 08 00465 g004
Figure 5. Toxicity based on bacterial luminescence expressed in percent of inhibition of bacterial activity from toxic organic compounds, along the sampled weeks. Wastewater not doped (CNT) or doped with the antibiotic enrofloxacin (ENR) or oxytetracycline (OXY). a: Significant differences (p < 0.05) compared to the initial wastewater (IW); b: Significant differences (p < 0.05) compared to the control (CNT); c: Significant differences (p < 0.05) compared to the same treatment the week before.
Water 08 00465 g005
Table 1. Bacterial density (CFUs/mL) of the different bacterial taxonomic and antibiotic resistance groups in initial wastewater and bacterial removal percentages in CWs treated wastewater along the experiment in the different CWs microcosms. Wastewater not doped (CNT) or doped with the antibiotic enrofloxacin (ENR) or oxytetracycline (OXY). HT—Heterotrophic Total; HE—Heterotrophic resistant to ENR; HO—Heterotrophic resistant to OXY; CT—Coliforms Total; CE—Coliforms resistant to ENR; CO—Coliforms resistant to OXY; ET—Enterococcus Total; EE—Enterococcus resistant to ENR; EO—Enterococcus resistant to OXY.
Bacterial TaxonomicInitial WastewaterTreated Wastewater CWs Microcosms
CNTENROXY
CFU/mL% Resistance% Removal% Removal% Removal
HT3.4 × 102–1.54 × 10⁴-47–980–10017–100
HE1.92 × 101–2.3 × 10²⁰–973–10090–100-
HO2.1 × 101–3.38 × 10²¹–8998–99-99–100
CT6.0 × 100–7.0 × 101-0–10050–1000–100
CE6.0 × 10−1–5.0 × 1003–110–10072–100-
CO1.0 × 100–9.0 × 1003–207–100-0–100
ET1.05 × 101–4.7 × 101-99–10099–10099–100
EE1.0 × 100–2.3 × 1002–119999–100-
EO3.1 × 100–1.2 × 10¹⁷–5799–100-97–100
Table 2. Metals (Fe, Mn and Zn) removals, in percentage, during the experiment. Wastewater not doped (CNT) or doped with the antibiotic enrofloxacin (ENR) or oxytetracycline (OXY).
MetalTreatmentW0–W1W2–W3W5–W6W8–W9
MeanσMeanσMeanσMeanσ
FeCNT41%5%−120% b47%31%0%54%2%
ENR36%28%−42%55%25%11%65% a,b7%
OXY31%64%−71%93%31%16%70% a,b2%
MnCNT−105%40%−20%10%32%0%--
ENR36% a37%−50%78%27%22%--
OXY−47%93%27%29%22%25%--
ZnCNT--9%33%40%23%66% b3%
ENR--−41%79%32% b9%25% a15%
OXY--13%13%54% b3%22% a,b9%
Notes: a: Significant differences (p < 0.05) compared to the control; b: Significant differences (p < 0.05) compared to the same treatment the week before.

