Article

Lettuce (Lactuca sativa L. var. Sucrine) Growth Performance in Complemented Aquaponic Solution Outperforms Hydroponics

1
Integrated and Urban Plant Pathology Laboratory, Université de Liège, Gembloux B-5030, Belgium
2
Biobased Chemistry & Technology, Wageningen University & Research, Wageningen 6700 AA, The Netherlands
3
Geography and Environment, Faculty of Social and Human Sciences, University of Southampton, Southampton SO17 1BJ, UK
4
Statistics, Informatics, and Applied Modelling Unit, Department AGROBIOCHEM, University of Liège, Gembloux B-5030, Belgium
*
Authors to whom correspondence should be addressed.
These authors contributed equally to this work.
Water 2016, 8(10), 467; https://doi.org/10.3390/w8100467
Submission received: 6 July 2016 / Revised: 3 October 2016 / Accepted: 14 October 2016 / Published: 19 October 2016
(This article belongs to the Special Issue Aquaponics: Toward a Sustainable Water-Based Production System?)

Abstract

:
Plant growth performance is optimized under hydroponic conditions. The comparison between aquaponics and hydroponics has attracted considerable attention recently, particularly regarding plant yield. However, previous research has not focused on the potential of using aquaponic solution complemented with mineral elements to commercial hydroponic levels in order to increase yield. For this purpose, lettuce plants were put into AeroFlo installations and exposed to hydroponic (HP), aquaponic (AP), or complemented aquaponic (CAP) solutions. The principal finding of this research was that AP and HP treatments exhibited similar (p > 0.05) plant growth, whereas the shoot weight of the CAP treatment showed a significant (p < 0.05) growth rate increase of 39% on average compared to the HP and AP treatments. Additionally, the root weight was similar (p > 0.05) in AP and CAP treatments, and both were significantly higher (p < 0.05) than that observed in the HP treatment. The results highlight the beneficial effect of recirculating aquaculture system (RAS) water on plant growth. The findings represent a further step toward developing decoupled aquaponic systems (i.e., two- or multi-loops) that have the potential to establish a more productive alternative to hydroponic systems. Microorganisms and dissolved organic matter are suspected to play an important role in RAS water for promoting plant roots and shoots growth.

1. Introduction

Aquaponics is an integrated closed-loop multi-trophic food production system that combines elements of a recirculating aquaculture system (RAS) and hydroponics [1,2,3]. Aquaponic systems where the nutrient flows and concentrations within the different components (e.g., aquaculture and hydroponic parts) are independent of one another are called decoupled aquaponic systems (DAPS) [4], or double recirculation aquaponic systems (DRAPS) [5]. Aquaponic systems designed with independent loops offer greater control over the hydroponic component, where water can be complemented with mineral salts for increased nutrient concentrations, and pH adjusted to fall within an optimal range.
A number of studies have attempted to show optimal nutrient solutions for growing lettuce in hydrocultural environments [6,7]. Table 1 provides the results obtained by Resh. Several factors determine the nutrient uptake performance of plants, including the availability of all essential nutrients, their presence in appropriate ratios, and favorable external conditions, for instance, pH, temperature, O2, and CO2. According to Liebig’s ‘law of the minimum’ nutrient availability constitutes a critical factor; the nutrient least available determines the maximum growth rate. Several researchers [8,9,10] reported an enhanced NO3 uptake when the nutrient solution’s N source contained between 5% and 25% NH4+. At a pH of 6.8, both NO3 and NH4+ are equally absorbed, whereas NO3 is preferred in acidic and NH4+ in alkaline environments [8]. The influence of pH on nutrient uptake is also observed for other macro- and micronutrients. Indeed, a pH from 6.0 to 8.0 is optimal for the uptake of macronutrients such as phosphorus (H2PO4, HPO42− or PO43−), potassium (K+), sulfur (SO42−), Calcium (Ca2+), and Magnesium (Mg2+). Considering that micronutrients such as Iron (Fe3+, Fe2+), manganese (Mn2+), boron (BO32−, B4O72−), copper (Cu2+, Cu+), and zinc (Zn2+) are preferentially absorbed at pH values below 6.0 [11,12]; the trade-off pH in hydroponics is approximately 5.5–6.0 [6].
In the domain of efficient agriculture the root: shoot ratio of plants has become an important issue. Root hairs will be limited or almost absent if the plants are exposed to NO3-N concentrations of at least 100 mg/L or to high P content. However, a phosphorus deficiency in the plant’s tissues can be observed if their Al3+ or Ca2+ concentrations are too high at the root surface. Sonneveld and Voogt [14] showed that a Ca:P ratio of approximately 3:1 was the most efficient target value. Jones [8] also showed that the optimal Ca: Mg ratio was 3:1. Furthermore, uptake imbalance mostly occurs when K+ concentrations are too high in the system in proportion to Ca2+ and Mg2+. In such cases, K+ is more readily absorbed than Ca2+ and Mg2+.
Although lower nutrient levels are observed in one-loop aquaponic systems compared to hydroponic cultivation methods, a number of researchers have reported a similar lettuce yield [15,16]. In most recent studies the growth of lettuce has been measured only in aquaponic (AP) and hydroponic (HP) systems. However, the growth performance of aquaponic and hydroponic lettuce exposed to similarly high nutrient concentrations has not been comprehensively investigated. It remains unclear to what degree the aquaculture effluent generates an impact (negative, neutral, or positive) on plant growth performance.
The leaf nutrient content can give information on plant health (e.g., nutrient deficiency detection); however, this has not yet been investigated in aquaponics. The strict regulations within the EU concerning the maximum levels of contaminants in food [17] further the need for leaf composition analysis.
Consequently, the objective of this study was to compare shoot and root yields and leaf nutrient content of lettuce grown in conventional hydroponic solutions to those grown in complemented and normal aquaponic solutions.

2. Materials and Methods

Two identical trials (trial 1 and 2) were conducted between May and September 2015 in the climate-controlled experimental greenhouse of the Integrated and Urban Plant Pathology Laboratory of the University of Liège (Gembloux, Belgium, latitude 50°33′ N, longitude 4°41′ E, altitude 157 m). Trial 1 started on 21 May 2015 and trial 2 on 20 August 2015. The air temperature and relative humidity in the greenhouse were recorded every 30 min with a USB datalogger (MOINEAU Instruments, Chef-Boutonne, France) in order to control the similar climate conditions between trial 1 and 2. Light availability was dependent on the natural fluctuations of solar irradiance. The total accumulated solar radiant exposures measured from a local meteorological station (IRM-KMI Ernage, Gembloux, Belgium) were 316.21 and 180.94 MJ/m2 for trial 1 and 2, respectively. The experimental setup consisted of three identical nutrient film technique (NFT) systems (i.e., AeroFlo 28, GHE, Fleurance, France) that were exposed to the specific nutrient solutions. Each AeroFlo system comprised a sump that was connected to four NFT channels containing seven holes each. The total planting area was 1 m2 per system with a water volume of 100 L that was constantly recirculated by a submersible pump.
For both trials 15-day-old Latin-type lettuce seedlings (Lactuca Sativa ‘Sucrine’, Semailles, Faulx-Les-Tombes, Belgium) were placed into the AeroFlo and harvested after 36 days.
The AeroFlo systems were filled with a fresh 100 L solution on a weekly basis to maintain stable nutrient conditions for better reproducibility and comparison among treatments. In order to validate such stability, during trial 2 the water nutrient content of the one-week-old solution was sampled for analysis before spillage, and another sample of the fresh solution was taken directly after the refill.

2.1. Nutrient Solution Formulation and Control

To match the nutrient concentration targets high-purity mineral salts were added. The HP solution (i.e., the control) and the CAP solution were formulated to have their nutrient concentrations equal to conventional NFT lettuce nutrient solutions based on Resh [6]. The HP control solution was formulated with 100% rainwater and the added high-purity mineral salts. The CAP solution consisted of 100% RAS water complemented with high-purity mineral salts to reach the same nutrient concentrations as in the HP control solution. The RAS water was taken directly from the sump of a running tilapia RAS fed with a 40% protein, 12% lipid, and 3.7% sugar feed (Omegabaars, Lambers-Seghers, Baasrode, Belgium). The water did not receive any treatment prior to being used in the AeroFlo system. The AP solution was designed to reproduce the macro- and micronutrient concentrations found in the single loop aquaponic system of the University of Virgin Islands (UVI) published in Rakocy et al. [13]. It was formulated with RAS water. The concentrations of several nutrients in RAS water were higher than the concentration targets. RAS water was, therefore, diluted 1:10 in rainwater, and high-purity mineral salts added to match the nutrient concentration targets. For all treatments, the pH was adjusted by adding HCl and Na2CO3. PH, electrical conductivity (EC) and nutrient concentration targets of the three solutions are presented in Table 1.
The RAS water macronutrient content was analyzed with a multiparameter spectrophotometer (HI 83200, HANNA instruments, Woonsocket, RI, USA) with the following reagents: HI 93700 (TAN), HI 93728 (NO3), HI 93717 (PO43−), HI 93751 (SO42−), HI 93750 (K+), HI 93752 (Ca2+), and HI 93752 (Mg2+). The macronutrient analysis allowed the calculation of salt quantities necessary to add to the AP and CAP solution formulations. Salt additions were calculated with the hydroponic-specific HydroBuddy free software (http://scienceinhydroponics.com/category/hydrobuddy) to match the target concentration values. Sulfate was used as a degree of freedom. For the first experimental week only half the quantities of salts were added in order to limit the EC and allow the seedlings to adapt to the nutrient solution and avoid osmotic shocks.
The mineral salts used for the macronutrients were MgSO4·7H2O, NH4NO3, K2HPO4, Ca(NO3)2·4H2O, KNO3, K2SO4, and HNO3 (65%), and for the micronutrients were Fe-EDTA, MnSO4·4H2O, CUSO4·5H2O, ZnSO4·7H2O, (NH4)6Mo7O24·4H2O, and H3BO3.
The water EC, dissolved oxygen (DO), temperature, and pH were controlled regularly. EC was recorded with a conductivity tester (AD31 Waterproof, ADWA, Szeged, Hungary). The DO and temperature were measured with a DO meter (HI 98193, HANNA instruments, Woonsocket, RI, USA), and pH with a pH-meter (Inolab pH level 1, WTW, Weilheim, Germany).
To assess water quality, the concentrations of P, K, Ca, Mg, S, Fe, Cu, Zn, B, Mo, Mn, and Na in AeroFlo solutions were measured during trial 2 with an ICP-OES (5100 VDV, Agilent Technologies, Santa Clara, CA, USA). Total ammonia nitrogen (TAN) was measured with a spectrophotometer (HI 83200, HANNA instruments, Woonsocket, RI, USA) using the reagent HI 93700 based on the Nessler method. NO3-N was measured with a Nanocolor standard test (Ref 918 65, Macherey-Nagel, Düren, Germany) using the 2,6-dimethylphenol method. Samples of 150 mL of solution were taken directly from the sump of each AeroFlo just before and just after weekly renewal of the solution. Samples were 0.45-μm-filtered (Acrodisc, Pall corporation, Portsmouth, UK) and frozen immediately after collection. They were analyzed for TAN within 24 h and for nitrate within 30 days. All measurements were performed in triplicate.
To detect potential differences in water composition among the used systems, the measured micro- and macronutrient concentrations and the key physiological macronutrient ratios (i.e., TAN:NO3-N, Ca:P, Ca:K, Ca:Mg) were analyzed using a repeated model because of week-dependent measurements. The model included the treatment as the fixed effect, the week as the repeated effect, and their corresponding interaction realized as shoot and root yields. All calculations used PROC GLM in SAS software (SAS 9.4., Cary, NC, USA), and a Duncan multiple-comparison was used to assess the significance of treatment differences. These differences are reported in this paper as least square (LS) means.

2.2. Lettuce Growth and Leaf Nutrient Content

During the lettuce harvests of trials 1 and 2, the weight of both shoots and roots were recorded and then analyzed by a one-way analysis of variance (ANOVA). The fixed variation factor was the treatment (i.e., AP, CAP, and HP).
The lettuce leaf nutrient content (P, K, Ca, Mg, S, Fe, Cu, Zn, B, Mo, Mn, and Na) was measured during trial 2 with an ICP-OES (5100 VDV, Agilent Technologies, Santa Clara, CA, USA). Prior to the ICP analysis, six lettuce plants per treatment were randomly chosen and were dried in an oven at 105 °C for 48 h, pulverized together, and acid-mineralized with 1:1 nitric (65%) and perchloric acid (70%). Nutrient content was analyzed by a one-way analysis of variance (ANOVA) using the treatment as the fixed effect. A Duncan multiple-comparison was used to assess the significance of treatment differences estimated using least square (LS) means. All calculations used PROC GLM in SAS software (SAS 9.4.).

3. Results

3.1. Shoot and Root Fresh Weight

In both trials, the average fresh weight of the harvested shoots from the CAP treatment was significantly higher (p < 0.05) than those observed for the AP and HP treatments, while no difference could be found between the latter two (p > 0.05) (Table 2). For both trials, the shoot weight of the CAP treatment showed a 39% higher growth rate compared to the HP treatment.
In both trials, no difference of root fresh weights could be found between the CAP and AP treatments, while the one observed for the HP treatment was significantly lower. However, the shoot:root ratio observed for CAP and HP were not different, while it was significantly lower for AP.
A two-fold difference in the harvested biomass between trial 1 and 2 was observed for all treatments. This finding may be explained mainly by different external environmental conditions that affected lettuce plant growth. The only substantially identified change was the total accumulation of solar radiant exposure, which was 316.21 and 180.94 MJ/m2 for trial 1 and 2, respectively. This uncontrolled parameter was nearly halved for trial 2 because of shorter daily light periods and cloudier days.

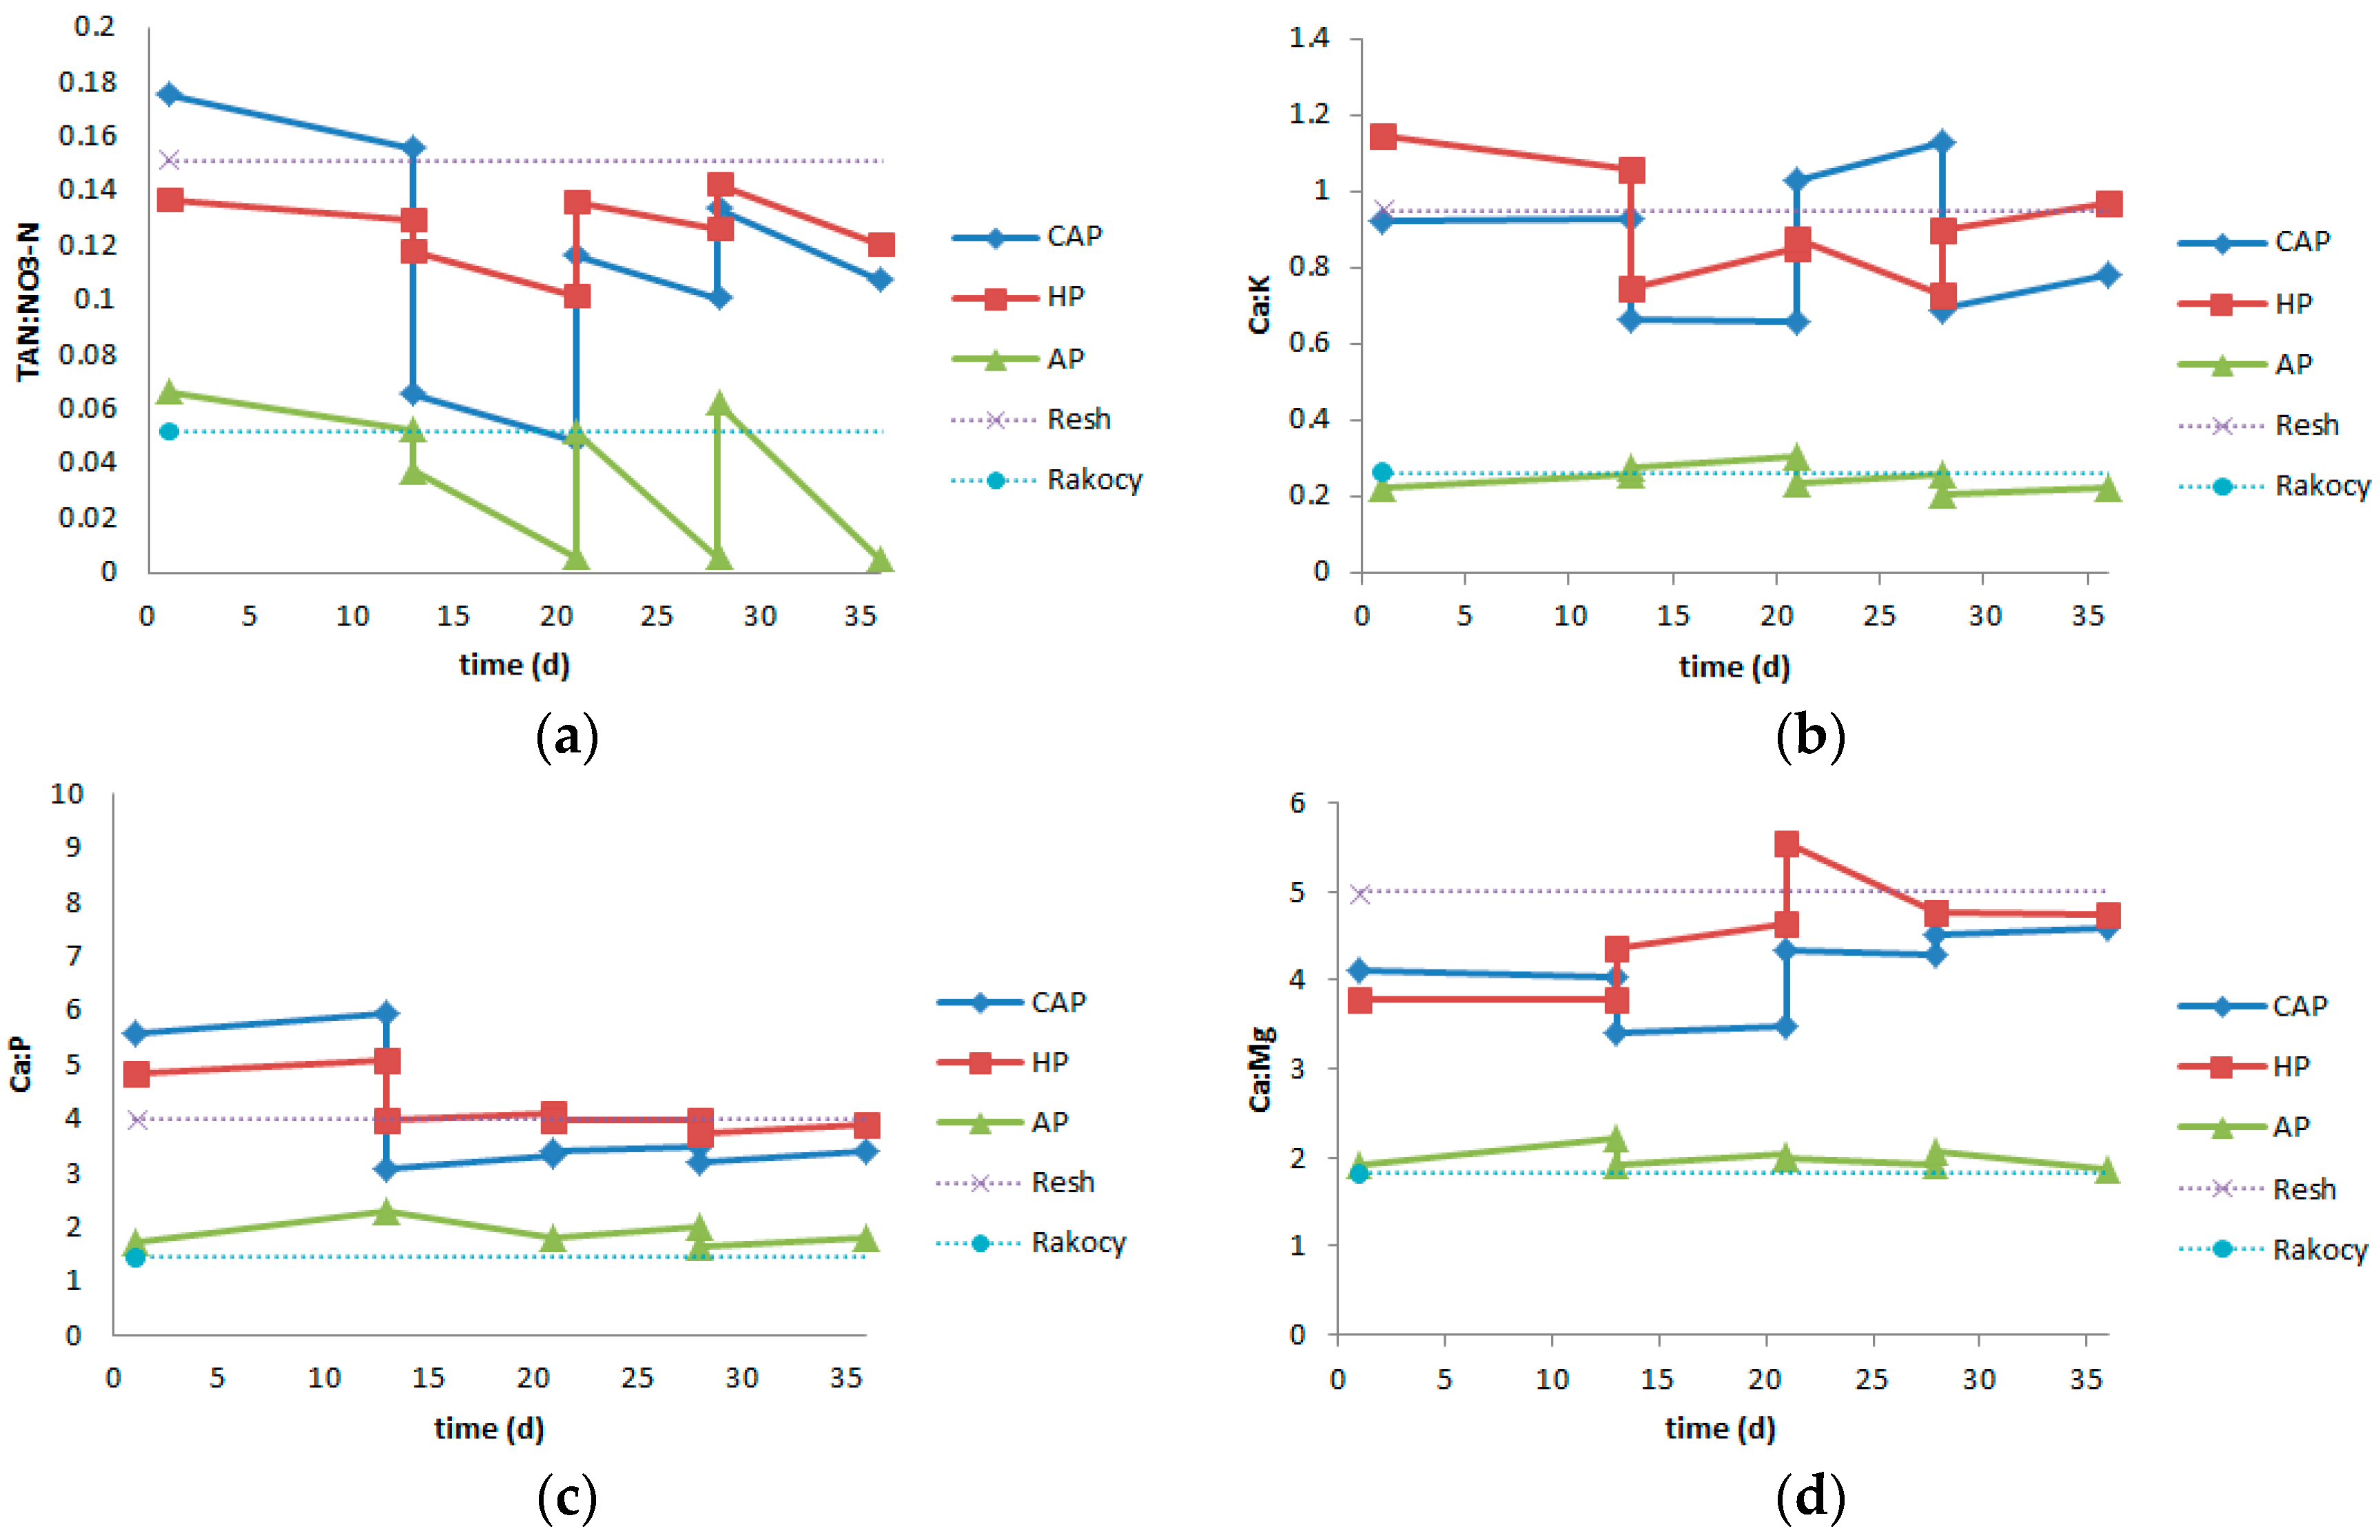
3.2. Nutrient Solutions

Within each trial, the environmental conditions affecting growth, such as water temperature, water DO, light intensity, air temperature, pH, and relative humidity, were similar with the exception of the pH value that was slightly different in the AP system (Table 3).
Water composition during trial 2 was assessed through the average of weekly LS means for each measured macro- and micronutrient in order to improve the clarity of results (Table 4). The averages of weekly LS means for all concentrations measured were close to the desired macronutrient target value for each treatment (Table 1). Depending on the nutritive mineral, AP treatment had four-to ten-fold lower macronutrient concentrations compared to the other treatments, whereas the micronutrient concentrations were similar in all treatments. Hence, the average EC was three to four times lower in the AP treatment compared to CAP and HP (Table 3).
The solution nutrient concentrations and macronutrient ratios for both CAP and HP treatments were compared for each sampling time (i.e., just before and just after weekly renewal of the solution) and were significantly different (data not shown). However, for trial 2 the differences recorded were on average 22, 2, 2, 29, 23, 31, and 0 mg/L for NO3-N, TAN, PO43−-P, SO42−-S, K+, Ca2+, and Mg2+, respectively. Only SO42−-S concentrations had a consistent difference in CAP compared to HP (i.e., approximately 30% lower in CAP) because sulfate was used as a degree of freedom for the adjustment of mineral concentrations, which is a common practice in hydroponic solution formulation [6].
The evolution of physiological ratios between macronutrient concentrations (Figure 1) calculated for each sampling time showed considerable smaller differences between CAP and HP than with AP treatment. For each treatment, the ratio tended to slightly increase between the fresh and the old solution. This was due to water evaporation, which was not balanced with the plant nutrient uptake. The exception was the TAN:NO3-N ratio that was systematically lower before solution exchange. Notably, these crucial ratios stayed closed to the targets throughout the experiment.
In this study, the Na+ concentrations were 6–9 times higher in both AP and CAP treatments compared to the HP treatment, with a maximum of 93.5 mg/L in the CAP system in trial 2. Substantial Na+ concentrations were present because some Na+ was present in the RAS water but mostly because, in CAP and AP solutions, Na2CO3 was used to control the pH, which tended to drop during aquaponic solution formulation and throughout the experiment.

3.3. Lettuce Leaf Nutrient Content

Leaf nutrient content showed a significant difference (p < 0.05) among each treatment for each nutrient, except for K between AP and HP, and B between CAP and HP (Table 5). The CAP lettuce leaves had a significantly (p < 0.05) higher macronutrient content for all nutrients. AP had the lowest content for each nutrient. With respect to the micronutrients, the contrasts were greater; Fe and Zn content were significantly higher (p < 0.05) in HP, while AP had the highest content of Mn and Mo.
The Na content showed the highest observed values in the AP treatment, closely followed by CAP. The Na content was almost 10 times higher in the AP than in the HP treatment.

4. Discussion

While the experiment was conducted to keep the pH, the macro- and micronutrient concentrations, and the macronutrient ratios of HP and CAP treatment in a very close range in order to have the water origin as the only difference (i.e., rain and RAS), a significant difference between most values of macro- and micronutrient concentrations was observed. Due to technical limitations, it is very difficult to obtain concentrations significantly similar in both solutions. However, lettuce growth differences between CAP and HP treatments must not be attributed to the concentration differences recorded and, especially, the small macronutrient ratio variations. Indeed, previous reports have shown that growth was not affected by the fluctuation of a given concentration of a specific nutrient in conditions where lettuce roots are directly exposed to the flowing nutrient solution (e.g., NFT and deep water culture (DWC)). Unlike in soil conditions, where there are both diffusion gradients and nutrient depletion, a given constant concentration can be maintained at the root surface. Consequently, nutrients can be absorbed at a constant rate regardless of the nutrient solution’s concentrations [18]. However, the concentrations must be maintained above a minimum threshold. Santos et al. [19] showed that by increasing the PO43−-P concentration, whilst keeping other nutrients constant, lettuce growth and final weight remained constant as long as the PO43−-P concentration exceeded 20 mg/L. Similar observations have been made previously in other plants for NO3-N with a minimum concentration threshold of 1 mg/L [20,21,22]. Letey et al. [23] reported no significant differences on average shoot and root fresh weight of Romaine lettuce cultivated in DWC for 26 days with different NO3-N concentrations (i.e., from 5 to 105 mg/L).
In both trials a similar shoot mass between AP and HP treatment was recorded. In line with previous studies [15,16] these results confirm AP systems as an alternative to conventional hydroponic systems, producing similar yields. Importantly, this study shows that considerable lower nutrient concentrations and different macronutrient ratios in AP solution did not alter yields. When the RAS water was complemented (i.e., CAP treatment) to reach nutrient concentrations and macronutrient ratios close to the HP control solution, to our surprise, 39% higher shoot mass was obtained in both trials. These results indicate that a 39% yield increase can be achieved if lettuces are grown in RAS water where mineral salts are added and pH kept around 5.5. Such production implicates a specific design that could be achieved with DAPS [4,5].
Trial 2 had lower yields in all treatments. This reduced growth was due to lower light intensity and is a well-known phenomenon. Burns et al. [24] confirmed these results by reporting that lettuce yield in fresh weight was halved in their 28-day trial when reducing the light intensity by 50%, which was close to the light intensity reduction measured for trial 2. Sucrine is a Latin-type lettuce that is close to the Bibb butterhead type lettuce [25]. The biomass of the sucrine lettuce obtained in HP treatment in trial 1 was 98.2 g per shoot, which is in the range of Bibb lettuce produced in hydroponics with Resh’s solution [26].
The shoot:root ratio in AP treatment was significantly lower than in CAP, but CAP and AP treatment had similar root mass. Hence, the lettuce produced less shoot mass in the AP solution. This could have been due to a higher pH and/or to unfavorable nutrient ratios that hindered lettuce nutrient uptake and then limited shoot growth. Interestingly, the shoot:root ratio was similar for both HP and CAP treatments. The increase in shoot mass for CAP seems thus to be related to an increase in root mass. It can be suspected that this increase in root mass has been influenced by others factors that were present in solution rather than the observed small differences in the nutrient concentrations.
The lettuce leaf nutrient content supports these assumptions. The low nutrient content in the leaves of the AP treatment indicates less favorable nutrient solution for nutrient uptake. Leaves in the CAP treatment had higher nutrient content. This could be correlated to the water’s EC. However, it is not certain that the small difference in average ECs of 75 μS/cm between CAP (2493 μS/cm) and HP (2418 μS/cm) can explain this; other factors present in the RAS water might have boosted the nutrient uptake and the shoot and root mass.
The superiority of shoot weight and nutrient uptake in CAP treatment, and especially the superiority of root weight in both AP and CAP treatments compared to the HP treatment (Table 2), indicate that RAS water must contain factors that stimulate root growth. Presumably, these factors also stimulate the nutrient uptake. Two factors having a plant growth-promoting effect can be assumed to be present in RAS water: (1) dissolved organic matter (DOM), and (2) plant growth-promoting rhizobacteria and/or fungi (PGPR and/or PGPF). Several humic-like and protein-like DOM components have been identified that tend to accumulate in RAS water [27]. Humic acids, such as fulvic acid, and also certain phenolics can increase shoot and root growth as well as root ATPase activity [28,29,30,31]. Haghiaghi [32] showed that humic acid added to a hydroponic solution was also able to improve the nitrogen metabolism and photosynthetic activity of lettuce, which leads to an improved yield. Similar to DOM, PGPR were also identified to be able to promote plant growth and improve root development. PGPR can release phytohormones or induce hormonal changes within plants that stimulate plant cell elongation and division [33]. Mangmang et al. [34] inoculated Azospirillum brasilense to lettuce grown on perlite/vermiculite substrate irrigated with fish effluent. The author recorded an increase in endogenous levels of indole-3-acetic acid (IAA), peroxidase activity, total leaf chlorophyll, and protein content in lettuce. IAA is known to regulate biochemical signals controlling plant growth and development. A special focus on DOM and PGPR occurring in water is, thus, required to better understand their impact and potential for improving plant production in aquaponics.
Interestingly, while Na+ concentrations were considerably higher in the AP and the CAP treatments, this did not seem to have a negative effect on lettuce growth. Moreover, the Na content in the leaves of these treatments highlights the ability of lettuce to absorb some Na+ and subsequently remove it from aquaponic water. These conclusions are important because substantial Na+ concentrations in aquaponic waters occur and are unavoidable due to Na release by the fish [35]. Na tolerance and assimilation in lettuce should be more specifically studied in aquaponics in order to define the Na+ toxic threshold.

5. Conclusions

The purpose of the current study was to determine differences in growth rates when exposing lettuce plants to normal (i.e., AP), CAP, and HP solutions. The findings of this study indicated that there was a significantly higher growth rate in the CAP treatment. These findings highlight the potential usefulness of aquaponic systems because it was previously considered that the decisive competitive advantage of HP systems was the enhanced growth potential. This research has demonstrated that aquaponic systems could surpass the growth rates found in conventional HP systems. Notably, with respect to the increasing scarcity of phosphorus [36], it is remarkable that, in AP solution, significantly lower nutrient concentrations gave equivalent yields to HP solution.
From these results, we can conclude that the application of RAS water stimulates both root and shoot growth. It is difficult to ascertain which mechanism led to the increase in this particular case but microorganisms and DOM are suspected to play an important role. A special emphasis should be placed on the DOM species present, their effect on plant growth, and their optimal concentrations. Additionally, microbiota available in both water and the rhizosphere should be identified; it can be assumed that they host efficient growth-promoting rhizobacteria and/or fungi.

Acknowledgments

The authors would like to acknowledge networking and publication support by COST Action FA1305—The EU Aquaponics Hub—Realizing Sustainable Integrated Fish and Vegetable Production for the EU. The first author would like to thank François-Xavier Biot for help with experiment maintenance and also the UCL and Ronny Santoro for ICP analysis.

Author Contributions

Boris Delaide, Simon Goddek and M. Haissam Jijakli conceived and designed the experiments; Boris Delaide and James Gott performed the experiments; Boris Delaide and Hélène Soyeurt analyzed the data; M. Haissam Jijakli contributed for reagents, materials and analysis tools; Boris Delaide and Simon Goddek, M. Haissam Jijakli wrote the paper. James Gott corrected the English.

Conflicts of Interest

The authors declare no conflict of interest. The founding sponsors had no role in the design of the study; in the collection, analyses, or interpretation of data; in the writing of the manuscript, and in the decision to publish the result.

References

  1. Goddek, S.; Delaide, B.; Mankasingh, U.; Ragnarsdottir, K.; Jijakli, H.; Thorarinsdottir, R. Challenges of Sustainable and Commercial Aquaponics. Sustainability 2015, 7, 4199–4224. [Google Scholar] [CrossRef]
  2. Endut, A.; Jusoh, A.; Ali, N.; Nik, W.B.W.; Hassan, A. A study on the optimal hydraulic loading rate and plant ratios in recirculation aquaponic system. Bioresour. Technol. 2010, 101, 1511–1517. [Google Scholar] [CrossRef] [PubMed]
  3. Graber, A.; Junge, R. Aquaponic Systems: Nutrient recycling from fish wastewater by vegetable production. Desalination 2009, 246, 147–156. [Google Scholar] [CrossRef]
  4. Goddek, S.; Espinal, C.; Delaide, B.; Jijakli, H.M.; Schmautz, Z.; Wuertz, S.; Keesman, K.J. Navigating towards Decoupled Aquaponic Systems: A System Dynamics Design Approach. Water 2016, 8, 303. [Google Scholar] [CrossRef]
  5. Kloas, W.; Groß, R.; Baganz, D.; Graupner, J.; Monsees, H.; Schmidt, U.; Staaks, G.; Suhl, J.; Tschirner, M.; Wittstock, B.; et al. A new concept for aquaponic systems to improve sustainability, increase productivity, and reduce environmental impacts. Aquac. Environ. Interact. 2015, 7, 179–192. [Google Scholar] [CrossRef]
  6. Resh, H.M. Hydroponic food Production: A Definitive Guidebook for the Advanced Home Gardener and the Commercial Hydroponic Grower; CRC Press: Boca Raton, FL, USA, 2012. [Google Scholar]
  7. Sonneveld, C.; Voogt, W. Nutrient Solutions for Soilless Cultures. In Plant Nutrition of Greenhouse Crops; Springer: Houten, The Netherlands, 2009; pp. 257–275. [Google Scholar]
  8. Jones, B.J. Hydroponics—A Practical Guide for the Soilless Grower, 2nd ed.; CRC Press: Boca Raton, FL, USA, 2005. [Google Scholar]
  9. Savvas, D.; Passam, H.C.; Olympios, C.; Nasi, E.; Moustaka, E.; Mantzos, N.; Barouchas, P. Effects of ammonium nitrogen on lettuce grown on pumice in a closed hydroponic system. HortScience 2006, 41, 1667–1673. [Google Scholar]
  10. Sonneveld, C. Composition of nutrient solutions. In Hydroponic Production of Vegetables and Ornamentals; Embryo Publisher: Athens, Greece, 2002; pp. 179–210. [Google Scholar]
  11. Polomski, R.F. South Carolina Master Gardener Training Manual. Master’s Thesis, Clemson University, Clemson, SC, USA, 2007. [Google Scholar]
  12. Lucas, R.E.; Davis, J.F. Relationships between pH values of organic soils and availabilities of 12 plant nutrients. Soil Sci. 1961, 92, 177–182. [Google Scholar] [CrossRef]
  13. Rakocy, J.E.; Shultz, R.C.; Bailey, D.S.; Thoman, E.S. Aquaponic production of tilapia and basil: Comparing a batch and staggered cropping system. Acta Hortic. 2004, 648, 63–69. [Google Scholar] [CrossRef]
  14. Sonneveld, C.; Voogt, W. Nutrient Management in Substrate Systems. In Plant Nutrition of Greenhouse Crops; Springer: Houten, The Netherlands, 2009; pp. 277–312. [Google Scholar]
  15. Licamele, J.D. Biomass Production and Nutrient Dynamics in an Aquaponics System. Ph.D. Thesis, The University of Arizona, Tucson, AZ, USA, 2009; p. 172. [Google Scholar]
  16. Pantanella, E.; Cardarelli, M.; Colla, G.; Rea, E.; Marcucci, A. Aquaponics vs. hydroponics: Production and quality of lettuce crop. Acta Hortic. 2012, 927, 887–893. [Google Scholar] [CrossRef]
  17. Setting Maximum Levels for Certain Contaminants in Foodstuffs; Commission Regulation (EC) No. 1881/2006; The Commission of the European Communities: Brussel, Belgium, December 2006; pp. 5–24.
  18. Olsen, C. The significance of concentration on the rate of ion absorption by higher plants in water culture. Physiol. Plant 1950, 3, 152–164. [Google Scholar] [CrossRef]
  19. Santos, B.M.; Dusky, J.A.; Stall, W.M.; Bewick, T.A.; Shilling, D.G.; Gilreath, J.P.; Santos, B.M.; Stall, W.M.; Bewick, T.A.; Shilling, D.G. Phosphorus absorption in lettuce, smooth pigweed (Amaranthus hybridus), and common purslane (Portulaca oleracea) mixtures. Weed Sci. 2004, 52, 389–394. [Google Scholar] [CrossRef]
  20. Clement, C.R.; Hopper, M.J.; Jones, L.H.P. The uptake of nitrate by Lolium perenne from flowing nutrient solution I. Effect of NO3 concentration. J. Exp. Bot. 1978, 29, 453–464. [Google Scholar] [CrossRef]
  21. Edwards, J.H.; Barber, S.A. Nitrogen uptake characteristics of corn roots at low N concentration as influenced by plant age. Agron. J. 1976, 68, 17–19. [Google Scholar] [CrossRef]
  22. Warncke, D.D.; Barber, S.A. Nitrate uptake effectiveness of four plant species. J. Environ. Qual. 1974, 3, 28–30. [Google Scholar] [CrossRef]
  23. Letey, J.; Jarrell, W.M.; Valoras, N. Nitrogen and water uptake patterns and growth of plants at various minimum solution nitrate concentrations. J. Plant Nutr. 1982, 5, 73–89. [Google Scholar] [CrossRef]
  24. Burns, I.G.; Zhang, K.; Turner, M.K.; Edmondson, R. Iso-Osmotic Regulation of Nitrate Accumulation in Lettuce. J. Plant Nutr. 2010, 34, 283–313. [Google Scholar] [CrossRef]
  25. Mou, B. Lettuce. In Vegetables I; Springer: New York, NY, USA, 2008; Volumn 1, pp. 75–116. [Google Scholar]
  26. Waterer, D.; Bertelsen, S. Evaluation of Bibb (Butterhead) Lettuce for Hydroponic Production in Saskatchewan Greenhouses; University of Saskatchewan: Saskatoon, SK, Canada, 2014. [Google Scholar]
  27. Hambly, A.C.; Arvin, E.; Pedersen, L.-F.; Pedersen, P.B.; Seredyńska-Sobecka, B.; Stedmon, C.A. Characterising organic matter in recirculating aquaculture systems with fluorescence EEM spectroscopy. Water Res. 2015, 83, 112–120. [Google Scholar] [CrossRef] [PubMed]
  28. Canellas, L.P.; Spaccini, R.; Piccolo, A.; Dobbss, L.B.; Okorokova-Façanha, A.L.; de Araujo Santos, G.; Olivares, F.L.; Façanha, A.R. Relationships Between Chemical Characteristics and Root Growth Promotion of Humic Acids Isolated From Brazilian Oxisols. Soil Sci. 2009, 174, 611–620. [Google Scholar] [CrossRef]
  29. Mylonas, V.A.; McCants, C.B. Effects of humic and fulvic acids on growth of tobacco I. Root initiation and elongation. Plant Soil 1980, 54, 485–490. [Google Scholar] [CrossRef]
  30. Pingel, U. The Influence of Phenolic Promotors and Inhibitors of IAA-Oxidase-Activity on the Induction of Adventitious Roots in Tradescantia albiflora. Z. Pflanzenphysiol. 1976, 79, 109–120. [Google Scholar] [CrossRef]
  31. Wilson, P.J.; Van Staden, J. Rhizocaline, rooting co-factors, and the concept of promotors and inhibitors of adventitius rooting—A review. Ann. Bot. 1990, 66, 479–490. [Google Scholar]
  32. Haghighi, M.; Kafi, M.; Fang, P. Photosynthetic Activity and N Metabolism of Lettuce as Affected by Humic Acid. Int. J. Veg. Sci. 2012, 18, 182–189. [Google Scholar] [CrossRef]
  33. Ruzzi, M.; Aroca, R. Plant growth-promoting rhizobacteria act as biostimulants in horticulture. Sci. Hortic. (Amsterdam) 2015, 196, 124–134. [Google Scholar] [CrossRef]
  34. Mangmang, J.S.; Deaker, R.; Rogers, G. Response of lettuce seedlings fertilized with fish effluent to Azospirillum brasilense inoculation. Biol. Agric. Hortic. 2014, 31, 61–71. [Google Scholar] [CrossRef]
  35. Vermeulen, N.V.J. Recirculation Aquaculture System (RAS) with Tilapia in a Hydroponic System with Tomatoes. Acta Hortic. 2012, 927. [Google Scholar] [CrossRef]
  36. Ulrich, A.E.; Frossard, E. On the history of a reoccurring concept: Phosphorus scarcity. Sci. Total Environ. 2014, 490, 694–707. [Google Scholar] [CrossRef] [PubMed]
Figure 1. LS mean of macronutrient concentration ratio evolution in complemented aquaponic (CAP), hydroponic (HP), and aquaponic (AP) treatments during trial 2. Resh’s and Rakocy’s ratios are given for comparison. (a) TAN to NO3-N ratio; (b) Ca2+ to K+ ratio; (c) Ca2+ to P ratio; (d) Ca2+ to Mg2+ ratio.
Water 08 00467 g001
Table 1. Optimal nutrient solutions for lettuce growth using nutrient flow technique (NFT) and in the University of the Virgin Islands (UVI) system.
SystempHECNO3-NNH4+-NPO43−-PK+Ca2+Mg2+SO42−-SFe2+
mS/cmmg/L
Hydroponics (NFT) [6]5.5–5.81.5–2.01652550210200401135
Aquaponics (UVI) [13]7.0–7.60.7–0.842.22.28.244.911.96.5152.5
Table 2. LS means of shoot and root fresh weight and shoot:root ratio of harvested lettuce.
Treatment 1(N) 2Shoot Fresh Weight (g/Plant) 3Root Fresh Weight (g/Plant)Log10 (Shoot:Root)
Trial 1
CAP26136.28 a4.86 a1.47 a
HP2698.17 b3.58 b1.47 a
AP2580.55 b5.80 a1.14 b
Significance *** 4****
Trial 2
CAP2455.05 a1.71 a1.52 a
HP2039.64 b1.08 b1.53 a
AP2535.72 b1.52 a1.39 b
Significance ******
Notes: 1 CAP: complemented aquaponic solution, HP: hydropoonic solution, AP: aquaponic solution; 2 (N): number of observations; 3 Within columns, LS means followed by different letters (a, b) are significantly different at the 0.05 level; 4 *, **, *** Equal significance level of p < 0.05, p < 0.01 and p < 0.001, respectively.
Table 3. Growth environmental conditions for trial 1 and 2.
pH 1EC (μS/cm)DO (mg/L)Water T (°C)Air T (°C)Air RH (%)
CAPHPAPCAPHPAPCAPHPAPCAPHPAPGHGH
Trial 1Mean5.595.737.3226062453823- 4--20.0121.0719.6022.8458.21
SD 20.690.450.50297206163---1.461.281.433.7814.69
(N) 3211418779---10101044614461
Min4.304.766.5022362189630---17.5018.6017.2015.6027.20
Max7.556.568.20294527101014---22.3022.5021.4035.6086.90
Trial 2Mean5.875.777.50249324186427.517.147.3620.6820.9622.2822.1571.29
SD0.430.340.25116140480.340.530.321.391.260.962.5810.26
(N)192017991610101015161511621162
Min5.245.327.10231822375676.926.126.9119.1019.5020.9018.5037.90
Max6.846.807.94265626727497.917.827.9224.7024.8025.0033.2088.30
Notes: 1 CAP: complemented aquaponic solution, HP: hydropoonic solution, AP: aquaponic solution, GH: greenhouse; 2 SD: standard deviation; 3 (N): number of observations; 4 Missing data.
Table 4. Average of the LS mean of macro- and micronutrients concentration in CAP, HP, and AP treatments for trial 2 (mg/L).
ElementTreatment 1(N) 2AverageSD 3MinMax
NO3-NCAP6215.5428.13164.00245.80
HP6193.2912.35181.23211.55
AP850.311.8046.5752.39
TANCAP425.793.0922.8329.87
HP623.952.5120.5326.67
AP81.821.350.253.32
PO43−-PCAP652.662.4250.0356.27
HP550.934.4744.2055.57
AP67.830.527.068.49
SO42−-SCAP666.726.9757.3377.60
HP595.364.7287.7799.97
AP810.991.179.2412.30
K+CAP6219.3139.46169.13260.60
HP5242.2736.69212.67295.90
AP859.517.8948.8773.03
Ca2+CAP6175.0914.87154.43192.63
HP4205.6812.58192.30217.27
AP814.722.0312.7319.07
Mg2+CAP643.024.4436.7049.40
HP543.113.1539.1345.83
AP87.360.646.768.56
Fe3+CAP64.400.204.194.69
HP53.830.293.394.11
AP83.471.051.584.33
B3+CAP60.590.030.540.63
HP50.510.080.370.59
AP80.470.130.240.60
Cu+CAP60.120.010.110.13
HP50.090.010.070.11
AP80.090.030.050.12
Mn2+CAP60.660.060.580.73
HP50.640.100.480.75
AP40.500.120.320.60
Mo+CAP60.330.020.290.35
HP50.320.040.250.36
AP80.320.100.140.41
Zn2+CAP60.160.030.110.19
HP50.150.010.130.16
AP80.140.030.110.19
Na+CAP671.6718.2440.2093.53
HP57.954.524.2213.77
AP849.7320.985.0174.37
Notes: 1 CAP: complemented aquaponic solution, HP: hydroponic solution, AP: aquaponic solution; 2 (N): number of observations; 3 SD: standard deviation.
Table 5. LS mean of lettuce leaf nutrient content in trial 2.
Treatment 1(N) 2P 3KCaMgSNaFeBCuZnMnMo
AP35.47 a
(0.02)
24.6 a
(0.0)
6.36 a
(0.01)
2.28 a
(0.00)
1.97 a
(0.01)
3.70 a
(0.00)
739 a
(5)
8.1 a
(0.1)
12.6 a
(0.1)
37.0 a
(0.3)
1343 a
(3)
26.5 a
(0.1)
CAP39.25 b
(0.01)
29.8 b
(0.1)
11.3 b
(0.0)
3.36 b
(0.01)
2.75 b
(0.01)
2.80 b
(0.01)
935 b
(4)
19.4 b
(0.1)
20.2 b
(0.2)
69.1 b
(0.8)
208 b
(2)
19.8 b
(0.3)
HP38.56 c
(0.02)
24.7 a
(0.1)
10.8 c
(0.0)
3.00 c
(0.01)
2.56 c
(0.01)
0.40 c
(0.00)
1511 c
(4)
19.3 b
(0.1)
15.3 c
(0.1)
102 c
(0)
202 c
(1)
19.0 c
(0.1)
Significance *** 4*********************************
Notes: 1 AP: aquaponic solution, CAP: complemented aquaponic solution, HP: hydroponic solution; 2 (N): number of observations; 3 Within columns, LS means followed by different letters (a, b, c) are significantly different at the 0.05 level. Na and macroelements are reported in mg/gDM and microelements in μg/gDM. Standard deviations are between brackets; 4 *, **, *** Equal significance level of p < 0.05, p < 0.01 and p < 0.001, respectively.

