1. Introduction
Aerated treatment wetlands have become an increasingly recognized technology for treating wastewaters from domestic and various industrial origins under different climate conditions [
1,
2,
3,
4,
5]. The main advantage of this technology is its high oxygen supply to the microbial community present, which enables increased rates of aerobic microbial degradation of pollutants. As wastewater discharge standards become increasingly stringent, aerated treatment wetlands offer effective removal of key pollutants such as organic carbon, ammonium nitrogen, and pathogens [
6,
7,
8,
9] and also have a reduced land requirement compared to conventional treatment wetland designs [
10]. Aerated treatment wetlands have higher operation costs compared to passive treatment wetland designs. However, compared to a conventional activated sludge wastewater treatment technology, aerated wetlands have lower operation costs [
11].
Electrical energy is the conventional source of power for air blowers in aerated treatment wetlands. The source of the electrical energy, which is often fossil fuels, affects the ecological footprint of the treatment system. Several attempts have been made to decrease the energy demand for air supply by using intermittent [
12,
13,
14] and spatial [
15] aeration patterns. Aerated wetlands require the existence of centralized electrical infrastructure in order to operate. However, access to the energy grid may not be available in remote areas such as campgrounds, rural communities, or in less developed countries. When considered in conjunction with the concept of decentralized wastewater treatment, effective wastewater treatment technologies that can be operated without a connection to the energy grid are advantageous. Locally available renewable energy should be exploited wherever possible.
Wind power offers a promising possibility for wetland aeration but its use in this context has not yet been investigated. Electricity production from wind power generally occurs only on a large scale. Thus, an aerated wetland driven by electrical energy from wind power would still require some sort of infrastructure to be connected to the grid. On the contrary, small-scale mechanical wind power stations are readily available on the market and are often, for example, used to aerate fish farm ponds. Qin et al. [
16] reports the use of such a device to drive a reverse osmosis system treating aquaculture wastewater. This demonstrates that the concept of decentralized energy production to operate decentralized wastewater treatment systems is plausible, and thus could also be applied to aerated treatment wetlands.
From an economic perspective, the concept of wind-powered aeration simply sees the transfer of the cost associated with the purchase of the electric pump and the cost of electricity and maintenance over the life of the system replaced with the capital cost of the wind-powered air pump. Depending on the life span of an aerated treatment wetland, wind-powered aeration could be economically favorable over the long term. In theory, small-scale wind power stations could be constructed with local materials and should be specifically adapted to wetland aeration, further improving the ecological and economical sustainability of the treatment system. Wind speed fluctuations are likely to result in intermittent aeration, which has been shown to improve total nitrogen removal [
12,
13,
14], and thus perhaps not be a detriment to treatment.
Aerated treatment wetlands are generally operated with saturation and configured as either horizontal or vertical flow. The internal hydraulics of these two designs are different. Aerated vertical down-flow systems have been reported to be extremely well mixed along the vertical direction, as a result of the counter-movement of water and air, and exhibit hydraulics similar to that of one continuously stirred tank reactor [
12]. Horizontal flow wetlands, on the other hand, exhibit hydraulics similar to that of three to five tanks-in-series, which is due to the different dimensions of the wetland and the fact that the direction of flow and the movement of air bubbles are perpendicular to one another [
17]. In the end, the variation in the distribution of retention times in horizontal systems is smaller, which reduces the possibility of inflow to be transferred to the outlet too quickly. Therefore, the hydraulic behavior of a horizontal-flow aerated wetland will effectively reduce the risk of short-circuiting. This may be important to consider for a treatment wetland with a wind-driven aeration system with respect to variable wind speeds. For this reason, the investigation was performed on a horizontal-flow aerated wetland.
In order to retain the benefits of wetland aeration while eliminating the need for ongoing electricity costs, the current study investigated a wind-powered mechanical air pump that replaces the electrical-driven aeration device of an aerated horizontal subsurface flow wetland. The main objectives of this study were to assess the suitability of a wind-driven air pump for a horizontal aerated wetland treating primarily settled domestic sewage, and to compare treatment performance of a wind-driven aerated wetland to that of a wetland aerated continuously with an electric-powered air pump regarding the removal of organic carbon, nitrogen and pathogens. This paper will discuss the lessons learned during the experiment and the challanges of wind-driven wetland aeration.
2. Materials and Methods
2.1. Experimental Design
The experimental work was conducted at the Ecotechnology Research Facility of the Helmholtz Center for Environmental Research (UFZ) in Langenreichenbach, Germany. The site description is provided in detail in Nivala et al. [
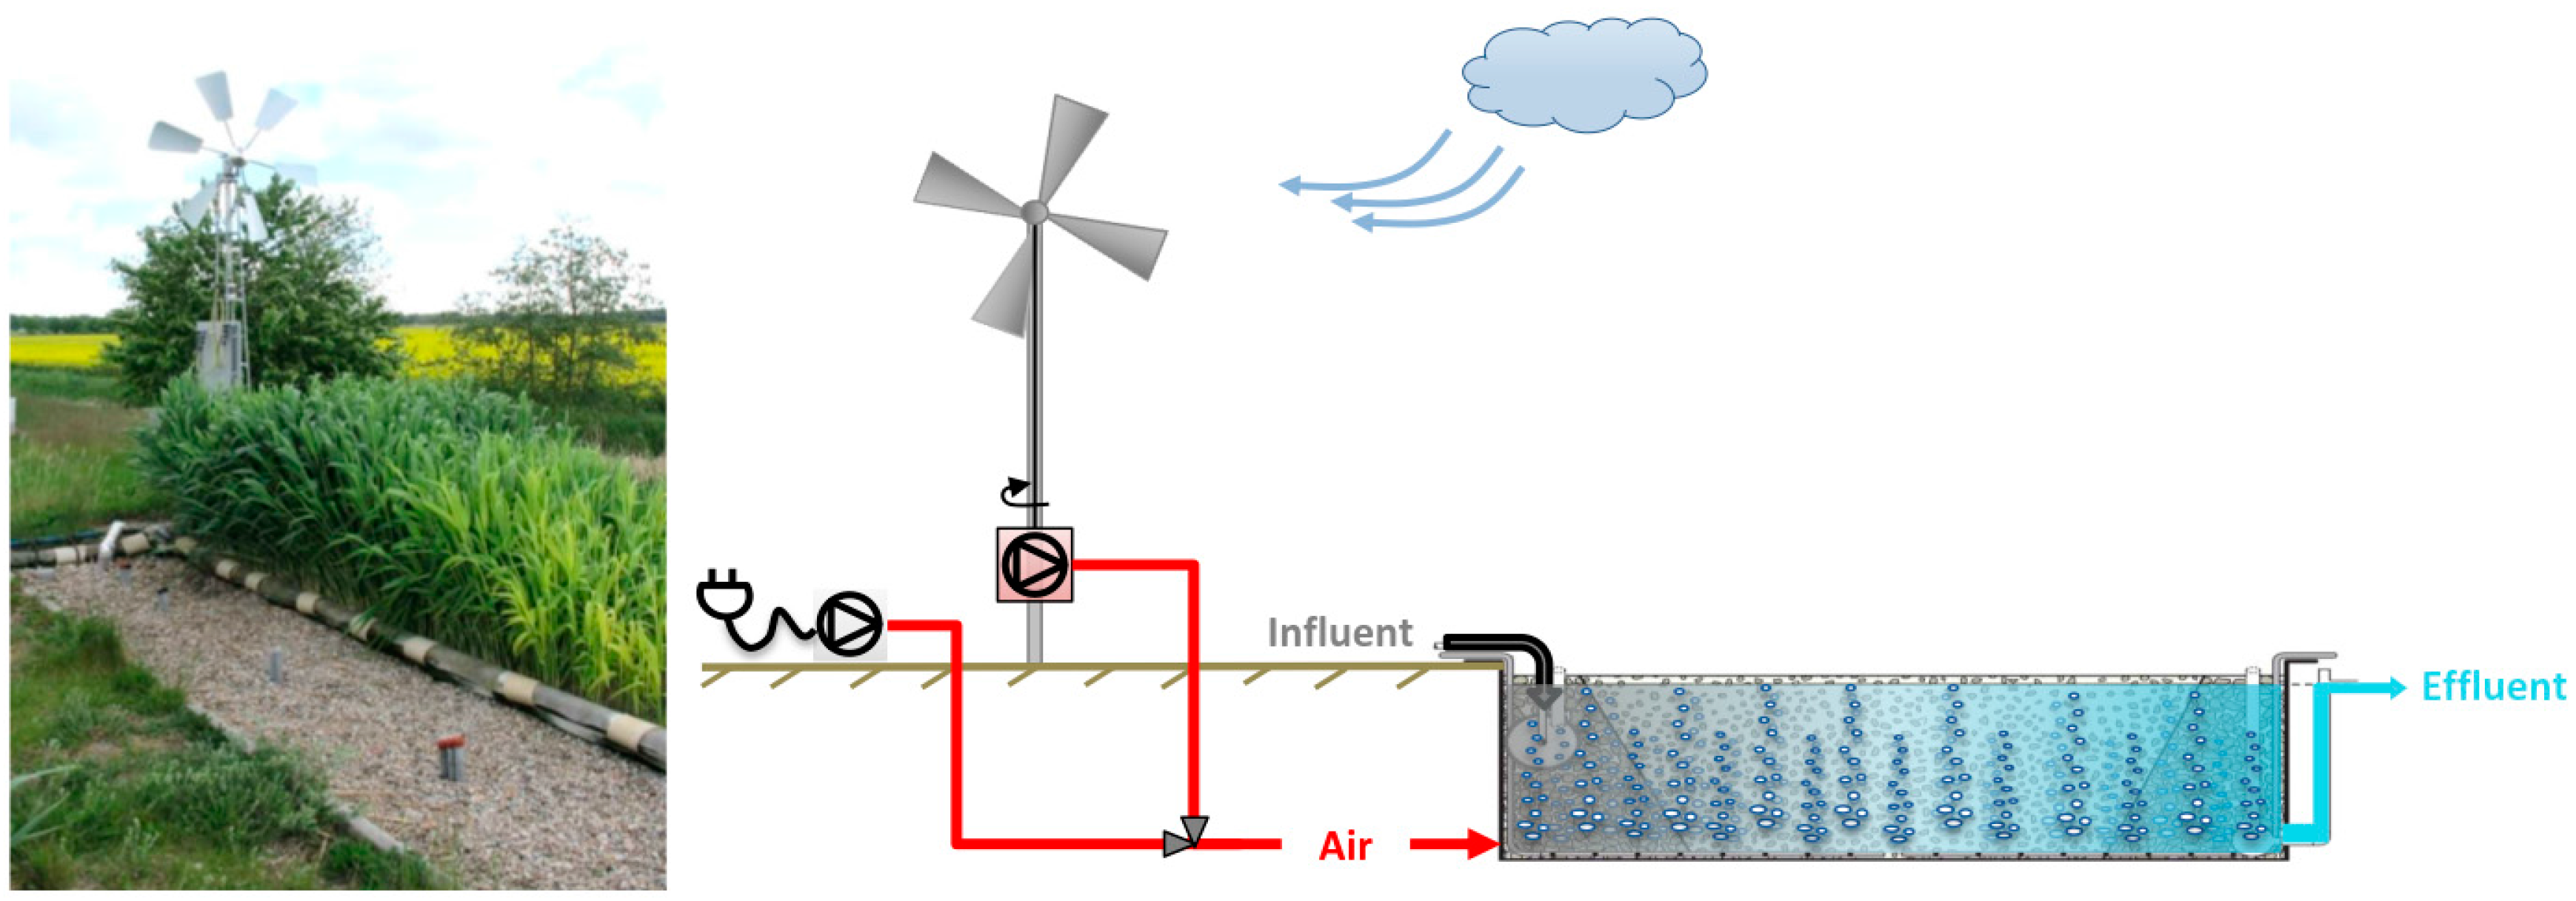
18]. In principle, the experiment consisted of three monitoring phases of the same aerated treatment wetland: (1) continuous 24 h aeration provided by two electricity-powered air pumps; (2) wind-powered aeration at the original hydraulic loading rate, and (3) wind-powered aeration at a reduced hydraulic loading rate. The basic setup of the experimental pilot system is shown in
Figure 1. The aerated wetland system measured 1.2 m in width by 4.7 m in length with a saturated depth of 1 m. The bed media was gravel (8–16 mm as main media, 16–32 mm in the inlet and outlet zones). The system was not planted with any vegetation. Aeration was provided by an aeration system according to Wallace [
19]. During phase one, electric aeration was realized using two diaphragm pumps (Mistral 2000, Aqua Medic, Bissendorf, Lower Saxony, Germany). Pretreatment of raw domestic wastewater was achieved in a settling tank with a nominal hydraulic retention time (nHRT) of 3.5 days. The settled sewage was then pumped every 30 min to the experimental system, at a daily hydraulic loading rate of 130 L·m
−2·d
−1. The treatment wetland was established in September 2009 and started operation with electrical aeration in June 2010.
The wind-driven air pump was a conventional six-blade wind rotor (d = 1.5 m, collar height = 3 m) with a piston pump that was mechanically connected through a bevel drive. Polyethylene (PE) pipes (d = 32 mm) were used to couple the piston pump to the aeration system.
Monitoring of the experimental wetland was conducted from August 2010 to August 2014. In July 2012, the aeration device of the test system was changed from the electrical blower to the wind-driven air pump. The hydraulic loading rate of 130 L·m−2·d−1 remained the same. In August 2013, the hydraulic loading rate was reduced to 65 L·m−2·d−1.
2.2. Experimental Procedure
2.2.1. Wind Speed and Air Flow Measurement
Measurement of wind speed was recorded as 10 min averages during the entire monitoring period by a weather station (3.5 m above the ground) at the experimental site. Evaluating the relationship between the air flow generated by the wind-driven air pump at a certain level of wind speed was not straightforward. Such a small wind power station is easily affected by quick and/or intense changes in wind speed and direction. Sometimes the wind rotor juddered around like a flag in the wind. The direct mechanical coupling to the piston pump transferred this fluctuation to the generated air flow, which contributes to the existing variability in air flow rate that results from the up-and-down motion of the piston. A thermal mass flow meter (TSI 4043, TSI GmbH, Aachen, Northrhine-Westfalia, Germany) combined with a high-resolution data logger with a sampling frequency of 32 Hz (HandyLogV/C -rugged-, Driesen+Kern GmbH, Bad Bramstedt, Schleswig-Holstein, Germany) was used to assess air flow rates. For the measurements, the air pump was connected to a pipe with an open end, in order to make a measurement without the back pressure of the wetland aeration system. Several technical and logistical difficulties did not allow the quantification of the air flow while the wind-driven pump was connected to the wetland aeration system. A measurement campaign consisted of several days of monitoring air flow and wind speed simultaneously, which sometimes included a couple of days waiting for wind.
2.2.2. Sampling and Water Quality Analysis
For logistical reasons, a quasi-weekly sampling routine was established. Grab samples were taken from the influent and effluent of the experimental treatment wetland and analyzed for redox potential (ORP, Multi 350i, SenTix® ORP, WTW, Weilheim, Bavaria, Germany), dissolved oxygen (DO, Multi 350i, CellOx 325, WTW, Weilheim, Bavaria, Germany), five-day carbonaceous biochemical oxygen demand (CBOD5, DIN 38409 H52, OxiTOP®, WTW, Weilheim, Bavaria, Germany), total organic carbon (TOC, DIN EN 1484, TOC-VCSN, Shimadzu Deutschland GmbH, Duisburg, Northrhine-Westfalia, Germany), total nitrogen (TN, DINEN 12660, TNM-1, Shimadzu Deutschland GmbH, Duisburg, Northrhine-Westfalia, Germany), ammonia nitrogen (NH4-N, DIN 38 406 E5, EPOS ANALYZER 5060, Eppendorf AG, Hamburg, Germany), nitrate nitrogen (NO3-N, DIN 38 405 D9, EPOS ANALYZER 5060, Eppendorf AG, Hamburg, Germany), and E. coli (Colilert-18 Quanti-Tray™, IDEXX Laboratories Inc., Westbrook, ME, USA). Inflow and outflow were measured with a magnet inductive flow meter (Promag 10, Endress+Hauser Messtechnik GmbH+Co. KG, Weilam Rhein, Baden-Württemberg, Germany) and a tipping counter, respectively.
2.3. Data Processing
Influent and effluent concentration data was screened for outliers. Outliers were defined as data related to infrastructure malfunctions and/or sampling errors, and were identified using time series plots of the corresponding water quality parameters. Detection limits for CBOD
5, NH
4-N and NO
3-N were 0.3, 0.03, and 0.02 mg·L
−1 respectively. For data processing, results reported as below detection limit were replaced with the value of the corresponding detection limit. This approach, if anything, slightly underestimates treatment performance of the system. Missing values which were a result of the quasi-weekly sampling schedule and/or due to infrastructure malfunctions were not considered as problematic as only simple descriptive statistics and time series plots were applied for the data analysis. Information about data below detection limit and number of outliers can be reviewed in
Table S1. The regression analysis of the air flow measurement data was done in the statistic environment
R version 3.1.2 [
20] using the package segmented [
21].
3. Results
3.1. Wind Speed Distribution at Experimental Site
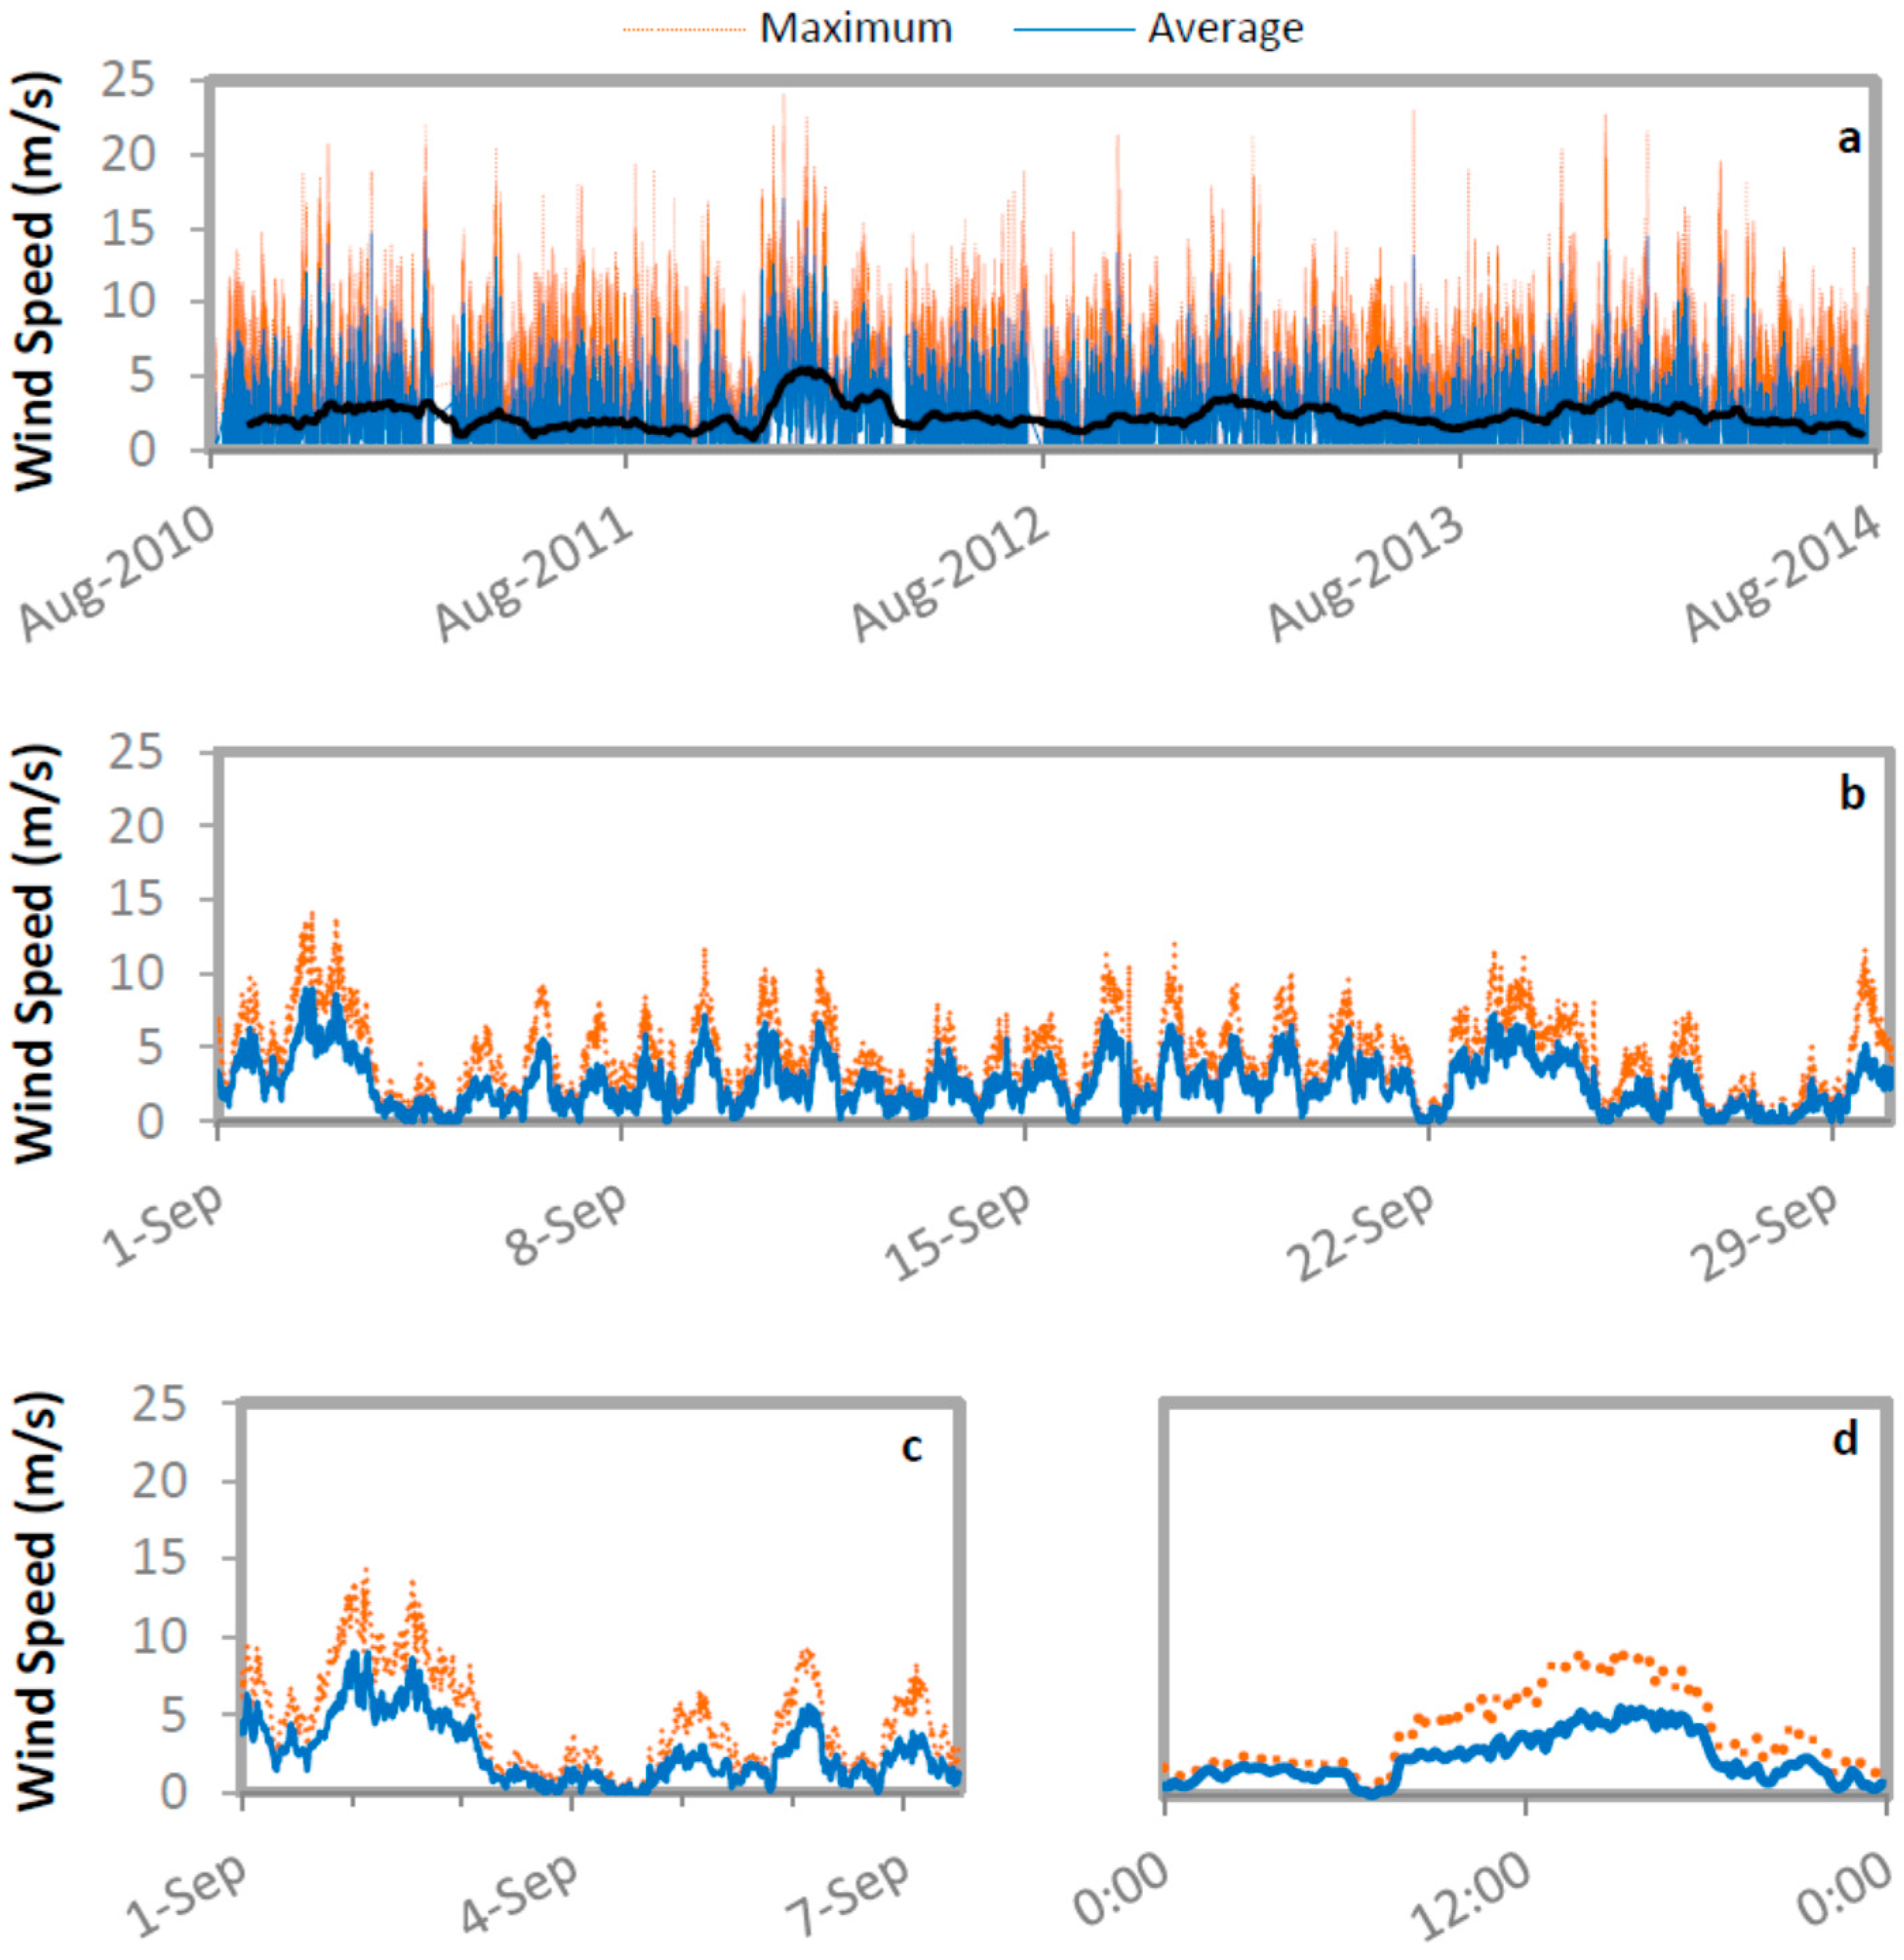
On a yearly basis, the average wind speed varied from 0 to 7 m·s
−1 with an overall mean of around 3 m·s
−1 and maximum values in the range of 8–15 m·s
−1. The wind speed time series exhibits slightly lower average values during summer compared to winter seasons (
Figure 2a).
Figure 2b shows the wind speed distribution during September 2013. This monthly pattern shows a constant wind speed fluctuation with a mean of 4 m·s
−1 and fluctuations between 0 and 10 m·s
−1. A divergence from this pattern can be identified in the first and last week of the presented month.
Figure 2b shows that the speed and duration of the wind differs greatly from one day to another. This is also observed in the hourly wind data shown in
Figure 2d. Overall, most wind occurs during the daytime. In general, the distribution of wind speed at the site can be termed as highly variable, containing maximum values of 20 m·s
−1; however, the long-term average wind speed is quite low. The strongest fluctuations in wind speed were observed on a daily and hourly basis.
3.2. Air Flow Measurement
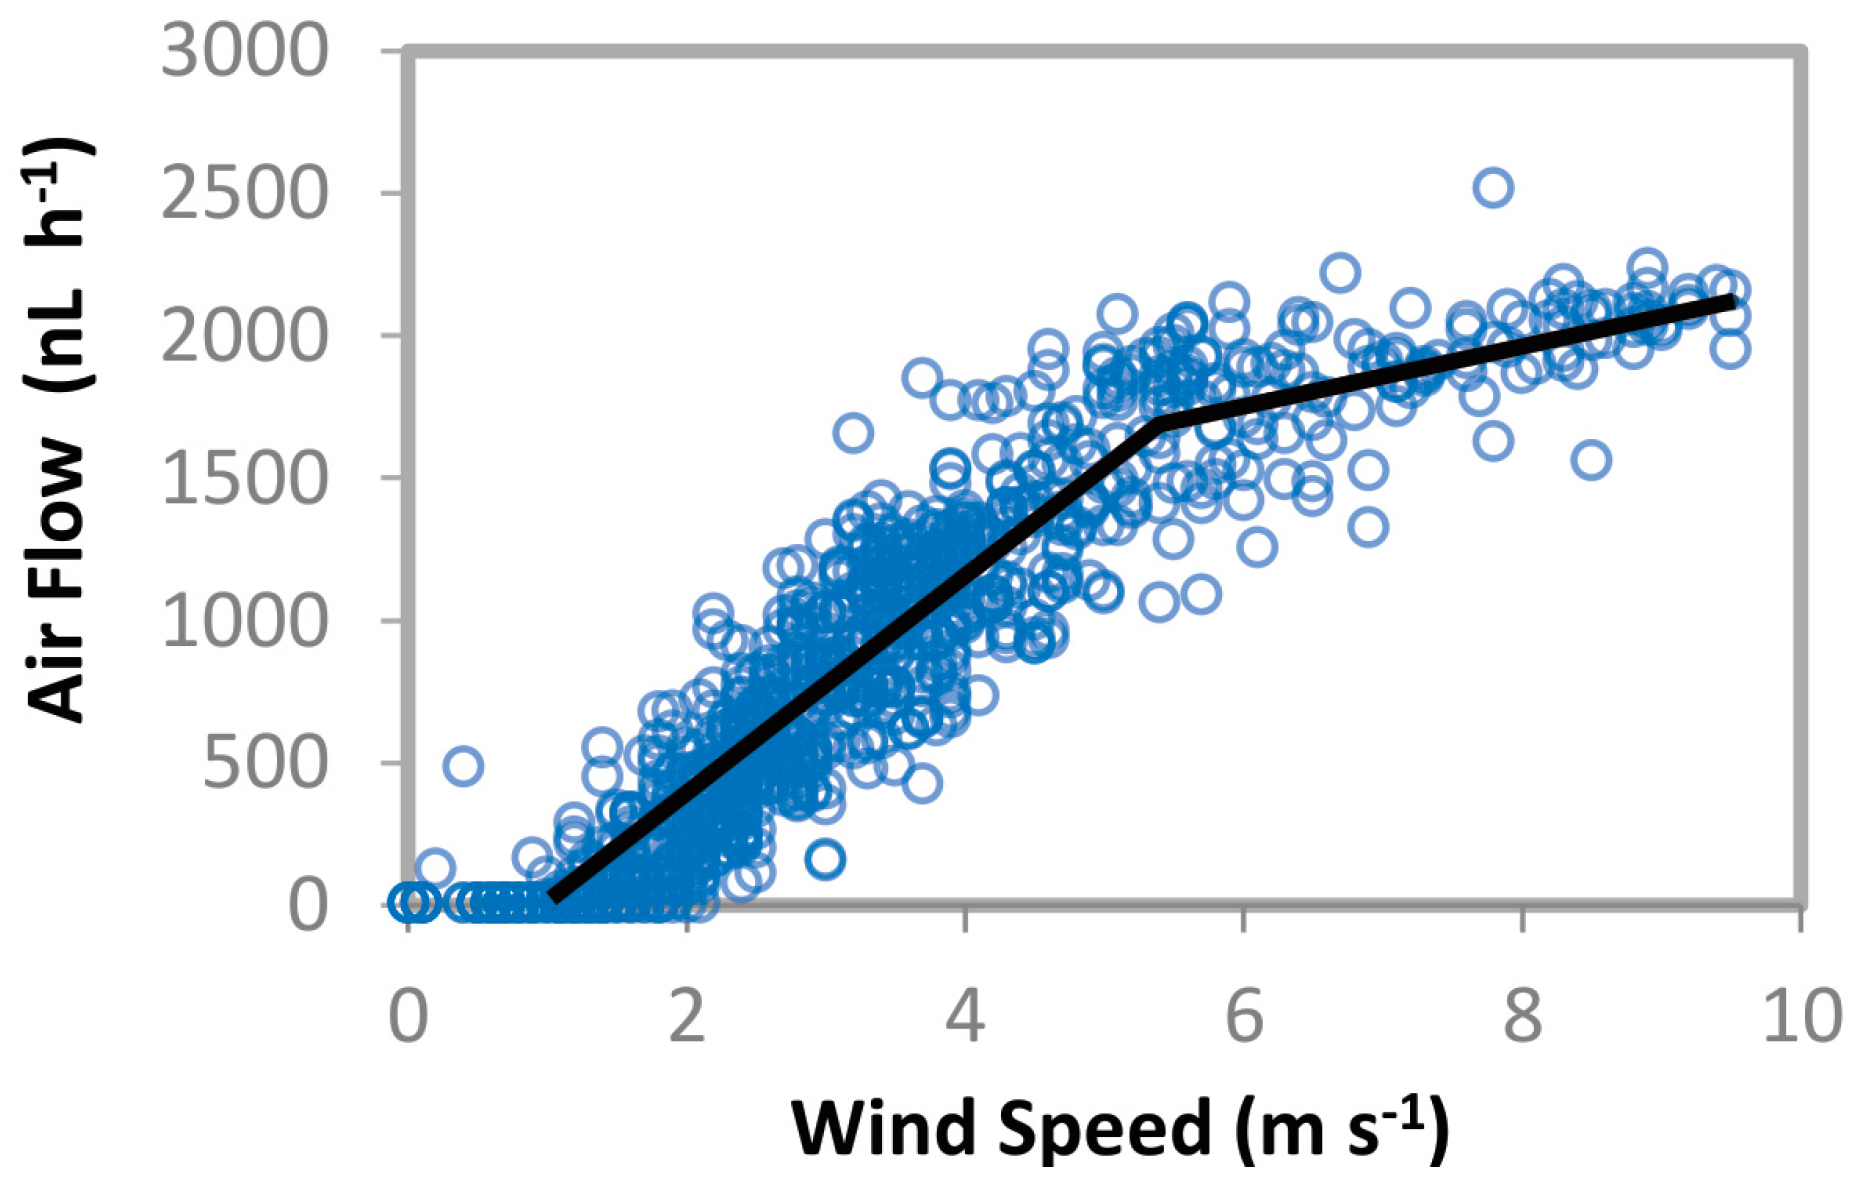
The air flow generated by the wind-driven piston pump and the wind speed are positively correlated. This correlation shows a breakpoint at a wind speed of around 5 m·s
−1. The rate of increase of air flow over wind speed declines with wind speeds greater than 5 m·s
−1, which might be caused by a stall effect on the rotor blades. A stall effect is a common phenomenon in fluid dynamics of wind rotor blades [
22]; it describes the demolition of an air flow on a wing above a certain threshold wind speed. A segmented regression with two linear parts was fit to the data; the breakpoint was identified at a wind speed of approximately 5.4 m·s
−1 as indicated in
Figure 3. The regression line in
Figure 3 also shows that a minimum wind speed is required in order to produce any significant air flow. The maximum measured air flow was approximately 2200 NL·h
−1 at a wind speed of 9.5 m·s
−1. Remembering that the wind speed at the site fluctuated from 0 to 7 m·s
−1 on average, a range of airflows from 1000 to 1800 NL·h
−1 can be expected if the back pressure of the aeration system is neglected. Unfortunately, the aeration system does exert a back pressure, which is a result of frictional losses and the hydrostatic pressure of the water level. This implies a reduction in actual air flow delivered to the wetland. It also means an effective increase of the threshold wind speed required to initiate a significant air flow into the wetland. Boog [
17] estimated that after considering these losses, the air volume reaching a small-scale aerated wetland is approximately 50% of the maximum value (listed, for example, on the manufacturer specification sheet). Considering the pump specifications used in Boog [
17], the reported flow loss would correspond to a back pressure of the aeration system (including the hydrostatic pressure of the water column) of approximately 180 mbar. These losses are only further exacerbated for a wind-driven air pump.
Air flow by the electric aeration system during phase one was not measured directly but can be inferred from Boog [
17], who measured the air flow rate of two electric air pumps of the same type as in this study, in a planted replicate wetland at the same site as in this study to approximately 1000 NL·h
−1 each. This translates to an estimate of 2000 NL·h
−1 of air flow generated by electric aeration during phase one.
3.3. Treatment Performance of the Experimental System
The influent wastewater exhibits typical characteristics of primary settled domestic wastewater, including a low redox potential as well as low dissolved oxygen and nitrate nitrogen content, and high concentrations of organic carbon, ammonia nitrogen, and the pathogen indicator organism
E. coli (
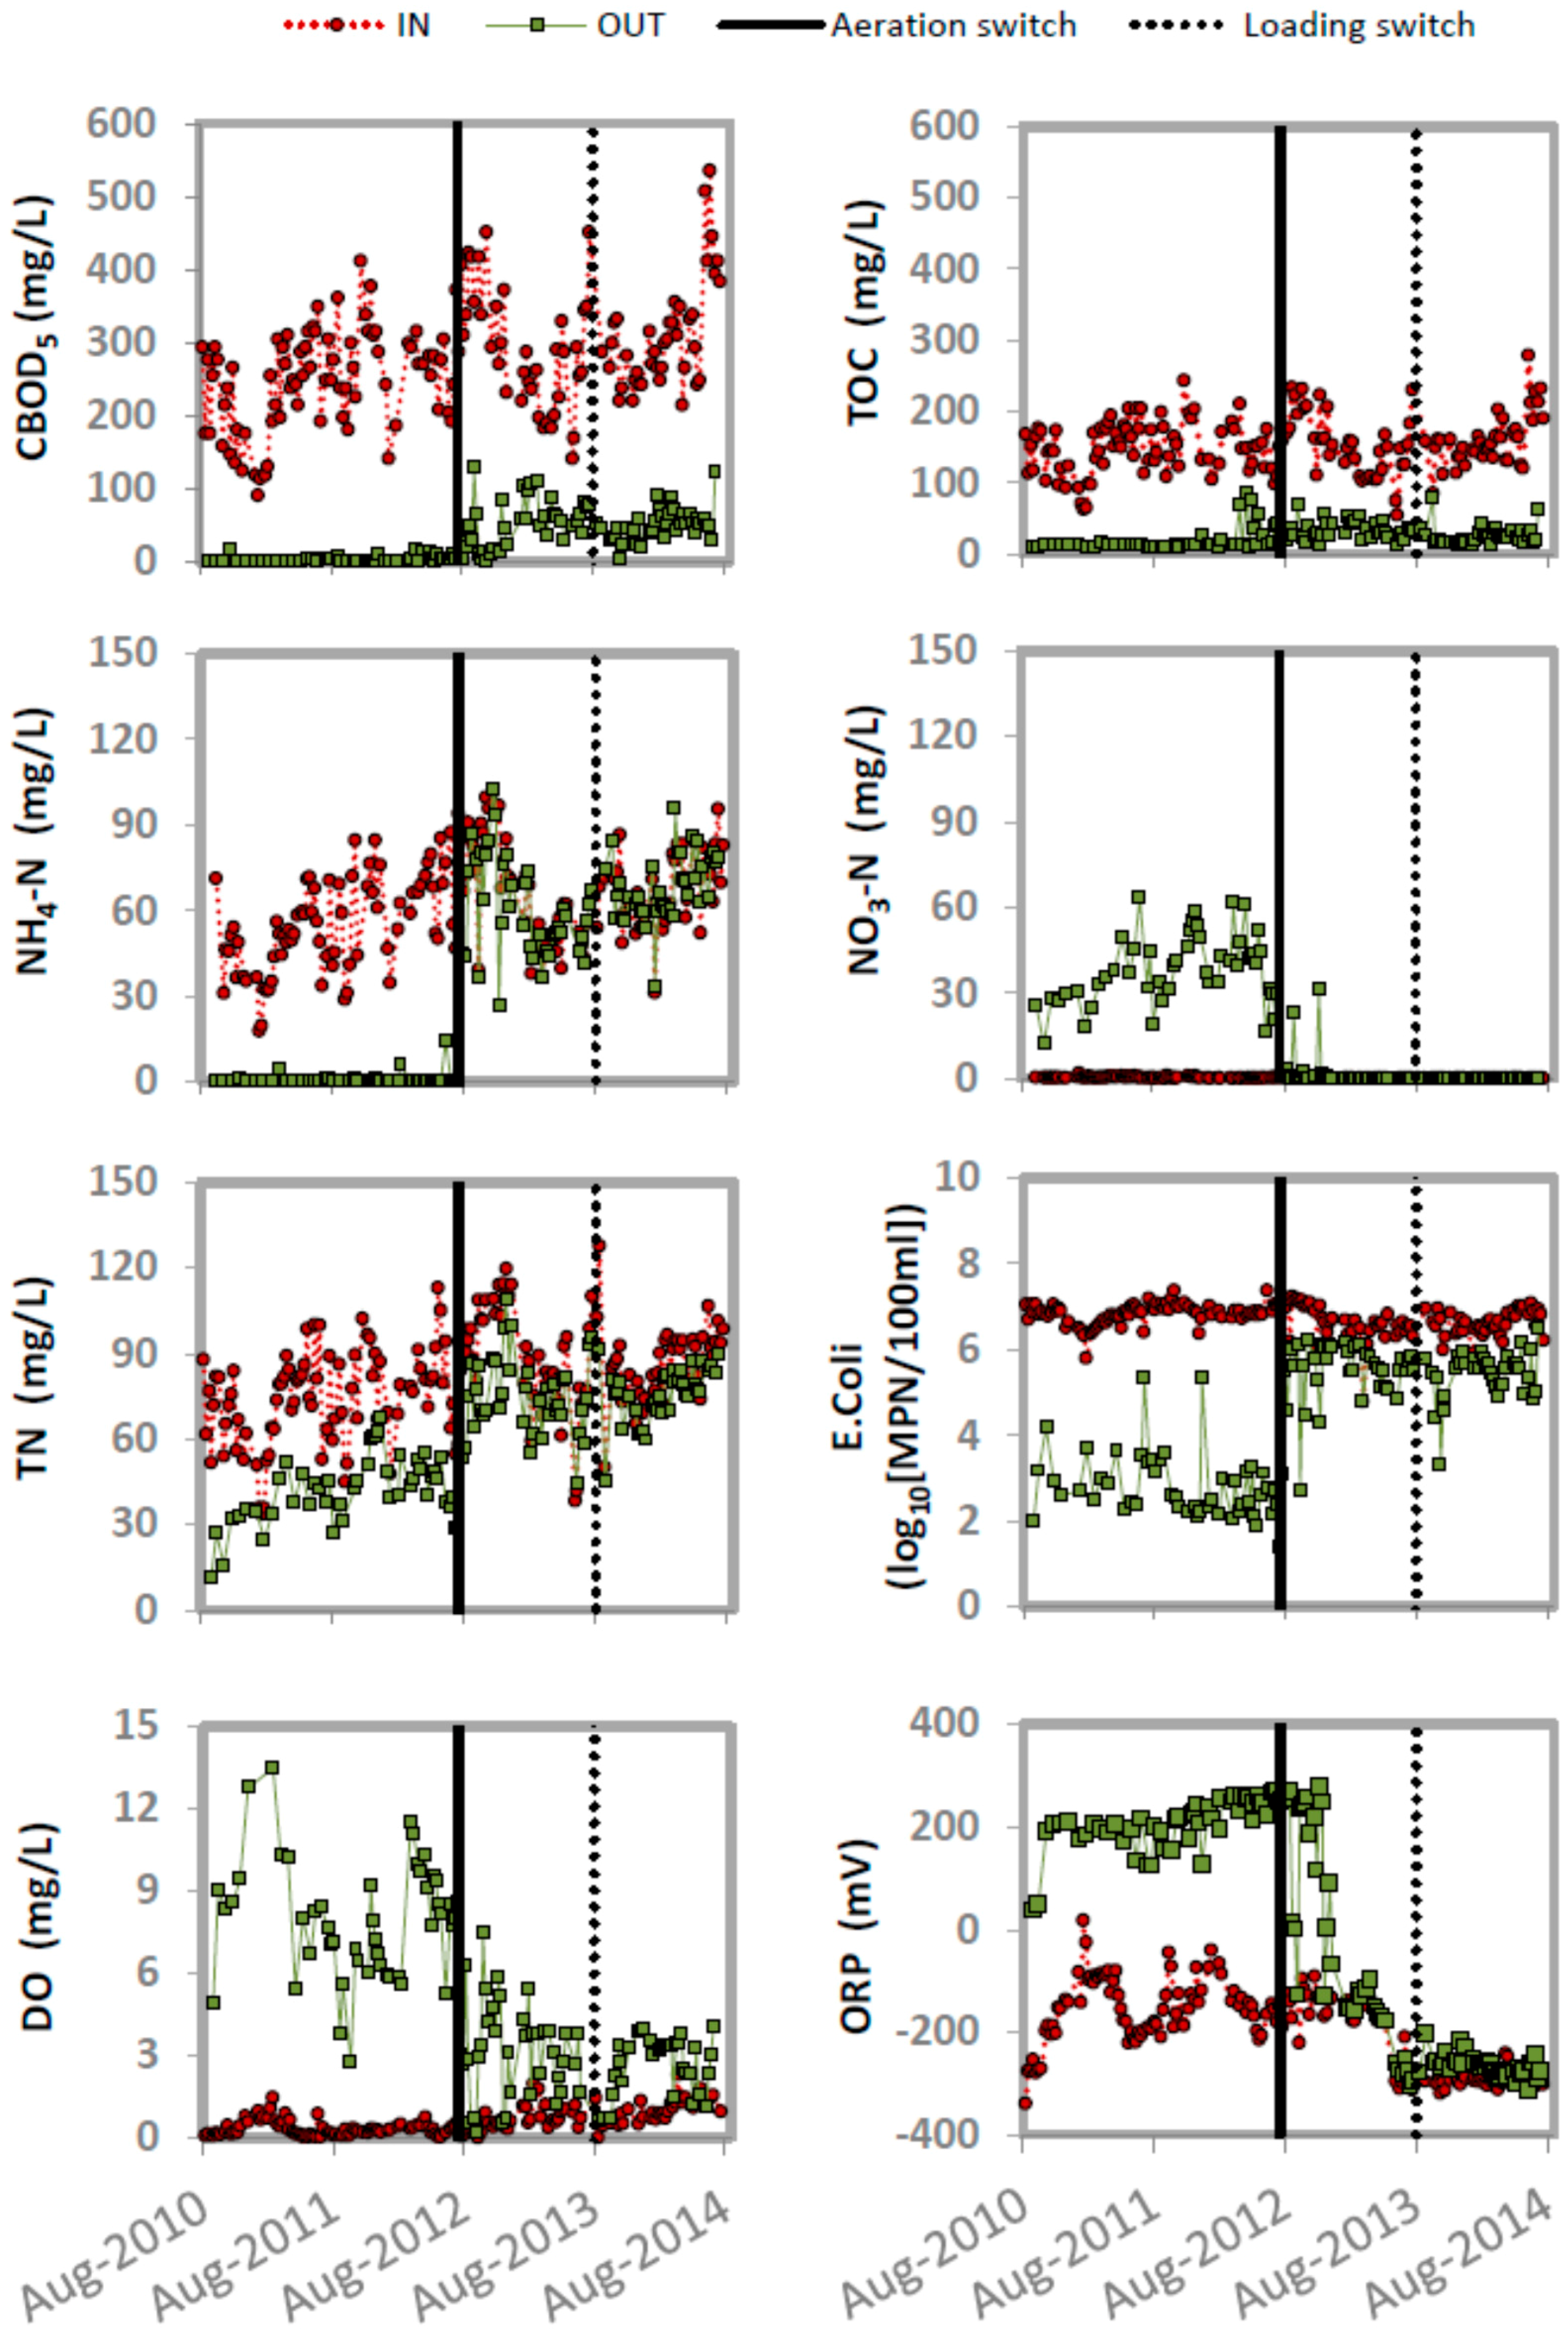
Table 1). Referring to the time series plots in
Figure 4, it can be seen that the water quality of the influent fluctuates over time. CBOD
5, TOC,
E. coli, and DO concentrations oscillate around a stable central tendency over the period of record. A slight increase in total nitrogen and ammonia nitrogen is visible between 2010 and 2013. In 2013, an additional chamber was installed into the septic tank in order to provide a longer retention time during primary treatment.
During the period from August 2010 to August 2012, the wetland system was equipped with electric aeration pumps that ran 24 h·d
−1. During this time, the wetland consistently produced a high-quality effluent (low carbon, complete nitrification). This is reflected in mean outflow levels of 3.1 mg·L
−1 of CBOD
5, 12.8 mg·L
−1 TOC, 43.2 mg·L
−1 TN, and 0.1 mg·L
−1 NH
4-N, as well as 8.0 mg·L
−1 DO, 38.7 mg·L
−1 NO
3-N, and a redox potential of 211.7 mV. Additionally, the wetland eliminated approximately four orders of magnitude of
E. coli, down to an average effluent concentration of 2.8 log
10(MPN 100 mL
−1). Total nitrogen concentration removal was approximately 53%—this means that denitrification may have taken place despite the fact of continuous aeration in space and time. Boog [
12] and Foladori [
8] report similar findings. It is quite likely that simultaneous nitrification–denitrification induced by non-uniform oxygen distribution, non-aerated micro zones, and/or biofilm layering took place. The probability of a potential volatilization of ammonia as a contribution to TN removal is quite low owing to constant effluent pH levels of approximately 7. These results are in agreement with other studies such as Boog [
17], Headley et al. [
3], Labella et al. [
1], and Nivala et al. [
23], which report a similar treatment performance for carbon, nitrogen, and pathogen removal in aerated treatment wetlands.
In August 2012, the electrical air pump was replaced by the wind-driven air pump.
Figure 4 shows the change in effluent water quality after installation of the wind-powered pump. Nitrification ceased, and CBOD
5, TOC, and
E. coli effluent concentrations increased. Effluent dissolved oxygen concentrations dropped to approximately 3 mg·L
−1; the remaining DO could be a result of the effluent sample collection. Effluent samples were taken from inside the control building, rather than directly from the wetland. A possible reaeration while passing from the wetland effluent pipe to the sampling location may have influenced the dissolved oxygen concentration in the effluent.
The change in treatment performance was rather rapid for TN, NH4-N, NO3-N, and E. coli. On the contrary, the decreased performance for CBOD5 and TOC, as well as the drop in redox potential and dissolved oxygen concentrations, occurred more slowly. It is interesting that the transition period of CBOD5, ORP, DO, and redox potential is characterized by high fluctuations. A possible reason for this may be that the wind-driven air pump generated an unsteady supply of air during the first two months of operation. This could have served at least for a temporal partial removal of organic carbon (nitrification was probably inhibited due to faster growth of heterotrophic organisms in oxygen-limited environments). As time passed, the efficiency of the wind-driven air pump may have changed, resulting in a further decline in treatment performance. The aeration lines may have experienced accumulation of sludge which in turn could have increased the counter pressure, further hindering aeration.
The treatment performance did not recover during the rest of the time the wind-driven air pump was in operation. In August 2013, after a year of less than optimal results, the hydraulic loading rate was reduced by 50%. Unfortunately, treatment performance did not improve. The water quality data indicates that the decrease in treatment performance was caused by a lack of oxygen, pointing to problems with implementation and/or operation of the wind-powered air pump.
4. Discussion
By switching from electrical to wind-driven aeration, treatment performance of the aerated wetland decreased quickly. Treatment performance became oxygen-limited. It is possible that the wind-driven air pump temporarily provided aeration to the wetland for a short period of time, but it is clear that over the longer term the efficiency of the aeration system was poor. The aeration system of wetlands operating with an electrical air pump can be visually checked by digging a hole into the gravel, exposing the water level, and waiting to observe air bubbles rising to the surface. During the two years of wind-powered aeration, very few (if any) air bubbles could be observed coming from the wind-powered air pump, even on a windy day.
The counter-pressure in the aerated wetland is already quite high and reduced the air flow by approximately 50% under continuous electric aeration, which corresponds to a back pressure of approximately 180 mbar. The orifices of the aeration lines do not prevent water entrance from outside if the counter pressure is not compensated. In the end, the wind-powered air pump, which was unsteady as a result of fluctuating wind speeds, may have not provided enough pressure to clear this water out of the aeration lines. Additionally, the decreased treatment performance might have resulted in an accumulation of sludge in the aeration lines which could have increased the necessary air pressure to clean the lines and in turn further inhibited aeration, resulting in an unfavorable feedback loop. This may especially be a problem during long periods without wind. Under the absence of any counter-pressure, as during the air flow measurement, the wind power system was capable of producing a significant air flow. Unfortunately, it proved not to be powerful enough with respect to the fact of the counter-pressure from the aeration system. It also has to be taken into account that the location of the experimental site Langenreichenbach in Germany is not a location known to be especially windy.
When aiming to use a wind power station for wetland aeration, the distribution of wind speed at the site of interest must be examined to determine whether or not the site is suitable for such a device. Special attention should focus on the minimum wind speed during a time frame which would allow sufficient aeration for removal of organic carbon and ammonia nitrogen. Sites having periods without any significant wind on a daily basis are not particularly suitable for wind-driven aeration.
The wind-powered air pump technology itself is of great importance. The pump capacity curve of a certain wind-driven air pump with respect to counter-pressure and wind speed should be known or examined in advance to a potential application. If an air pump cannot overcome the approximately 180 mbar of combined pressure losses in the aeration lines including the hydrostatic pressure of the water column, air will not be delivered to the wetland. The further increase of this pressure loss due to water entrance during phases without air flow as a result of wind speed below a minimum level might be prevented by using a non-return valve in the aeration lines. A piston pump is probably a decent choice from the perspective of air flow generation. In this study, the wind power station which drove the piston pump had a conventional six-blade rotor with a horizontal collar. When conducting an experiment under similar wind speed conditions, it might by more suitable to use a Savonius rotor, which (due to its vertical collar construction) may be more effective at low wind speeds and will function regardless of any changes in wind direction. Further adaptations of wind-powered equipment to wetland aeration should result in performance improvements compared to the current study. It might also be favorable to use a wind power system with a higher collar height, such as 15 m, to catch the wind well-above obstacles such as buildings and trees.
The potential accumulation of sludge in the aeration lines should also be considered. In this study, the hydraulic loading rate of the wetland was not changed when moving from the 24-h electrical air pump to the intermittently operating wind-powered air pump. Taking this into account, it would be advisable to start with a lower loading rate to reduce the inflow oxygen demand. At the same time, this might be favorable to increase the hydraulic retention time to span it beyond the mean duration of non-windy conditions. Finally, such technology may be better suited as a polishing (tertiary) treatment step as opposed to secondary treatment.
Using small-scale wind power stations to generate and store electrical energy for the supply of electric air blowers might be another interesting concept for wetland aeration. This concept, including a battery system for energy storage, could be able to overcome the problem of longer periods without a minimum wind speed necessary to operate the wind power station. Here, the challenge is to find a wind power station which, at the same time, is able to provide a certain amount of electrical energy to supply the electric air pumps and to store excess energy in the battery. The battery will have to have a storage capacity which allows the supply of a certain amount of electrical energy during a maximum time period without the minimum wind speed. The battery should also be able to recharge during a minimum time period with the minimum wind speed. The technical realization of this concept may have to be extended to a voltage transformer, as commercially available equipment of a wind power station, battery, and air pump have different requirements of electrical parameters such as in- and output voltage and current. So far, the use of a wind power station to generate electrical energy for driving conventional air pumps is an interesting, but more complex, aeration concept compared to a mechanical wind-driven air pump.
5. Conclusions
This study reports the first application of a wind-driven air pump for the aeration of a treatment wetland treating domestic wastewater. After switching from electrical to wind-driven aeration, the treatment performance of the pilot system deteriorated quickly to a level of a passive horizontal subsurface flow wetland. Reducing the hydraulic loading rate by 50% did not improve treatment performance. Water quality results indicate that the wind-driven air pump did not have the capacity to provide the required amount of oxygen equivalent to continuous aeration under the experimental conditions. Yet under different conditions and with adaptations of the wind-powered equipment to wetland aeration systems, the principle may succeed. In general, a potential wind-driven air pump would have to compensate a pressure loss of approximately 180 mbar at a minimum wind speed and should be equipped with a non-return valve.
Another potential concept could make use of small-scale wind-power devices to generate electrical energy to supply conventional electrical air pumps. This option allows energy storage using batteries and may overcome the problem of no aeration during long periods without wind.
Further research in this context should focus on (1) prior characterization of the onsite wind speed distribution; (2) prior assessment of the potential for wind-driven air pumps to provide an air flow at a given wind speed and counter-pressure or the potential for a wind-power station to generate electricity at a certain level of wind speed and a battery with the capacity to store energy for a certain time period; and (3) considering trials with a lower hydraulic loading rate or for treating wastewater with a lower influent oxygen demand.
Acknowledgments
Johannes Boog acknowledges the Helmholtz Center for Environmental Research (Helmholtz Zentrum für Umweltforschung—UFZ) and the Helmholtz Interdisciplinary Graduate School for Environmental Research (HIGRADE) for additional funding and support. The authors gratefully express their gratitude to Katy Bernhard and Grit Weichert for their support and assistance in sample collection and analysis; and to Sybille Mothes, Carola Bönisch and Karsten Marien for analytical support. This work was supported in part by funding from the German Ministry of Education & Research (BMBF) within the context of the SMART-MOVE Project (Ref. 02WM1355).
Author Contributions
Christopher Sullivan, Scott Wallace, Thomas Aubron and Jaime Nivala conceived the idea. Johannes Boog, Christopher Sullivan, Thomas Aubron and Jaime Nivala designed the experiments and conducted the experiments. Johannes Boog and Jaime Nivala analyzed and synthesized the data. Johannes Boog, Jaime Nivala, Manfred van Afferden and Roland A. Müller wrote the paper.
Conflicts of Interest
The authors declare no conflict of interest.
References
- Labella, A.; Caniani, D.; Hughes-Riley, T.; Morris, R.H.; Newton, M.I.; Hawes, P.; Puigagut, J.; García, J.; Uggetti, E. Assessing the economic suitability of aeration and the influence of bed heating on constructed wetlands treatment efficiency and life-span. Ecol. Eng. 2015, 83, 184–190. [Google Scholar] [CrossRef]
- Nivala, J.; Hoos, M.B.; Cross, C.; Wallace, S.; Parkin, G. Treatment of landfill leachate using an aerated, horizontal subsurface-flow constructed wetland. Sci. Total Environ. 2007, 380, 19–27. [Google Scholar] [CrossRef] [PubMed]
- Headley, T.; Nivala, J.; Kassa, K.; Olsson, L.; Wallace, S.; Brix, H.; van Afferden, M.; Müller, R. Escherichia coli removal and internal dynamics in subsurface flow ecotechnologies: Effects of design and plants. Ecol. Eng. 2013, 61, 564–574. [Google Scholar] [CrossRef]
- Wallace, S.; Kadlec, R. BTEX degradation in a cold-climate wetland system. Water Sci. Technol. 2005, 51, 165–171. [Google Scholar] [PubMed]
- Wu, S.; Wallace, S.; Brix, H.; Kuschk, P.; Kirui, W.K.; Masi, F.; Dong, R. Treatment of industrial effluents in constructed wetlands: Challenges, operational strategies and overall performance. Environ. Pollut. 2015, 201, 107–120. [Google Scholar] [CrossRef] [PubMed]
- Butterworth, E.; Dotro, G.; Jones, M.; Richards, A.; Onunkwo, P.; Narroway, Y.; Jefferson, B. Effect of artificial aeration on tertiary nitrification in a full-scale subsurface horizontal flow constructed wetland. Ecol. Eng. 2013, 54, 236–244. [Google Scholar] [CrossRef]
- Fan, J.; Liang, S.; Zhang, B.; Zhang, J. Enhanced organics and nitrogen removal in batch-operated vertical flow constructed wetlands by combination of intermittent aeration and step feeding strategy. Environ. Sci. Pollut. Res. 2012, 20, 2448–2455. [Google Scholar] [CrossRef] [PubMed]
- Foladori, P.; Ruaben, J.; Ortigara, A.R. Recirculation or artificial aeration in vertical flow constructed wetlands: A comparative study for treating high load wastewater. Bioresour. Technol. 2013, 149, 398–405. [Google Scholar] [CrossRef] [PubMed]
- Ouellet-Plamondon, C.; Chazarenc, F.; Comeau, Y.; Brisson, J. Artificial aeration to increase pollutant removal efficiency of constructed wetlands in cold climate. Ecol. Eng. 2006, 27, 258–264. [Google Scholar] [CrossRef]
- Kadlec, R.H.; Wallace, S.D. Treatment Wetlands, 2nd ed.; CRC Press: Boca Raton, FL, USA, 2009. [Google Scholar]
- Austin, D.; Nivala, J. Energy requirements for nitrification and biological nitrogen removal in engineered wetlands. Ecol. Eng. 2009, 35, 184–192. [Google Scholar] [CrossRef]
- Boog, J.; Nivala, J.; Aubron, T.; Wallace, S.; van Afferden, M.; Müller, R.A. Hydraulic characterization and optimization of total nitrogen removal in an aerated vertical subsurface flow treatment wetland. Bioresour. Technol. 2014, 162, 166–174. [Google Scholar] [CrossRef] [PubMed]
- Uggetti, E.; Hughes-Riley, T.; Morris, R.H.; Newton, M.I.; Trabi, C.L.; Hawes, P.; Puigagut, J.; García, J. Intermittent aeration to improve wastewater treatment efficiency in pilot-scale constructed wetland. Sci. Total Environ. 2016, 559, 212–217. [Google Scholar] [CrossRef] [PubMed]
- Wu, H.; Fan, J.; Zhang, J.; Ngo, H.H.; Guo, W.; Liang, S.; Lv, J.; Lu, S.; Wu, W.; Wu, S. Intensified organics and nitrogen removal in the intermittent-aerated constructed wetland using a novel sludge-ceramsite as substrate. Bioresour. Technol. 2016, 210, 101–107. [Google Scholar] [CrossRef] [PubMed]
- Aubron, R.T.; Boog, J.; Nivala, J.; van Afferden, M.; Müller, R.A. Zoned aeration in a horizontal subsurface flow wetland. In Proceedings of the 6th International Symposium on Wetland Pollutant Dynamics and Control, York, UK, 13–18 September 2015.
- Qin, G.; Liu, C.C.K.; Richman, N.H.; Moncur, J.E.T. Aquaculture wastewater treatment and reuse by wind-driven reverse osmosis membrane technology: A pilot study on Coconut Island, Hawaii. Aquac. Eng. 2005, 32, 365–378. [Google Scholar] [CrossRef]
- Boog, J. Effect of the Aeration Scheme on the Treatment Performance of Intensified Treatment Wetland Systems; Institut für Thermische-, Umwelt- und Naturstoffverfahrenstechnik: Freiberg, Germany, 2013. [Google Scholar]
- Nivala, J.; Headley, T.; Wallace, S.; Bernhard, K.; Brix, H.; van Afferden, M.; Müller, R.A. Comparative analysis of constructed wetlands: The design and construction of the ecotechnology research facility in Langenreichenbach, Germany. Plants Constr. Restor. Created Wetl. 2013, 61, 527–543. [Google Scholar] [CrossRef]
- Wallace, S.D. System for Removing Pollutants from Water. U.S. Patent 6,200,469 B1, 13 March 2001. [Google Scholar]
- Team, R.C. R: A Language and Environment for Statistical Computing; R Foundation for Statistical Computing: Vienna, Austria, 2014. [Google Scholar]
- Vito, M.; Muggeo, R. Segmented: An R Package to Fit Regression Models with Broken-Line Relationships. R News 2008, 8, 20–25. [Google Scholar]
- Kaltschmidt, M.; Streicher, W.; Wiese, A. Erneuerbare Energien, 5th ed.; Springer: Berlin/Heidelberg, Germany, 2013; p. 931. [Google Scholar]
- Nivala, J.; Wallace, S.; Headley, T.; Kassa, K.; Brix, H.; van Afferden, M.; Müller, R. Oxygen transfer and consumption in subsurface flow treatment wetlands. Plants Constr. Restor. Created Wetl. 2013, 61, 544–554. [Google Scholar] [CrossRef]
© 2016 by the authors; licensee MDPI, Basel, Switzerland. This article is an open access article distributed under the terms and conditions of the Creative Commons Attribution (CC-BY) license (http://creativecommons.org/licenses/by/4.0/).


